
Abstract
In this study, the phase development in the cement system α-TCP–OCP with phosphoric acid as a setting liquid was studied. The most promising formulation of α-TCP (60 wt%) and OCP (40 wt%) is proposed. This cement has the following characteristics: setting time 10 min, pH = 6.7, the compressive strength about 30 MPa, and high dissolution rate in an isotonic solution; the final wt% composition of α-TCP/DCPD/HA/OCP equals 27/38/20/15. Energy dispersive X-ray diffraction techniques were used for in situ monitoring of the processes taking place in the cement in real time.
Keywords
INTRODUCTION
Calcium phosphate cements (CPC) are of great interest as biomaterials for bone replacement because they are capable of rapid setting to a hard mass, are highly biocompatible, and they get gradually replaced by new bone in vivo [1]. Since the development of the first CPC consisting of tetracalcium phosphate (TTCP) and dicalcium phosphate anhydrous (DCPA) or dicalcium phosphate dihydrate (DCPD) in 1987 by Brown and Chow [2], a number of different combinations of calcium phosphate-containing compounds have been investigated [3,4].
Among them, octacalcium phosphate (OCP, Ca8H2(PO4)6·5H2O) is considered to be of particular interest [5–8], since it has been reported to be a direct precursor phase during the biomineralization process of bones and teeth [9–11]. The biocompatibility and the osteoconductive nature of synthetic OCP are widely acknowledged [12,13]. Furthermore, recent studies have shown that OCP enhances a new bone formation, accompanied by its conversion into hydroxyapatite (HA) products and its own biodegradation by the osteoclast cells activities [14–16].
However, up to now, only several OCP-based cements have been formulated [8, 17–19]. Generally, two distinctly different methods are used for their preparation. In particular, in the first work [8] on the development of OCP-based cement, it has been reported that mixtures of α-tricalcium phosphate (α-TCP) and DCPD with water lead to the formation of OCP as reaction product. On the contrary, in a very recent work [19] devoted to OCP-based cement it has been shown that the α-TCP and DCPA reaction products were HA or OCP and HA mixtures, depending, respectively, on whether water or a phosphate solution is used as the liquid phase. Besides, α-TCP and DCPA remained partially unreacted in the amount of about 50 wt%, when water, and of about 55 wt%, when 0.5 mol/L phosphate solution, respectively, were used as the cement liquid phase.
Another attempt to obtain the OCP phase in the final product was based on its use as starting reagent. It is known that the transition of OCP into HA is thermodynamically favored and proceeds spontaneously and irreversibly once initiated [20,21]. This study [17] has been focused on the conversion of OCP in the mixture with different calcium phosphate-containing compounds, namely, TTCP, Ca(OH)2 and monocalcium phosphate monohydrate in CPC, and the reliable evidence for the OCP presence is that very small amounts in the reaction product were obtained. In a similar work [18], the OCP setting with 69 wt% of α-TCP with sodium hydrogen phosphate buffer (pH = 7.4) was used. This mixture transformed into DCPD during 1 day after mixing in simulated body fluid, followed by transformation into the OCP and HA on 6 weeks after mixing.
This study is focused on the second approach with the aim to study, deeply, the kinetics of phase development during the setting reaction of calcium phosphate bone cement based on α-TCP and OCP compounds. The setting and hardening reactions were analyzed both ex and in situ, applying the nonconventional energy dispersive X-ray diffraction technique (EDXRD). The conventional Fourier transform infrared (FT-IR) spectroscopy and scanning electron microscopy (SEM) morphological studies were carried out. Solubility and compressive strength properties of the obtained cements are reported.
MATERIALS AND METHODS
Cement Reagents
For the preparation of α-TCP powder (α-Ca3(PO4)2), the initial amorphous phosphate has been obtained as the precipitation product according to the following reaction:
Analytical grade starting reagents, calcium nitrate tetrahydrate, ammonia hydrogen phosphate, and ammonium hydrate 25% water solution (Merck, Germany), were used. The solution pH was adjusted to 7 by adding solutions of acetic acid and ammonia. The solution with the precipitate was aged for 24 h, followed by filtering with a Buchner cone filter. After the calcinations of the precipitate in an air atmosphere furnace at 1300°C for 1 h, the monophase α-TCP powder was obtained, as confirmed by XRD analysis (diffractometer Shimadzu XRD-6000, Cu-Kα radiation, JCPDS database (No. 9-0348)).
OCP was obtained according to the wet precipitation method [22]:

Chemically pure calcium acetate and sodium acid phosphate (Merck, Germany) were used to obtain OCP. Calcium acetate solution (0.04 mol/L, 250 mL) and sodium acid phosphate solution (0.04 mol/L, 250 mL) were heated at 90°C and their pH was 5.5. The sodium phosphate solution was added dropwise to the calcium acetate solution and stirred during the precipitation. After 1 h, the precipitates were filtered and dried at room temperature. Phase compositions of the obtained substances were confirmed by a conventional XRD analysis (diffractometer Shimadzu XRD-6000, Cu-Kα radiation, JCPDS database (No. 26-1056)).
As hardening liquid, 3 M phosphoric acid (Sigma, UK), containing 50 mM sodium citrate (Sigma, UK) solution, was used [23,24].
Preparation of CPC Specimens
CPC powders and hardening liquid were mixed in a powder-to-liquid ratio P/L = 2:1 (0.6 g of CPC powder and 0.3 mL of hardening liquid) in a glass mortar for 60 s. The obtained pastes were used for further analyses.
Setting Time Measurements
The setting times of the cement pastes were evaluated using the tip (1 mm diameter) of a Vicat needle with a 400 g load (according to ISO standard 1566) to make a perceptible circular indentation on the surface of the cements.
pH Measurements
The pH measurements were performed as follows: samples (1 g) of crushed cement were placed into a 50 mL volume flask, and distilled water was added up to the 50-mL volume. The pH value was measured after 1 h of soaking time using a Hanna Instruments HI 8314 pH meter.
X-Ray Analysis
Phase compositions of the obtained substances were analyzed by a conventional X-ray diffraction technique (Shimadzu XRD-6000 (Japan), Ni-filtered Cu-target, λ = 1.54183 Å). The proportion component (Xa) of crystalline phases was evaluated by the following equation [25]:

The following reflections were used for the calculation of each of the phases: α-TCP (1 1 1), DCPD (0 2 0), HA (2 1 1) and OCP (0 1 0). The estimated standard error was about ±1 wt%.
EDXRD Measurements
The EDXRD method was applied to follow, in real time, the structural modifications taking place upon cement hardening, by collecting sequences of diffraction patterns. The acquisition time of each pattern was set at 60 s, and the overall observation time was up to 75 h. The EDXRD measurements were performed by a noncommercial apparatus [26]. The energy spectrum of the primary beam is produced by a W-anode X-ray tube (supplied at 55 kV) and, after it is modulated by the interaction with the sample, the resulting diffracted radiation is analyzed by an ultra pure Ge single crystal solid-state detector.
A series of ex situ measurements were performed for the pristine cement powders and final cements at various scattering angles, in order to make a wide q-scan for individuating the q-region of interest. Several diffraction spectra were collected in order to find the best experimental conditions, that is, varying the primary beam energy (E), scattering angle (2θ), alignment, collimation slits aperture, etc. The best experimental conditions were found and fixed for the whole set of measurements: primary beam energy E = 55 keV and scattering angle 2θ = 8.2°. The optical path was defined by three square collimation slits, their aperture being 600 × 600 µm2. The q-range from 1.0 to 4.0 Å−1 was explored.
SEM Characterization
SEM apparatus (TESCAN VEGA II (Czech Republic), working in the secondary and backscattered electron modes, was used for morphological studies of the cements over 75 h of setting time. The resolution of the apparatus in vacuum conditions was about 4 nm.
FT-IR Spectroscopy Measurements
FT-IR spectroscopy analysis was carried out by means of a Jasco FT/IR 470 Plus interferometer (Italy), equipped with an IRTRON IRT-30 Infrared Microscope. The samples were placed on a KBr window, and the spectra were acquired in the transmittance mode in the 4000–550 cm−1 range, by executing 250 scans at 8 cm−1 resolution.
Compressive Strength Measurements
The compressive strength of cements was evaluated in accordance with the ISO standard 9917E. The prepared cylindrical samples (about 12 mm height and 6 mm diameter) were measured at different hardening times, lasting from 15 min up to 5 days (five samples for each point). Compression testing was carried out using an Instron 4082 (Bucks, UK) testing machine operating at a crosshead speed of 1 mm × min−1.
Solubility Test
The solubility of the cements was studied in a 0.1 M NaCl solution, modeling the extracellular body fluid, for 21 days at a constant liquid phase volume (closed system), which is a common procedure for studying biomaterials [27]. The 0.1 M NaCl solution was adjusted to pH = 7.4 by adding TRIS (Merck, Germany). The solid-to-liquid ratio was 0.5 g/100 mL. The calcium concentration in the liquid phase was measured using an Ekoniks-001 ionometer (Russia) with an ion-selective electrode.
RESULTS AND DISCUSSION
Optimization of the Cement
Characteristics of CPC cements as a function of composition.
A possible reaction of the α-TCP transformation is supposed to be as follows:

It should be noted that the DCPD formation could play a significant role in the presence of the partially unreacted OCP phase in the final reaction product. Recently, we reported [28] that in the OCP–DCPD system, the additional component (DCPD) influences significantly the structural behavior of HA, acting as the HA crystallization inhibition agent. The inhibitory mechanism was shown to arise not only from the well-documented ability of DCPD to inhibit calcium orthophosphate crystallization, but also due to a decrease in the α-TCP dissolution rate. Furthermore, the DCPD can subsequently hydrolyze into HA according to the reaction:

The partial transformation of OCP into HA via hydrolysis is a thermodynamically favorable reaction [29].

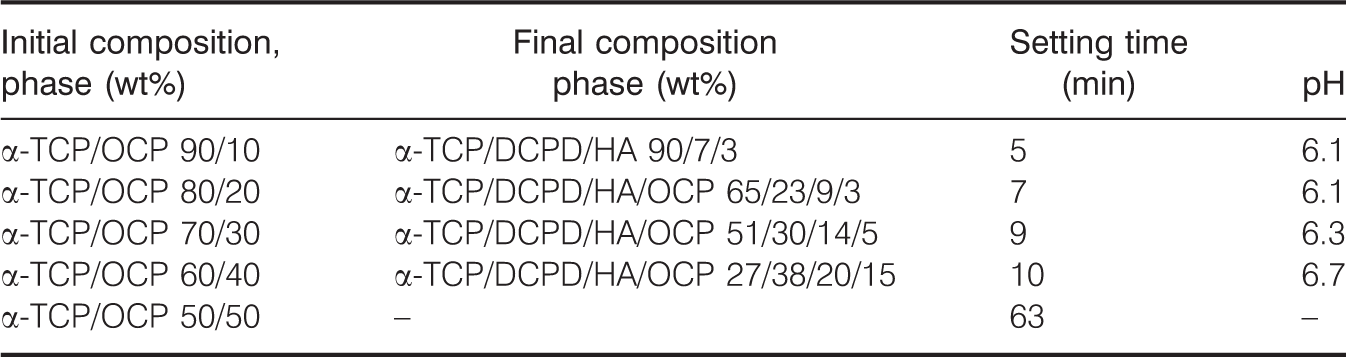
The setting reaction in the reported developed CPC formulations progressed quickly (3–10 min) (Table 1), whereas for the 50/50 α-TCP/OCP cement, the setting reaction time increased dramatically up to 63 min. This can be justified by a difference in solubility between OCP and HA increasing upon the OCP conversion: the reaction rate is decreased upon the consumption of Ca2+ and OH− ions (reaction (6)) [17]. The pH ratios of all investigated compositions was in the range from 6.1 to 6.9. On the basis of these preliminary tests for the second part of the experimental design, only the optimal 60/40 α-TCP/OCP composition was selected for further analysis.
In Situ EDXRD Measurements
In the EDXRD technique, the reciprocal space scan, necessary to reconstruct the diffraction pattern, that is, the scan of the scattering parameter q = a E sinυ (where q is the normalized momentum transfer magnitude, a a constant, E the energy of the incident X-ray beam, and 2υ the scattering angle), is carried out electronically. Although, in the Energy Dispersive (ED) mode, the q-resolution is lower, its main advantage over its conventional Angular Dispersive counterpart (Angle-dispersive X-ray diffraction, ADXRD) in performing X-ray diffraction experiments is that the geometric setup is kept fixed during the acquisition of the patterns, which simplifies the experimental geometry and prevents systematic angular errors, as well as possible misalignments. This feature, combined with a much faster data acquisition (the number of photons contained in the white component of the primary beam spectrum is about two orders of magnitude higher than the number of photons concentrated in the fluorescence lines), makes this technique particularly suitable for the in situ time-resolved measurements, allowing us to follow the real-time structural changes occurring on time scales varying from a few minutes up to several weeks.
In the case of EDXRD, the data analysis is more complicated than that of ADXRD [26]. Indeed, particular care must be devoted to the method for estimating the grain size from the ED diffraction patterns, because the Scherrer formula, which applies to the Angular Dispersive case only, must be suitably modified. The procedure, based on the Laue equations, is fully described elsewhere [30].
In situ real-time monitoring of the structural changes taking place in the cement system with the 60/40 α-TCP/OCP composition was carried out by the EDXRD, being much more suitable to follow the long-time processes than a common laboratory (Angular Dispersive) X-ray diffraction technique. The formation of new phases and possible intermediate products upon the cement pastes hardening process was followed. The hardening – crystallization process is generally described by a sigmoid increase of the grain size over time, the expected characteristic crystallization time being several hours [30]. For each cement sample, a sequence of diffraction patterns, collected as a function of the scattering parameter and of time (a 3D map) was obtained (Figure 1), and an accurate quantitative analysis was performed for each diffraction pattern. Together with phase transformations, amorphous-into-crystalline conversions, that is, the primary and secondary crystallization processes, were followed. The average grain size evolution, and the characteristic crystallization times for the phases of interest were deduced.
Sequence of EDXRD patterns, collected during hardening of the α-TCP–OCP cement paste. In the inset, a highlight of the patterns, collected after 10 min and after 75 h, is shown.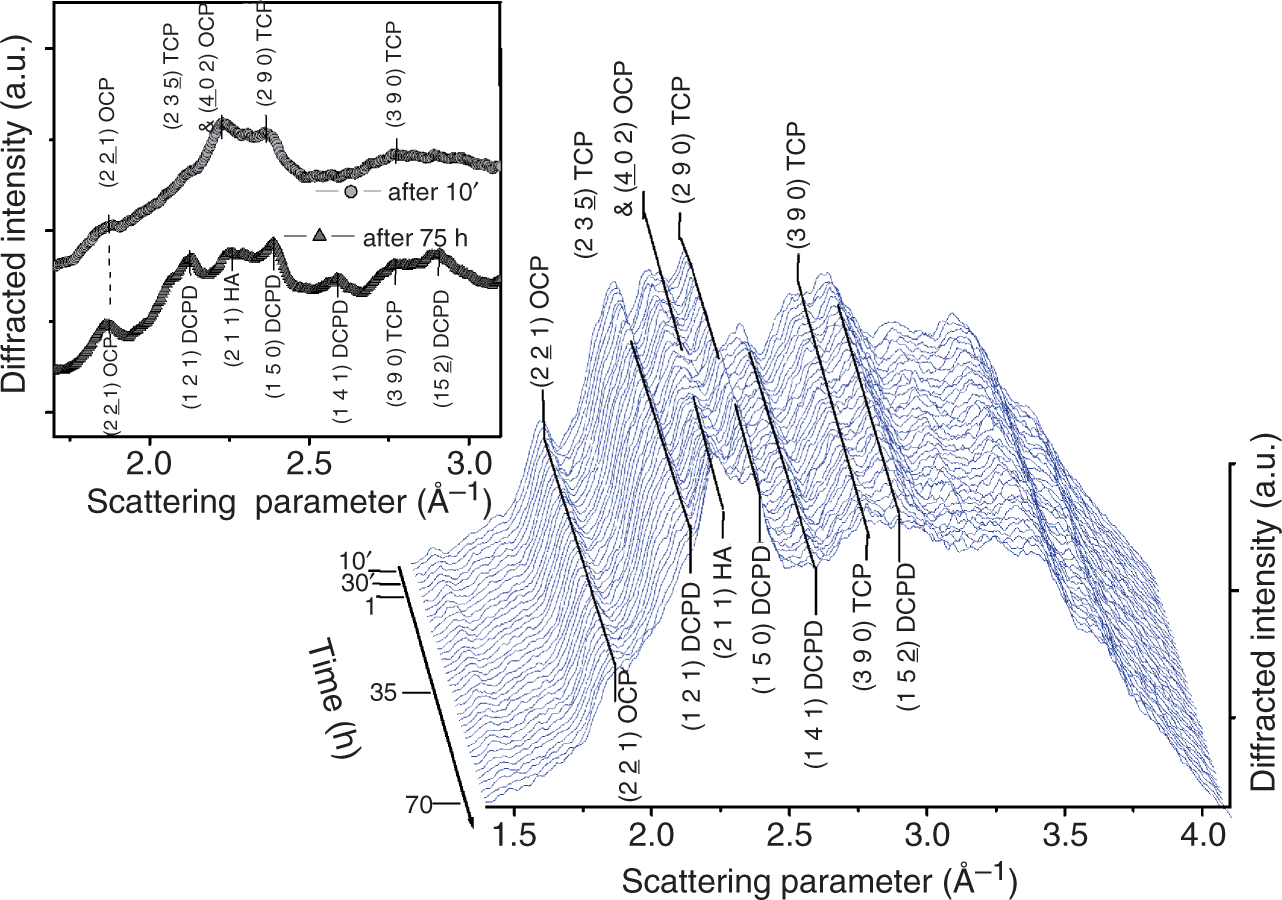
To investigate the structural changes taking place in this system, a sequence of the EDXRD patterns was collected as function of scattering parameter (q) and of time (t) upon the α-TCP–OCP cement paste. Sequence of spectra were collected for a total duration of 75 h. Patterns were collected every 10 min for the first hour and every 15 min for the remaining 75 h. The so-obtained 3D map is presented in Figure 1. In the inset of Figure 1, the q-region of 2.0–3.0 Å−1, containing novel crystalline reflections, is highlighted, and the comparison between patterns collected 10 min and 70 h after the beginning of process, is shown. As expected, in the initial diffraction patterns, two phases are present – α-TCP and OCP (sys. triclinic, S.G. P1(2), card number 79-0423). The most intense Bragg reflections attributed to these two initial phases are labeled in Figure 1: (2 3
As can be noticed from the waterfall presented in Figure 1, a number of changes occur during the hardening process. Appearance of several new peaks, attributable to two new phases DCPD (sys: monoclinic, S.G.: Ia(9), card number 72-0713) and HA (sys: hexagonal, S.G.: P63/m(176), card number 74-0566)), was detected. The most intense Bragg crystalline reflections of the newly formed DCPD and HA phases are labeled in Figure 1: (1 2 1) at 2.13 Å−1, (1 5 0) at 2.39 Å−1, (1 4 1) at 2.58 Å−1, and (1 5
For the most intense Bragg reflections, an accurate quantitative analysis was performed for each pattern. A Gaussian fit model was used to extrapolate the structural information on α-TCP–OCP cement sample. In Figures 2 and 3, the time evolution of some important structural parameters, such as relative area and grain size, corresponding to α-TCP and OCP peaks, and the new DCPD and HA Bragg reflections is presented. The SD for the peak area estimation, following Gaussian best-fit procedure, is about 18–20%, while that for the grain size calculation is about ±1 nm.
Time evolution of the relative peak areas and the grain size, for the (3 9 0) α-TCP peak and the (2 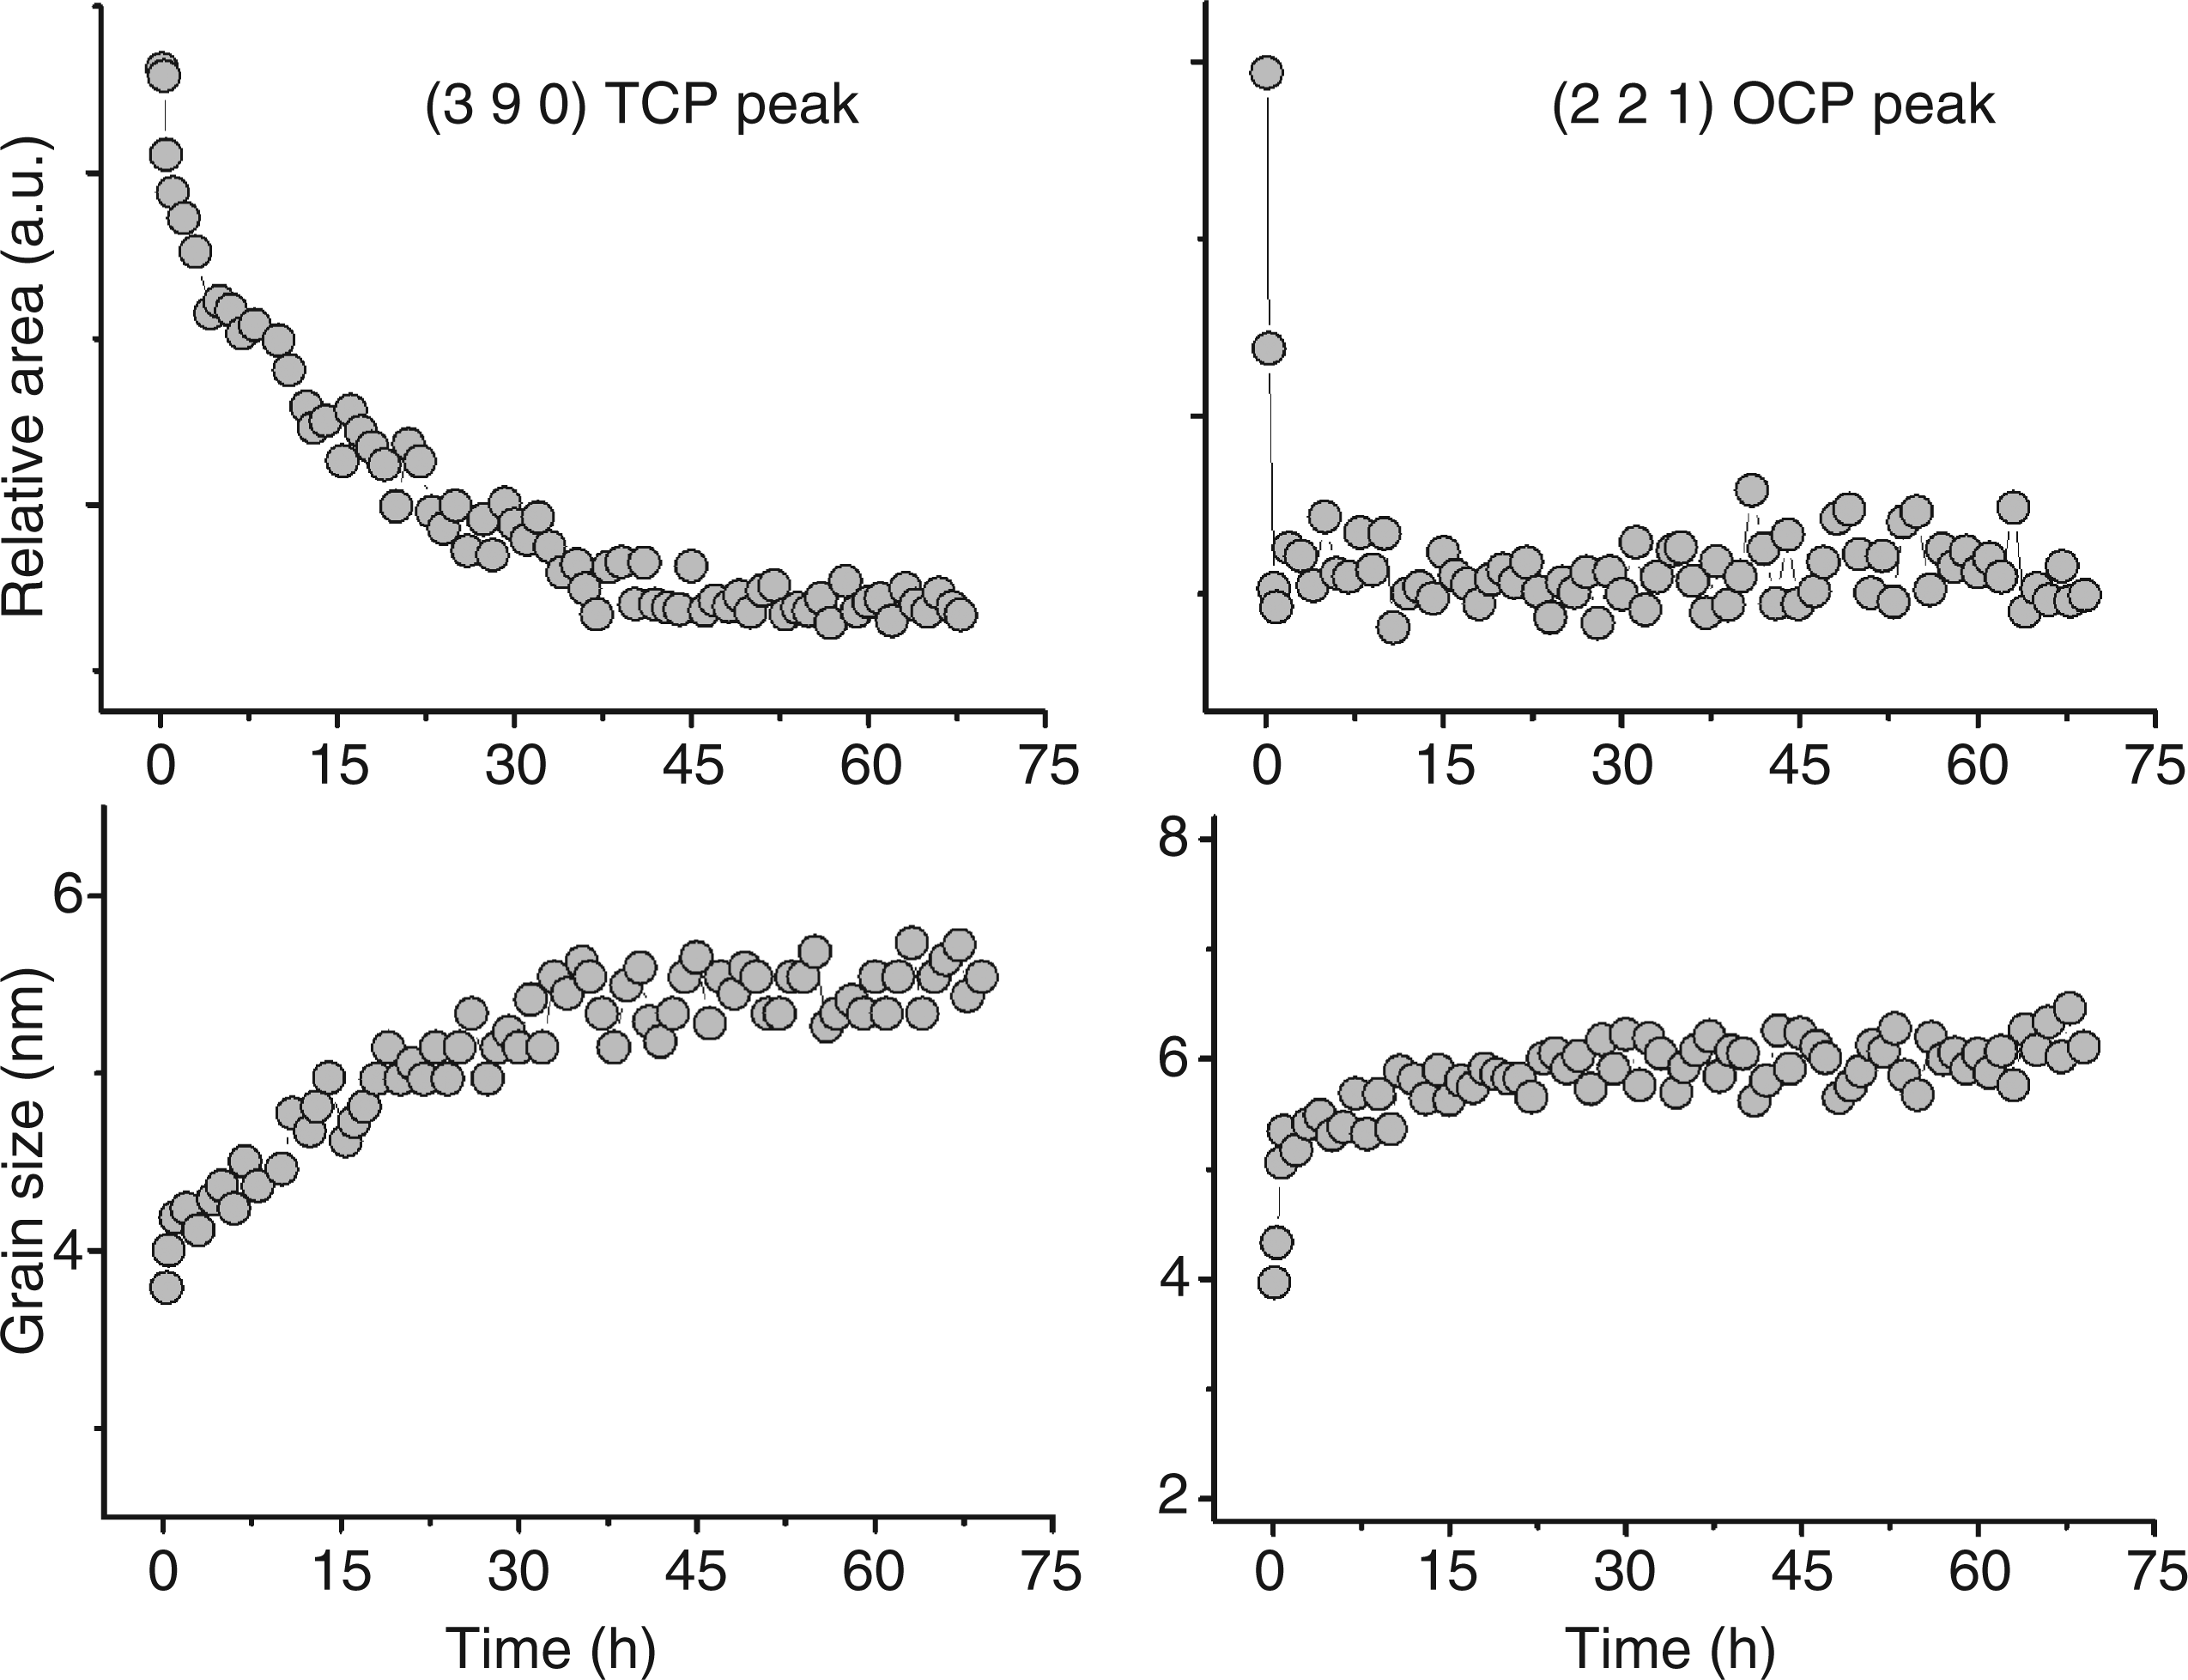
In Figure 2, the time evolution of relative areas and grain sizes of the (3 9 0) α-TCP peak at 2.75 Å-1 and the (2
For OCP, the peak relative area decrease is approximately (−50%) during the 75 h of the hardening time. Also, in this case, only a slight grain size growth takes place, starting from 4.0 ± 1.0 nm up to 6.0 ± 1.0 nm. Both processes, the OCP conversion into HA or CHA and the OCP crystallization, can take place with the same characteristic time (1.0 ± 0.5 h) [31].
In Figure 3, the time evolution of relative areas and grain sizes of the newly appeared (1 4 1) DCPD reflection at 2.58 Å−1 and the (2 1 1) HA Bragg reflection at 2.25 Å−1, is shown. The DCPD crystalline Bragg reflections appear after approximately 7 h of the beginning of the process, the grain size being constant at about 10.0 ± 1.0 nm. The characteristic crystallization time is 9.0 ± 0.5 h.
The HA peak appear after approximately 14 h of the beginning of the process. The relative peak area and grain size are constant, the latter value about 10.0 ± 1.0 nm.
Time evolution of the relative peak areas and the grain size, for the (1 4 1) DCPD peak and the (2 1 1) HA Bragg reflection, upon the hardening of the α-TCP–OCP cement paste.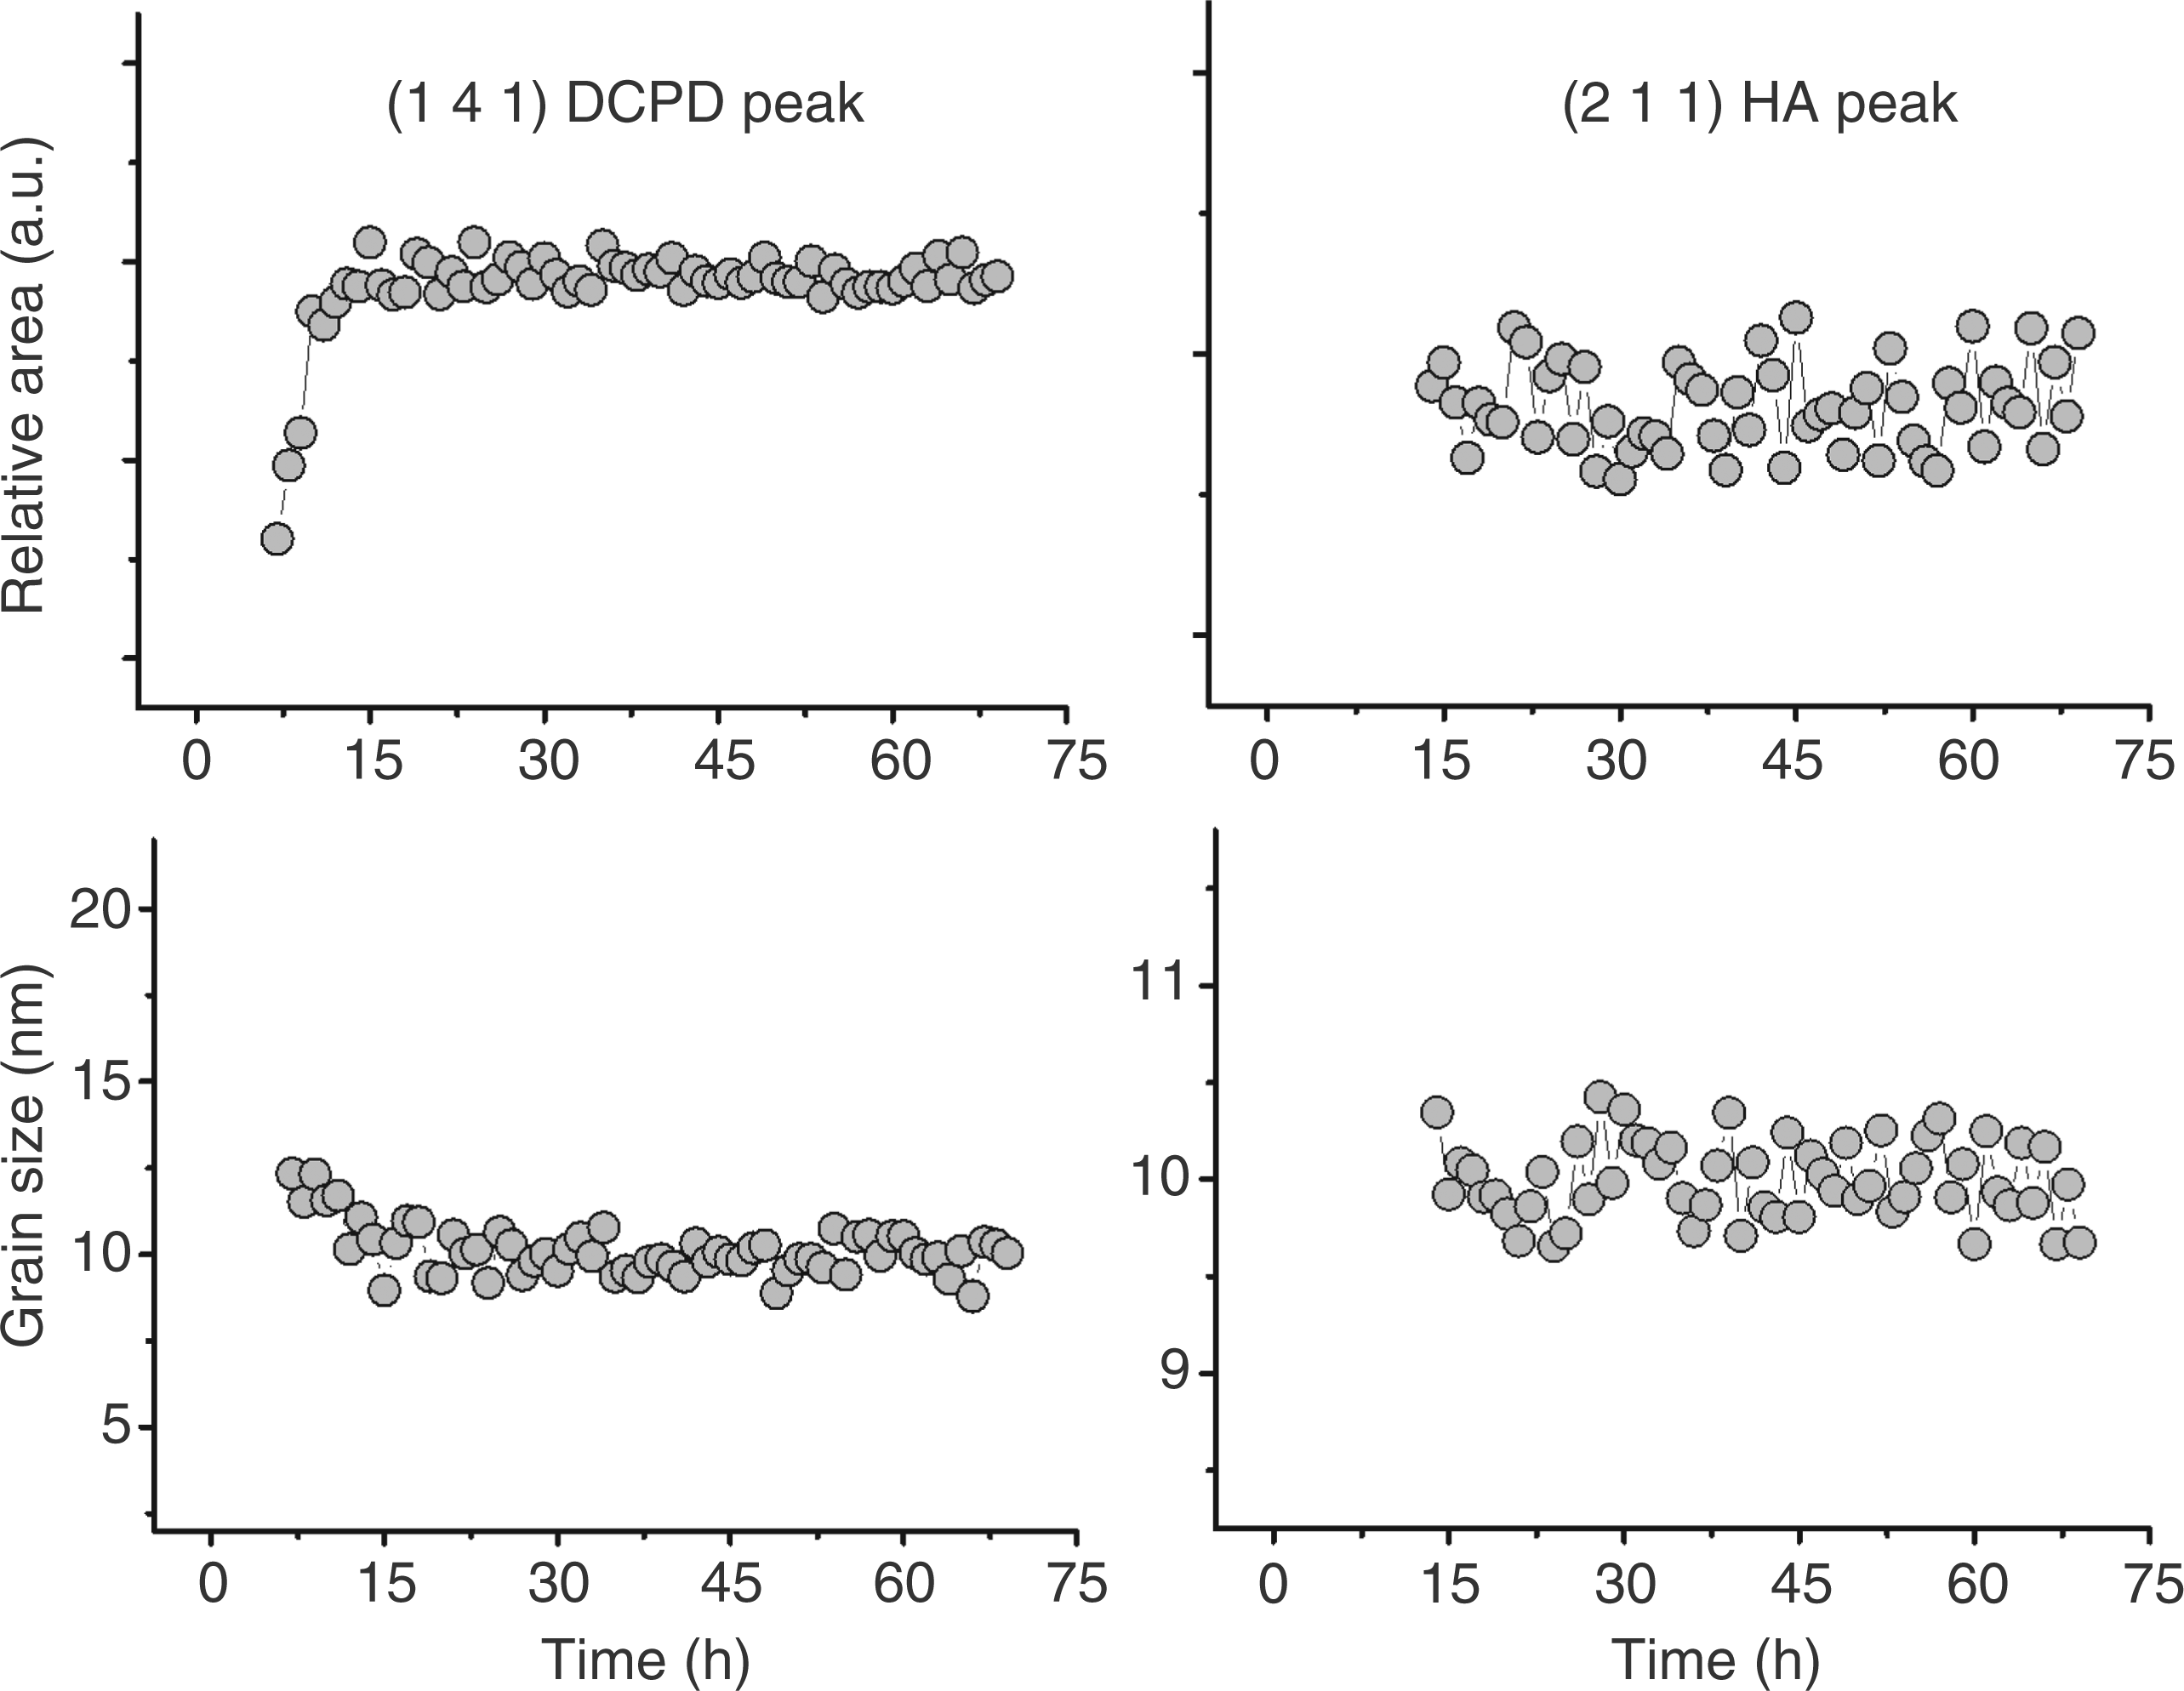
Microstructure Development
SEM revealed that 15 min after mixing, the microstructure of α-TCP/OCP cement was predominantly homogeneous with some particles embedded into the matrix (Figure 4(a)). After about 24 h of hardening, small needle- or platelet-like crystals appeared on the surface (Figure 4(b)). After 75 h, the microstructures of the cement became markedly different. The cement consisted mainly of blade-like crystals up to 10 µm in length (Figure 4(c)), similar to those previously reported in the literature for the cement based on β-TCP with orthophosphoric acid [32,33].
SEM micrographs collected for α-TCP–OCP cement after (a) 15 min, (b) 24 h and (c) 75 h of setting at 1000× and 5000× magnifications.
FT-IR Measurement
The FT-IR spectrum of the final cement sample, collected after 75 h of the hardening process, was obtained. An intense hydroxyl group (OH–) stretching mode band is observed at 3750 cm−1. Another broad H2O band is present in the 1700–1400 cm−1 range. The bands at 2345 and 2339 cm−1 assigned to the asymmetric stretching mode of the CO2 molecule entrapped from the air. Other carbonate absorbances, allowing us to distinguish between OCP and HA thanks to the CHA formation, ν3
Properties of Cement
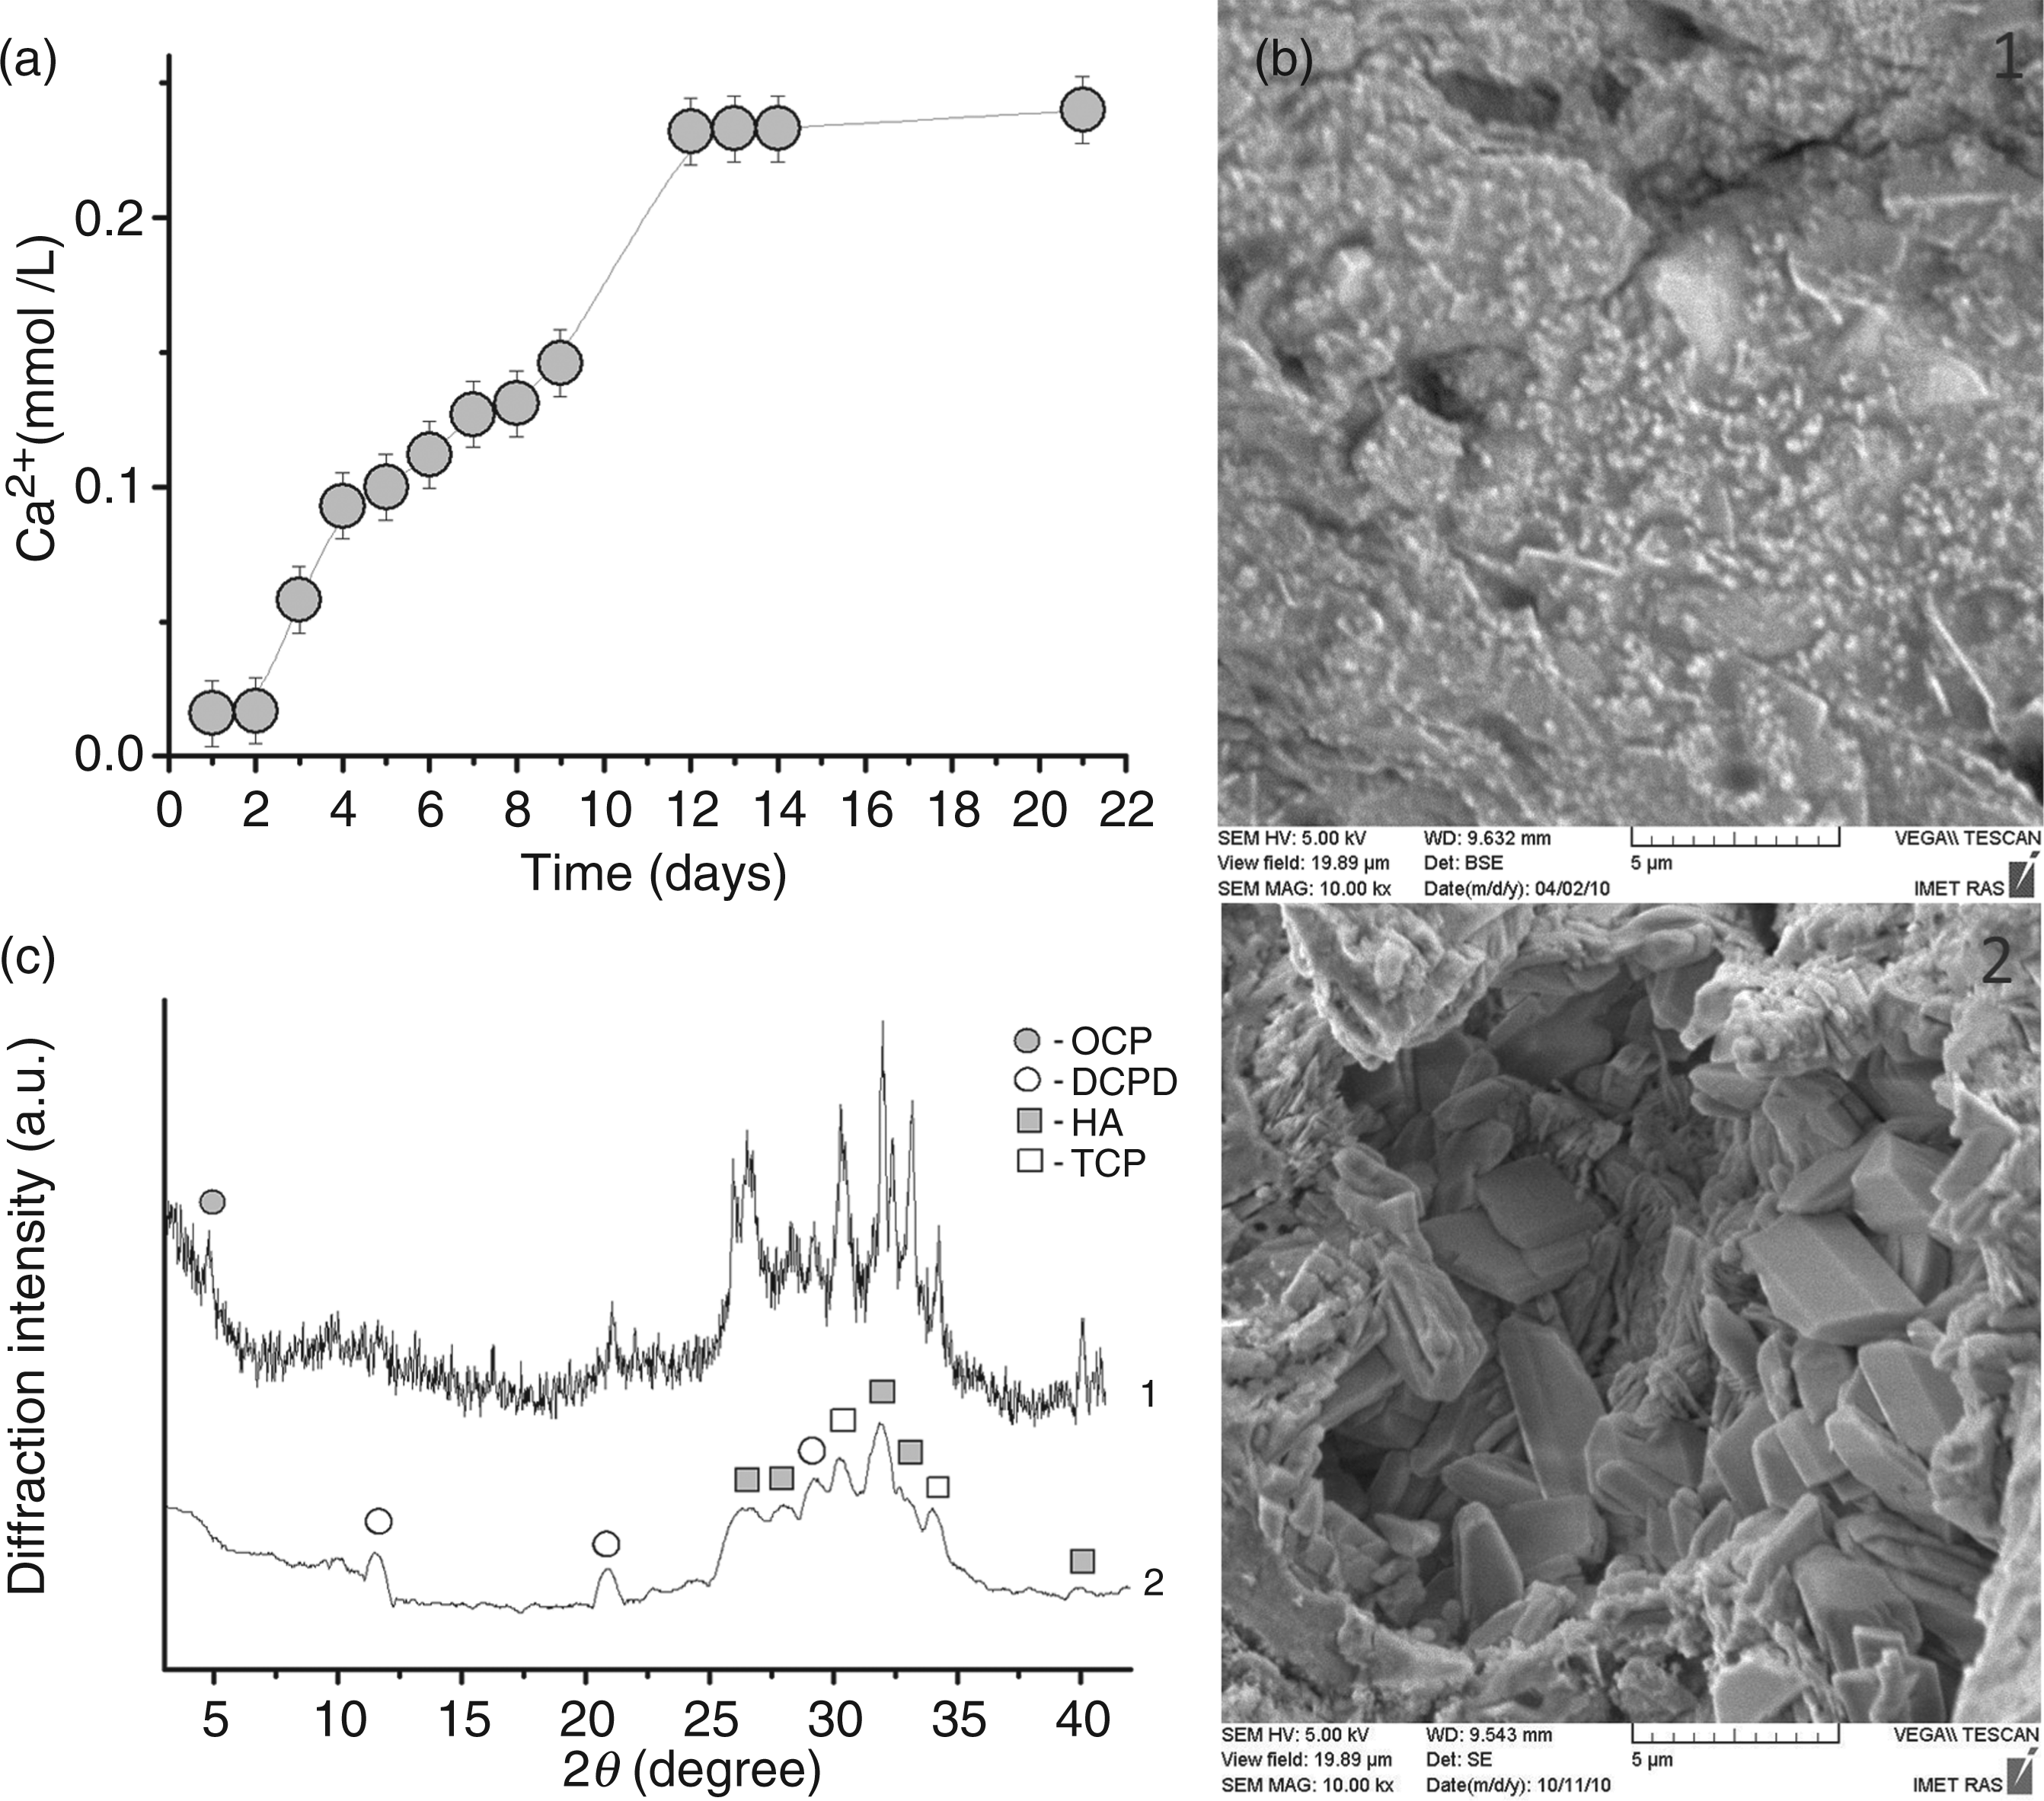
Compressive strength of the α-TCP–OCP cement as a function of its hardening time is shown in Figure 5. The compressive strength of the cement increased with time from 5 MPa up to about 30 MPa, reaching a maximum after 3 days (about 75 h). This feature corresponds to the microstructure development. The strength is increased due to the precipitation of fine needle- and platelet-like crystals, reinforcing the set cement, due to OCP to HA transformation. Fine needle-like crystals are morphologically typical features of HA or CHA. The partial transformation of α-TCP to DCPD results in the precipitation of large platelet-like crystals which are characteristic of DCPD. With an increase of their content, the strength is falling down. Figure 6 shows the dissolution curve of the cement. The calcium content in the solution reaches a plateau at 12 days of hardening period. This is due to the completion of the phase composition development with high contents of highly soluble constituents such as OCP, α-TCP, and DCPD. According to SEM observation and X-ray analysis OCP was completely hydrolyzed to HA. On the other hand, the two latter phases’, α-TCP and DCPD, were still presented after the dissolution test (21 days).
Compressive strength of the α-TCP–OCP cement as function of setting time. Dissolution behavior of the α-TCP–OCP cement as function of setting time (a). SEM micrographs (b) and X-ray diffraction patterns (c) of the α-TCP–OCP cement before (1) and after solubility test (21 days) (2).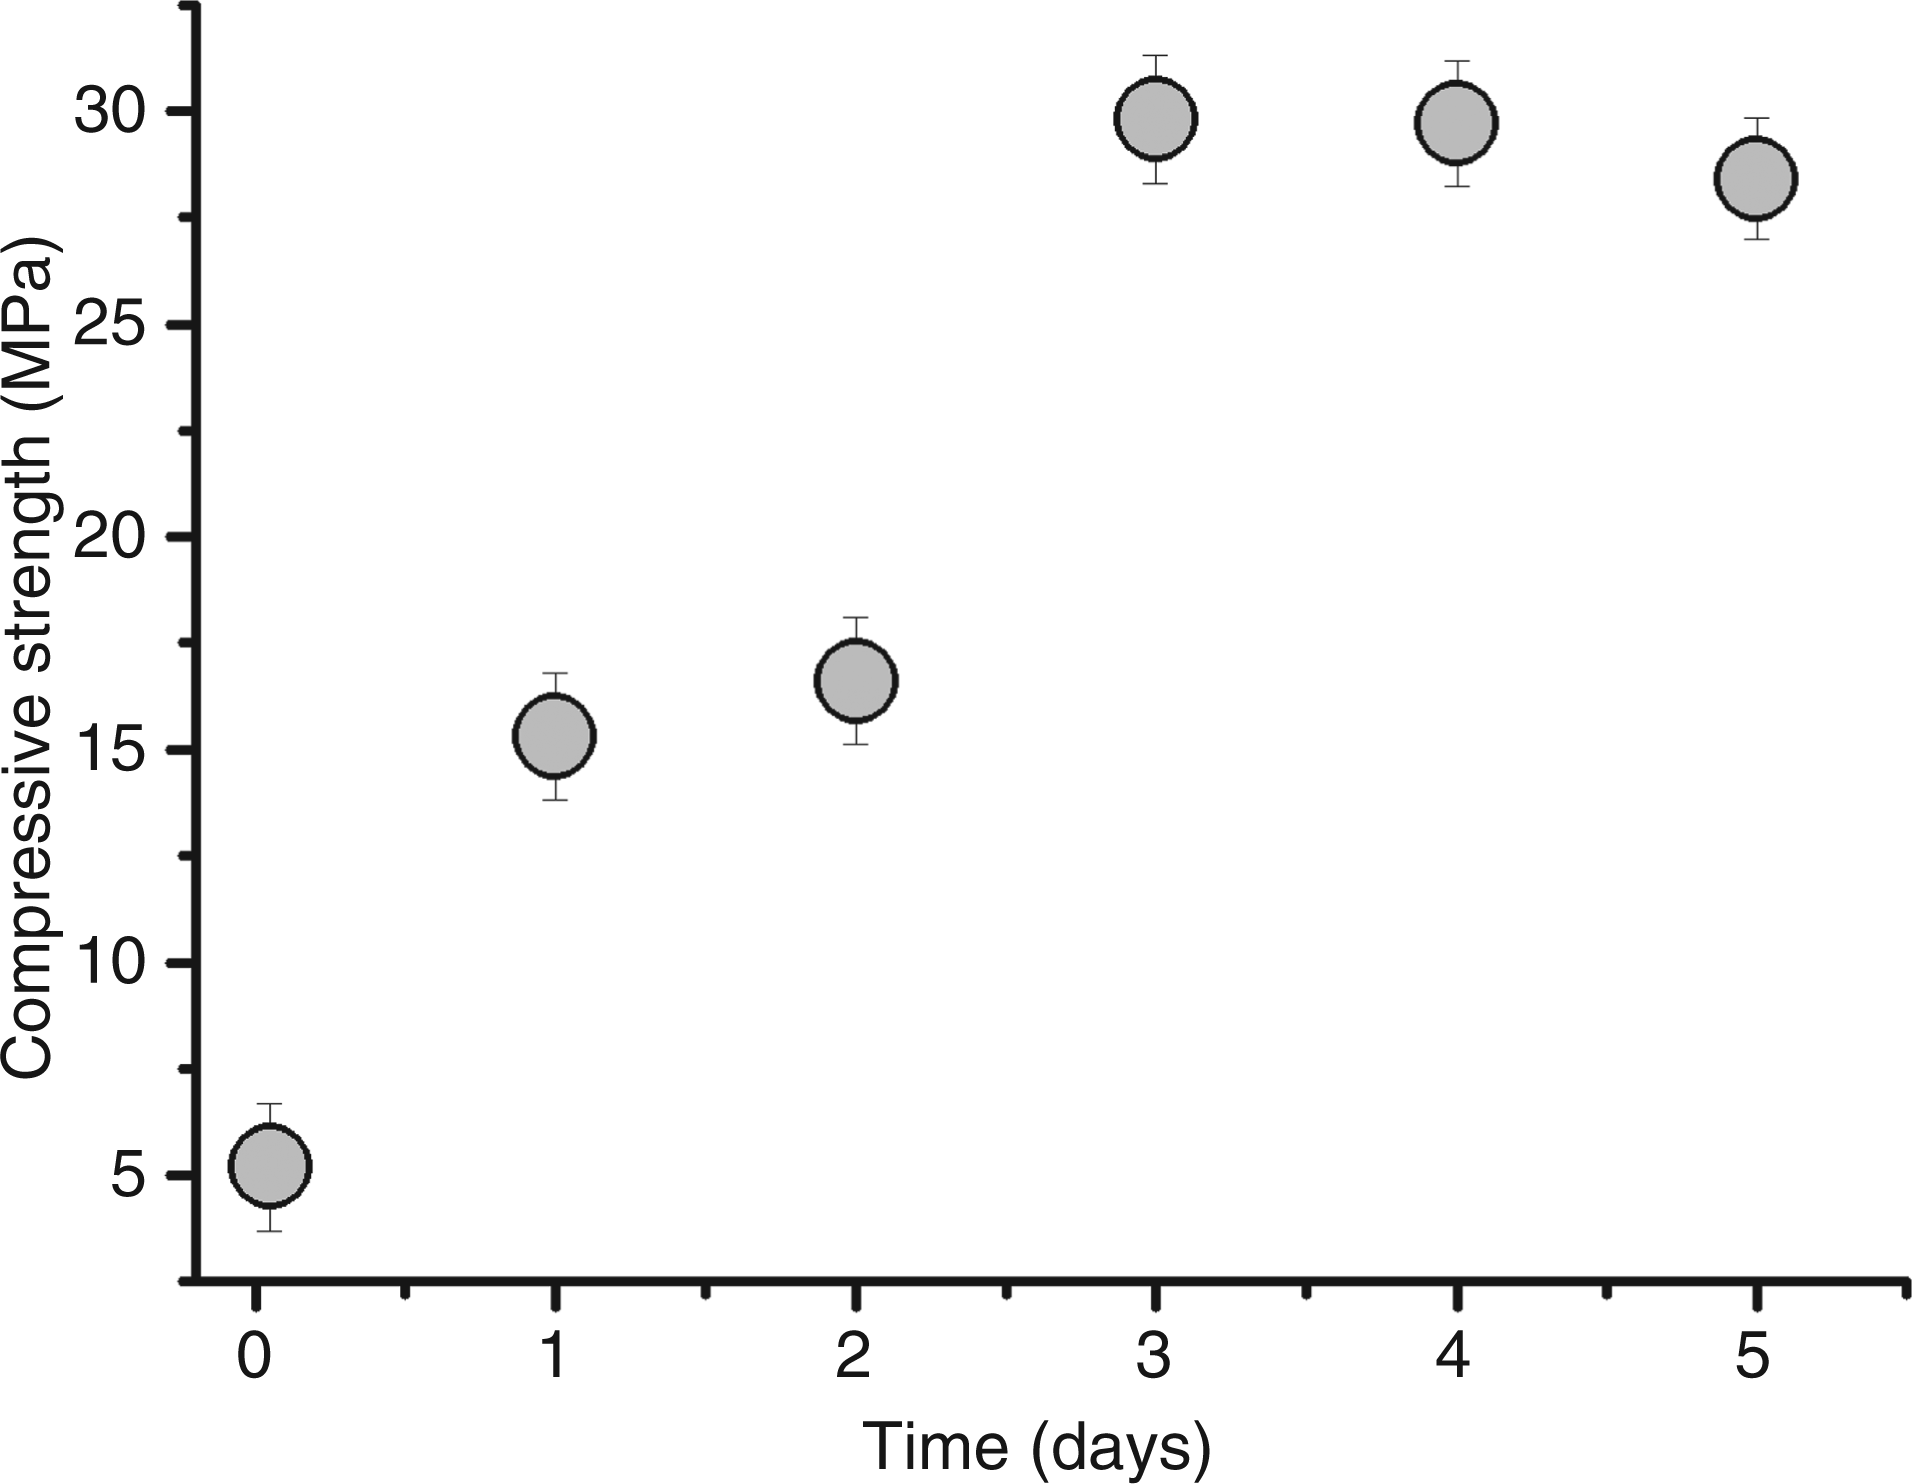
CONCLUSIONS
The phase development in the cement system α-TCP–OCP with phosphoric acid as a cement liquid was studied. Setting time of the cement increases from 5 min to about 63 min with an increase of OCP content from 10 to 50 wt% in the solid. Phase composition of the set cement includes HA and DCPD as the secondary phases. The most promising formulation of α-TCP (60 wt%) and OCP (40 wt%) is proposed. This cement has the following characteristics: setting time 10 min, and pH = 6.7; the final wt% composition of α-TCP/DCPD/HA/OCP equals 27/38/20/15. The presence of the OCP phase in the final cement is likely due to the inhibition effect of DCPD.
The results obtained by means of the EDXRD technique allowed us to conclude that during the hardening of the α-TCP–OCP cement several processes take place: partial conversion of initial α-TCP (40 wt%) and OCP (60 wt%) phases; slight grain size growth (secondary crystallization process) of α-TCP (from 4.0 to 5.5 nm) and OCP (from 4.0 to 6.0 nm); and formation of two new phases DCPD and HA. DCPD phase appears at about 7 h after the beginning of the process, the characteristic crystallization time being 9.0 ± 0.5 h. The HA phase is detected in 14 h set and hardened cement. The grain size of both phases is approximately 10 ± 1.0 nm. The secondary crystals of platelet-like morphology up to 10 mm in length can be attributed to DCPD phase. The cement has the compressive strength about 30 MPa and high dissolution rate in an isotonic solution.
Footnotes
Figure 1 appears in color online: ![]()
ACKNOWLEDGMENTS
Authors are grateful to the Russian Foundation for Basic Research (RFBR), grant no. 09-03-00187a, for the partial financial support. V.S. Komlev thanks the Ministry of Education and Science of Russia for providing financial support (grants the President of the Russian Federation no. МК-2286.2009.3 and МК-235.2010.3 for ‘Young Russian Scientists’) and the PhD student N. Bakunova for the assistance in the SEM study.