
Abstract
In this study, novel graphene oxide–incorporated silicate-doped nano-hydroxyapatite composites were prepared and their potential use for bone tissue engineering was investigated by developing an electrospun poly(ε-caprolactone) scaffold. Nanocomposite groups were synthesized to have two different ratios of graphene oxide (2 and 4 wt%) to evaluate the effect of graphene oxide incorporation and groups with different silicate-doped nano-hydroxyapatite content was prepared to investigate optimum concentrations of both silicate-doped nano-hydroxyapatite and graphene oxide. Three-dimensional poly(ε-caprolactone) scaffolds were prepared by wet electrospinning and reinforced with silicate-doped nano-hydroxyapatite/graphene oxide nanocomposite groups to improve bone regeneration potency. Microstructural and chemical characteristics of the scaffolds were investigated by X-ray diffraction, Fourier transform infrared spectroscope and scanning electron microscopy techniques. Protein adsorption and desorption on material surfaces were studied using fetal bovine serum. Presence of graphene oxide in the scaffold, dramatically increased the protein adsorption with decreased desorption. In vitro biocompatibility studies were conducted using human osteosarcoma cell line (Saos-2). Electrospun scaffold group that was prepared with effective concentrations of silicate-doped nano-hydroxyapatite and graphene oxide particles (poly(ε-caprolactone) – 10% silicate-doped nano-hydroxyapatite – 4% graphene oxide) showed improved adhesion, spreading, proliferation and alkaline phosphatase activity compared to other scaffold groups.
Keywords
Introduction
For bone tissue engineering, electrospun scaffolds should sustain organic and inorganic phases together in order to mimic chemical composition of the bone. For this reason, main strategy in electrospinning is to use natural and/or synthetic polymers with bioactive inorganics for bone regeneration. Natural polymers can be used due to their high biocompatibility while synthetic polymers can provide low rate of degradation and increased mechanical properties. 1 One of the mainly used synthetic polymers for bone tissue repair and regeneration is poly(ε-caprolactone) (PCL).
PCL is resorbable with high biocompatibility and biodegradability besides having low degradation rate. However, hydrophobic properties of PCL can affect cell attachment and mineralization in scaffold. In order to promote hydrophilicity, bioactive inorganic particles can be incorporated to form a hybrid structure.2,3 As the major inorganic phase of the natural bone tissue, hydroxyapatite (HA) nanoparticles are preferred ingredients of bone scaffolds, which have the capability to increase bone regeneration capacity. When dispersed within and through surface of the electrospun fibers, HA particles tend to form nucleation sites for mineralization and increase protein adsorption while improving cell adhesion and proliferation. Electrospun synthetic polymer scaffolds are generally supported by bioactive inorganics to form an effective bone tissue scaffold. 4
Incorporating HA particles into scaffold is the most preferred way to induce bone formation by mimicking microstructure of bone. Biological activity of HA can be further improved by modifying HA with bioactive element substitution. 5 The ions added to the HA unit can change its structure and charge, altering HA’s physical, chemical and biological characteristics. One of such ions is silicon (Si) that was reported to contribute to bioactivity of HA and increases its dissolution rate. 6 The effect of Si on bone formation was first observed by the study of Carlisle. An abnormal bone growth was observed under Si-deficient conditions. 7 Since then the improvement of bioactivity of HA by Si incorporation was proved by many studies.8–12 An explanation to improved bioactivity could be the active nucleation sites created by the silanol groups of the silicate-doped hydroxyapatite (SiHA). 6 Si incorporation into bioactive glasses was also associated with increased osteoblast proliferation, expression of bone-related growth factors like BMP-2 and activation of bone growth metabolism in cells. 10
Graphene oxide (GO) was reported to have good biocompatibility and possible application in tissue engineering. Improved proliferation and differentiation of mesenchymal stem cells by GO interaction were observed and later, GO started to be incorporated into scaffolds in order to increase biological activity. 13 In a study by Depan et al., 14 chitosan-GO network was created and GO-incorporated groups showed increased cell attachment and growth besides improving calcium-phosphate deposition. These findings and results of the recent studies supported the possible use of GO for bone tissue engineering. Graphene based composites were reported to be non-toxic to osteoblasts besides promoting their adhesion and growth, and enhance apatite mineralization. 15
In this study, GO-incorporated nano-SiHA particles with different ratios were synthesized and used to modify three-dimensional (3D) electrospun PCL scaffolds for the first time in order to investigate the use of GO and SiHA together for possible improvement of bone regenerative capacity. In order to find effective concentrations of SiHA and GO, they were used in different ratios to prepare nanocomposites. First, nano-GO particles were synthesized from graphite powder by the Tour method. Then, GO-incorporated SiHA groups were synthesized to have different concentrations of GO (2 and 4 wt%) and SiHA (6, 8 and 10 wt%) contents. Group names were presented as indicating the individual particles weight percent to PCL and all scaffold groups were produced from 10% wt/v PCL solution (PCL, PCL-10%HA, PCL-10%SiHA, PCL-8%SiHA-2%GO, PCL-6%SiHA-4%GO, PCL-8%SiHA-4%GO and PCL-10%SiHA-4%GO). Produced particles were able to be electrospun within PCL solution forming particle incorporated fibers in a 3D scaffold. The possible use of the novel GO-incorporated SiHA particles for bone tissue engineering was investigated by observing Saos-2 cell proliferation and mineralization on 3D PCL scaffolds.
Materials and methods
Production of GO from graphite particles
The Tour method was used to produce GO from graphite powder. 16 Graphite powder (Ave. size: 3 µm, Ege Nanotek, Turkey) (3 g) were mixed with potassium permanganate (18 g) in a glass beaker. A solution of concentrated sulfuric acid and phosphoric acid (75%) was prepared in 9:1 volume ratio and added into powder mixture while stirring. An increase in the solution temperature up to 45°C was observed and then temperature was set to 50°C and solution was left stirring for 12 h. After 12 h of stirring the color of the solution turned from greenish to purple brown and heating was stopped. Ice cubes prepared from 400 mL of dH2O were added into stirring solution and when the ice melted, 3 mL of hydrogen peroxide solution was added into the mixture. In this step, the color of the solution immediately turned into light yellow, indicating the formation of GO. The formed GO particles were washed with dH2O, HCl (30%) and dH2O orderly by precipitating with centrifugation (5000 g for 8 min). As the last step, GO nanoparticles were produced by separating GO flakes via homogenization at 12000 r/min.
Synthesis of pure HA and SiHA particles
Pure HA and SiHA particles were synthesized through the microwave-assisted synthesis using reagent-grades Ca(NO3)2.4H2O (Merck, Germany), (NH4)2HPO4 (Merck, Germany) and Si(OCH2CH3)4(-TEOS) (Merck, Germany) as resources of Ca2+, PO43– and SiO44–, respectively. The mixing molar ratio Ca/(P + Si) was calculated to attain 1.67 (Table 1). A 1.0-M solution of Ca2+ was prepared in 200 mL of dH2O to form solution A. Mixture of PO43– and SiO44– was prepared in 200 mL of dH2O to form solution B. The solution B was added dropwise to solution A, under constant stirring. The resulting mixture was then stirred at room temperature (RT) for 30 min during which the pH of the solution was maintained above 10 by adding ammonia solution. The reaction mixture was irradiated for 30 min in an 800-W microwave (Samsung, MS23F301EAW) during which it was refluxed. Resulting white precipitate was filtered, washed with distilled water until pH was 7, dried in an oven at 80°C for 17 h and calcined in muffle furnace at 700°C for 2 h.
Nominal compositions of inorganic content in the nanocomposite groups.
SiHA: silicate-doped hydroxyapatite; GO: graphene oxide; PCL: poly(ε-caprolactone).
Preparation of GO-SiHA nanocomposites
The sintered SiHA powder was mixed with GO to form nanocomposites. The SiO44− ratio in SiHA-doped groups and weight ratios of SiHA/GO to PCL used to prepare groups in this study are presented in Table 1. The powders were mixed and milled at RT for 1 h at 300 r/min on a conventional planetary ball mill.
Production of 3D electrospun scaffolds
As the electrospinning solution, PCL (Mn: 80000, Sigma-Aldrich, USA) at 10% (wt/v) concentration was prepared in 1,1,1,3,3,3-Hexafluoro-2-propanol (HFIP, Merck, Germany) and HA, SiHA and SiHA/GO groups were dispersed in the PCL solution. A wet electrospinning system was prepared and fibers were collected in ethanol solution that was stabilized on a rotational collector (Gozeler Elektronik, Turkey) at a distance of 12 cm. Polymer solution was pumped with an NE-1000 syringe pump (New Era Pump Systems, USA) at 6 mL/h flow rate and under 7–10 kV that was created using high voltage source (ES30, Gamma High Voltage Research, Inc., USA). In order to sustain 3D structure, scaffolds were exchanged into dH2O, frozen at –80°C and then lyophilized via freeze-drier (Labconco Corporation, USA).
Microstructural characterizations of HA groups and fibrous scaffolds
The crystalline structures and presence of phases of HA, SiHA and SiHA/GO groups were identified by X-ray diffraction (XRD, Rigaku Ultima IV).
Fourier transform infrared spectroscope (FTIR) analysis was performed via a spectrometer of PerkinElmer L1050002 series (PerkinElmer, Inc., UK) using spectrum 100/100 N software program in transmission mode. The analysis was performed within the wavenumber range 4000–400 cm−1, with a resolution of 4 cm−1 and a total of 50 scans per sample. The spectra of samples were measured by mixing powder of samples (obtained by crushing in a mortar) with KBr at 1:10 ratio. The spectra of all samples were corrected for background and atmosphere inside the FTIR.
Scanning electron microscopy
Scanning electron microscopy (SEM) was used to observe fiber morphology and physical properties of scaffolds. Samples were coated with gold and palladium before analysis with sputter coating. Samples were observed under Quanta 400F Field Emission SEM device (FEI, USA). Cell morphology analysis was also performed by SEM imaging. Cells grown on the scaffolds were fixed before the analyses. For the fixation, scaffolds were immersed in 4% paraformaldehyde solution prepared in phosphate-buffered saline (PBS) and fixed scaffolds were washed with PBS. Samples were then dehydrated using increasing concentrations of ethanol solution (20–100%) by treating samples for 10 min for each concentration. After removal of remaining ethanol, scaffolds were treated with hexamethyldisilazane and dried. Samples were stored at 4°C in a desiccator. Deposited calcium phosphate crystals were analyzed by energy-dispersive X-ray spectroscopy (EDX) system attached to the SEM.
Tensile strength test
Uniaxial tensile test was used to compare the tensile strength of prepared scaffolds. Scaffold samples were prepared in the dimensions of 25 mm × 10 mm × 0.2 mm (length × width × thickness). Univert biomaterial mechanical testing device (Cell scale, Canada) equipped with 10 N load cell, controlled by a remote computer, was used for the tensile test. Preload was selected as 0.1 N and test was performed with 0.5 mm/s of stretching time. The stress–strain curve was plotted from the collected data and ultimate tensile strength (UTS) and Young’s modulus were calculated.
Bioactivity test
Prepared scaffolds were put in 2 mL of simulated body fluid (SBF) at 37°C. Prepared SBF had ion concentrations of Na+: 142.0, K+: 5.0, Mg2+: 1.5, Ca2+: 2.5, Cl–: 147.8, HCO34–: 4.2, HPO42–: 1.0 and SO42–: 0.5 mM and a pH of 7.4. After 7 and 14 days of incubation periods, the specimens were washed with deionized water and freeze dried. Specimens were stored in a desiccator until SEM examinations for the mineral deposition. The calcium content of the incubation medium of scaffold groups was measured at predetermined time points through 14 days with Ca2+ detection assay. For the detection of Ca2+, o-cresopthalein complexone (0.024% w/v in water) was mixed with 8-hyroxyquinone-5-sulfonic acid (0.25% w/v in water) in equal volumes. Then, 0.5 M 2-amino-2-methyl-1,3-propandiol was prepared in water and added to previous mixture in equal volumes and forms the reaction mixture. For the measurement, 100 µL of Ca2+ containing samples were mixed with 900 µL of 0.1 M HCl solution and incubated for 1 h. After incubation, 25 µL of sample solution was mixed with 125 µL of reaction mixture in 96-well plate and incubated until the solutions were mixed homogeneously. The absorbance was read at 560 nm wavelength by Elisa plate reader.
Protein adsorption and desorption
Scaffold samples were cut into 10-mm squares. The weight of the scaffold groups was measured and similar samples were used in the test. Scaffolds were first wetted in 70% ethanol and rinsed three times with PBS. Then scaffolds were immersed in 1 mL of fetal bovine serum (FBS, Thermo fisher scientific, USA) solution (1:9, FBS:PBS) and incubated for 24 h. After incubation, the specimens were washed with PBS for 15 min to remove excess protein content in the environment. The protein solution was collected from each group and analyzed with bicinchoninic acid (BCA) protein assay in order to conclude on adsorbed protein amounts. Protein-adsorbed scaffolds were immersed in PBS and incubated for additional 24 h to study protein desorption. After the incubation, PBS was analyzed with BCA protein assay to detect protein desorption from the scaffolds. Known concentrations of FBS solutions were used to calibrate the colorimetric assay.
Cell culture studies
In vitro cytotoxicity and mineralization studies were performed with Saos-2 cell line (ATCC, USA). The culture medium used was high glucose Dulbecco’s modified Eagle medium (Merck, Germany) (10% FBS and 1% penicillin/streptomycin (Invitrogen, USA)) and growth was maintained in carbon dioxide incubator (Shel Lab, USA) at 37°C. For the cell culture study, scaffolds were cut into squares (7 × 7 mm2) to fit in 48-well plate and sterilized by incubating in ethanol for 2 h followed by 30 min of UV treatment. Initial cell seeding was 2 × 10⁵ cells/well.
Cell viability assay
In order to detect cell proliferation on scaffolds, Alamar Blue assay (Invitrogen, USA) was applied after 1, 4 and 7 days of incubation. Alamar solution was diluted in DMEM without phenol red (10%, v/v). Scaffolds were washed with PBS in order to remove the medium completely and Alamar solution was added to each well (500 µL). Samples were left for incubation in 37°C for 6 h in dark. After incubation, Alamar solutions were separated to a new 48-well plate for Elisa reading of reductions at 570 and 600 nm wavelengths. Scaffolds were then washed with PBS in order to remove remaining dye and returned back to normal growth condition with growth medium until the next time point.
Alkaline phosphatase activity
Cell differentiation capability of the groups was determined by the alkaline phosphatase (ALP) assay. ALP assay determines the ALP activity within the cells as an early marker of osteoblastic differentiation. Differentiation medium was prepared as DMEM containing 10% FBS, 1% penicillin–streptomycin, 50 µg/mL ascorbic acid, 10 mM β-glycerophosphate and 10−8 M dexamethasone. Cell-seeded scaffolds were incubated for 7 and 14 days and after each incubation period ALP assay was applied. Briefly, cells that grow on scaffolds were lysed with two freezing and thawing cycles at –80°C and 37°C with 15 min incubation at each temperature. Lysates were obtained in 500 µL PBS, transferred (25 µL) into 96-well plate with 75 µL of p-nitrophenyl phosphate (pNPP) substrate solution. MgCl2 solution (96% in PBS) (25 µL) was used to increase reaction speed. 17 Plate was incubated at 37°C for 60 min and absorbance reading was performed by Elisa plate reader at 405 nm. A calibration curve constructed with p-nitrophenol was used to determine the ALP activity. Protein contents of the lysates were determined with the calibration curve obtained with bovine serum albumin (BSA) in the interval of 0–12 mg/mL via BCA protein assay. The enzyme activity of cells was given in terms of specific enzyme activity nmol/μg protein/min.
Cell adhesion and spreading analysis
In order to compare cell adhesion in the groups, cells were seeded on scaffolds and after 4 h of incubation the number of adhered cells was determined by DNA quantification by Hoechst staining. Cell numbers were obtained from the calibration curve plotted with DNA quantification of Saos-2 cells with determined numbers. After 4 h of incubation with cells, scaffolds were washed with PBS twice to remove nonadherent cells. Tris NaCl and EDTA (TNE) buffer solution (pH: 7.4) was prepared by dissolving 1.21 g of Tris (hydroxymethyl) aminomethane, 0.37 g of EDTA and 11.69 g of NaCl in 1 L of dH2O. Dye solution (2X) was prepared by diluting 20 µL of Hoechst solution (1 mg/mL) with 100 mL TNE buffer solution. Scaffolds were immersed in TNE buffer solution and attached cells were lysed by freeze-thaw cycles. A total of 1 mL of cell lysate was mixed with 1 mL of dye solution (2X) and fluorescence was measured with a fluorometer (Turner Designs, USA) using the UV module. Percent cell adhesions were calculated by considering initial number of cell seeding.
The spreading areas of individual cells were analyzed using confocal laser scanning microscopy analysis (CSLM, Leica DM2500, Germany). Briefly, Saos-2 cells were seeded on scaffolds at a density of 2 × 10⁵ per scaffold (7 mm2). After incubation for 8 h and 1 day, cells were fixed with 4% paraformaldehyde using the same procedure as for SEM sample preparation. Scaffolds were washed with PBS and cells were permeabilized by treatment of 1% Triton X-100 for 5 min. Then scaffolds were incubated in 1% BSA solution at 37°C for 30 min. Cell cytoskeleton was stained with Alexa Fluor 488 Phalloidin solution (1% in 0.1% BSA solution) for 1 h and nucleus was stained with DAPI (1 µg/mL). Excess dye was removed by washing with PBS. Confocal images were taken using z-stack analysis and image layers were combined to form final images. Individual spreading area of cells was calculated from at least 30 cells selected randomly by using ImageJ (National Institutes of Health, Bethesda, USA) software. In order to determine cell boundaries and measure the spreading areas of cells, light intensity threshold analysis was applied to confocal images.
Statistical analysis
Data were statistically analyzed by one-way analysis of variance (ANOVA) to compare groups for single parameter. Tukey's Multiple Comparison Test for the post hoc pairwise comparisons (SPSS 22 Software Program, USA) was applied. Differences were accepted as statistically significant at p < 0.05.
Results and discussion
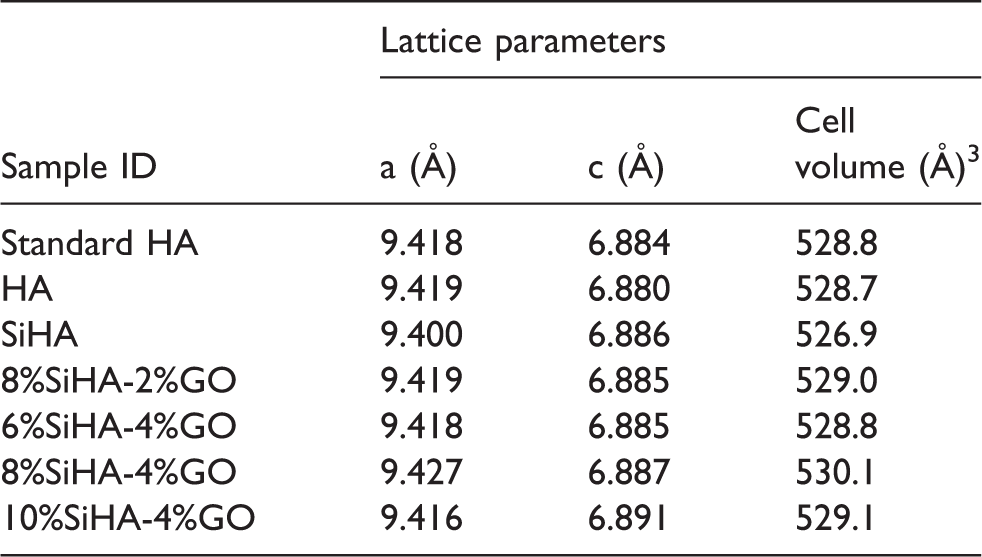
The XRD patterns of GO powder obtained via the Tour method are illustrated in the online supplementary Figure 1. The pattern showed very strong diffraction peak at 2θ = 10.48° attributed to the (0 0 1) reflection of GO, which is in good agreement with the literature.16,18 The XRD analysis of HA, SiHA and SiHA/GO composites are displayed in Figure 1(a) and (b). All diffraction peaks of HA perfectly matched with the standard HA pattern (JCDPS NO: 09–432). Incorporation of SiO44− ions into HA structure resulted in widening of peak widths and reduction in the peak heights, confirming decrease in the crystallite size and crystallinity of HA structure. 19 The patterns of SiHA/GO composites showed distinct diffraction peak of GO at the 10.60°, which was clearly visible in all composites. The obtained lattice parameters for the HA, SiHA and SiHA/GO materials are presented in Table 2. These variations in lattice parameters of HA were assigned to the substitution of bigger sized SiO4 tetrahedron in place of PO4 tetrahedron.
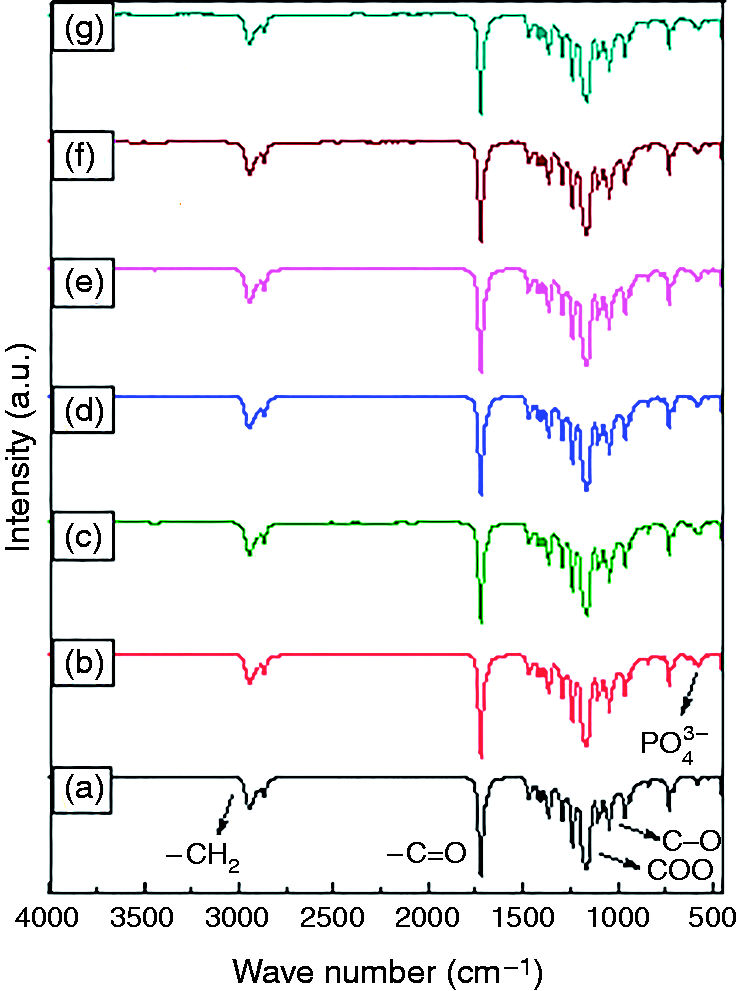
FTIR spectrum of the electrospun scaffold groups: (a) PCL, (b) PCL-10%HA, (c) PCL-10%SiHA, (d) PCL-8%SiHA-2%GO, (e) PCL-6%SiHA-4%GO, (f) PCL-8%SiHA-4%GO, (g) PCL-10%SiHA-4%GO. SiHA: silicate-doped hydroxyapatite; GO: graphene oxide; FTIR: Fourier transform infrared spectroscope; PCL: poly(ε-caprolactone).
Lattice parameters for the HA, SiHA and SiHA/GO composite materials.
SiHA: silicate-doped hydroxyapatite; GO: graphene oxide.
FTIR spectrums of the electrospun scaffold groups are shown in Figure 1. The FTIR spectrums of the fiber samples are completely matching with FTIR spectrum of PCL from the literature. Absorption bands at 2942 and 2867 cm−1 are assigned to the stretching mode of –CH2 group and the sharp peak at the 1723 cm−1 is attributed to the stretching mode of –C = O bond. 20 CH2 bending vibrations are present at 1465, 1407 and, 1362 cm−1, while COO vibrations are present at 1238 and 1181 cm−1. The peaks present at 1047 and 1099 cm−1 are related to vibrations of C–O bond. 21 HA and SiHA spectra showed that a small but broad band related to the P–O–P vibration originates from PO43– group located at 570 cm−1, 22 and the weakness in intensity was due to the overlapping with PCL specific absorptions. Oxygen-containing functional groups of GO particles have characteristic absorption peaks at 1720 cm−1 due to the stretching vibration of C = O, 1620 cm−1 from the C = C stretching, 1400 cm−1 from –OH groups and 1300–1350 cm−1 from the C–OH stretching vibrations. 23 However, relative peaks of SiHA/GO-involving groups were indistinguishable probably due to the low amount of SiHA/GO particles distributed through polymer fibers or being coated with polymer during electrospinning.
SEM analysis was performed to observe fiber morphology of scaffolds and investigate the effect of doped particles on the fiber structure. PCL fibers were found to be 2.92 ± 0.84 µm in diameter and appeared to have more linear structure compared to doped groups (Figure 2(a)). Fiber diameters of the groups, PCL-10%HA, PCL-10%SiHA, PCL-8%SiHA-2%GO and PCL-6%SiHA-4%GO (2.87 ± 0.89, 2.73 ± 0.85, 2.68 ± 0.82 and 2.95 ± 0.80 µm) were similar to each other. HA, SiHA and SiHA/GO-doped fibers tended to form fibers with twists compared to pure PCL fibers (Figure 2(b) to (e)). Total doping amounts in PCL-8%SiHA-4%GO and PCL-10%SiHA-4%GO groups (12 and 14 wt%) were higher than in other groups, which resulted in smaller fiber diameters (2.03 ± 0.68 and 1.61 ± 0.59 µm) and more uniform fiber structure. PCL-10%SiHA-4%GO group had the smallest fiber diameter that is very close to nanometer size range (1.61 ± 0.59 µm) and presence of nanofibers were reported to increase cell viability and ALP activity of Saos-2 cells. 24 The 3D structure achieved by wet electrospinning could be preserved in all scaffold groups by simply transferring scaffolds into water and freeze drying. Initially, PCL fibers were collected in ethanol bath and it was concluded that freeze drying in ethanol was not an efficient way to obtain 3D scaffolds due to low freezing temperature of ethanol (–114°C). Thus, freeze drying was performed by stabilizing the 3D structure in water.
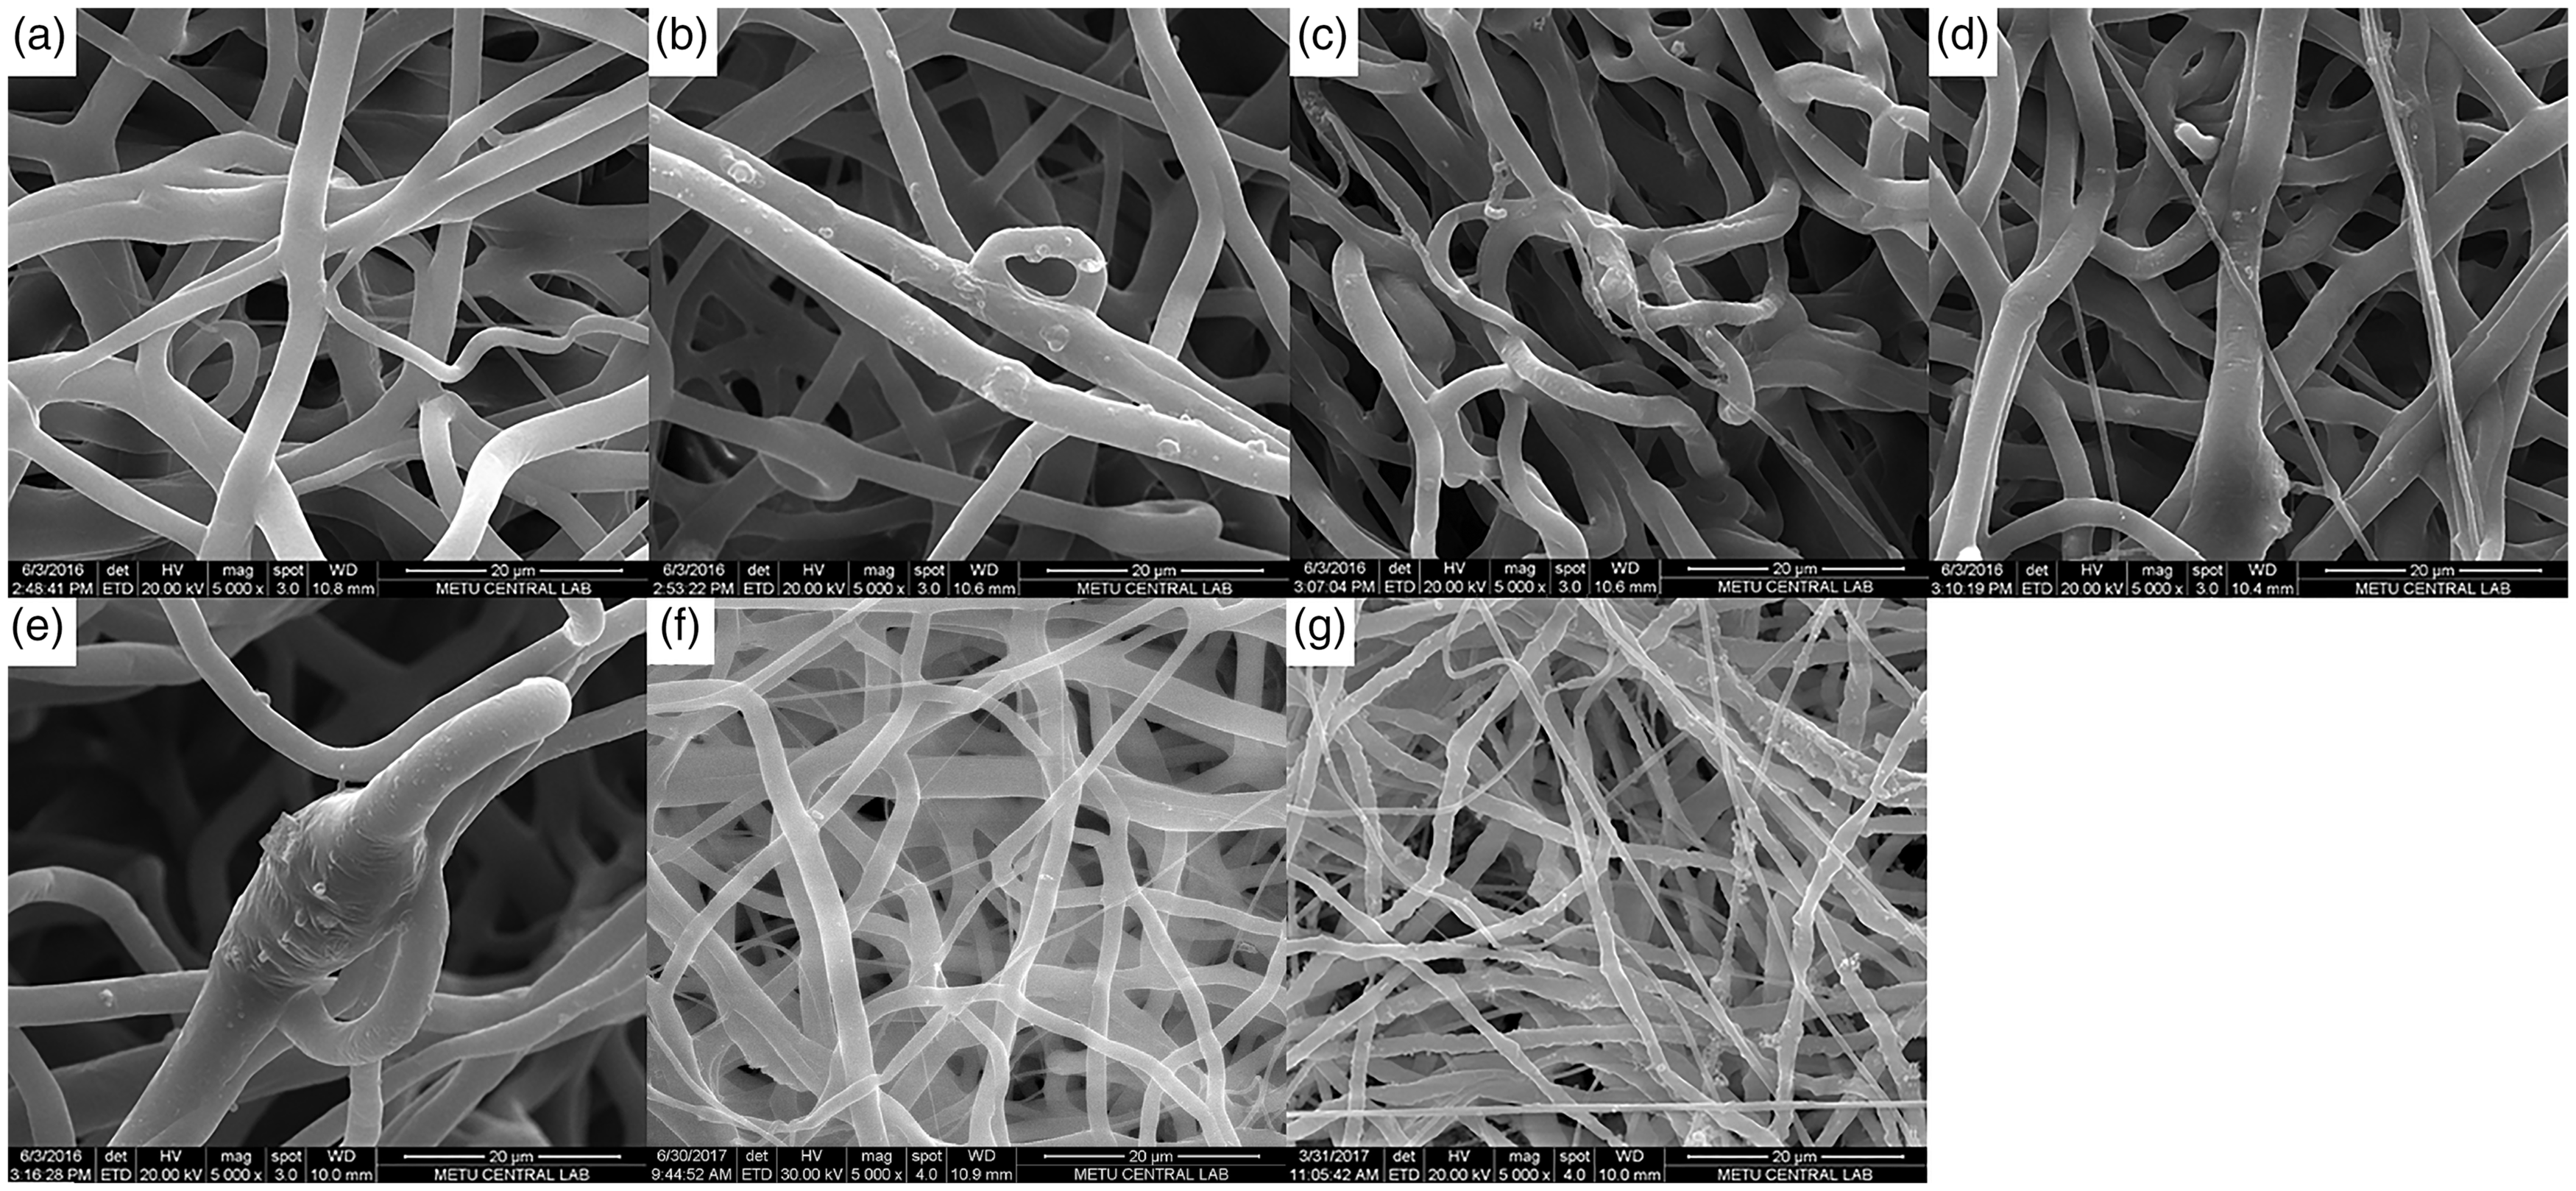
Fiber morphology analysis by SEM imaging of the electrospun scaffold groups at ×5000 magnification with scale bar showing 20 μm length: (a) PCL, (b) PCL-10%HA, (c) PCL-10%SiHA, (d) PCL-8%SiHA-2%GO, (e) PCL-6%SiHA-4%GO, (f) PCL-8%SiHA-4%GO and (g) PCL-10%SiHA-4%GO. SiHA: silicate-doped hydroxyapatite; GO: graphene oxide; PCL: poly(ε-caprolactone); SEM: scanning electron microscopy.
Protein adsorption and desorption activity of the scaffold groups for 24-h period are presented in Figure 3. PCL fibers alone, compared to doped groups, showed low level of protein adsorption and high level of protein desorption. As reported in the literature, incorporation of nHA into PCL fibers improved the protein adsorption ability of the scaffold and HA itself has specific affinity to adhesive proteins.25,26 The SiHA-doped scaffolds did not create a statistically meaningful difference compared to pure HA, whereas protein adsorption increased considerably for GO-incorporated groups. Besides, the protein adsorption further increased parallel to GO content of the scaffold. Protein adsorption is a vital property for scaffold-cell interaction since the cell attachment, migration and growth depend on proteins that are adsorbed from environment or secreted by cells. Consequently, scaffolds that can provide high protein adsorption are expected to create more favorable microenvironment for the cells. 25 In addition, high protein adsorption rate reported to be able to suppress apoptosis and enhance cell growth on scaffolds. 27 GO-incorporated SiHA-doped scaffolds had the highest protein adsorption rates, which proved the potential of the synthesized composite to sustain a biomimetic microenvironment.

Protein adsorption and desorption of the scaffold groups after 24 h incubation periods.
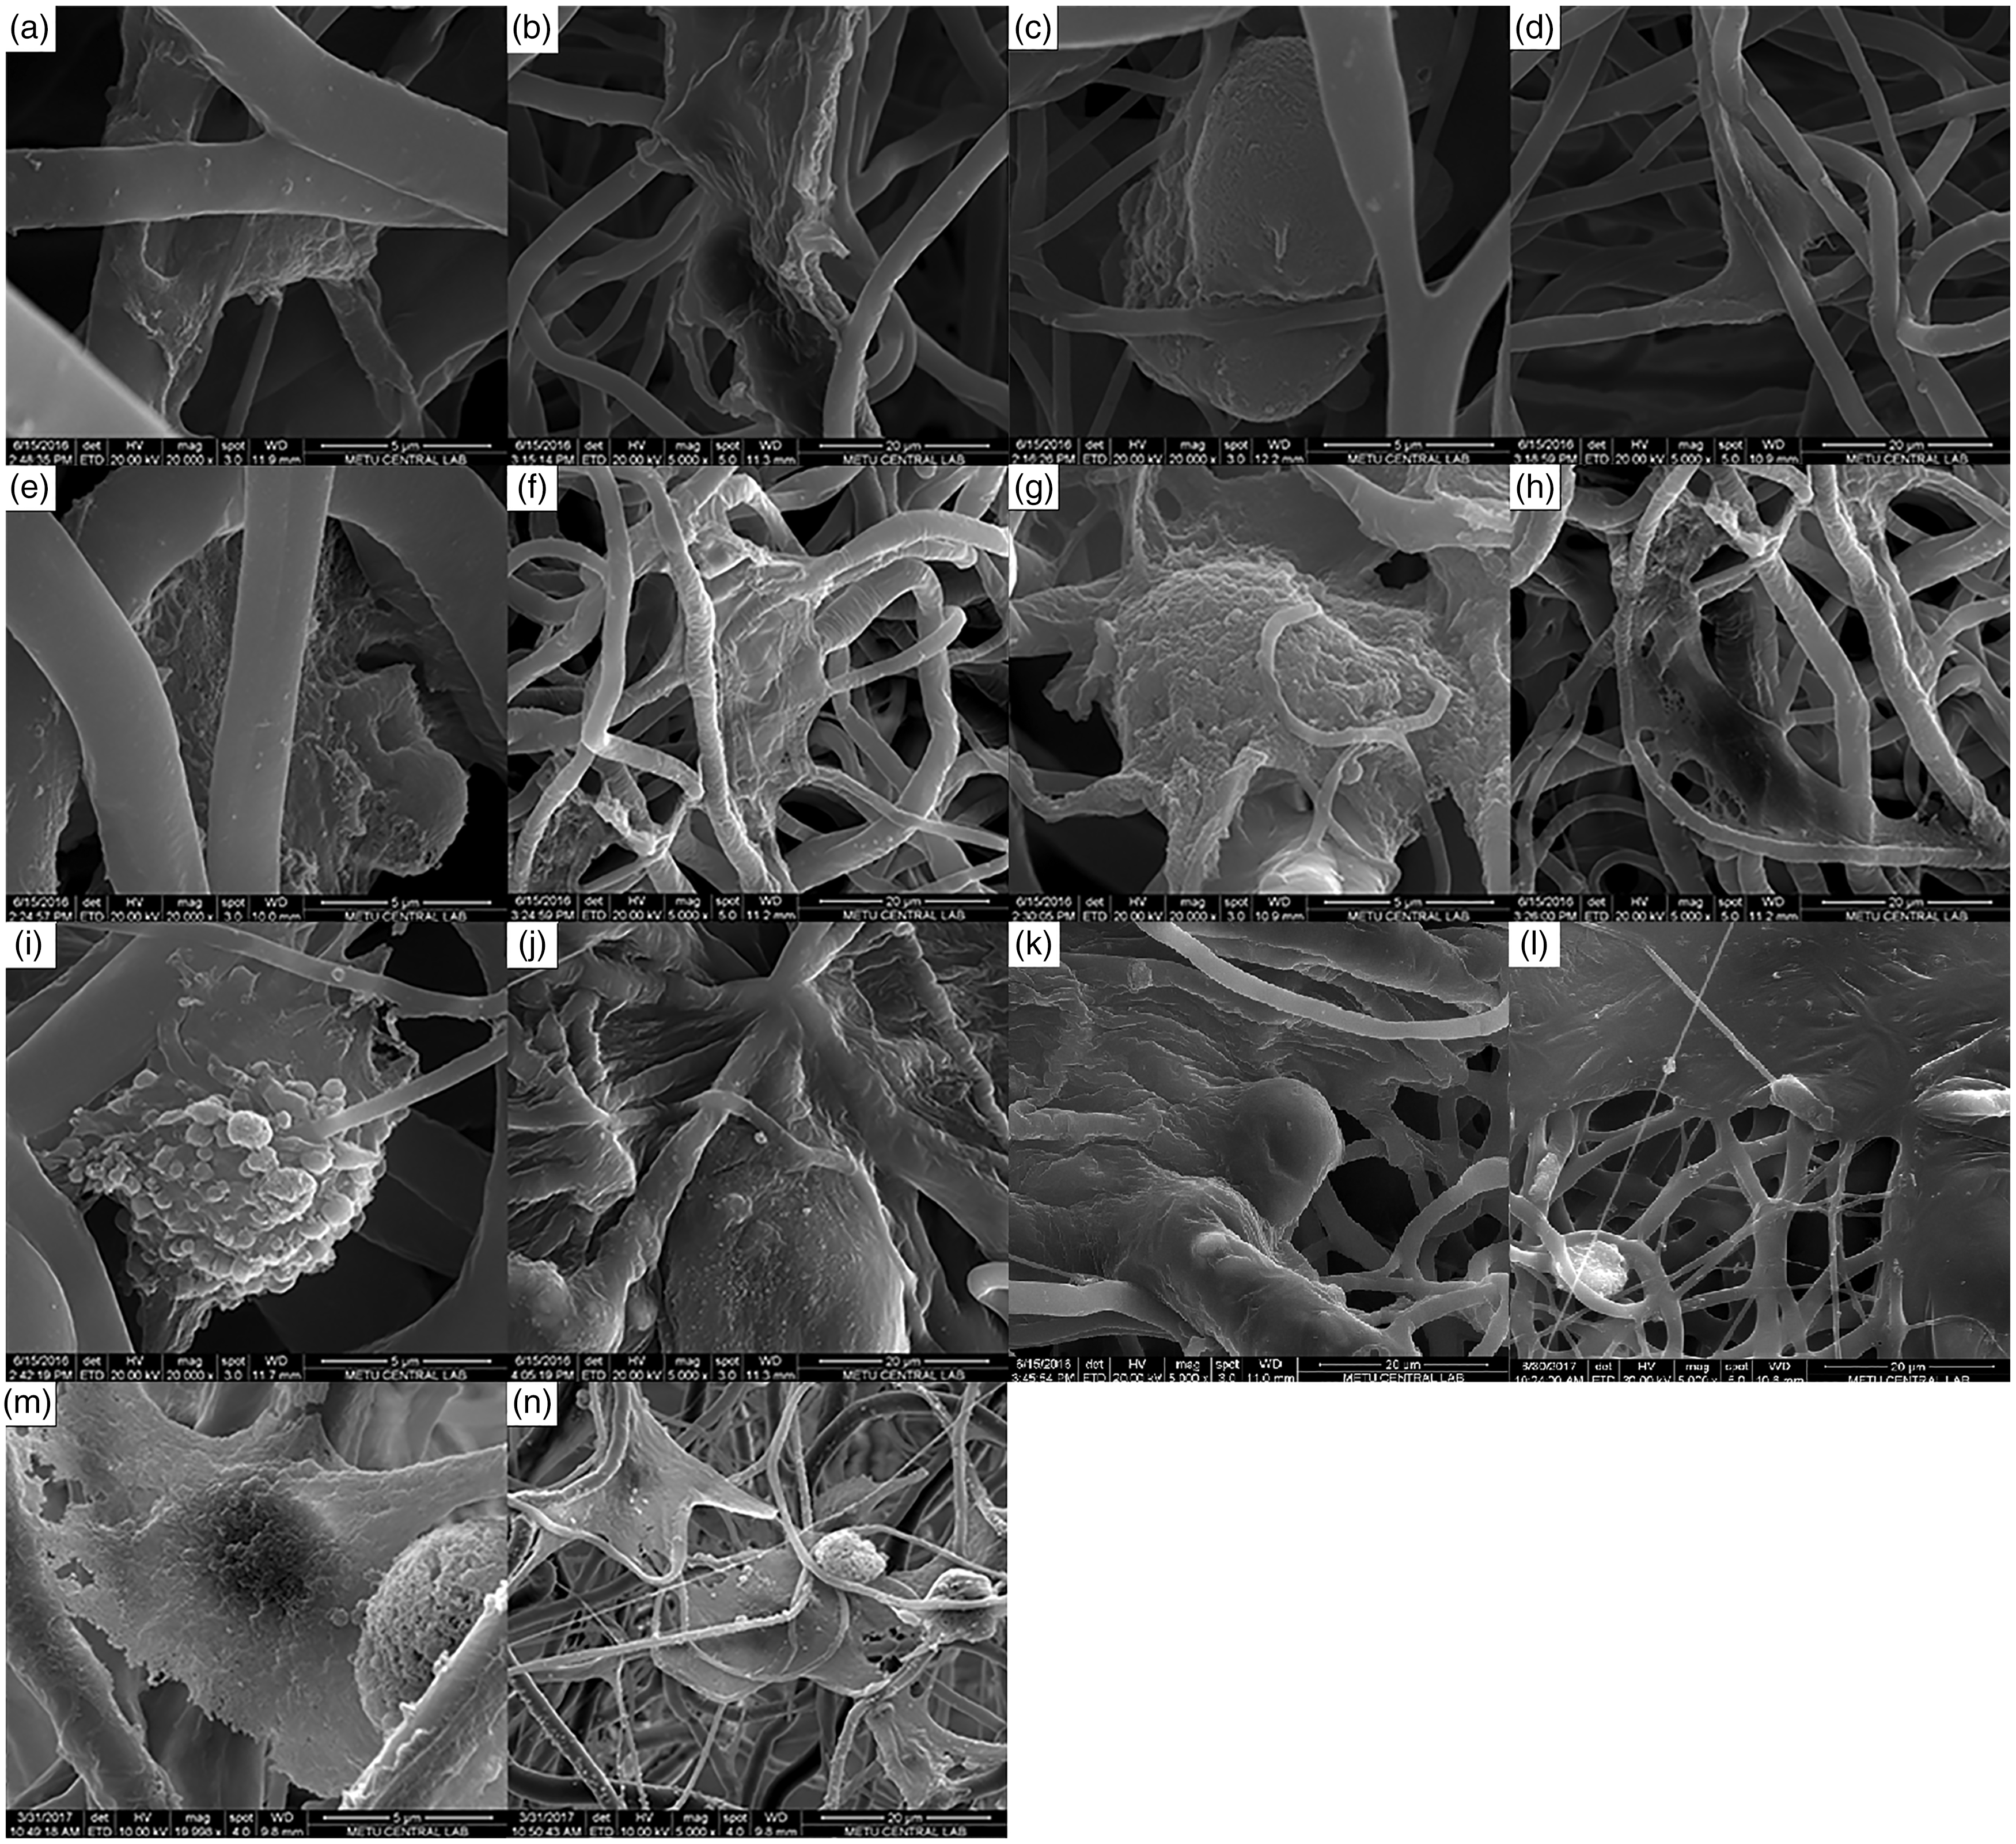
HA is the major inorganic component of the bone matrix and is directly related to bone regeneration; hence promotion of HA mineralization on bone scaffolds is important. 26 The bioactivity of the scaffold groups was evaluated by comparing HA deposition on their surface after incubation in SBF. The HA deposition on the scaffolds after 7 and 14 days of SBF incubation is presented in Figure 4. It was reported that PCL alone was not suitable to promote HA deposition and several modifications on PCL was studied in order to promote HA deposition. 26 Also in this study, PCL alone was unable to promote HA deposition and only a few separate HA flakes were observed after 14 days (Figure 4(a and b)). When compared to only PCL scaffold group, HA, SiHA and SiHA/GO-doped PCL scaffold groups showed improved HA deposition even after 7 days of incubation. Several layers of HA flakes deposited on the fibrous surface were observed under SEM (Figure 4(c) to (j)). Initial HA deposition was expected to be on the surface of the fibers as observed by HA crystals surrounding the fiber and still preserving the fiber shape (Figure 4(c) to (e)). As the amount of HA deposition increased, the fibrous appearance of the surface disappeared by the formation of multiple HA layers. In the SEM images of GO-incorporated groups (PCL-8%SiHA-2%GO and PCL-6%SiHA-4%GO) after 7 days of incubation, fiber structures had already disappeared, which indicates a faster HA deposition compared to only HA or SiHA-doped groups. When GO was incorporated into PCL fibers, improved biomineralization was reported and calcium phosphate nucleation was pointed out to be facilitated by anionic functional groups of GO. 23 When the total amount of doped composite was increased in the groups PCL-8%SiHA-4%GO and PCL-10%SiHA-4%GO, fibrous structure with more gaps between fibers were obtained. That is why mineralization has occurred as separate islands through the fibers rather than covering the surface (Figure 4(k) to (n)).

SEM images of (a and b) PCL, (c and d) PCL-10%HA, (e and f) PCL-10%SiHA, (g and h) PCL-8%SiHA-2%GO, (i and j) PCL-6%SiHA-4%GO, (k and l) PCL-8%SiHA-4%GO, (m and n) PCL-10%SiHA-4%GO scaffold groups after 7 (first image) and 14 (second image) days of incubation in SBF (37°C). Images were taken at ×1000 magnification with scale bar showing 100 μm length. SiHA: silicate-doped hydroxyapatite; GO: graphene oxide; PCL: poly(ε-caprolactone); SEM: scanning electron microscopy; SBF: simulated body fluid.
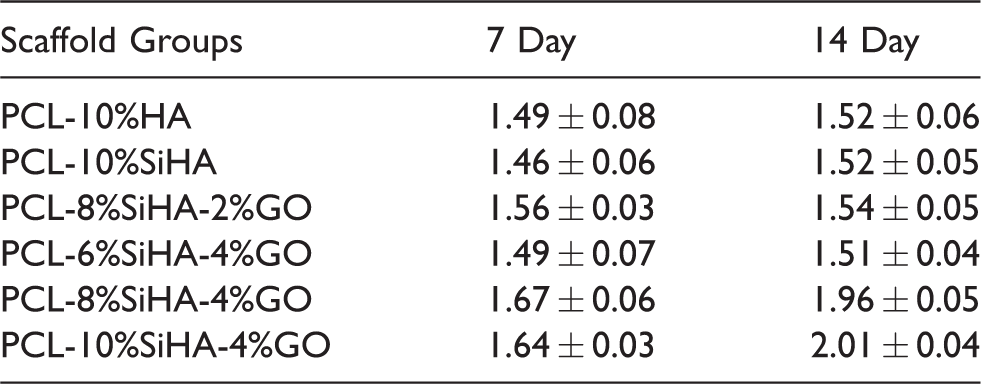
EDX analysis was performed to investigate elemental composition of the deposited mineral after 7 and 14 days (Table 3). The ratio of Ca/P of the deposited HA was evaluated to be slightly lower than Ca/P ratio of the pure HA in the groups doped with 10% HA, SiHA or SiHA/GO content, which was perfectly fine since biological HA is also reported to be calcium-deficient and has a lower Ca/P ratio than 1.67. 28 Deposited HA had similar Ca/P ratio for all scaffold groups except PCL that showed little to no HA deposition after 14 days. In the study by Wan and Chen, 23 enhanced HA deposition on GO-incorporated PCL with Ca/P ratio around 1.42 was reported and HA deposition on pure PCL was also achieved by using 10X SBF. HA deposited on to groups with SiHA/GO content higher than 10% showed higher calcium phosphate ratios. After 7 days of incubation their Ca-to-P ratio was close to theoretical value of the HA (1.67) and ratio was increased up to 2 after 14 days of incubation.
Calcium phosphate ratio of scaffold groups, studied with energy-dispersive X-ray spectroscopy (EDX) analysis.
SiHA: silicate-doped hydroxyapatite; GO: graphene oxide; PCL: poly(ε-caprolactone).
The amount of calcium deposition onto scaffold groups was evaluated by measuring the calcium content of the incubation medium through 14 days (Figure 5). SBF was used as the incubation medium in bioactivity tests so pure SBF was used as the control group and percent calcium contents were calculated accordingly. As the calcium phosphate deposition increases in a group, a decrease in the calcium content of the incubation medium was expected. The first significant difference was observed after 7 days of incubation. Calcium deposition onto HA and modified HA-doped groups started to increase after 7 days. With almost no calcium phosphate deposition, PCL had similar calcium content with the control SBF groups through the 14 days. After 14 days of incubation, highest Ca2+ deposition was achieved by GO-containing groups.
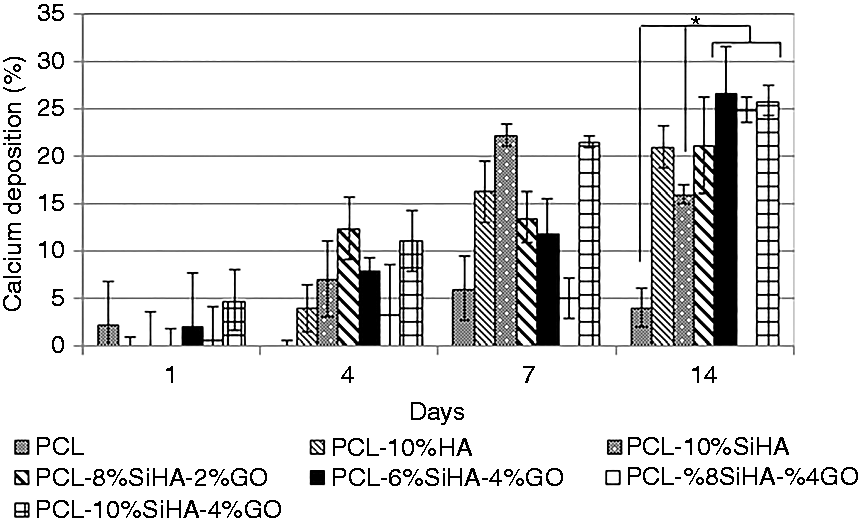
Percent calcium deposition onto scaffold groups after 1, 4, 7 and 14 days of incubation. Pure SBF was accepted as the control and deposited calcium content was calculated accordingly. *Significant difference between the groups (p < 0.05). SBF: simulated body fluid.
Tensile strength test was applied to fibrous scaffolds in order to investigate effects of the incorporated HA groups on fiber mechanic properties (Table 4). The tensile property of PCL did not increase with the addition of HA to the fiber structure. The UTS decreased from 0.38 ± 0.089 to 0.20 ± 0.022 MPa. This could be the result of non-homogeneous distribution of HA through the polymer solution prior to electrospinning. Young’s modulus also decreased after addition of HA and SiHA to PCL fibers. The microstructural difference between HA and PCL was reported to prevent further interfacial bonding. 29 The tensile strength values have further decreased by addition of SiHA. Silicate substitution can dramatically change the surface characteristics of HA. Silicate substitution was reported to increase alkalinity and negative surface charge and when Si substitution increased over 0.8 wt%, hydrophilicity was reported to increase. 30 Compared to HA, SiHA could have further moved off from PCL in terms of structural similarities and there could be less number of interfacial bonding resulting in decreased tensile strength. With the addition of GO, mechanical properties increased parallel to the increasing GO ratio; Young’s modulus also increased to 0.68 ± 0.073. GO was known to enhance mechanical properties of PCL fibrous mats. The reinforcement effect of GO on electrospun PCL fibers was reported to be due to strong interaction between molecular chains of PCL and GO sheets. 31 However, increasing doping amount of SiHA/GO up to total concentration of 12 and 14 wt% of the PCL has decreased the mechanical properties. Decrease in the fiber diameter with increasing density of doped particles in the PCL fibers was thought to be the reason for decreased mechanical properties.
Tensile strength test results of scaffold groups.

SiHA: silicate-doped hydroxyapatite; GO: graphene oxide; PCL: poly(ε-caprolactone).
In vitro cell growth was compared among groups with Alamar Blue assay. PCL scaffold was accepted as the control group and percent cell viabilities of the groups were calculated accordingly. Scaffold groups improved cell proliferation and showed no cytotoxicity on Saos-2 cells. The positive effect of PCL-10%SiHA, PCL-6%SiHA-4%GO, PCL-8%SiHA-4%GO and PCL-10%SiHA-4%GO groups on cell proliferation was noticeable after 4 days of incubation and after 4 and 7 days of incubation 10%SiHA-4%GO-doped groups showed improved cell proliferation compared to other groups.
Silicate substitution to HA mimics the natural bone ionic environment and has previously been reported to improve osteogenic properties of HA by enhancing fibronectin deposition that will improve cell adhesion and development, promoting attachment of bone-related cells, stimulating osteoblastic differentiation and generating more bone ingrowth in in vivo studies. 32 SiHA provides a different crystalline shape that shows different grain boundary structure with significantly more triple junctions per unit area when compared to pure HA that sustains faster dissolution of SiHA. Increased dissolution rate of SiHA was linked with its improved bioactivity and bone remodeling. 8
The addition of GO decreased the total weight percent of the Si in the electrospun matrix since the total inorganic content in electrospun matrix was held fixed. Two percent decrease in the Si content in PCL-8%SiHA-2%GO group also decreased cell proliferation indicating that there is a critical Si concentration to promote cell proliferation. On the contrary, when GO concentration was increased to 4%, proliferation rate of Saos-2 cells were again increased, which supports there is also a critical concentration of GO that needs to be present in order to sustain higher cell proliferation. In the study by Saravanana et al., 33 porous 3D scaffolds prepared with chitosan, gelatin and 0.25% GO content was reported to improve osteoblast differentiation but with no improvement in cell proliferation after addition of GO. Low concentrations of GO in the scaffolds seems to be ineffective on cell proliferations as for the PCL-8%SiHA-2%GO group, which has GO content of 2 wt% that has shown parallel cell growth rate with the control after 7 days of incubation (Figure 6). When the total GO concentration in the group was increased to 4 wt% of the PCL, GO was able to improve Saos-2 proliferation. GO incorporation into PLGA nanofibrous scaffold was reported to increase cell adhesion and proliferation of hMSCs, which has been related to increased hydrophilicity and protein adsorption ability of the GO-incorporated groups. 34 Referring to these findings it has been concluded that there is a minimum level for SiHA and GO to show their bioactivity on cells. The 10 wt% SiHA and 4 wt% GO were more effective concentrations. That is why a new group that has 10 wt% SiHA and 4 wt% GO was also tested for cell proliferation. After 4 and 7 days of incubation an enhanced cell proliferation was sustained. When SiHA and GO was used together at their effective concentrations, an improved bioactivity on Saos-2 cells proliferation was achieved. Previous studies reported that the cytotoxic effect of GO is strongly dependent on characteristics of GO, such as concentration, lateral dimension and surface structure. These characteristics determine the cytotoxicity by modifying internalization and/or surface adsorption of GO. 35 Suspended GO nanoparticles were reported to create toxicity on Saos-2 cells at doses higher than 80 µg/mL. 36 In the present study, GO particles were added as a composite and doped into PCL fibers, which decreased the amount of direct interaction of GO with the incubation medium and no cytotoxicity was observed. Small-sized GOs (0–200 nm) can be internalized easier and reported to create toxicity. 35 The composite of GO with SiHA increased the overall size and could have prevented high rate of internalization and any possible toxicity of GO. A combinational positive effect of both SiHA and GO in the novel composite group of 10%SiHA-4%GO on cell proliferation was observed. A synergistic effect between SiHA and GO on cell proliferation could have been achieved by induction of cell proliferation and metabolism by SiHA 10 and creation of favorable environment for cell growth with spontaneous protein adsorption by GO.
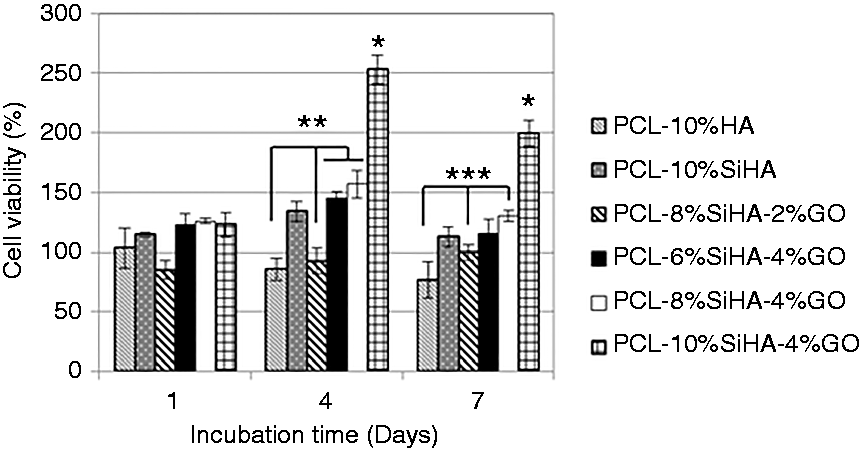
Alamar blue assay results of cells incubated on scaffold groups through 1, 4 and 7 days. Percent cell viabilities were calculated by comparing results with pure PCL scaffold as the control. * Significant difference of the PCL-10%SiHA-4%GO group from all groups after 7 and 14 days of proliferation (p < 0.05). ** Significant difference of the groups PCL-10%HA and PCL-8%SiHA-2%GO from PCL-6%SiHA-4%GO and PCL-8%SiHA-4%GO (p < 0.05). *** Significant difference of PCL-8%SiHA-4%GO group from PCL-10%HA and PCL-8%SiHA-2%GO groups (p < 0.05). SiHA: silicate-doped hydroxyapatite; GO: graphene oxide; PCL: poly(ε-caprolactone).
ALP assay was performed in order to investigate osteoblastic differentiation of Saos-2 cells and results are present in Figure 7. After the first week of incubation, all doped groups showed higher ALP activity than control and pure PCL groups. After 14 days of incubation, 10%SiHA-4%GO doped group showed the highest ALP activity that was parallel with increasing concentrations of SiHA and GO. In literature, for osteogenic differentiation the Si substitution ratio to calcium phosphates was preferred as 0.8 wt% Si as the 0.8 wt% and 1.5 wt% were reported optimal for inducing osteogenic behavior. In the study of Cameron et al., 37 greater osteogenic differential potential was created for MSCs when discs with Si-substituted HA were used. After 14 days of incubation, ALP activity of the control, PCL and PCL-6%SiHA-4%GO groups were lower than other groups. The lower ALP activity of the PCL-6%SiHA-4%GO group proved the effect of SiHA concentration. PCL-6%SiHA-4%GO group has lower SiHA concentration compared to groups with 8 and 10 wt% SiHA that seems to be the main reason for decreased ALP activity. GO concentration showed no relationship with ALP activity of the cells.
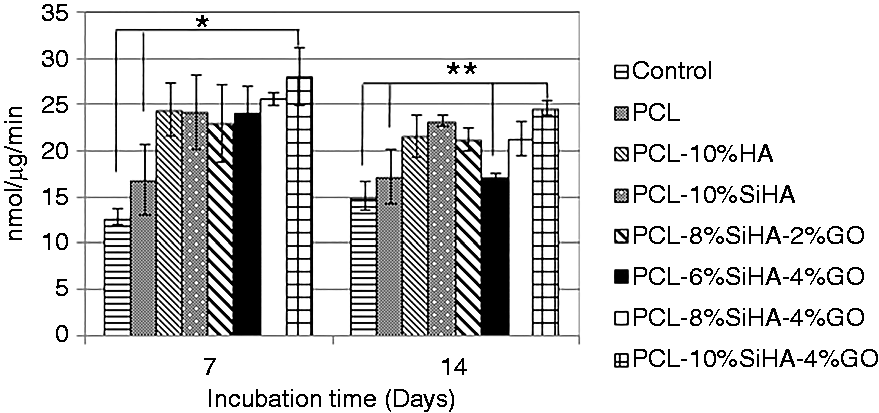
ALP activity of scaffold groups after 7 and 14 days of incubation. * Significant difference of PCL-10%SiHA-4%GO group from the control and PCL groups (p < 0.05). ** Significant difference of PCL-10%SiHA-4%GO group from the control, PCL and PCL-6%SiHA-4%GO groups (p < 0.05). SiHA: silicate-doped hydroxyapatite; GO: graphene oxide; PCL: poly(ε-caprolactone). ALP: alkaline phosphatase.
Cell attachment and morphology on scaffolds were determined by SEM imaging after 7 days of incubation on scaffolds and cell fixation (Figure 8). Better cell adhesion was observed with SiHA scaffolds compared to HA scaffolds. In the study by Thian et al.,11,38 increased cell attachment and growth were reported when SiHA was compared to HA coatings and this improvement was linked with altered surface of SiHA that triggers biomineralization and more protein adsorption. Enhanced adsorption of proteins was explained by the formation of a silicate network by the interaction of released Si with oxygen. This formation of silicate species on the SiHA was also suggested to induce specific confirmation of adsorbed proteins that can increase cell attachment. Increased surface affinity to key adhesion proteins was reported. 39 Well-flattened cells and mineral deposition on cell surface were observed on the PCL-6%SiHA-4%GO, PCL-8%SiHA-4%GO and PCL-10%SiHA-4%GO scaffold groups. Larger surface area covered by cells with cell sheet formation was observed, which indicates better cell-surface interaction. The enhanced cell adhesion and spread in GO-incorporated scaffolds were related with increased protein adsorption capacity. As seen in the protein adsorption studies, GO-incorporated groups had the highest protein adsorption that was parallel with proliferation and cell attachment results. The increased protein adsorption capacity of GO was explained with GO’s capability to increase hydrophilicity in the structure. 34
SEM images of Saos-2 cells incubated on (a and b) PCL, (c and d) PCL-10%HA, (e and f) PCL-10%SiHA, (g and h) PCL-8%SiHA-2%GO, (i and j) PCL-6%SiHA-4%GO, (k and l) PCL-8%SiHA-4%GO and (m and n) PCL-10%SiHA-4%GO scaffold groups after 7 days of incubation. Images were taken at ×20,000 and ×5000 magnification with scale bars showing 5 μm and 20 μm lengths. SiHA: silicate-doped hydroxyapatite; GO: graphene oxide; PCL: poly(ε-caprolactone); SEM: scanning electron microscopy.
Confocal laser scanning microscopy analysis was used to observe the spreading area of cells on scaffold groups. The confocal images of cells after 1 day of incubation on scaffolds are presented in Figure 9. All images were produced by projection of Z-stack images since cells were distributed inside the fibrous scaffolds. Saos-2 cells incubated on scaffold groups without GO showed minimum spreading and round morphology (Figure 9(a) to (c)). On the other hand, cells incubated on scaffolds with GO content showed a spreading morphology with flattened shape and increased number of outstretched lamellipodia-like extensions alongside the fibers (Figure 9(d), (f) and (g)). However, cells incubated on the group of PCL-6%SiHA-4%GO did not show a well-spread morphology like other GO-bearing groups, which proves that GO alone was not enough to promote cell spreading (Figure 9(e)). Presence of SiHA at a minimum concentration of 8% in the composite was essential to create synergistic effect with GO to increase spreading. Percent cell adhesion was determined by DNA quantification after 4 h of incubation of cells on scaffolds. Scaffold groups with higher GO ratio (PCL-6%SiHA-4%GO, PCL-8%SiHA-4%GO and PCL-10%SiHA-4%GO) showed improved cell adhesion (Figure 9(h)). Percent cell adhesion was only affected by the GO in the composites and increased parallel to the GO ratio in the composite. Individual cell spread areas were calculated from confocal images with ImageJ software, and results were correlating with the observations made from confocal images (Figure 9(i)). Cells incubated on PCL-10%SiHA-4%GO scaffold had the highest spreading area among the groups.
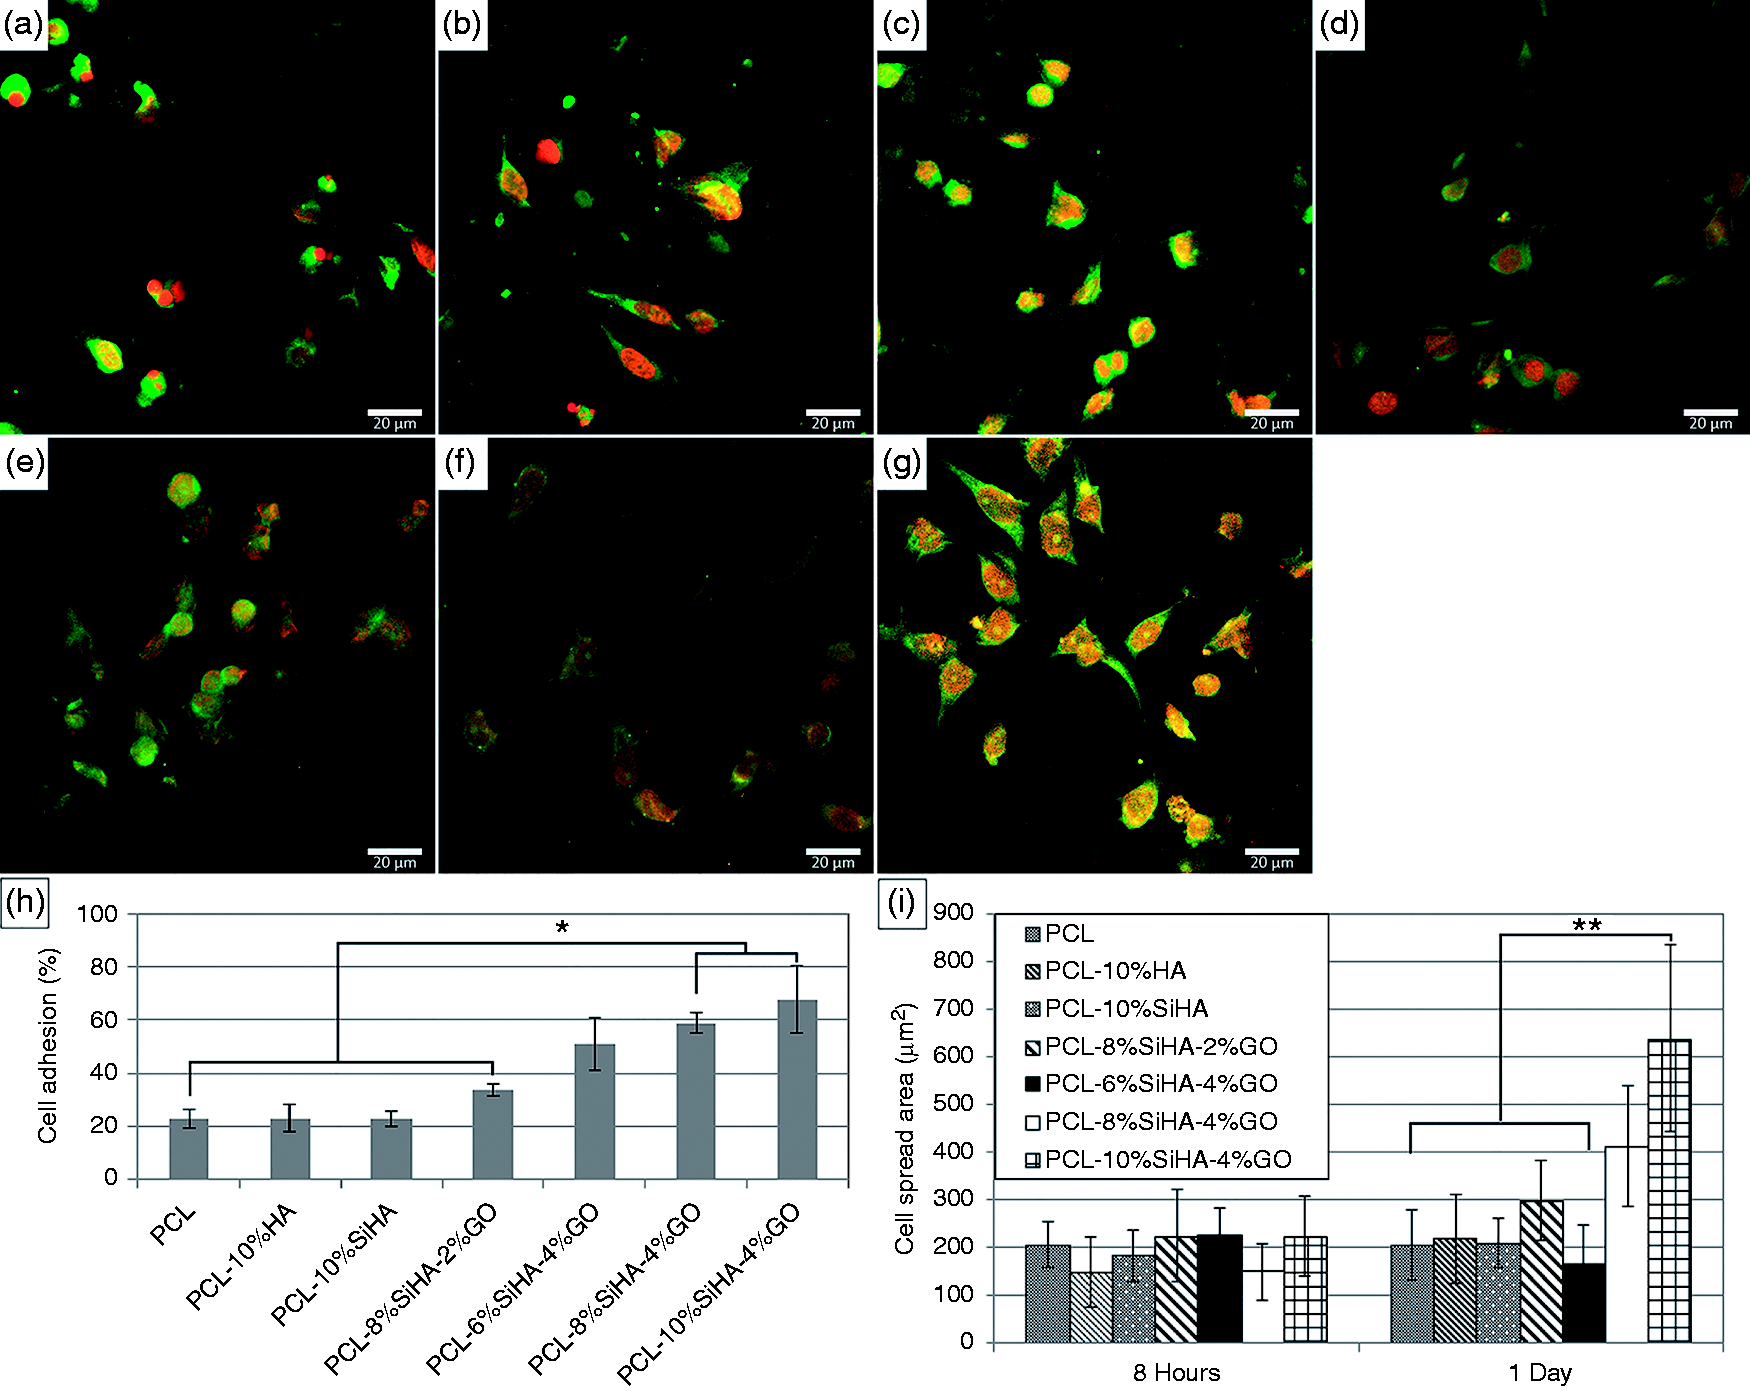
Confocal images of Saos-2 cells incubated for 1 day on (a) PCL, (b) PCL-10%HA, (c) PCL-10%SiHA, (d) PCL-8%SiHA-2%GO, (e) PCL-6%SiHA-4%GO, (f) PCL-8%SiHA-4%GO and (g) PCL-10%SiHA-4%GO scaffold groups. Cytoskeleton and nucleus were labelled with Alexa flour 488 and DAPI. (h) Percent cell adhesion onto the scaffold groups after 4 h of incubation with cells. (i) Spread area of cells after 8 h and 1 day of incubation on scaffold groups. * Significant difference of PCL-8%SiHA-4%GO and PCL-10%SiHA-4%GO groups from other groups (p < 0.05). ** Significant difference of PCL-10%SiHA-4%GO group from the other groups (p < 0.05). SiHA: silicate-doped hydroxyapatite; GO: graphene oxide; PCL: poly(ε-caprolactone).
Cell-surface interactions like attachment and spreading mainly depend on initial adsorption of proteins. Adsorbed extracellular proteins create a network for attachment of cells and further influence the cell spreading by generating intracellular signals. Protein adsorption depends on physicochemical properties of the surface like presence of active groups. 40 GO bears oxygen-containing groups such as epoxides, hydroxyls and carboxylic acids, which are known to facilitate spontaneous protein adsorption. 41 Protein adsorption and desorption study showed that increasing GO ratio in the composite improved the protein adsorption rate of scaffolds (Figure 3). It was clearly seen that percent cell adhesion results of scaffold groups were directly related to the GO ratio of composite groups. SiHA ratio in groups showed no effect on initial attachment of cells. On the other hand, degree of cell spreading was strongly dependent on the presence of SiHA and GO together while being directly affected by SiHA ratio in the composite (Figure 9(i)). SiHA is known to promote proliferation of osteoblast-like cells. 10 The mechanism of this synergistic activity between SiHA and GO could be the enhancement of cell metabolism and proliferation by SiHA and creation of a more favorable environment for cell spreading with spontaneous deposition of proteins by GO.
Conclusion
In this study, a novel composite was produced by silicate substitution to HA and incorporation of GO. The composite was doped in 3D PCL electrospun scaffolds, in order to investigate their possible use for bone tissue engineering. In protein adsorption studies, the scaffold groups with GO showed high protein adsorption with very little desorption compared to HA and SiHA groups. Protein adsorption increased with increasing GO content in the structure. Parallel to protein adsorption results, Saos-2 cell proliferation rate was increased with increasing GO ratio. PCL-10%SiHA-4%GO group showed higher cell proliferation compared to other groups with lower SiHA or GO concentrations, which supports there is an effective concentration for SiHA and GO in order to induce proliferation. The groups with 8 wt% and higher concentrations of SiHA showed higher ALP activity. ALP activity of the group with 6 wt% SiHA was lower, which showed the relation between SiHA level and ALP activity. The GO concentration showed no effect on ALP activity. Increased cell attachment and adhesion observed on GO-doped scaffolds were parallel with increasing protein adsorption with higher GO content while cell spreading behavior was improved by combinational act of both SiHA and GO. As conclusion, possible bone inductive properties of SiHA/GO composite were studied on electrospun PCL scaffolds with Saos-2 cell line. Effective doping concentration of SiHA/GO composite was determined for proliferation and ALP activity of cells. The novel composite promoted a synergistic activity of SiHA and GO on cell proliferation and spreading. The PCL-10%SiHA-4%GO scaffold supported improved proliferation and ALP activity and showed that SiHA and GO composites are promising candidates for applications in bone tissue engineering.
Supplemental Material
Supplementary figure - Supplemental material for Silicate-doped nano-hydroxyapatite/graphene oxide composite reinforced fibrous scaffolds for bone tissue engineering
Supplemental material, Supplementary figure for Silicate-doped nano-hydroxyapatite/graphene oxide composite reinforced fibrous scaffolds for bone tissue engineering by Ali Deniz Dalgic, Ammar Zeidan Alshemary, Ayşen Tezcaner, Dilek Keskin and Zafer Evis in Journal of Biomaterials Applications
Footnotes
Declaration of Conflicting Interests
The author(s) declared no potential conflicts of interest with respect to the research, authorship, and/or publication of this article.
Funding
The author(s) received no financial support for the research, authorship, and/or publication of this article.
Supplementary Material
Supplementary material is available for this article online.
References
Supplementary Material
Please find the following supplemental material available below.
For Open Access articles published under a Creative Commons License, all supplemental material carries the same license as the article it is associated with.
For non-Open Access articles published, all supplemental material carries a non-exclusive license, and permission requests for re-use of supplemental material or any part of supplemental material shall be sent directly to the copyright owner as specified in the copyright notice associated with the article.