
Abstract
This study was conducted to examine morphological, genotypic, and phenotypic alterations occurring in cultured adult human retinal pigment epithelial cells when encapsulated with different concentrations of fibrin glue. Cultivated adult human retinal pigment epithelial cells were encapsulated with different concentrations of fibrin glue, namely FG1 (42 mg/dl), FG2 (84 mg/dl), FG3 (124 mg/dl), FG4 (210 mg/dl), followed by the evaluation of genetic and cytomorphological changes and protein expression. Cultured adult human retinal pigment epithelial cells showed dendritiform morphology during the early days of encapsulation with fibrin glue. Moreover, an increasing inhibitory effect on cell growth was observed with increasing concentrations of fibrin glue. At the transcriptional level, the expression of MMP2, PAX6, and ITGB1 in FG1-encapsulated cells was significantly higher than that in other treated groups; however, the expression of ACTA2 was lower in all fibrin glue-encapsulated groups compared to that in the controls. Immunocytochemistry showed that FG2-encapsulated cells expressed cytokeratin 8/18, RPE65, and ZO-1 proteins, but not PAX6. In conclusion, fibrin glue at a concentration of 84 mg/dl allows proper encapsulation of adult human retinal pigment epithelial cells, while preserving the morphometric, genotypic, and phenotypic features of the cells. This three-dimensional biopolymer can be considered a reliable vehicle for retinal pigment epithelium cell transplantation in cell-based therapies.
Introduction
Retinal pigment epithelium (RPE) has a pivotal role in the preservation of visual function through close interaction with photoreceptors and maintenance of retinal homeostasis. 1 Age-related macular degeneration and retinitis pigmentosa are clear examples of RPE dysfunction with no established effective method of treatment and the most common causes of blindness worldwide. 2 As a new treatment approach, regeneration or replacement of the degenerated cells has been addressed in multiple clinical trials using cultured RPE cells.3–7 Proper maintenance and delivery of cultivated RPE cells as well as adhesion of these cells to the residual Bruch’s membrane are important stages in this process, necessary to achieve favorable results. 8 Therefore, several studies were conducted to culture RPE cells on a variety of biological and synthetic scaffolds, such as amniotic membrane, Descemet’s membrane, collagen substrates, and poly (e-caprolactone).9–12
Fibrin glue (FG) is a biocompatible and biodegradable platform with great potential for use in tissue engineering and regenerative medicine, serving as a cellular and pharmaceutical vehicle.13–16 FG, as an accessible three-dimensional (3D) scaffold, has an extraordinary ability to support the growth of different complex cells, such as cord blood hematopoietic stem cells. 17 Since this natural biopolymer can be prepared as an autologous product, it might reduce the risk of rejection in RPE cell allografts. In this study, we treated cultured adult human retinal pigment epithelial (ahRPE) cells with different concentrations of FG and investigated their corresponding morphological, genotypic, and phenotypic features.
Materials and methods
Samples
The posterior sections of the eyes of two adult donors (aged 40 and 41 years) with a death-to-preservation time of <24 h were obtained from the Central Eye Bank of Iran. The study was approved by the Ethics Committee of the Ocular Tissue Engineering Research Center at the Shahid Beheshti University of Medical Sciences (Tehran, Iran).
Isolation and cultivation of ahRPE cells
The tissues were kept at 4°C in a moist chamber containing antibiotics and transferred immediately to the cell culture laboratory. As described previously, 18 the posterior human eyecups were dissected into four quadrants by radial incision. After removal of the sensory retina along with the vitreous, the RPE/choroidal layer was separated from the sclera with forceps and incubated in 2% dispase (Gibco, Godo Shusei Co., Ltd, Tokyo, Japan) for 1 h at 37°C with 5% CO2. The digested tissue was then transferred into a T25 flask containing Dulbecco’s modified Eagle’s medium and Ham’s F12 (DMEM/F12; GIBCO-BRL, Eggenstein, Germany) and 20% fetal bovine serum (GIBCO-BRL, Eggenstein, Germany) and incubated at 37°C in a humidified atmosphere containing 5% CO2. All experiments were performed using cultured ahRPE cells at 90% confluency and at passage 3–5. The cells were assessed by immunocytochemistry (ICC) for RPE65 and cytokeratin 8/18 expression, which are specific markers for RPE cells.
FG preparation
Cryoprecipitates were obtained from the Iranian Blood Transfusion Organization and pooled to achieve a final fibrinogen concentration of 420 mg/dl. Four different dilutions of the fibrinogen solution were prepared. Pooled fresh plasma-derived thrombin was obtained from three healthy donors, who tested negative in the serological tests for human immune deficiency virus and hepatitis B virus. Briefly, 10% calcium gluconate, at 1:5 dilution, was added to the plasma sample and after a 1 h incubation at 37°C, the mixture was centrifuged at 800 ×g for 10 min. The supernatant was collected and stored at −20°C.19,20 In order to obtain four different concentrations of FG (FG1, FG2, FG3, and FG4), thrombin (1:10 ratio) was added to different dilutions of fibrinogen prepared in the culture medium at 37°C, and an FG with a mean diameter of 2–3 mm was formed within 4 min.
Encapsulation of ahRPE cells
To encapsulate ahRPE cells with FG solutions at different concentrations, different dilutions of fibrinogen were added to the cell culture wells, followed by the addition of the thrombin in situ to develop a 3D structure after homogenization. Morphometric changes to the encapsulated RPE cells were evaluated and photographed on days 1, 3, and 5 with an inverted microscope (Olympus IX71; Tokyo, Japan) equipped with a digital camera (Olympus U-TV0.63XC; Tokyo, Japan). To quantify the morphological differences of encapsulated ahRPE cells in different FG concentrations in comparison to the controls, ImageJ software (ImageJ 1.48; National Institute of Mental Health; http://rsb.info.nih.gov/ij/) was used to calculate the single cell spreading area on the scaffold in each group. Three photomicrographs of the cultured cells were chosen in each group and mean spreading area of five cells in each photograph was calculated and compared between FG-encapsulated and the control groups.
Cell viability assay
After encapsulation of 1500 ahRPE cells per well (as subconfluent cultures) in 96-well plates with four concentrations of FG, cell viability assay using 3-(4,5-dimethylthiazol-2-yl)-2,5-diphenyltetrazolium bromide (MTT) was performed on days 1, 3, and 5. MTT assay has been considered for cell viability in a large series of studies. 21 Briefly, ahRPE cells in each well were incubated with MTT (0.5 g/ml; Sigma-Aldrich, Munich, Germany) for 4 h until a purple precipitate was visible. The culture medium and MTT were then replaced with 100 µl of dimethyl sulfoxide (DMSO; Merck, Darmstadt, Germany), and the wells were left standing at room temperature in darkness for 2 h. The absorption at 540 nm was recorded using an ELx 808 Absorbance Reader (BioTek Instruments; Winooski, VT, USA).
Colony-forming assay
The assay was performed using fibrin-coated 6-well plates. ahRPE cells at a density of 103 viable cells per well were plated and incubated with DMEM/F12 containing amphotericin B (2 g/ml) and gentamicin (50 g/ml). After three days, the colonies were incubated with 0.5 mg/ml MTT for 1 h. Intracellular dehydrogenases convert MTT to blue formazan, thus, changing the color of the cells to blue. To quantify the colony spreading area, after selecting three photomicrographs of colony assay in each study group, the colony spreading area was calculated using ImageJ software (ImageJ 1.48; National Institute of Mental Health; http://rsb.info.nih.gov/ij/).
RNA extraction and gene expression assay
For molecular analyses, considering the results of MTT assay, 5 × 10⁴ ahRPE cells in T25 flasks were encapsulated with those FG concentrations that revealed acceptable cell viability results. After five days, RNA extraction was initiated with cell lysis induced by TRIzol reagent (Life Technologies Corporation; Carlsbad, CA, USA), followed by the addition of chloroform to extract RNA. Isopropanol was then added to precipitate RNA, followed by dissolution in nuclease-free water. The concentration and purity of the isolated RNA were determined using a NanoDrop spectrophotometer (Thermo Fisher Scientific; Wilmington, DE, USA), and the integrity of RNA was verified by agarose gel electrophoresis.
To perform quantitative real-time polymerase chain reaction (RT-PCR), oligo dT primers and the SuperScript reverse transcriptase kit (Promega, USA) were used for reverse transcription. An EvaGreen QPCR master mix (Solis BioDyne, Estonia) was used for RT-PCR, with the following PCR parameters: initial denaturation (one cycle at 95°C for 15 min); denaturation, amplification, and quantification for 40 cycles at 95°C for 15 s, 56–64°C for 17 s, and 72°C for 25 s; melting curve at 65°C, with the temperature being gradually increased to 95°C. The mRNA expression was normalized to that of glyceraldehyde 3-phosphate dehydrogenase mRNA, and the changes were calculated according to the standard curve and efficiency (E) for each primer. Primer sequences used for RT-PCR are listed in Table 1.
Primer sequences.
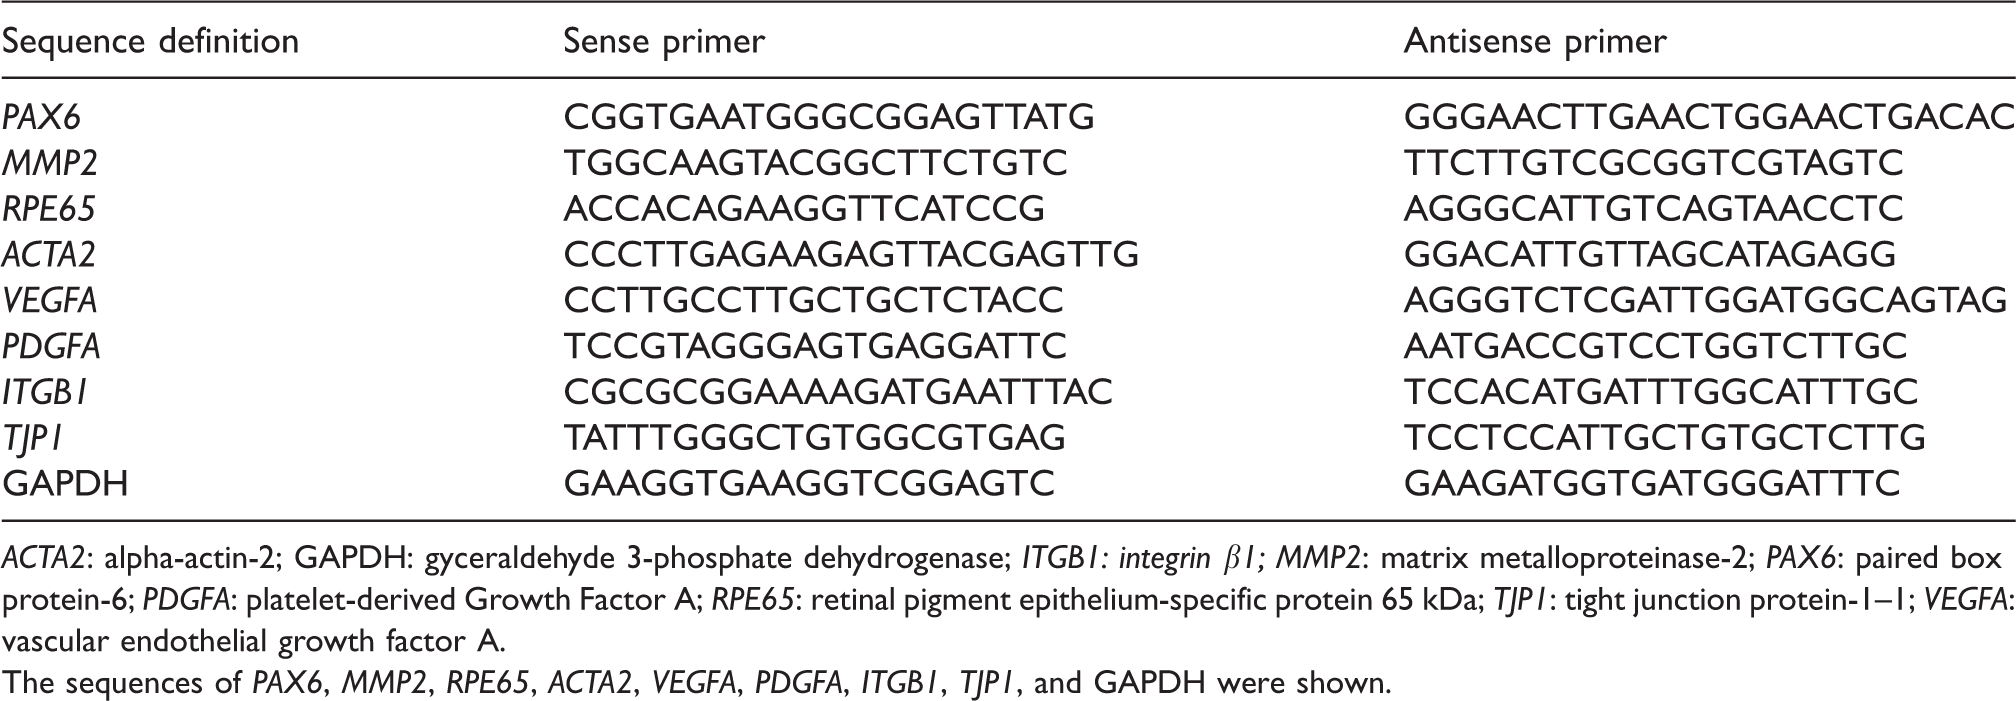
ACTA2: alpha-actin-2; GAPDH: gyceraldehyde 3-phosphate dehydrogenase; ITGB1: integrin β1; MMP2: matrix metalloproteinase-2; PAX6: paired box protein-6; PDGFA: platelet-derived Growth Factor A; RPE65: retinal pigment epithelium-specific protein 65 kDa; TJP1: tight junction protein-1–1; VEGFA: vascular endothelial growth factor A.
The sequences of PAX6, MMP2, RPE65, ACTA2, VEGFA, PDGFA, ITGB1, TJP1, and GAPDH were shown.
ICC
For ICC and scanning electron microscopy (SEM), 104 ahRPE cells were encapsulated with FG2 in 24-well plates. For ICC analysis, after five days, the cells were fixed with ice-cold methanol (Merck), blocked with a blocking solution containing 1% bovine serum albumin (Merck) in 1% Triton X-100 in phosphate-buffered saline (PBS; Sigma-Aldrich), and then incubated overnight at 4°C in a diluted solution of anti-PAX6 antibody (1:200 goat polyclonal IgG; Santa Cruz Biotechnology Inc., Dallas, USA), anti-RPE65 antibody (1:200 rabbit polyclonal IgG; Santa Cruz Biotechnology Inc., Dallas, USA), anti-ZO-1 antibody (1:200 rabbit polyclonal IgG; Santa Cruz Biotechnology Inc., Dallas, USA), and anti-Cytokeratin 8/18 antibody (NCL-5D3) (1:200 mouse monoclonal IgG2a; Santa Cruz Biotechnology Inc., Dallas, USA). After washing with PBS, fluorescein isothiocyanate (FITC)-conjugated donkey anti-goat IgG (1:100; Santa Cruz Biotechnology Inc., Dallas, USA), FITC-conjugated goat anti-rabbit IgG (1:100; Santa Cruz Biotechnology Inc., Dallas, USA), FITC-conjugated goat anti-rabbit IgG (1:100; Santa Cruz Biotechnology Inc., Dallas, USA), and FITC-conjugated goat anti-mouse IgG (1:100; Santa Cruz Biotechnology Inc., Dallas, USA) were added to the samples incubated with PAX6, RPE65, ZO-1, and cytokeratin 8/18, respectively, for 45 min at room temperature in the dark. The cells were then stained with 4′,6-diamidino-2-phenylindole (DAPI) (1 mg/ml; Santa Cruz Biotechnology Inc., Dallas, USA) for 5 min and examined under an inverted microscope (Olympus IX71; Tokyo, Japan) equipped with a 460 nm filter for DAPI and a 520 nm filter for FITC-conjugated antibodies. Finally, corrected total cell fluorescence (CTCF) was obtained by ImageJ software (ImageJ 1.48; National Institute of Mental Health; http://rsb.info.nih.gov/ij/) and the mean values were compared between the FG2-encapsulated and control cells.
SEM
The structure and degradation of cells at different concentrations of FG were investigated by SEM. For structural analysis, FG1, FG2, FG3, and FG4 were individually applied on cover slips. For degradation analysis, ahRPE cells encapsulated with FG2 were seeded on cover slips on days 1, 3, and 5 after encapsulation. The cover slips were fixed in 2.5% glutaraldehyde solution, dehydrated with increasing concentrations of ethanol (30, 50, 70, and 85% ethanol, each for 15 min, followed by 100% ethanol for 30 min), coated with gold/palladium, and evaluated by SEM (KYKY-EM3200; Technology Development Ltd, China). The corresponding photomicrographs of the FG scaffolds were analyzed in terms of pore sizes, fibrin fiber thicknesses, and morphology of the overlying cells.
Statistical analysis
For cell viability, we used Kruskal–Wallis and multiple comparison tests to evaluate the differences among groups. RT-PCR was performed for a minimum of three independent experiments. Each sample was run in duplicate. Differences between the samples from the groups were analyzed using Kruskal–Wallis test. A P value of <0.05 was considered statistically significant.
Results
Cultivation and immune characterization of ahRPE cells and morphological results
Cultivated ahRPE cells reached 80% confluence by the second week and more than 90% of cultivated cells were immune reactive for RPE65 and cytokeratin 8/18, confirming their RPE identity. FG-encapsulated cells demonstrated a morphologic change, from round-shaped structures on day 0 to elongated forms with dendritiform extensions on days 1 and 3. On day 1, mean of single cell spreading area in the FG-encapsulated cells (1670.83 µm2 in FG1, 2288.92 µm2 in FG2, and 1405.99 µm2 in FG3) was higher than the control (930.46 µm2), significantly in the FG2-encapsulated cells (P = 0.002). On day 3, mean of single cell spreading area in FG2-encapsulated cells (2998.76 µm2) was significantly higher than FG1-encapsulated (939.94 µm2, P = 0.03) and control (844.75 µm2, P = 0.003) groups but was not different notably from FG3-encapsulated group (2148.70 µm2). After digesting the 3D FG scaffold, the cells migrated to the two-dimensional surface of the cell culture flask and acquired a mixture of epithelioid and neural-like morphologies on day 5 (Figure 1). At this time, mean of single cell spreading area in the FG-encapsulated cells (570.45 µm2 in FG1, 616.53 µm2 in FG2, and 553.95 µm2 in FG3) was not significantly different from the control (534.65 µm2).
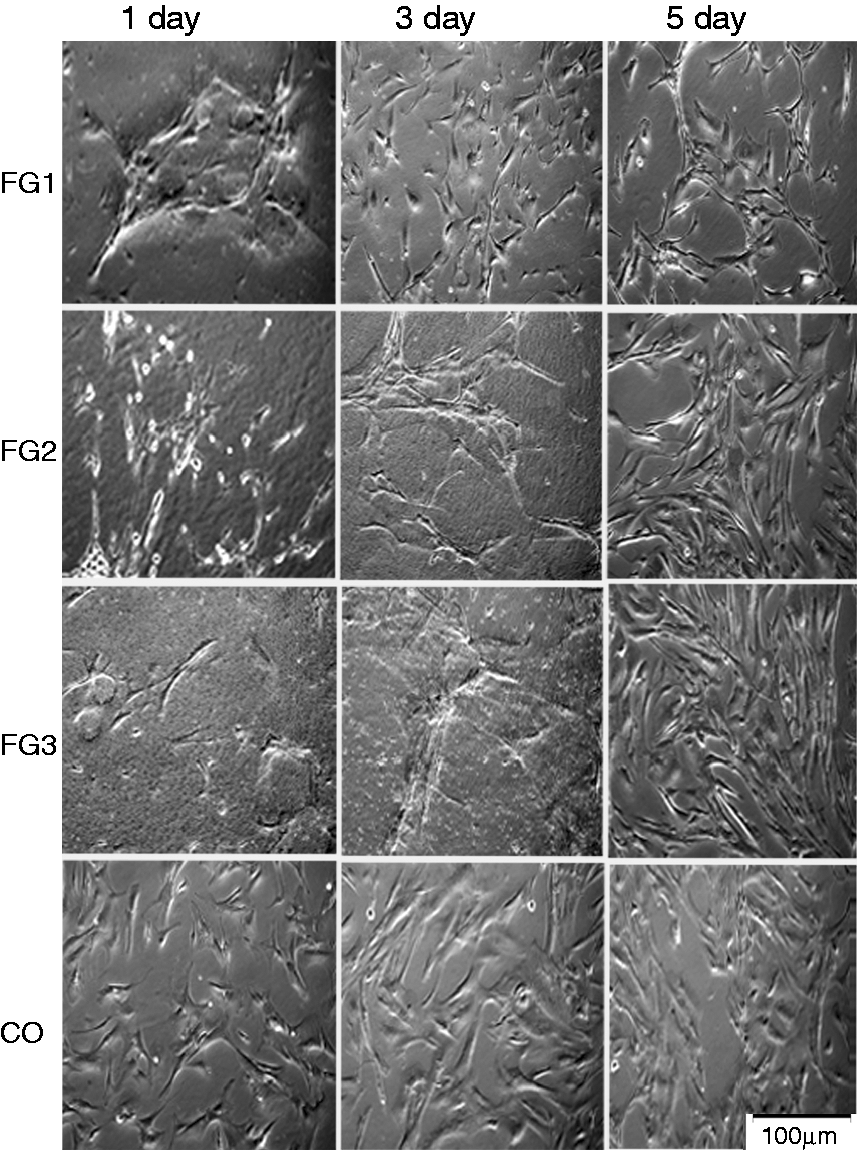
Photomicrographs of ahRPE cells encapsulated with three concentrations of FG versus controls. Note the epithelioid morphology of the control cells (CO) on days 1, 3, and 5 and an extended morphology of FG-treated cells (FG1, FG2, FG3) with dendritiform extensions on days 1 and 3. The FG-treated cells demonstrate the epithelioid morphology on day 5.
Cell viability and colony-forming assay
With increasing FG concentrations, cell viability was found to decrease on days 1, 3, and 5, compared to that of the controls. This decrease was statistically significant in ahRPE cells encapsulated in FG4 on day 1 (P = 0.02) and 3 (P = 0.014), compared to the control, and on day 5 (P = 0.035), compared to FG2 (Figure 2). To determine the reason for reduced cell viability, the encapsulated cells were photographed on day 3, 4 h after exposure to MTT. A physical barrier induced by high concentrations of FG seems to prevent the spread and growth of cultivated ahRPE cells. The colony-forming assay showed the migration and spread of encapsulated cells from the center of the colony, which gradually acquires a dendritiform morphology with decreasing FG concentration (Figure 3). There was a decreasing trend in mean spreading area of the colonies from the lower (128,615 µm2 in FG1 and 89,633 µm2 in FG2) to the higher (46,641 µm2 in FG3 and 16,205 µm2 in FG4) FG concentrations. The mean colony spreading area in the control group (175,381 µm2), although was higher than all FG-encapsulated groups, was statistically different only with that of FG4 (P = 0.001).
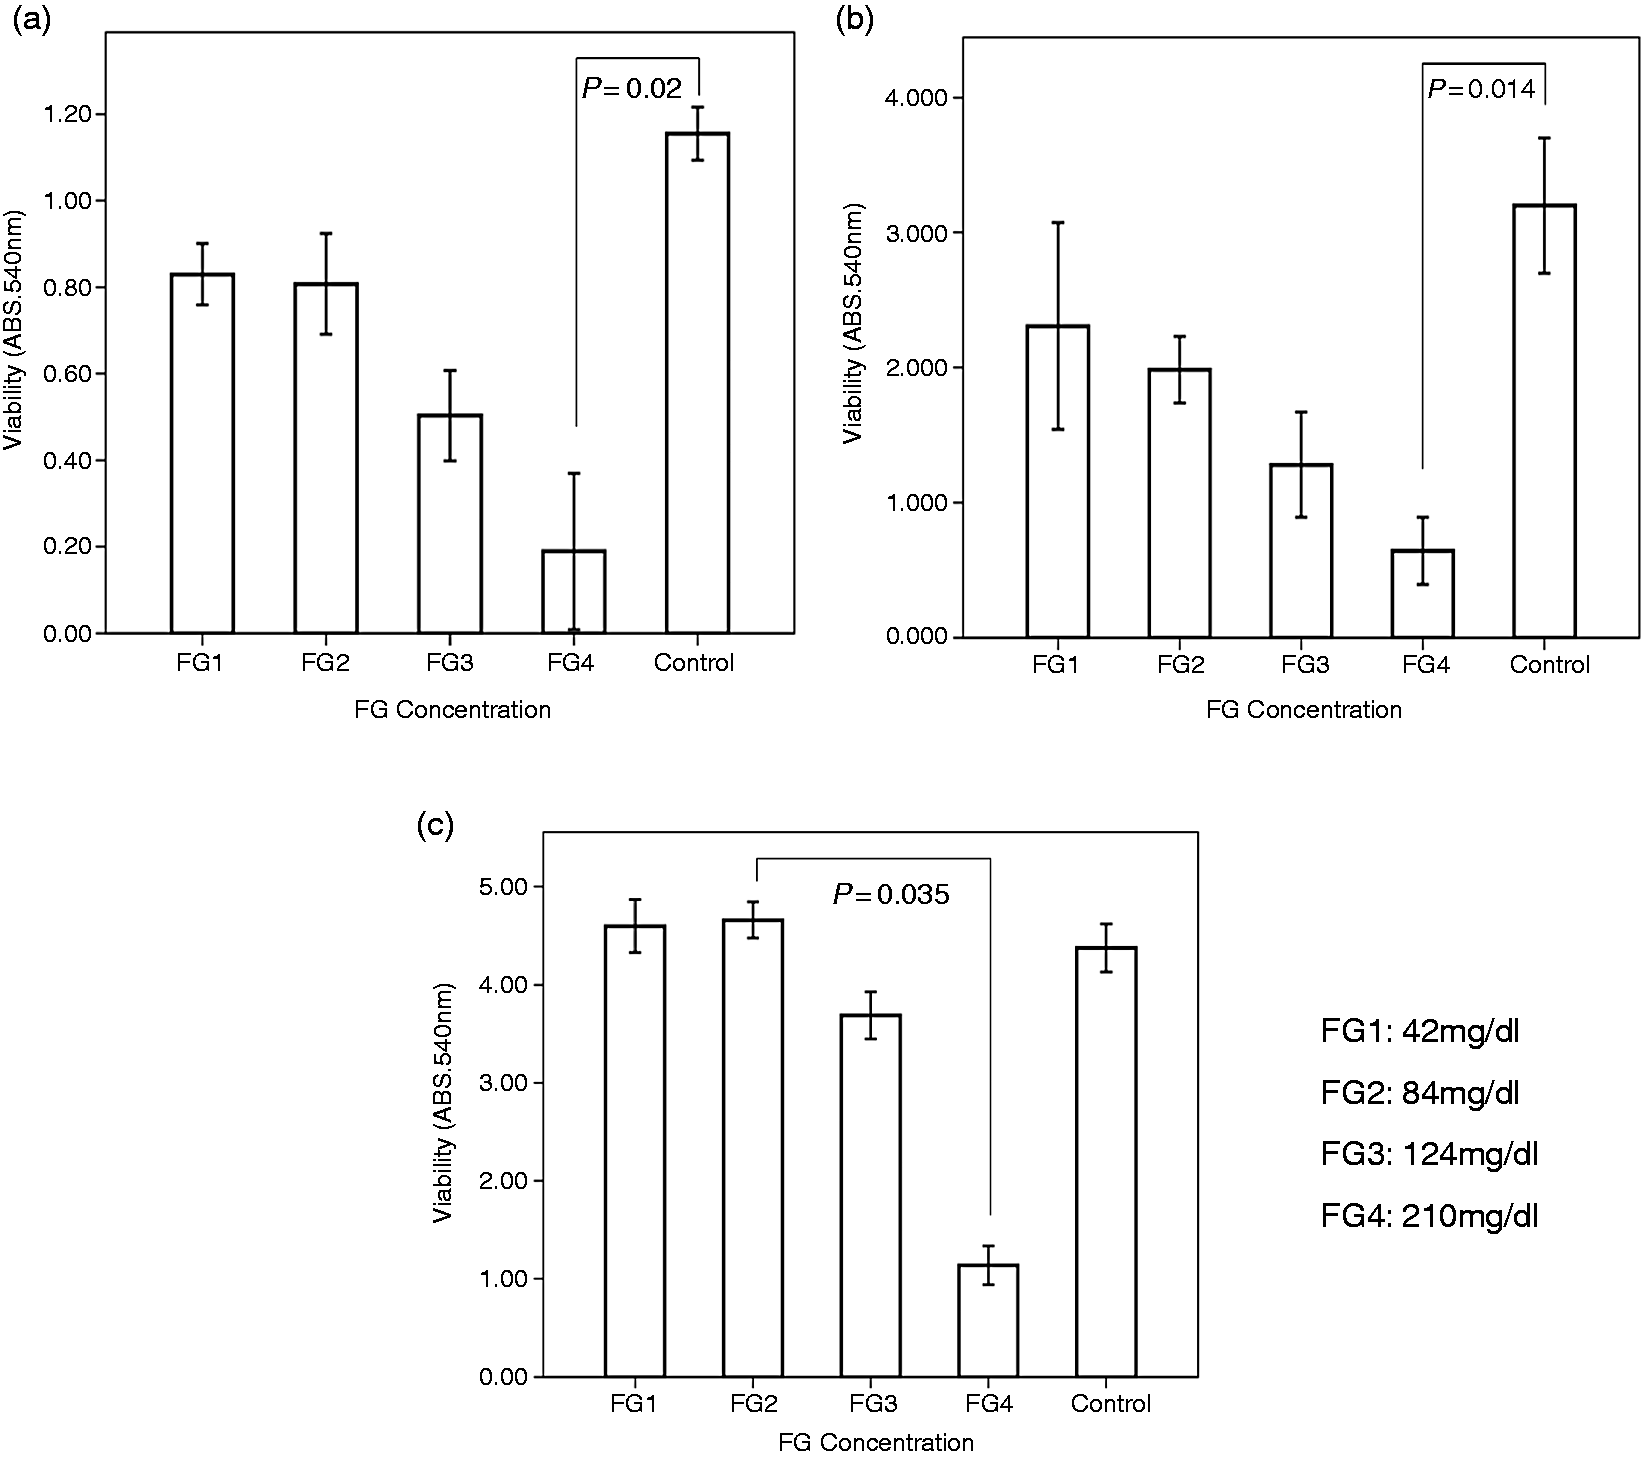
Viability of cultivated ahRPE cells (a) 1, (b) 3, and (c) 5 days after treatment with different concentrations of FG. Note the decreased viability of ahRPE cells treated with different concentrations of FG as compared to the controls on days 1, 3, and 5. A decreased viability of ahRPE cells is observed after treatment with FG4 on days 1 and 3 as compared to control (P = 0.02 and P = 0.014) and on day 5 as compared to FG2 (P = 0.035). FG: fibrin glue.
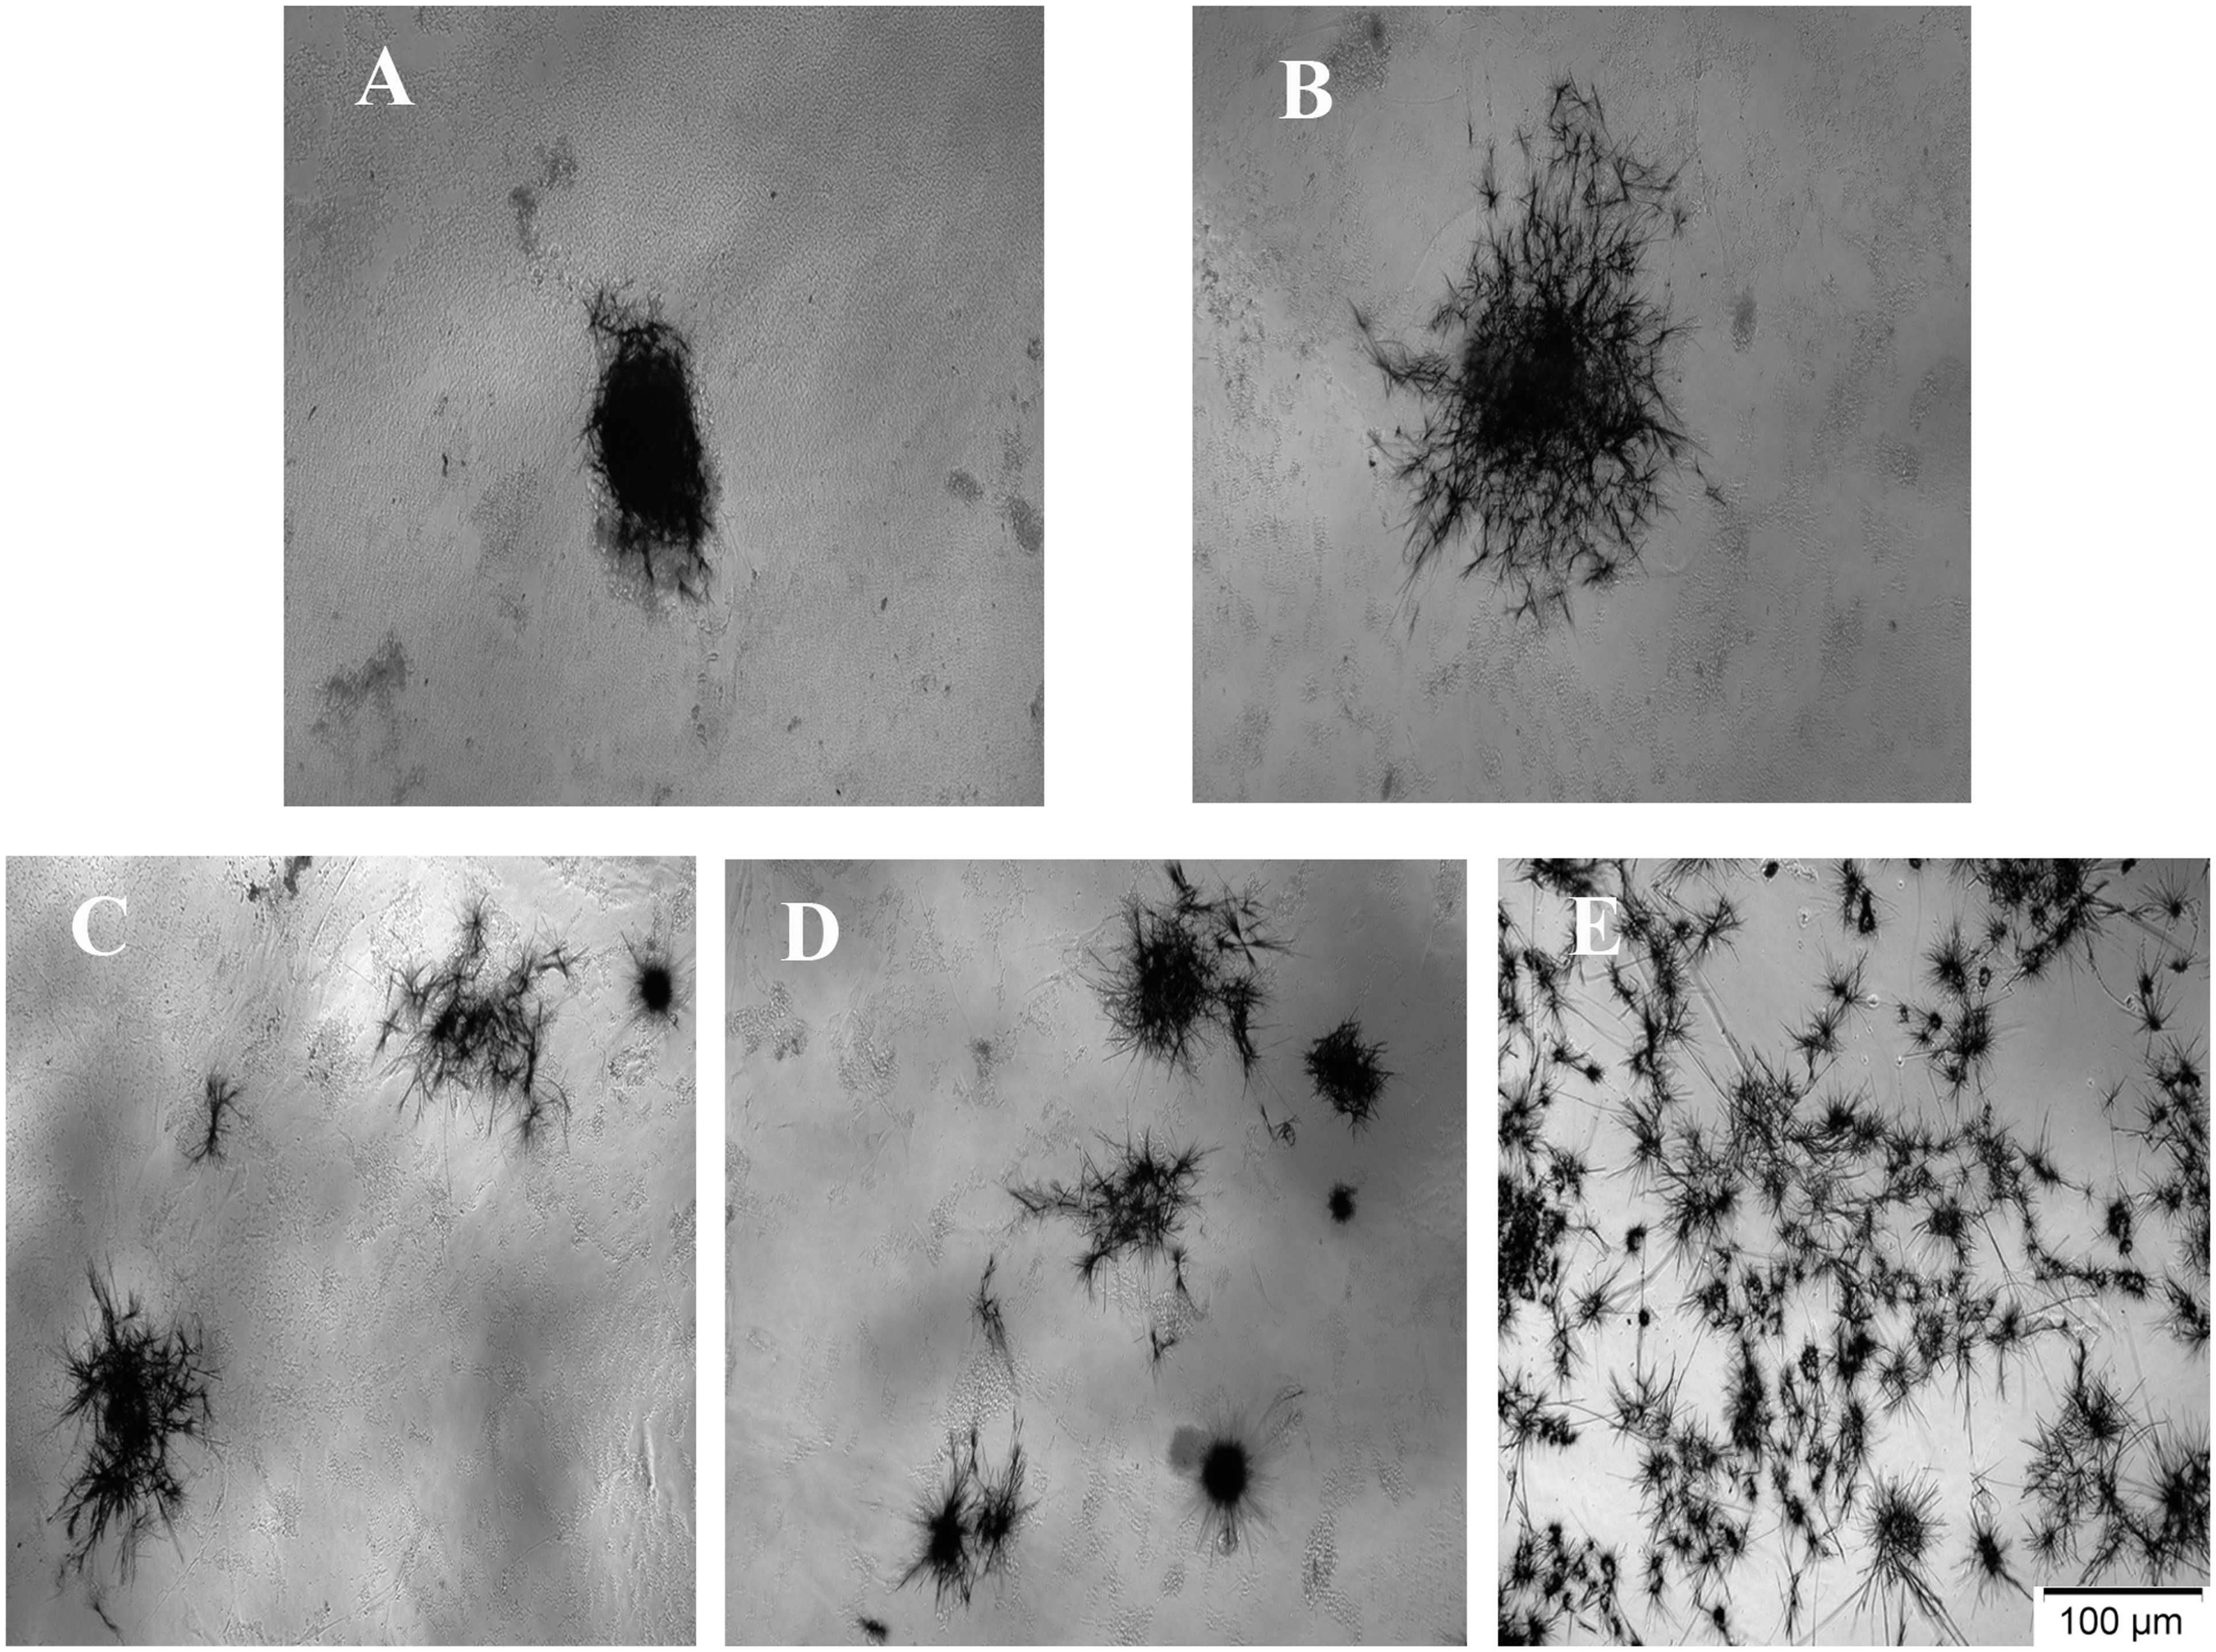
Colony assay of ahRPE cells encapsulated with three concentrations of FG (a–d) versus controls (E). Note the coherent colony formation of RPE cells at FG4 concentration (A), and decreased integrity of the colonies in FG3 (B), FG2 (C), and FG1 (D). The cells tend to migrate and spread with reduction of FG concentration.
Gene expression profile
Given that the MTT results for FG4 were not acceptable, this group was excluded from the molecular analyses. ahRPE cells encapsulated in FG1, compared to those encapsulated in other FG concentrations, demonstrated higher expression of ITGB1, MMP2, and PAX6 (P = 0.022, 0.03, and 0.012, respectively). With decreasing concentrations of FG from FG1 to FG3, a statistically significant reduction was observed in the expression of MMP2 (P = 0.037) and PAX6 (P = 0.01). Higher expression of RPE65 gene was observed in FG2-encapsulated cells, compared to other FG concentrations (P = 0.018). The expression of VEGFA, PDGFA, and TJP1 genes was not significantly different at different concentrations of FG. However, reduced expression of ACTA2 at the transcriptional level was observed in all FG-encapsulated cells, compared to the controls (Figure 4).
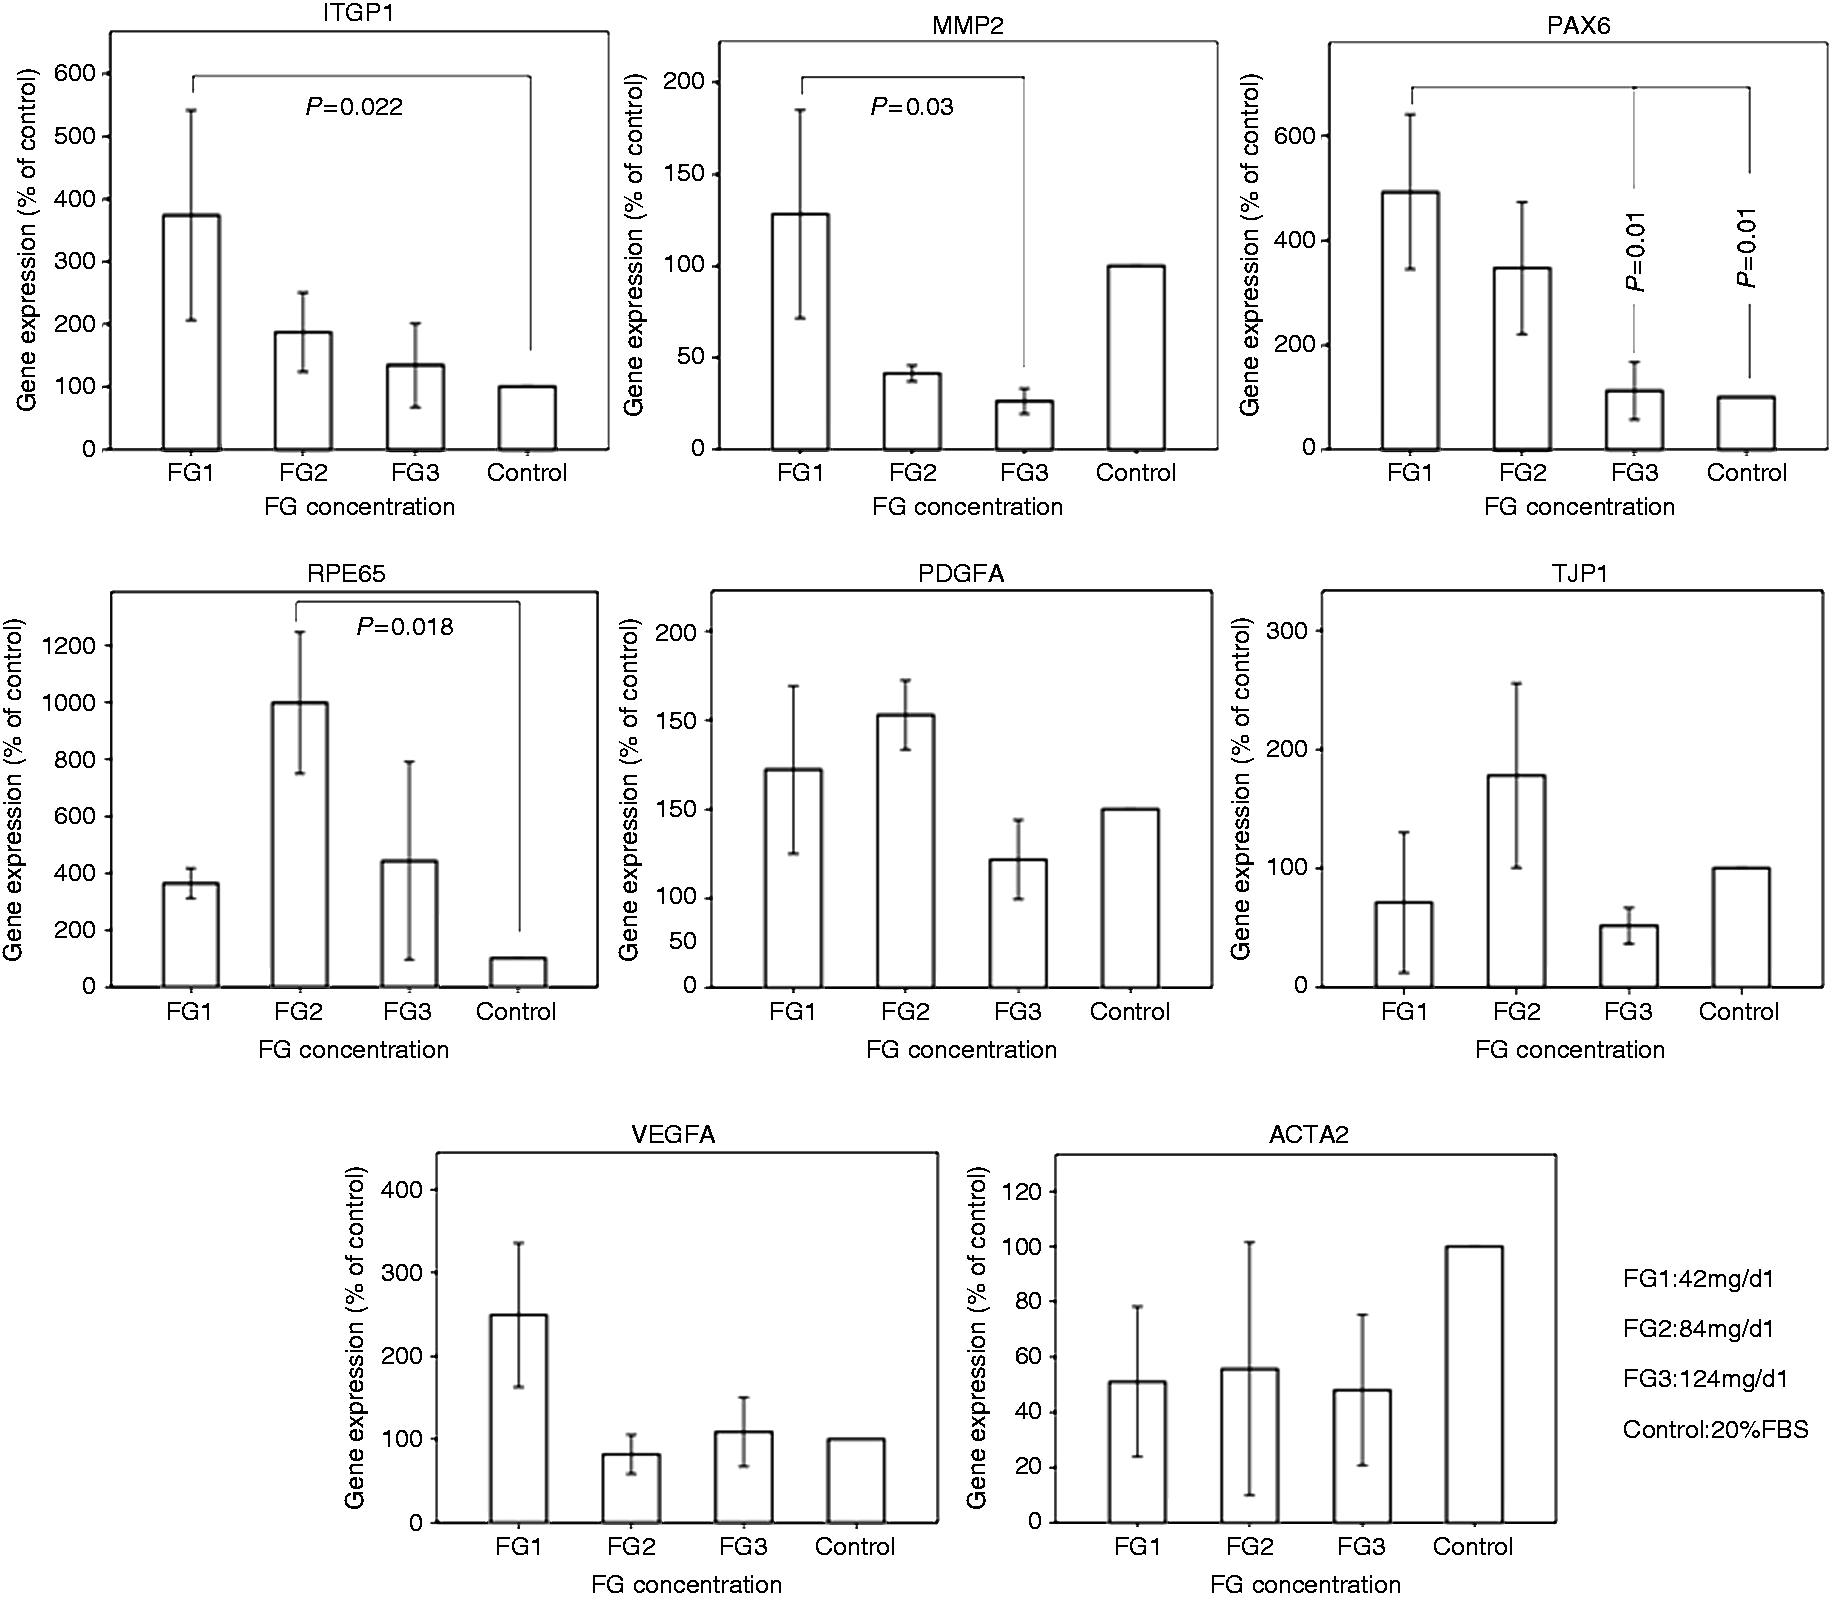
Gene expression profile of encapsulated ahRPE cells by different concentrations of FG. The illustrated graphs demonstrate gene expressions of ITGB1, MMP2, PAX6, RPE65, PDGFA, TJP1, VEGFA, and ACTA2 in encapsulated ahRPE cells compared to the percentage of the controls. ahRPE cells encapsulated with FG1 demonstrate a higher expression of ITGB1, MMP2, and PAX6, as compared to other FG concentrations (P values of 0.022, 0.03, 0.012, respectively). A meaningful decreasing trend is observed in gene expression of MMP2 (P = 0.037) and PAX6 (P = 0.01) from FG1 to FG3 concentrations. There is a higher expression of RPE65 gene in FG2-encapsulated cells as compared with other FG concentrations (P = 0.018). Gene expression of PDGFA, TJP1, and VEGFA genes does not significantly differ between different concentrations of FG. A reduced expression of ACTA2 at the transcriptional level is observed in FG-encapsulated cells compared to the controls. FG: fibrin glue.
ICC
Based on the molecular findings, cells encapsulated with FG2 were selected for immunohistochemical and electron microscopic studies. Protein markers, such as RPE65, ZO-1, and cytokeratin 8/18 were expressed in both treated and control groups. None of the cultivated cells in the treated and control groups expressed PAX6 protein (Figure 5). Mean CTCF for expression of RPE65 protein showed a significant increase in the FG2-encapsulated cells as compared to the control group (P = 0.008). The mean CTCF of FG2-encapsulated cells was not different from the control for expression of ZO-1 and cytokeratin 8/18 proteins (Figure 6).
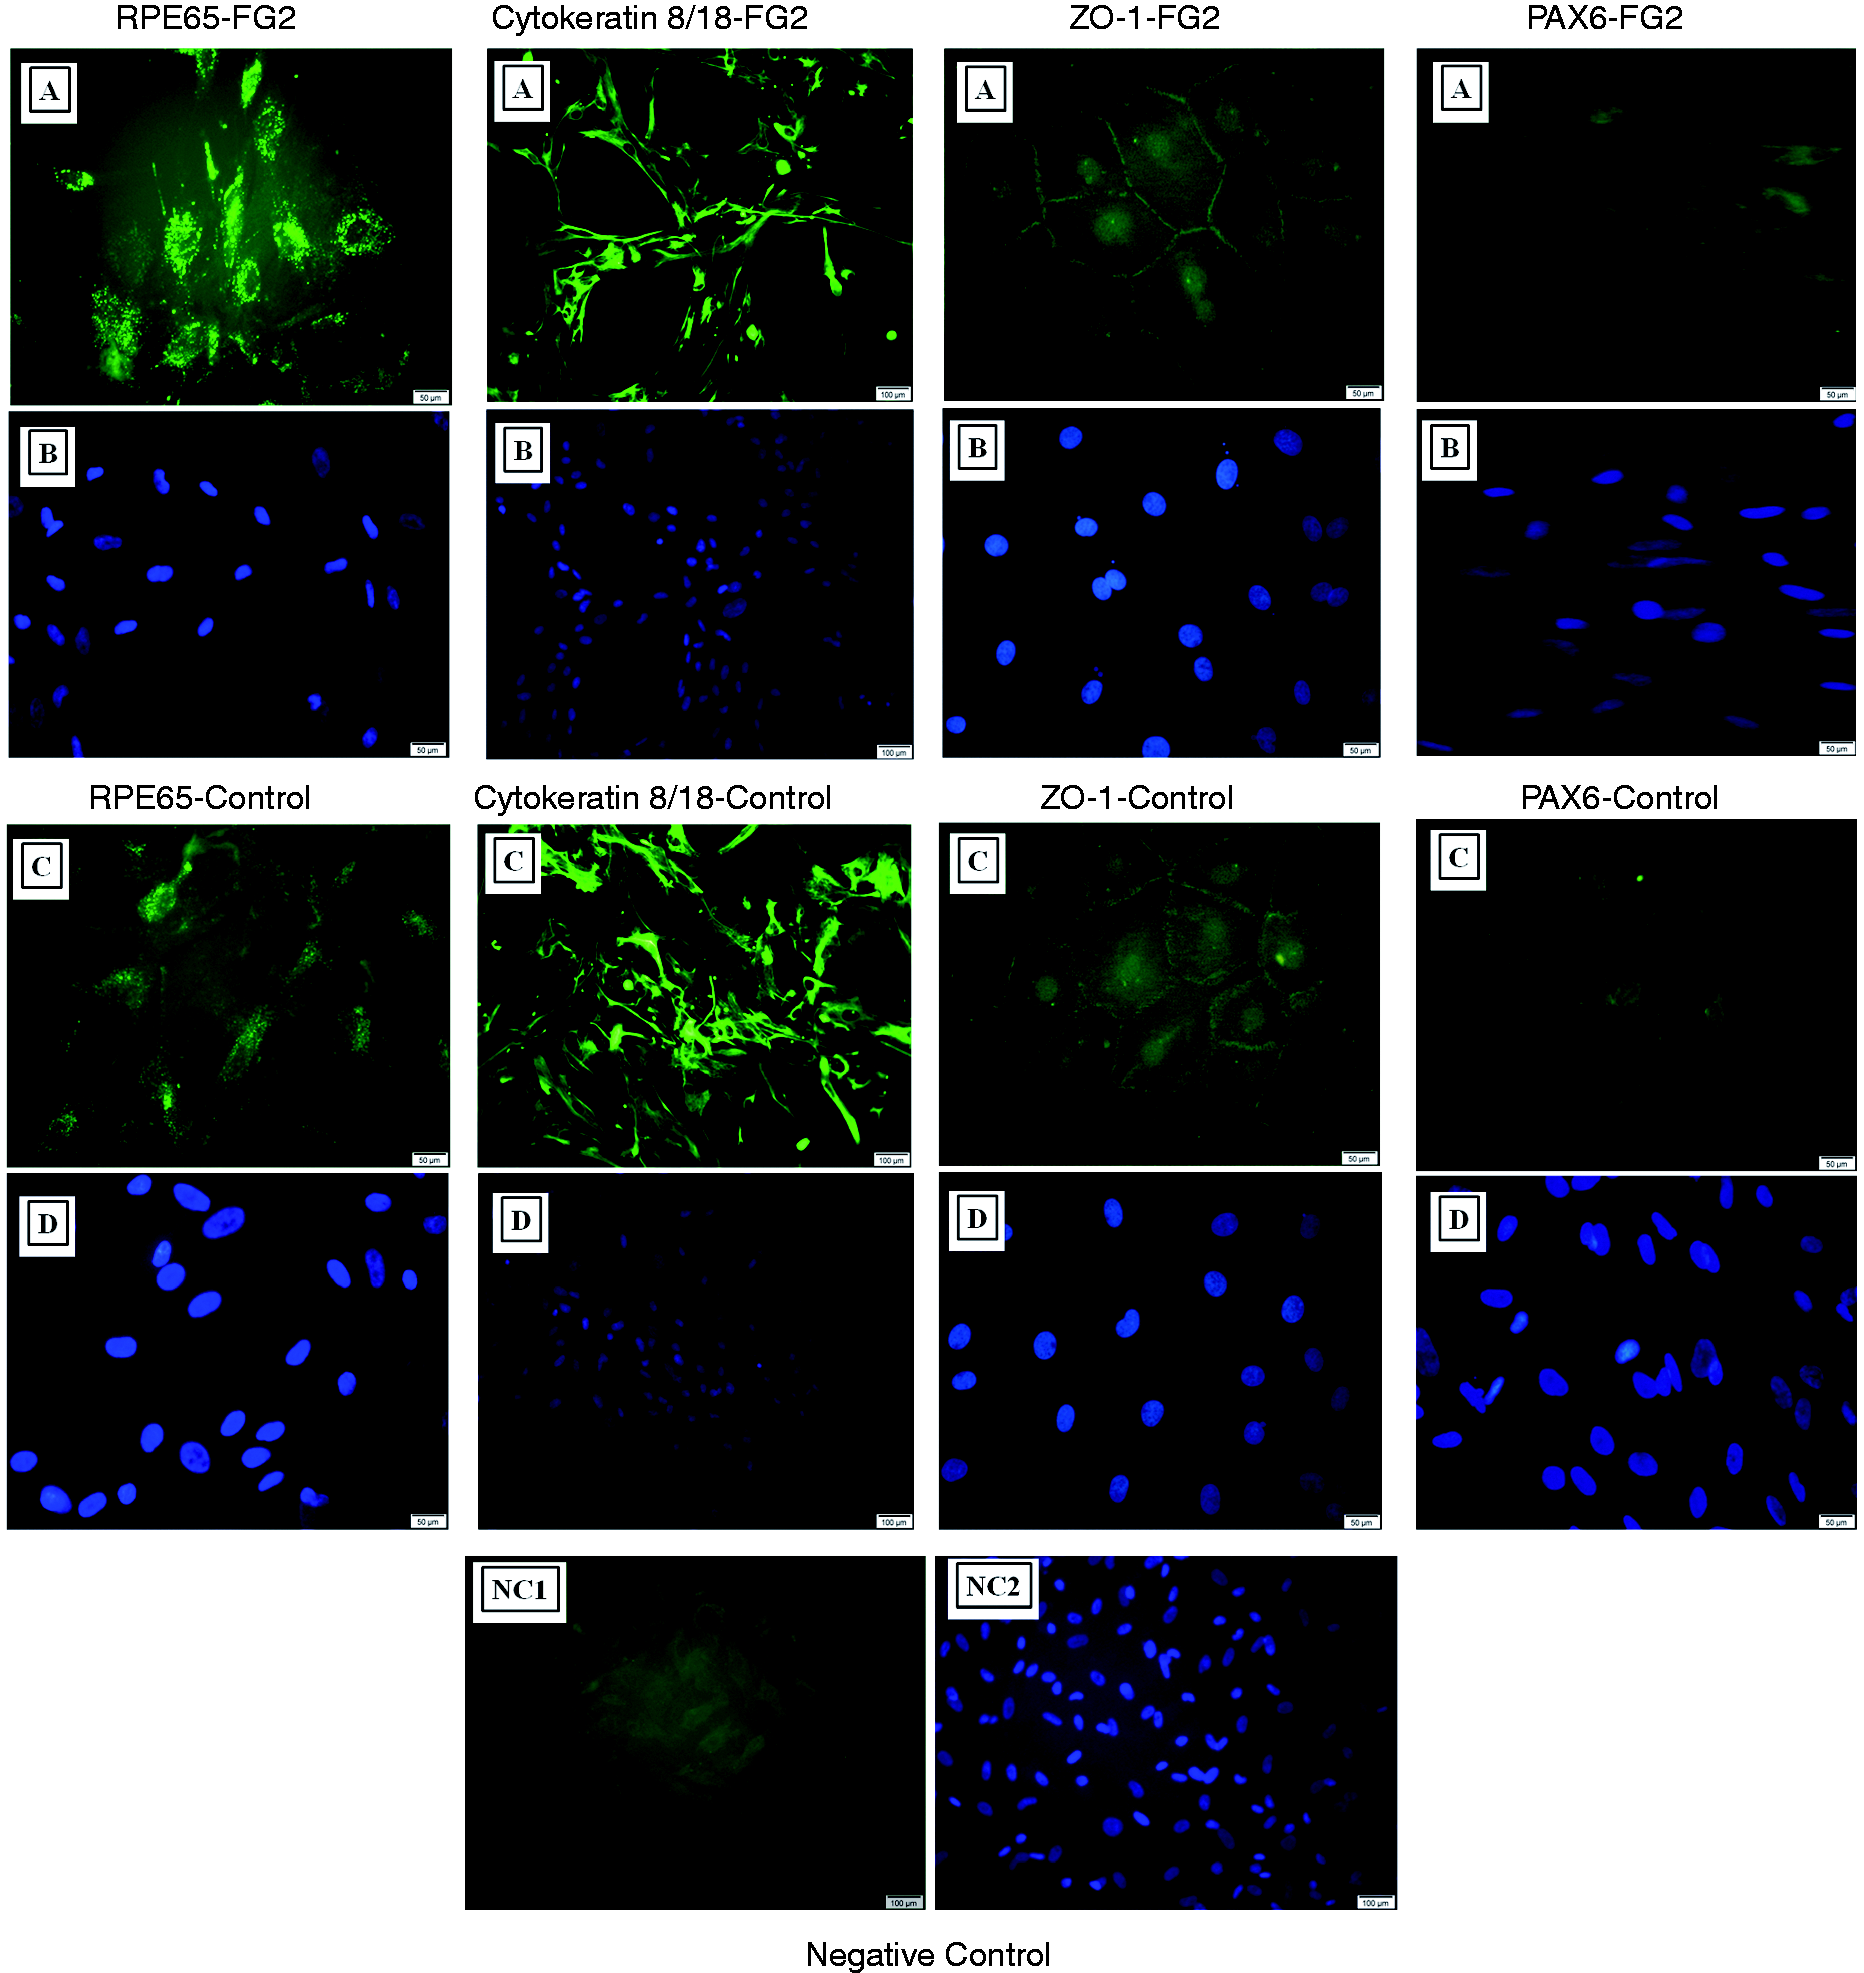
ICC of cultivated ahRPE cells seeded on FG2 versus controls. Both control and FG2-treated cells are stained positively (green) for the FITC-conjugated cytokeratin 8/18 antibody, FITC-conjugated RPE65 antibody, and FITC-conjugated ZO-1 antibody but not for the FITC-conjugated PAX6 antibody. None of cultivated cells in the treated and control groups expresses PAX6 protein. Note the DAPI stained corresponding to ahRPE cells nuclei (blue) in B-series images for FG2-treated cells and in D-series images for controls. FITC staining is evident in A-series images for FG2-treated cells, and in C-series images for controls. NC1 and NC2 (DAPI-stained) represent photomicrographs of a negative control slide lacking the primary antibody step.
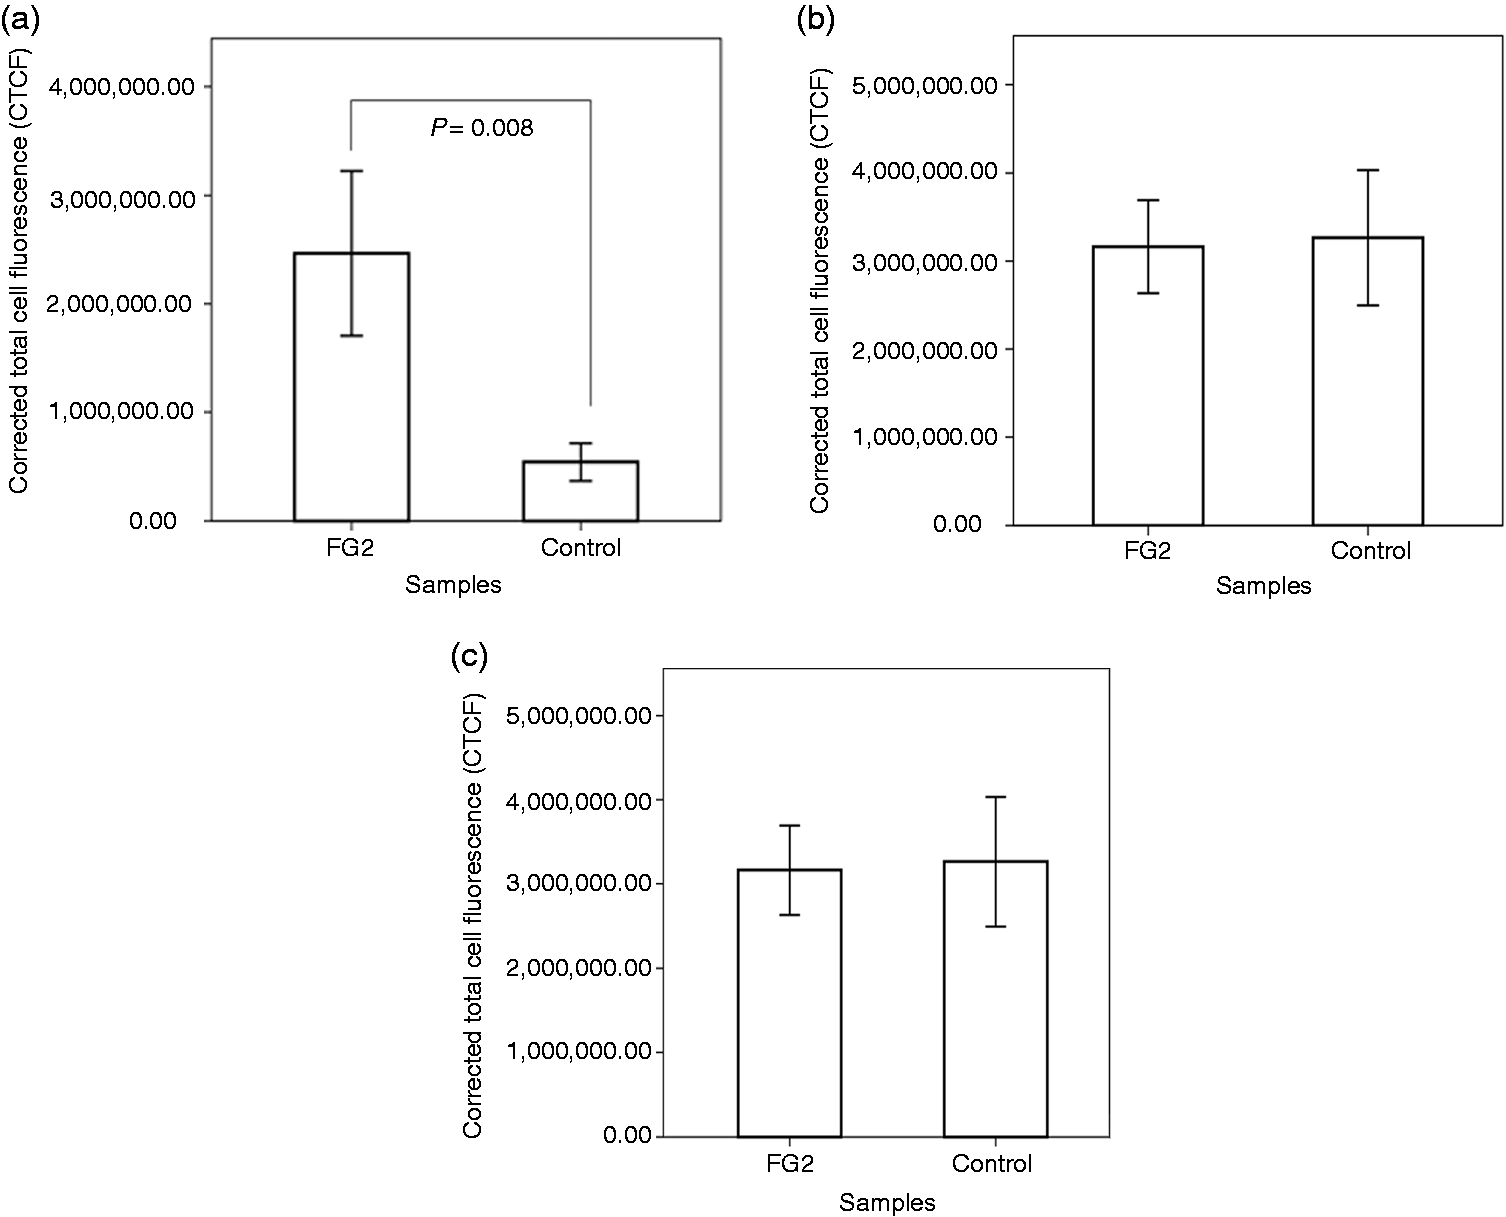
CTCF in the FG2-encapsulated and control cells. Note the significant increase of mean CTCF for RPE65 protein expression in the encapsulated cells in comparison to the control (P = 0.008). No significant difference is observed in mean CTCF of the FG2-encapsulated and control cells for expression of ZO-1 and cytokeratin 8/18 proteins. (a) RPE65, (b) ZO-1, and (c) cytokeratin 8/18.
SEM
Electron microscopy showed the presence of an FG scaffold under the ahRPE cells on day 1, which was partially degraded on day 3. Complete degradation of FG was observed on day 5 when the cells demonstrated combined epithelioid and neural-like morphology. Analysis of the SEM images demonstrated a decreasing trend in mean pore size from the lower (2.37 µm in FG1 and 1.08 µm in FG2) to the higher (0.53 µm in FG3 and 0.42 µm in FG4) FG concentrations, representing a significant decrease of mean pore size in FG4 as compared to FG1 (P = 0.001) and FG2 (P = 0.026). Reciprocally, there was an increasing trend in mean fibrin fiber thickness proportionate to the increase in fibrinogen concentration (0.20 µm in FG1, 0.39 µm in FG2, 0.53 µm in FG3, and 0.81 µm in FG4). This increase was significant for FG3 and FG4 as compared to FG1 (P = 0.001 and P = 0.001, respectively) (Figure 7). Considering the results of pore size and fibrin fiber thickness, it could be concluded that greater the increase in the thickness of fibrin strands, the smaller the pore size.
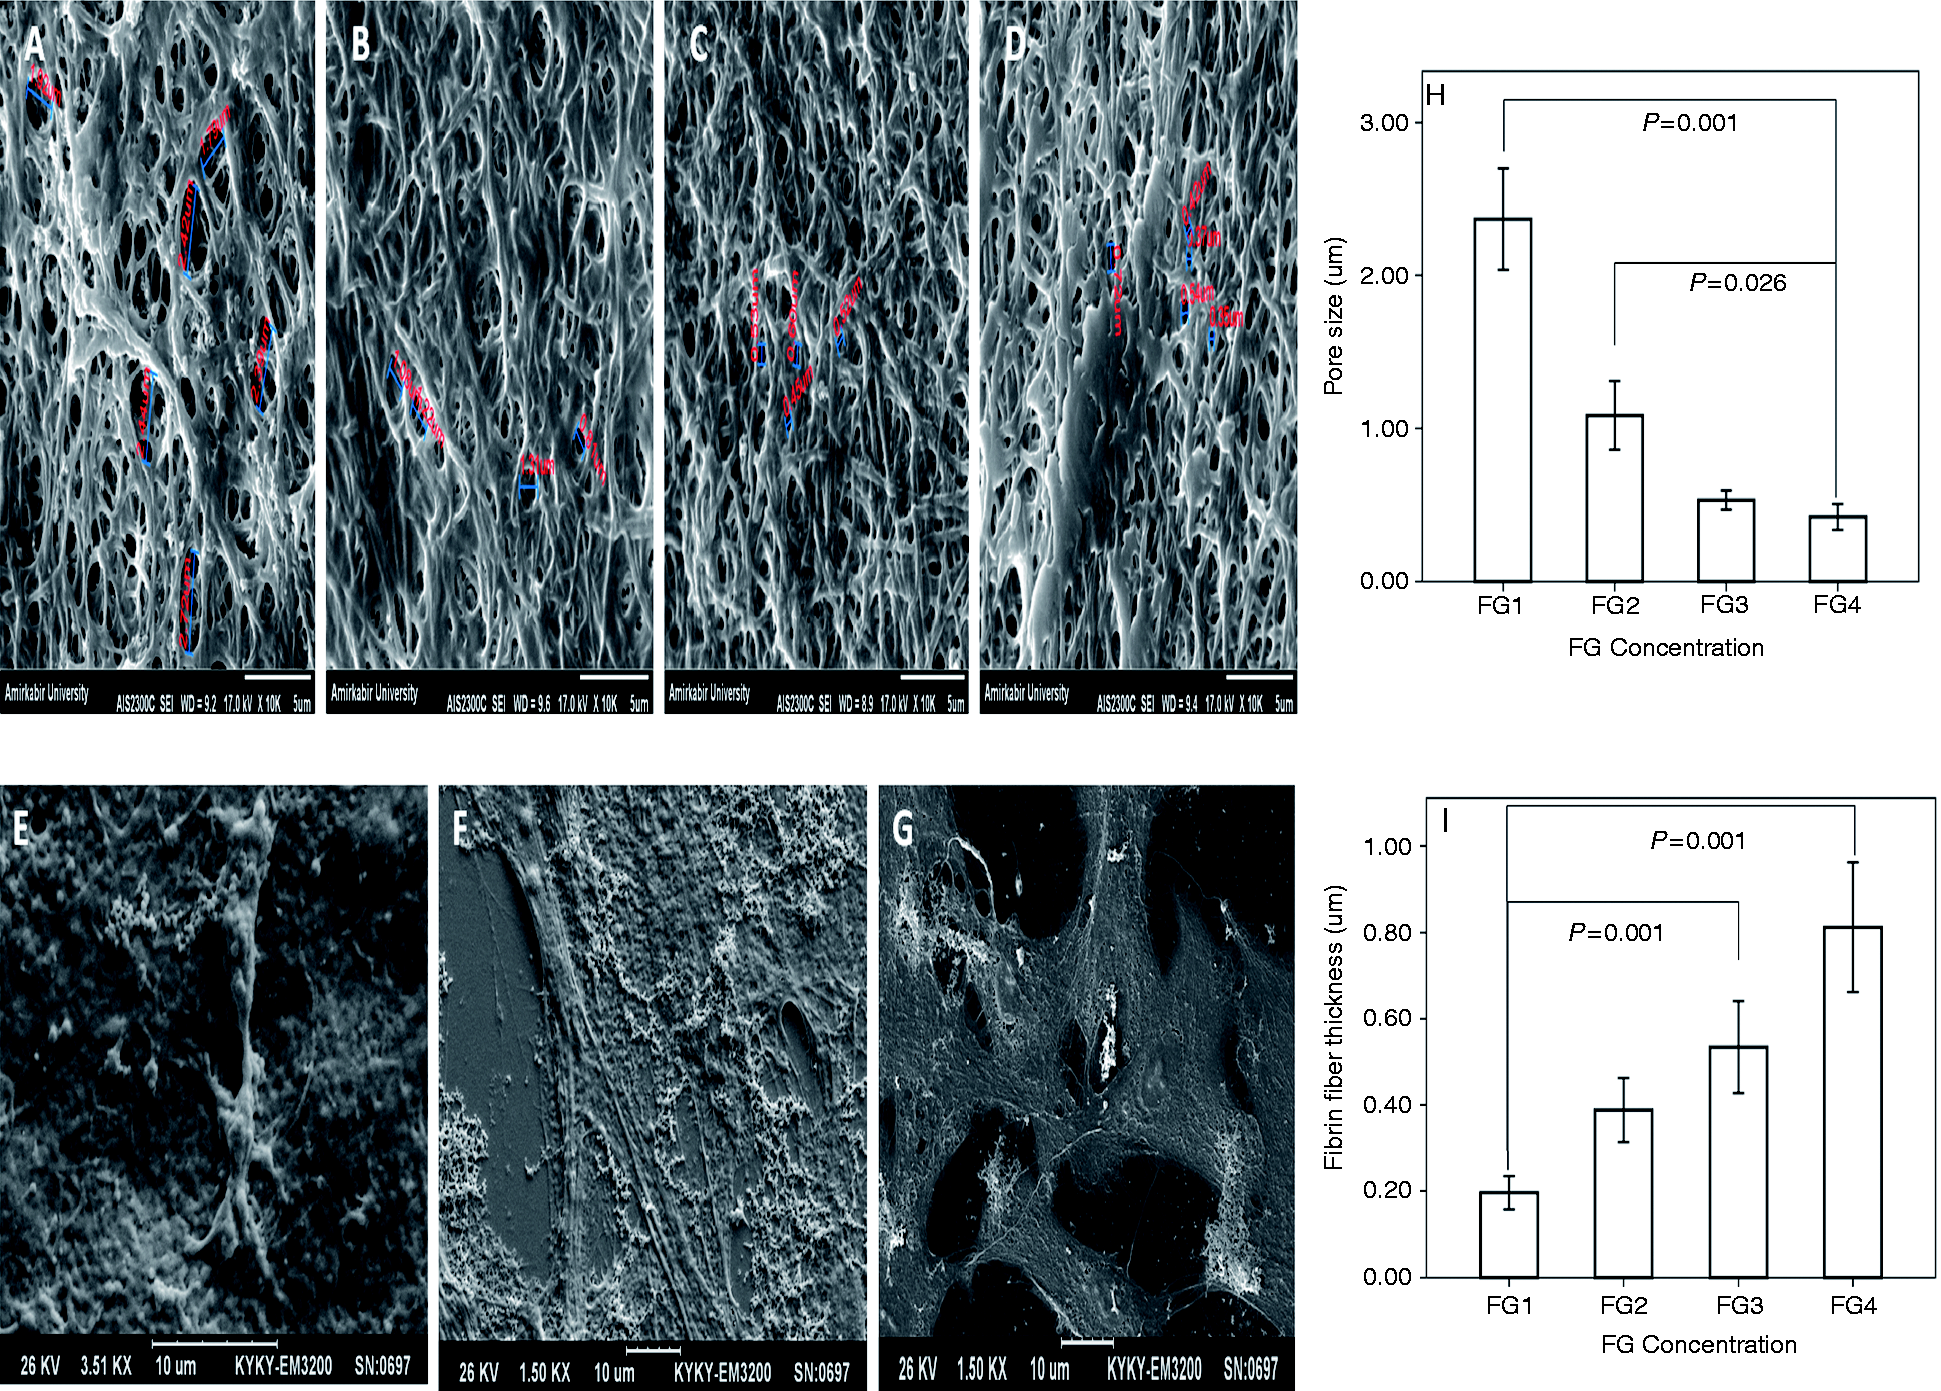
SEM results. Increasing concentration of fibrinogen from (A) to (D) (FG1 (A), FG2 (B), FG3 (C), FG4 (D)) leads to an increase in the thickness of fibrin fibers and decrease in the pores diameter. Image (E) represents the ahRPE cells implantation on the surface of the FG2 on day 1. Early degradation of FG is evident on day 3 (F). Note the complete degradation of FG on day 5 when the cells obtain their epithelial morphology (G). Mean pore size (H) reveals a decreasing trend from FG1 to FG4, illustrating a significant decrease in FG4 as compared to FG1 (P = 0.001) and FG2 (P = 0.026). Note the increasing trend of fibrin fiber thickness from FG1 to FG4 (I), significantly for FG3 and FG4 as compared to FG1 (P = 0.001 and P = 0.001, respectively). FG: fibrin glue.
Discussion
Our study showed that different concentrations of FG induced morphological, genotypic, and phenotypic alterations in cultured ahRPE cells. All encapsulated cells acquired dendritiform morphology during the early days; however, cell viability, migration, and growth were reduced with increasing concentration of FG. Furthermore, with respect to transcription, FG2 was found to be an appropriate concentration for the encapsulation of ahRPE cells for the reduced expression of MMP2 and ACTA2, the pro-inflammatory and myofibroblastic genes, respectively. Our rationale for selecting FG2 was based on a series of factors including improved cell viability and migration, and transcriptional factors such as reduced expression of MMP2 and ACTA2. Other FG concentrations were not considered optimal because they did not possess all the suitable cellular and transcriptional factors. For instance, although cultivated ahRPE cells on FG3 had an acceptable expression of MMP2 gene, their ability for growth and migration was not appropriate.
In the present study, reduced cell viability and growth and decreased cell migration were observed at higher concentrations of FG (namely FG3 and FG4), which is consistent with the results of other studies.22–24 Furthermore, concomitant with reduced FG concentration, the treated cells spread from the center of the colony and acquired a dendritiform morphology. These results were similar to those reported by Ho et al., 22 who found that the mesenchymal cells had a round-shaped morphology when treated with high concentrations of FG, but took on a fibroblast-like morphology at lower concentrations of FG. In the current study, on days 1 and 3, the cultivated ahRPE cells were encapsulated within the FG scaffold that had not been digested by the cells by that time. The undigested FG, in all tested concentrations, exerted an inhibitory effect on cell viability and growth in comparison to the controls. However, with digestion of the FG scaffold over time and removing its corresponding inhibitory effects, an increased rate of cell migration and growth was observed for the lower concentrations of FG (FG1 and FG2) as compared to the controls.
The proliferative capacity of ovarian cells was shown to be inversely proportional to fibrinogen concentration. 25 This could be because of the increased diameter of fibrin filaments at high concentrations of the fibrin scaffold and reduced pore size and permeability. In the current study, a constant concentration of thrombin together with increasing concentrations of fibrinogen was used to create different concentrations of FG. At higher concentrations of FG, thrombin concentration was relatively too low to induce fibrino-peptide cleavage. Given that a balance between the amount of lateral aggregation of fibrin monomers and the rate of fibrino-peptide cleavage will determine the fiber diameter,25,26 decrease of fibrino-peptide cleavage with increased concentration of FG leads to increased lateral aggregation of fibrin protofibrils and formation of thicker and stiffer fibers. This can explain different responses of the ahRPE cells to different concentrations of FG; the higher FG concentration, the less cellular growth and migration. Additionally, given that the pore sizes at low FG concentrations were larger than those at high FG concentrations, the ahRPE cells encapsulated in low FG concentrations demonstrated faster growth, compared to those encapsulated in high FG concentrations, because of increased intercellular communication, permeability of nutrients, and diffusion of growth factors.
The cell–scaffold connections in our study appeared to induce a dendritiform morphology, and with gradual degradation of FG over time, an epithelioid morphology was observed. It seems that high permeability and strong association between the pores and increased surface-to-volume ratio are factors affecting RPE growth and behavior.27–29 Considering that a more homogeneous and permeable fibrin scaffold forms at low concentrations of FG, cell–cell communication might be as important as cell–matrix communication for establishing the growth rate of encapsulated ahRPE cells in our study.
In this study, PAX6 gene was used as a retinal progenitor marker to assess the induction of progenitor status and reprogramming. Molecular analysis indicated increased expression of this gene at FG1 and FG2 concentrations, while the corresponding protein showed lack of expression in both FG2-encapsulated and control ahRPE cells. This finding in the control cells might be due to lack of expression of PAX6 protein in adult donor-originated hRPE cells. Respecting FG2-encapsulated cells, although there was a higher expression of PAX6 gene as compared to the controls, the corresponding protein expression was not evident. In such circumstances, the protein level might be either too low or too modified to be detected by the corresponding antibody in the immunocytochemical studies.
Islam et al. 30 demonstrated that RPE cells did not return to the stem cell status, but sustained specific markers and acquired multipotency. In a couple of studies, the expression of PAX6 transcripts in the RPE cells of adult newts induced the reprogramming of cells into a unique state of multipotency, without myofibroblastic differentiation.31,32 In the current study, increased expression of PAX6 and reduced expression of ACTA2 were observed in FG1-encapsulated ahRPE cells, indicating high possibility of induction of reprogramming and no risk of myofibroblastic differentiation with this 3D scaffold. However, ahRPE cells encapsulated with FG1 demonstrated high expression of MMP2 transcripts. This finding was previously reported at the first stage of induced reprogramming and consequent regeneration. 33 In addition, cell–cell communication, which is higher at lower FG concentrations, is very important for the upregulation of PAX6 gene as well as regeneration. 33 Hence, it seems that FG2 provides a pivotal substrate to preserve the nature of RPE cells because of lower expression of PAX6 and MMP2, compared to FG1.
Araki 33 pointed out the role of retinal vascular membrane (RVM) in retinal regeneration. RVM is a space containing capillaries and extracellular matrix, which lead to the growth of progenitors and promotion of the regeneration process. FG, as a 3D scaffold, has the potential to imitate the conditions in RVM. Moreover, it is noteworthy that the presence of fibronectin in FG leads to the appearance of integrins in the final product and helps advance the adhesiveness, spreading, and signaling properties of cells. 22 In this regard, Heller et al. showed that the presence of integrin ligands on the Bruch’s membrane is important for cell adhesion, and delayed adhesion causes apoptosis of the transplanted RPE cells. The study also shows that the connection of these cells to the Bruch’s membrane is mediated by integrin-β1, which, in fact, binds the fibronectin, laminin, and collagen type IV molecules. Because of the increased expression of the ITGB1 gene, especially at FG1 and FG2 concentrations, it seems that FG can serve as a bridge between RPE cells and the Bruch’s membrane layer. 34 In association with RVM, the role of PDGF can be noted as a key factor for the protection of vessels and retinal development. 35 In our study, the expression of PDGF genes was higher at FG2 concentration, albeit it was not significantly different between the FG-treated and control ahRPE cells. This marker is also involved in cell migration and repair of retinal damage. It is obvious that the expression of this marker can play a role in strengthening the RVM environment and allowing the cells to expand in this space. However, the capacity of FG1 to create a pseudo-RVM microenvironment and induce the expression of the markers involved in regeneration is controversial.
In our study, the gene encoding VEGFA was significantly amplified at different concentrations of FG, which is favorable with respect to angiogenesis. FG2-encapsulated ahRPE cells showed minimal expression of the VEGFA gene; therefore, this concentration can be considered as the optimum concentration to avoid aberrant subretinal neovascularization following RPE transplantation.
In the present study, the expression of RPE65 and TJP1 was higher at FG2 concentration, compared to that at other FG concentrations; this increase was statistically significant for the RPE65 gene. These observations reflect the maintenance of cellular features by this 3D biostructure. In order to evaluate the functionality of the epithelioid monolayer of ahRPE cells at FG2 concentration, the cells were assessed for the expression of cytokeratin 8/18, RPE65, and ZO-1 proteins; the results confirmed the expression of these proteins. Cultivation of RPE cells on other 3D structures, such as the amniotic membrane, porous polycaprolactone, collagen layer, regenerated wild Antheraea pernyi silk fibroin, and alginate fibers indicated the maintenance of the monolayer status and expression of ZO-1 protein in the cells.9,10,12,36–38
Since in our study, FG2 allowed the formation of a functional monolayer of ahRPE cells while encapsulating the cultivated cells, it can be proposed that this 3D autologous biopolymer can be used as an ideal substrate for RPE cell transplantation with the minimum risk of graft rejection reactions and a reduced need for immune suppression strategies. Moreover, considering that FG2 is a native and biodegradable extracellular matrix, it has great potential to integrate with the Bruch’s membrane of the host and increase the success rate of RPE transplantation, wherein the choice of RPE cell substrate plays a crucial role for successful grafting. 39
In conclusion, our study demonstrated controlled expression of inflammatory (MMP2), angiogenic (VEGFA), and progenitor (PAX6) genes in FG2-encapsulated ahRPE cells. Moreover, the expression of RPE-specific genes such as RPE65, TJP1, and PDGFA was upregulated and high expression of RPE-specific proteins such as cytokeratin 8/18, RPE65, and ZO-1 was observed at this FG concentration. Additionally, it seemed that the FG might have an inhibitory effect on the myofibroblastic differentiation of cultivated ahRPE cells. Hence, FG2 can provide a suitable condition for maintaining the morphometric, genotypic, and phenotypic features of cultivated RPE cells. Moreover, the presence of ZO-1 protein in FG2-treated cells confirms its functionality in the monolayer form of ahRPE cells. Due to the lack of induction of differentiation using FG2, this concentration appears to be useful to form a sticky feeder layer during autologous or allogeneic RPE transplantation for the ease of connection and acceptance of the graft. Therefore, due to the high levels of fibronectin and increased induction of integrin expression, this polymer can be used to strengthen the Bruch’s membrane that might have become defective because of senescence.
Footnotes
Authors’ Note
Narsis Daftarian is also affiliated with Ocular Tissue Engineering Research Center, Shahid Beheshti University of Medical Sciences, Tehran, Iran.
Acknowledgement
The authors would like to thank the Central Eye Bank of Iran for providing the donor eyes.
Declaration of Conflicting Interests
The author(s) declared no potential conflicts of interest with respect to the research, authorship, and/or publication of this article.
Funding
The author(s) received no financial support for the research, authorship, and/or publication of this article.