
Abstract
Small extracellular vesicles, commonly referred to as exosomes, withhold a promising future in the pharmaceutical industry as carriers for targeted drug delivery due to their high specificity and bioavailability when compared to synthetic-based vectors. They, however, present some limitations for systematic administration because of natural organism defenses and their high-water solubility, ultimately making it difficult for them to reach the intended target. To improve the delivery capacity of these nanoparticles, the possibility for the construction of PEGylated versions was explored in this work. This process was performed, analyzed, and characterized using N-terminal specific PEGylation reactions targeted to the protein contents in the exosomal membrane. For this, two different mono-methoxy polyethylene glycols (mPEG) of 5 and 20 kDa were reacted with exosomes under alkylating conditions. The resulting 5k and 20k PEGylated exosome constructs were characterized and compared with unmodified exosomes, using size, morphology, and zeta potential as comparison parameters. Results after analysis showed an absorbance reduction of approximately 65% and 34% (for the 5 and 20 kDa conjugates respectively), a reduction of 10 to 20% in peak resolution, particle size increase corresponding to the polymer sizes used, and a slight reduction in electric distribution of about 2 to 3 mV less than the unmodified vesicles. The data obtained may provide insights for the optimization of exosome PEGylation strategies for therapeutic use.
Introduction
Small extracellular vesicles (sEVs) are membrane-derived particles that are released from a variety of cells in heterogeneous mixtures. These sEVs were initially believed to function as aids in cellular waste disposal mechanisms, but more recently, other functions have been associated with them as their role in transporting and delivering information between cells. 1 Extracellular vesicles can be divided into different groups depending on their size, biogenesis, composition, and content. Regarding size they can be divided into small or large extracellular vesicles when their size is larger or smaller than approximately 200 nm. As for their biogenesis, some of the more common classifications include apoptotic bodies (50-1000 nm in size), microvesicles (100-1000 nm in size) and exosomes (i.e., sEVs). (30-150 nm in size). 2
Particularly, exosomes are specialized vesicles that are derived from endocytic compartments. These sEVs are formed when an intermediate endocytic compartment, the multivesicular body, fuses with the membrane and then is released to the exterior. This process is generated in the cellular membrane, unlike other microvesicles. 3 It has been found that the membrane composition varies depending on the source from which the exosome is released, but in general, they all possess a lipidic membrane with embedded proteins and some molecular cargo inside them, usually macromolecules such as proteins, peptides and nucleic acids. 4 It has been found that in vivo, their main function is the transfer of information between cells, mainly genetic material or macromolecules that are also used in triggering immune responses. 5 The process for this to happen includes the fusion of the exosome with the target cell, an interaction that signals cell surface proteins to promote the internalization of the exosome to deliver its cargo. 6
Some of the advantageous and unique characteristics exosomes present are their high affinity to the cells from which they come (as the membrane is likely to contain receptors and proteins characteristic of the original cells), as well as their ability to cross natural barriers mostly because of their size. 7 Thanks to these characteristics, many applications have been developed and are still being envisioned in the biomedical field. Some of these applications include targeted drug delivery systems, immunotherapy, cancer vaccines, biomarkers, and regenerative therapies. 8
There are, however, several limitations that do not allow exosomes to obtain all the potential that they are presumed to have. Among the most important ones are production problems like the lack of procurement uniformity and the expensive extraction and purification processes; and issues that hamper their therapeutic potential such as rapid clearance by macrophages once administered. 9 In this line and talking specifically about the therapeutic potential issues, some of the strategies that have been developed include but are not limited to: addition or modification of the membrane proteins, the use of genetic engineering to confer special receptors for better targeting and uptake, and the addition of polymers or other inorganic components.10–12 All these approaches have been successful in improving the therapeutic potential of exosomes to some extent. However, more studies and alternatives are needed to fully exploit potential therapeutic applications with these biological nanoparticles.
Among these options, one of these possible modifications could be achieved by PEGylation. This chemical enhancement consists in covalently attaching at least one chain of polyethylene glycol (PEG) to a given molecule found in the exosomal membrane. PEGylation has been successfully employed in proteins, peptides, carbohydrates, enzymes, antibody fragments, nucleotides, small organic molecules and different nanoparticle formulations more particularly in those consisting of liposomes. 13 Considering the similarities between liposomes and exosomes, which differ mostly in the lack of naturally-embedded surface molecules in the former, PEGylation could potentially enhance exosome performance in many applications.
It is now known that one of the main advantages of PEGylation is the actual increase in size and molecular weight of the conjugated biomolecules which generally causes an improvement in stability and other favorable characteristics. 14 PEGylated compounds have also shown a better performance in their pharmacokinetic and pharmacodynamic characteristics, thanks to increments in solubility, better protection from enzymatic degradation, reduction of renal clearance, and limitation of immunogenic and antigenic reactions. PEGylated conjugates also show increased half-lives, decreased plasma clearance, and different biodistribution, in comparison with their non-PEGylated counterparts. 15 Few studies have been done utilizing this approach in nanovesicles, so a better understanding of this process may lead to a higher success when applying this strategy.16,17 In this study, exosomes were modified by a N-terminal specific PEGylation reaction targeted to the embedded proteins in the exosomal membrane. The resulting constructs were then analyzed and characterized to find out if the modification was possible and how certain parameters such as size, distribution and zeta potential were all affected by the addition of the polymer.
Results and discussion
Exosome extraction and characterization
After cell culture and processing, extracted particles presented a size of between 90 and 200 nm, as assessed by DLS, with the greatest intensity and concentration in the 100-170 nm range, many studies agree that exosome sizes should be around 30-150 nm so, these results match what has been described in literature.4,8,18 On its part, Zeta potential represents the electric potential of the surface of a particle at the shear plane where values of ± 30 mV show that the particle is stabilized. 19 Because of the heavily protein content nature of their membrane and the bilipid layer they possess, extracellular vesicles like microvesicles and exosomes have all been reported to present a negative electrical distribution. This value varies depending on the source where the vesicles were originally extracted from, but exosomes usually possess a different zeta potential compared to microvesicles. 20 This can also be observed with the CaCo2 cell-derived exosomes as after multiple extractions the average value of the electrical distribution was around −8.57 ± 0.18 mV. Both size and electrical distribution results are comparable to those obtained from other studies that have characterized exosomes from this same cell line. 18
Morphologically, exosomes present themselves as spherical nanoparticles. Figure 1 shows the morphological appearance of the extracted exosomes after SEM analysis which is also consistent with the particle size obtained from the DLS measurements. Nonetheless, a final biochemical characterization was performed by detecting the presence of the CD63 biomarker in the exosomal surface using the ExoELISA-Ultra CD63 Kit. This protein alongside other tetraspanins (e.g., CD81, CD9, etc.) has been widely reported in exosome characterization and serves as a marker to detect and quantify the presence of exosomal particles in a sample.
21
The ELISA essay for the presence of this surface protein was positive for all the exosome samples obtained from cell culture (data not shown). Exosomes as observed when using the Scanning Electron Microscope (SEM) for a morphological analysis.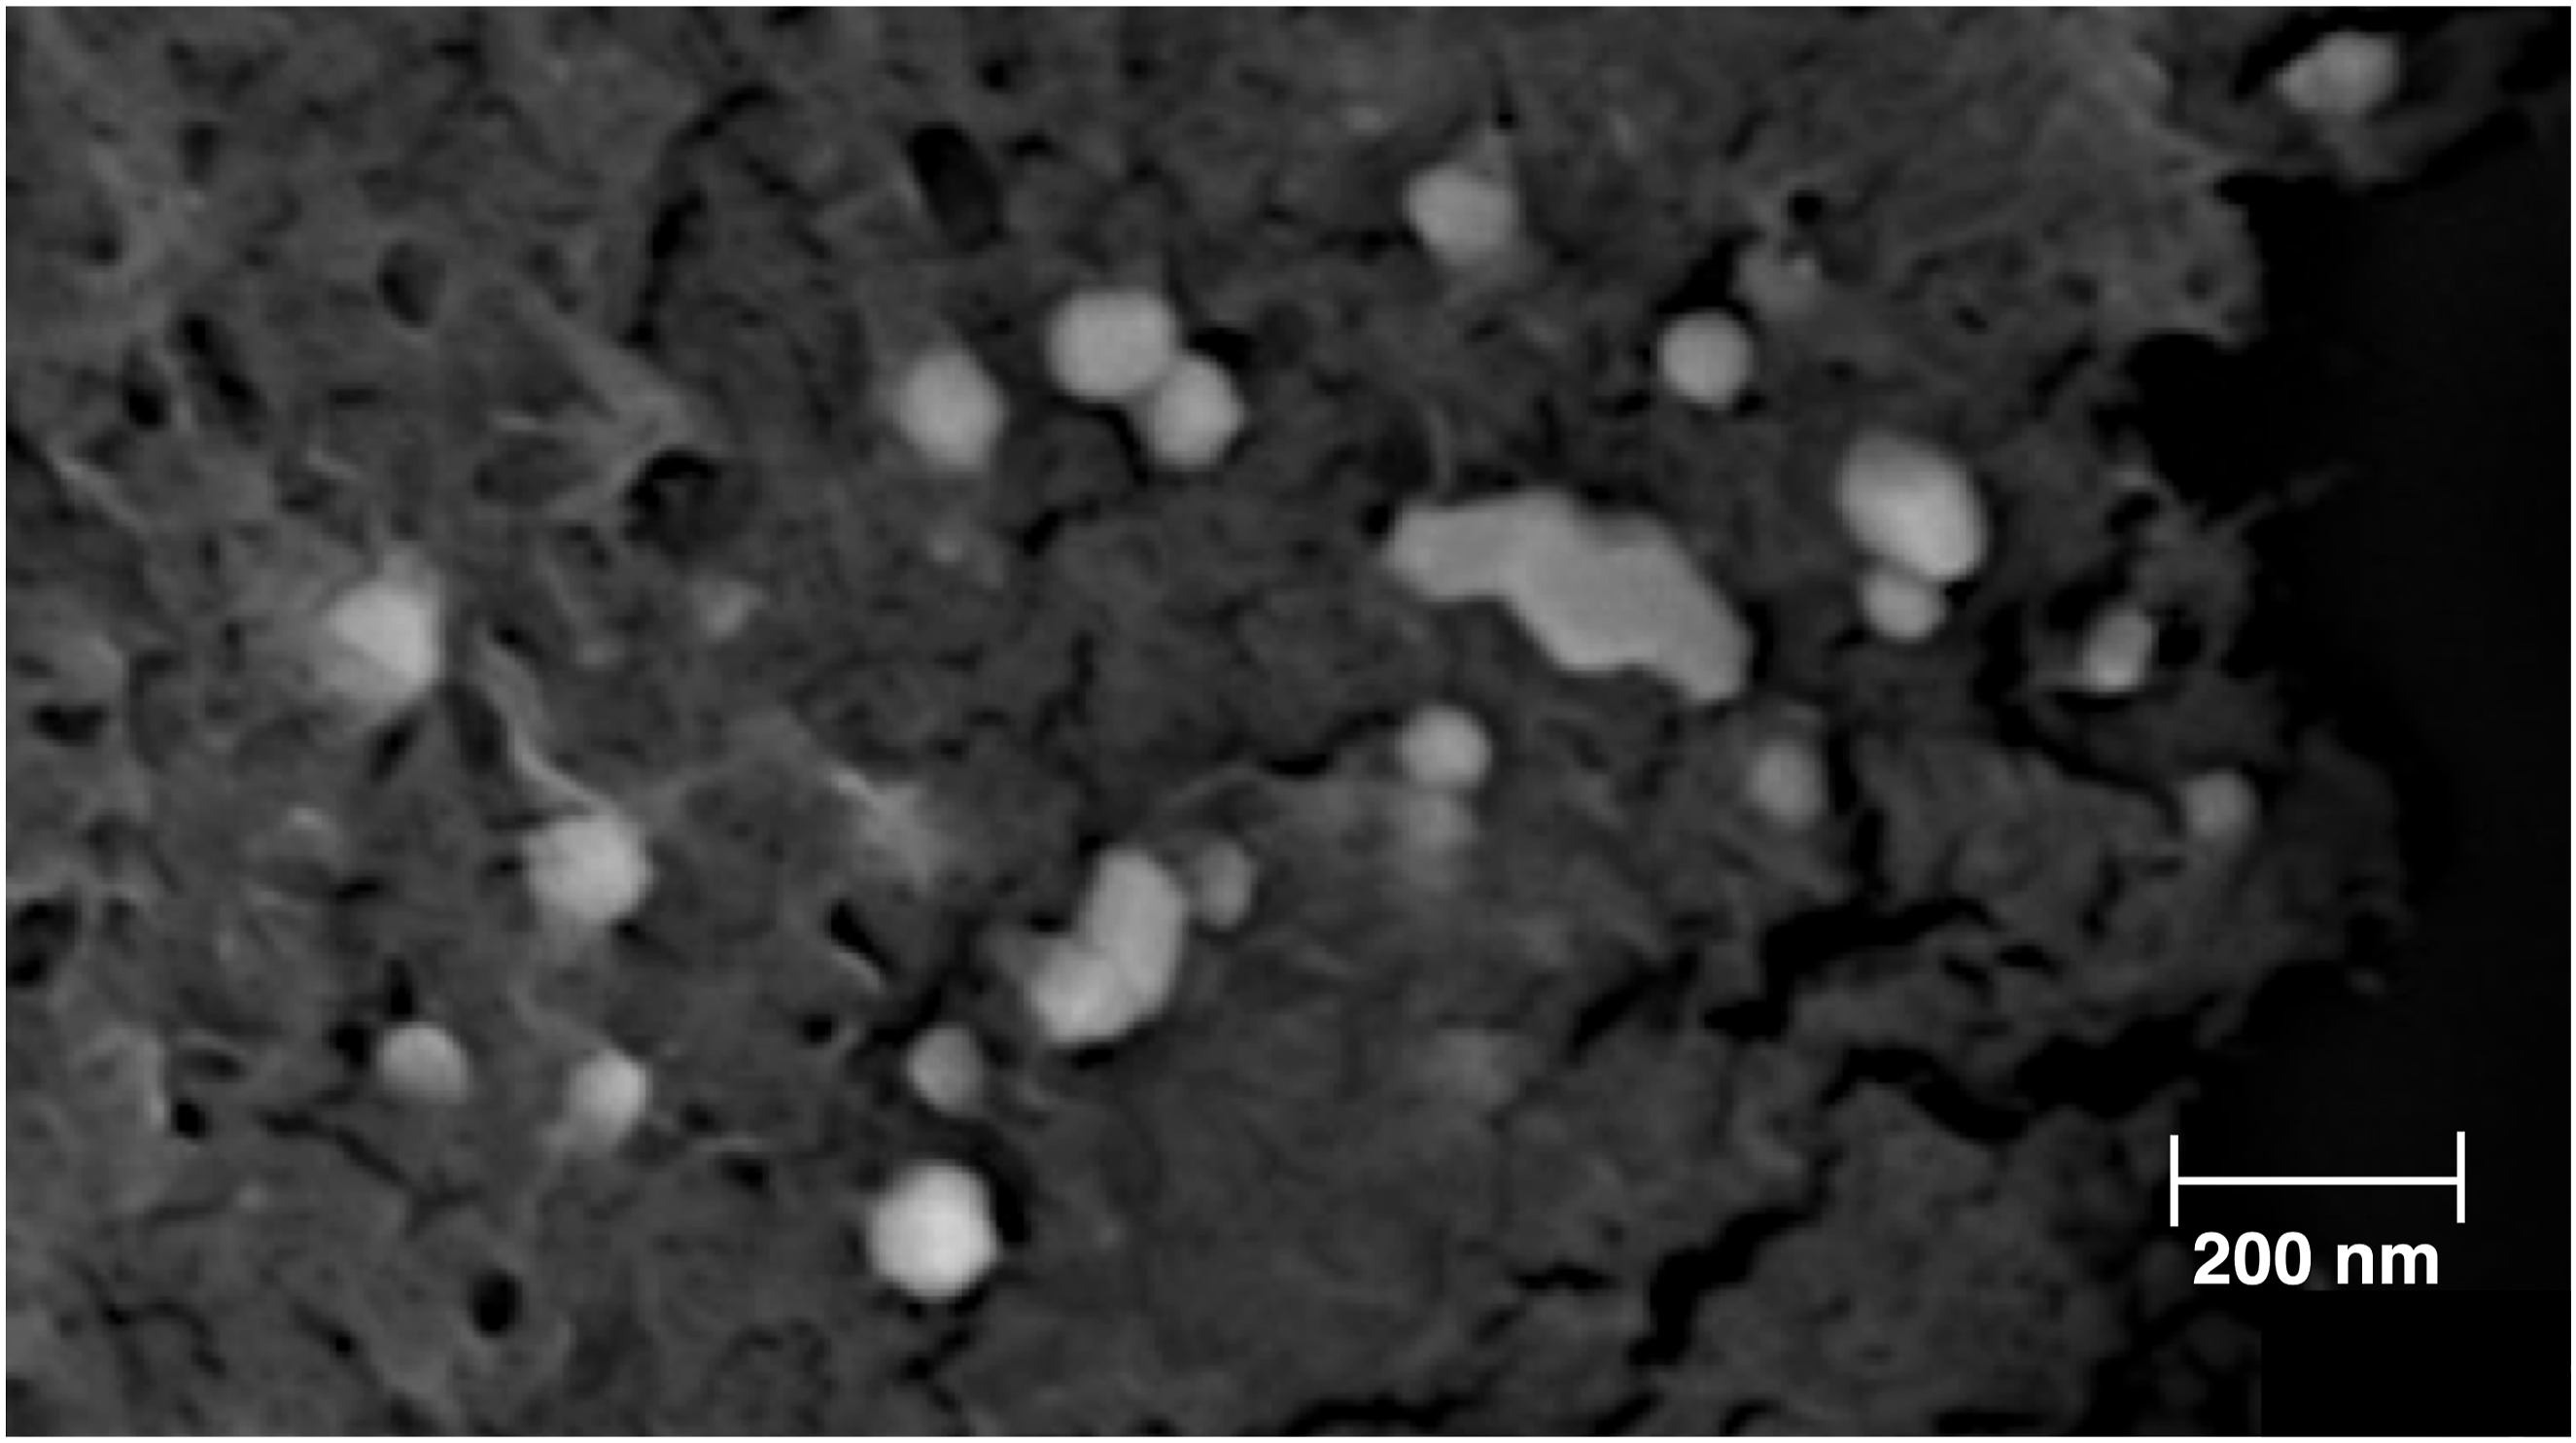
Exosome PEGylation reactions and conjugate characterization
As it has been described in the Materials and Methods section in this work, previously recovered CaCo2 cell-derived exosomes were subjected to N-terminal specific PEGylation reactions targeting the proteins in the exosomal membrane. It is well known that exosome functionality heavily depends on molecular recognition mechanisms mainly related to the proteins embedded in the membrane. However, the PEGylation reaction strategy selected in this work specifically targets the N-terminus of proteins, so, if this part of the protein is not exposed outside the membrane no reaction should occur. Furthermore, if we consider that biochemical interactions between proteins happen mostly in regions distant from the N-terminus it would be expected that the targeted proteins should not present an important role or involvement in molecular recognition mechanisms. Figure 2 presents SEM images of both the 5 and 20 kDa mPEG-modified exosomes where consistency can be observed with the data obtained from the rest of the characterization procedures as will be furtherly detailed later. A) 5 kDa and B) 20 kDa PEGylated exosomes as they appear under a Scanning Electron Microscope (SEM) for morphological analysis.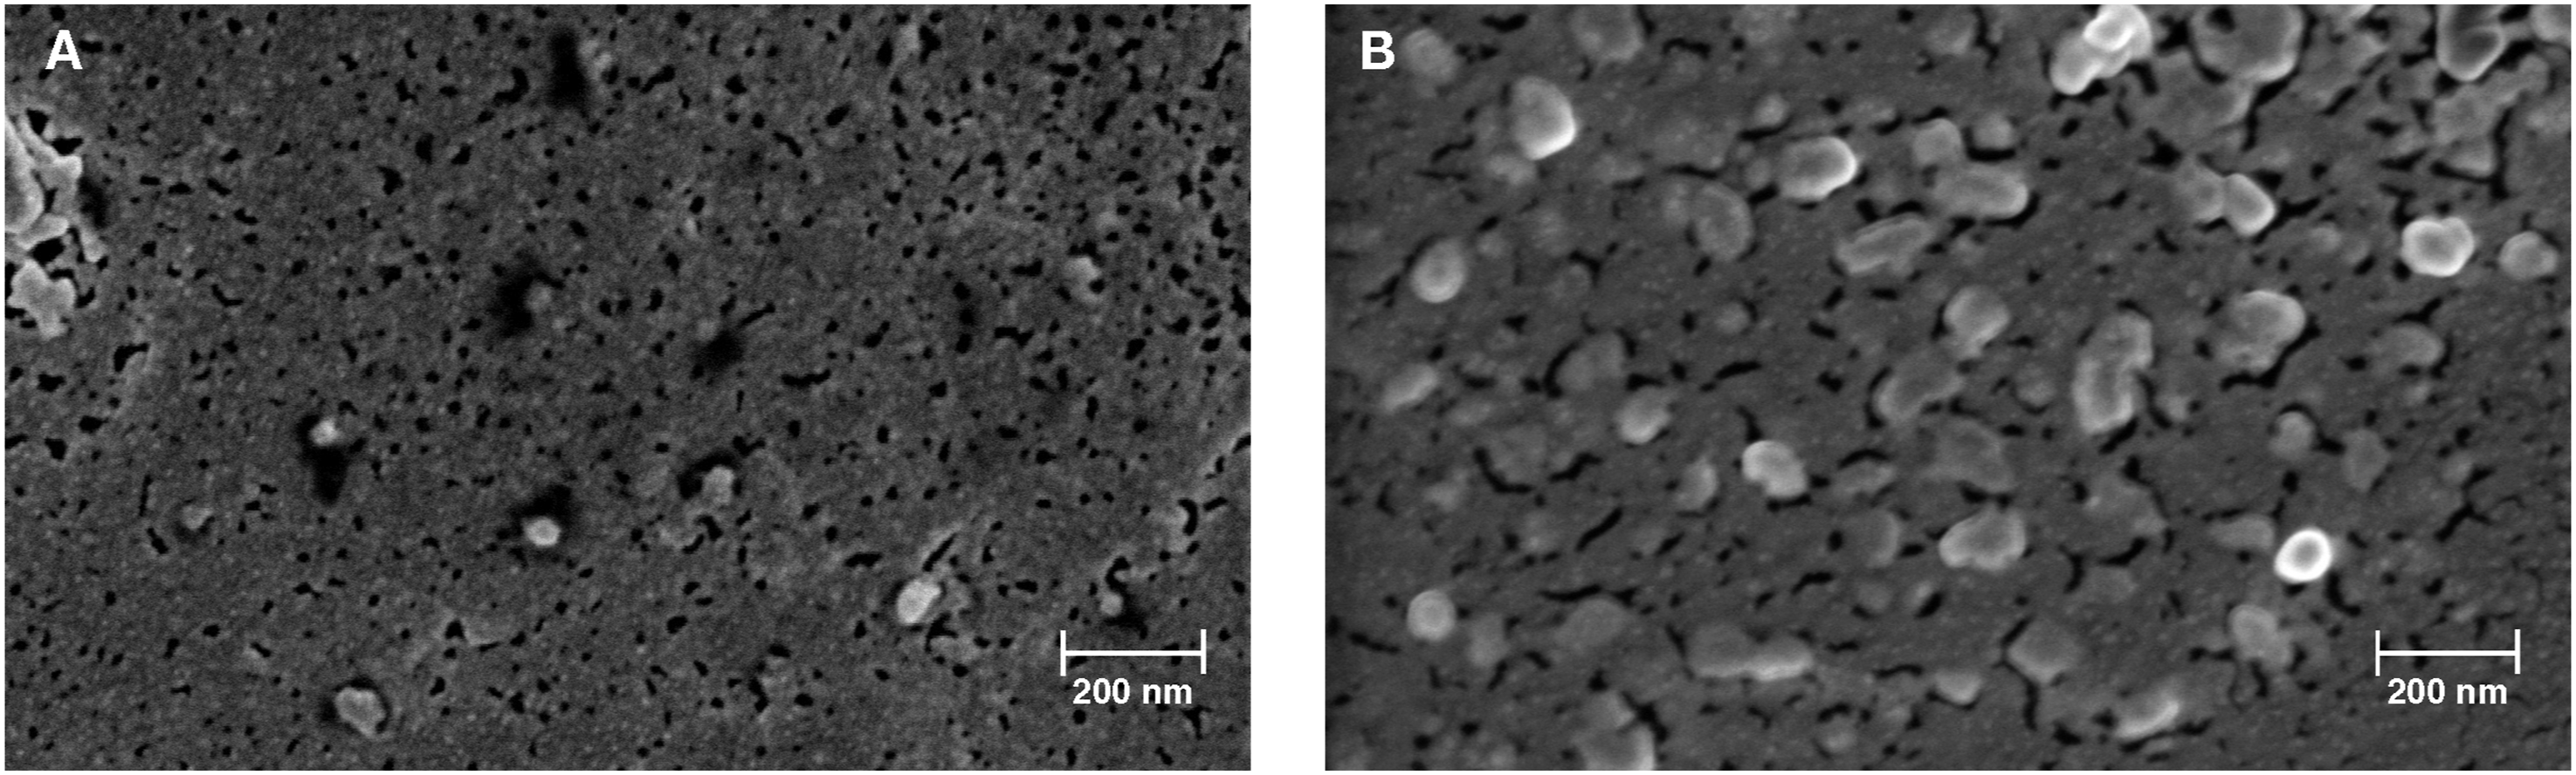
In this sense, polymer conjugation at the amino terminus can be obtained by reacting mPEG derivatives at acidic pH conditions. This strategy is based on the fact that primary amine residues in proteins have different pKa values: pKa 7.8 for N-terminal ⟨-amino groups and 10.1 for ∑-amino groups in lysine residues. 22 The alkylation of primary amines forms a secondary amine and thus preserves the charge on the N-terminal amino group. 23 However, because of the many proteins that can be embedded throughout the exosomal membrane, different PEGylation levels are expected after the reaction yielding mostly poly-PEGylated and unreacted exosomes.
Further on, the size of the modified exosomes would be expected to increase proportionally with the degree of PEGylation and the molecular size of the mPEG being employed in the reaction. Therefore, it would then be desirable to study the size characteristics of these conjugates and to do so, these should be furtherly purified. For this, size exclusion chromatography (SEC) was selected to try to separate the resulting reaction mixture. In SEC, a sample solution flows through a packed bed of porous packing media and the molecular size of the solutes determines the degree in which they can penetrate the pores. Separation then occurs by a molecular sieving effect where the larger molecules travel through less of the interparticle void fraction than the smaller molecules. In this sense, Figure 3 presents the resulting SEC chromatograms for the separation of the 5 and 20 kDa-modified exosomes when compared to the native un-reacted species. On its part, Table 1 presents the parameters obtained from these chromatograms and further analyses performed from the obtained fractions corresponding to the observed chromatographic peaks. SEC chromatogram comparison of native (orange) and PEGylated exosomes (blue) after reaction. A) 5 kDa mPEG reaction and B) 20 kDa mPEG reaction. Chromatographic parameters obtained for the largest peak of each sample after SEC and posterior analyses.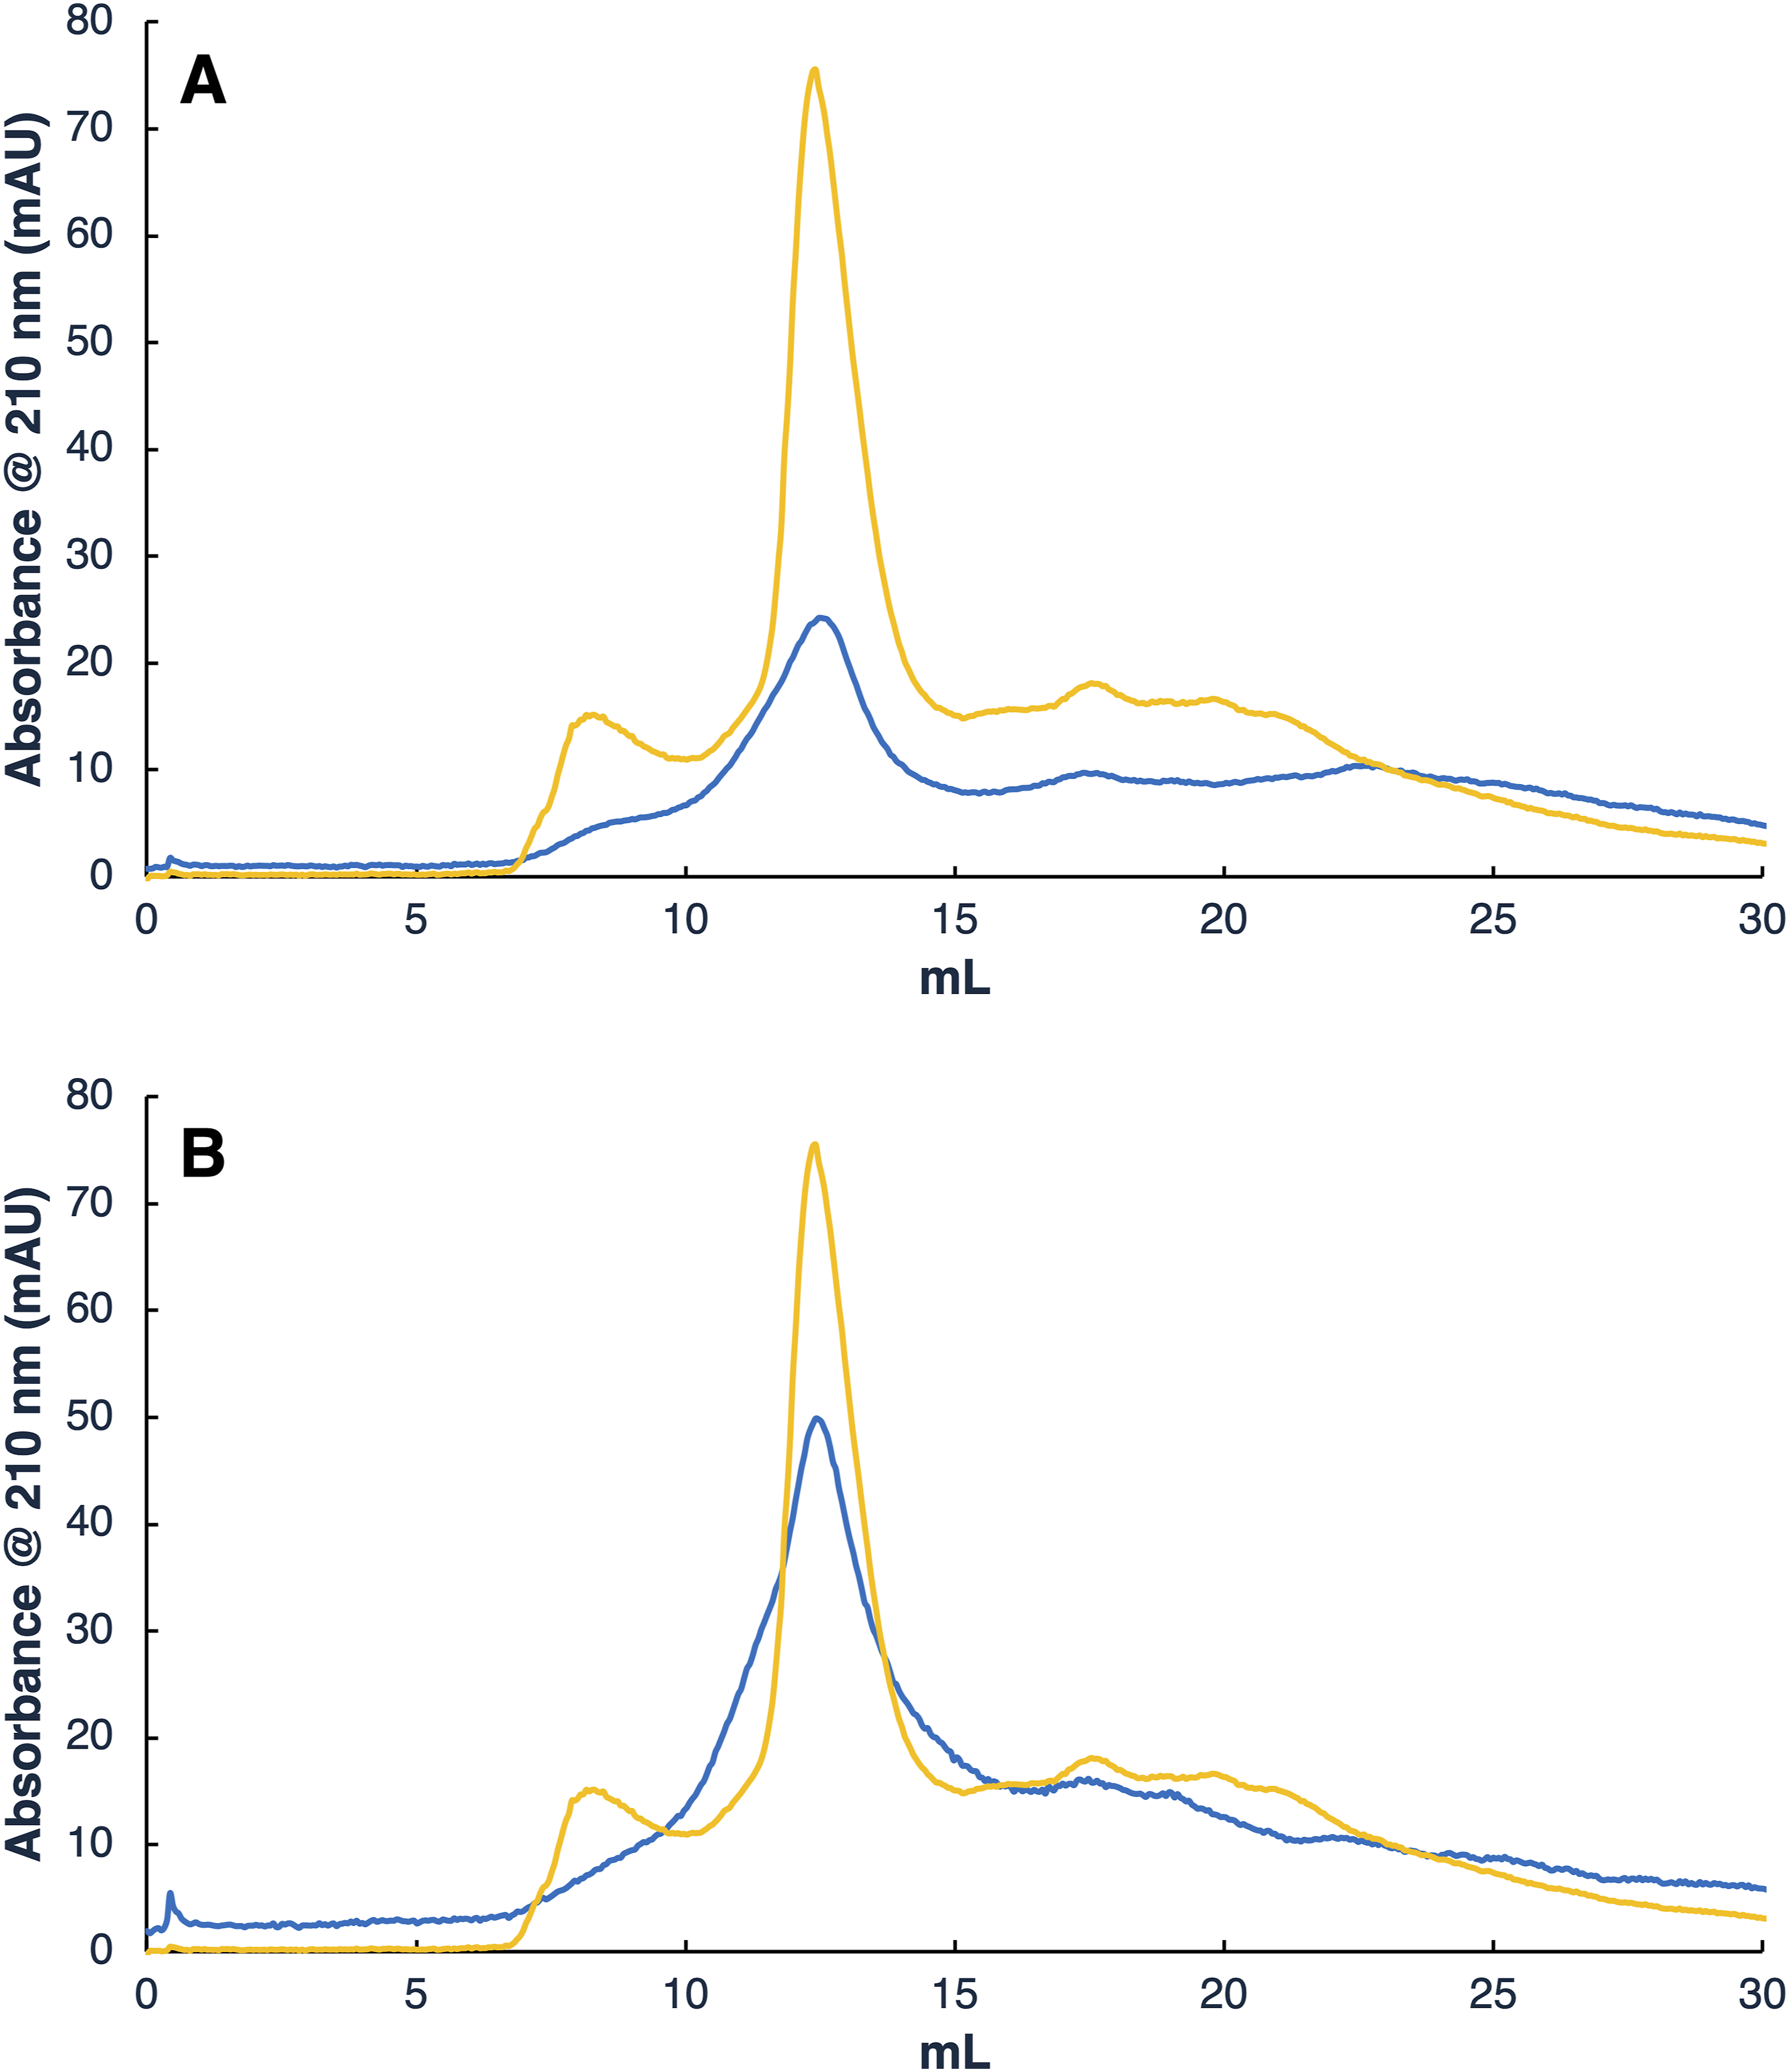
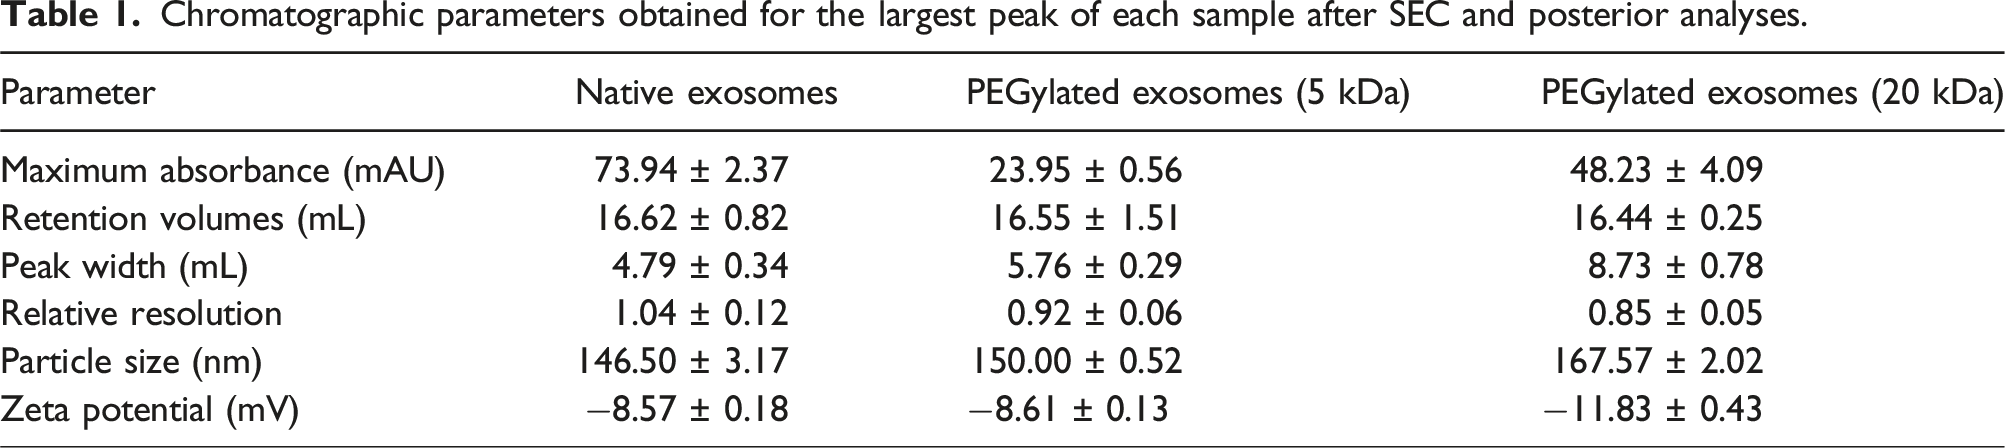
From both Figure 3 and Table 1 several differences can be observed when comparing the unreacted and PEGylated exosome peaks. The most evident of these is the difference in the resulting absorbance after reactions were performed. Other studies have shown that the presence of PEG in a sample tends to reduce the absorbance detected. This effect is of greater relevance between PEGylated and unreacted particles since during PEGylation the polymer is covalently grafted to its structure. 24 Furthermore, since samples were concentrated in ultracentrifugation tubes prior to injection, it is believed that most of the unreacted mPEG was eliminated in this step, leaving only the polymer molecules that reacted with the exosomes. The lower absorbance measurements obtained for the PEGylated exosome samples are an indicator of reaction completion. However, the difference in the maximum absorbance is not directly correlated to the molecular size of the polymer. As noted, the maximum absorbance detected for the resulting peak for the 5 kDa and 20 kDa mPEG reactions are of 23.95 ± 0.56 and 48.23 ± 4.09, respectively, with the 20 kDa mPEG-modified exosomes presenting a higher value. Considering that the exosomal protein content in the PEGylation reactions was standardized, it is believed that the 5 kDa PEGylated exosomes presented a higher degree of modification than those reacted with the 20 kDa mPEG.
Other chromatographic parameters such as peak width drastically changed with the addition of the polymer when compared to the control sample. Another noticeable characteristic is the disappearance of the first peak presented in the control analysis. Both exosomes and polymers present high variability in average size. As it has been mentioned, exosomes extracted for this study are within a range of 50-200 nm. mPEG, on its part, presents a polydispersibility of about ± 1.5% regarding the average molecular weights reported by the manufacturers. A possible explanation for the widening and fusion of the peaks is that it represents the combination of all the different species regarding both the natural differences in exosome size and the manufacturing changes in polymer weight during the synthesis process. These factors appear to form a highly heterogeneous group that could not be separated by SEC.25,26 Since PEGylated exosome samples presented only one distinguishable peak instead of two, the resolution values presented in Table 1 were obtained by comparison with the peak present in the unmodified exosome sample, so an estimate of the resolution lost between them could be obtained.
From the values presented in Table 1s and it can also be seen that the average retention volumes presented a slight decrease correlated to the polymer molecular weight used in the reactions which decreased as this parameter increased. In this sense, since SEC seeks the separation of solutes according to their molecular weight and hydrodynamic radius, such behavior is expected. It should also be noted that mPEG is a very linear molecule so the interaction with the stationary phase presents its peculiarities because chains are able to highly interact with the pores present in the matrix beads. However, since exosomes are much larger in size than the grafted polymeric chains, no particularly large effects would be expected.
In this same line, it is also important to stress that after reaction, the analyzed fractions presented a slight increment in size as assessed by DLS. However, the size measurements for the conjugated exosomes do not correlate to the average PEG sizes that were also measured (4.54 ± 0.02 and 9.46 ± 0.18 nm for the 5 and 20 kDa mPEGs, respectively). This can be explained in two different ways. The first one has to do with the fact that PEGylated exosomes are poly-conjugated. Since reaction conditions do not control the amount of PEG chains being grafted to the exosomes (although reaction conditions do limit the amount of chains per protein to one) multiple chains are at the end present in the resulting nanoparticle conjugates yielding different final sizes for them without a real control on the size outcome of the conjugate. The second manner has to do with how PEG tends to attach itself in certain particles and on how it interacts and structurally changes because of steric effects once grafted to its final site. In some cases, PEG attachment forms coils around the reacting protein where it grafts (shroud model). This model is particularly applicable for protein molecules with multiple PEGylation sites. On the other hand, in most mono-PEGylated molecules, there is a single point from which each polymer chain expands outwards from the particle (dumbbell model). 27 Since exosomes are many times larger than the polymers being used, coiling is not possible throughout the whole exosome. However, this coiling effect could be possible in the near surroundings of the PEGylation site. Therefore, since the configuration of a random coil polymeric chain in solution is dictated by polymer segment excluded volume interactions and the configurational entropy of the chain, it would be possible to observe polymeric chains interacting with the surrounding molecules of the exosomal membrane via other physicochemical mechanisms. This is observed particularly in the exosomes obtained from the reaction with 5 kDa mPEG where the incremental size on the resulting exosomes has no correlation to that of the used mPEG by itself. On their part, the 20 kDa PEGylated exosomes appear to present a dumbbell model behavior as the size measurements show an increment in size of approximately 9 nm, which corresponds to the size obtained for the 20 kDa mPEG by itself. 27 The differences observed in size between the 5 and 20 kDa PEGylated exosomes are then related to the chain sizes. Being shorter, 5 kDa polymer chains have larger possibilities to interact with their surroundings while 20 kDa chains present a larger intrinsic hydrophobicity which leaves little or no enthalpic driving force to wrap the polymer in the exosomal membrane molecules surrounding it. Interestingly, as it can be seen in Figure 2, an exclusion zone surrounding the PEGylated vesicles is present. This may indicate the presence of the added chains of the polymer and might as well be related to the different polymeric conformations previously described since these exclusion zones are more clearly seen in the 5k Da modified sample. However, further analyses are needed to fully confirm this theory.
Size analysis of the different extracellular vesicle groups identified by SEC before and after PEGylation.
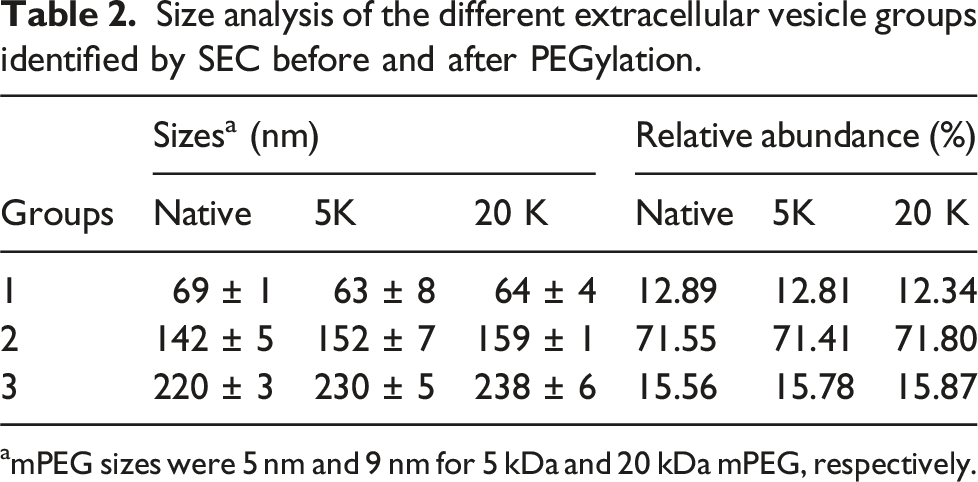
amPEG sizes were 5 nm and 9 nm for 5 kDa and 20 kDa mPEG, respectively.
Comparing the similarities and differences between the SEC pooled groups within the reactions and the unmodified sample, it can be seen that no detectable size change in Group 1 is present (the recorded values for the 5 kDa and 20 kDa reactions were of 63 ± 8 nm and 64 ± 4 nm, respectively). This observation can be explained in two different ways. The first, where we can use the same concepts as before and conclude that both reaction samples present polymers attached to the exosomal surface proteins under the shroud model which does not increase vesicle size in a notable matter (this was not observed previously for the 20 kDa sample); and the second possible explanation concerns the relative low abundance of this nanovesicle group suggesting that reaction only occurs in those groups present in larger concentrations. The data obtained from the samples showed that only 3% of particles were in Group 1, while 71% were in Group 2 and 16% in Group 3.
Electrical distribution of the different extracellular vesicle groups identified by SEC before and after PEGylation.
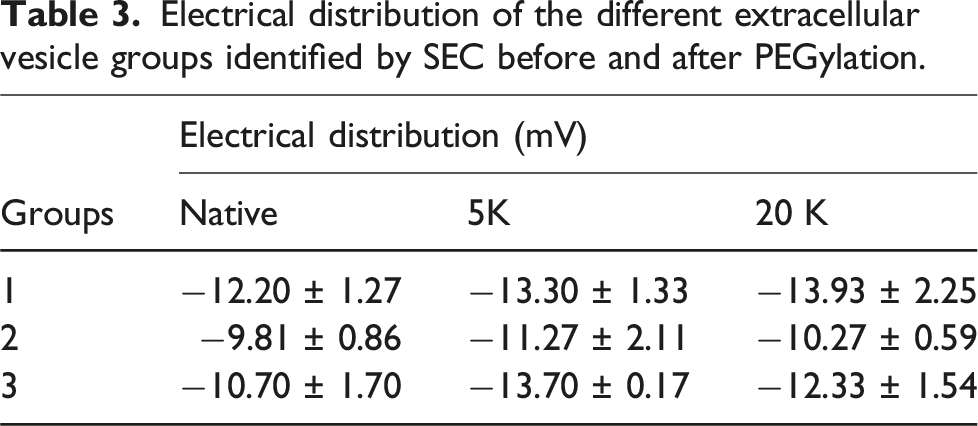
Changes in electrical distribution in the exosomes due to PEGylation have not been previously reported. However, in this study we observed that in both 5 and 20 kDa PEGylated exosome species the obtained zeta potential values tended to be slightly more negative. For instance, when comparing the zeta potential values of the reacted exosomes under the first concentration strategy we see −8.61 ± 0.13, and −11.83 ± 0.43 mV for the 5 and 20 kDa reactions, respectively. For the pooled sample groups after SEC, we observe zeta potential values of −13.30 ± 1.33, 11.27 ± 2.11, and −13.70 ± 0.17 for the 5 kDa reaction and of −13.93 ± 2.25, −10.27 ± 0.59, and −12.33 ± 1.54 for the 20 kDa one. On their part, the native unreacted exosomes presented zeta potential values of −8.57 ± 0.18 mV for the first analysis and of −12.20 ± 1.27, −9.81 ± 0.86, and −10.17 ± 1.70 mV for each identified group in the pooled SEC samples. In this sense, since in protein PEGylation, a net positive charge is lost for every grafted polymer chain resulting from reaction, 28 it could be expected that exosomes would lose a proportional number of positive charges from the proteins where the PEGylation reaction has occurred. Nonetheless, negative changes in zeta potential measurements are insufficient to assume that this difference is indeed caused by polymer grafting or if it is a result of other factors such as the pH changes originated in the reaction or other conditions coming from the purification process. Other reports where modified synthetic nanoparticles have been studied and where the zeta potential resulted in more negative values mention that the change is likely caused by a different reason rather than PEG interacting with the nanoparticle. 29
Significant data was obtained from the protocols presented here, and there were some interesting differences found from the PEGylated samples when compared to the pure exosomes. More studies are needed, however, to thoroughly understand how the alkylating N-terminal specific PEGylation reactions affect the exosomes and what optimizations can be done to improve it.
Experimental procedures
Cell culture
A CaCo2 cell line was used for exosomal production. Cells were maintained in Dulbecco’s Modified Eagle Medium (DMEM) (ThermoFisher, MA, USA) supplemented with 10% of exosome depleted Fetal Bovine Serum (FBS) (ThermoFisher, MA, USA) for their growth and proliferation at 37°C and 5% CO2 atmosphere. Culture media was also supplemented with 1% penicillin-streptomycin solution to avoid any possible culture contamination. Renewal of the media was performed every 24 h and a subculture was done every 48 h or when the confluence of the cells in the plates was dense enough (∼80%). The media that was collected in the renewal or the subcultures was either used for immediate extraction or kept frozen at a temperature of −20°C until further use.
Exosome extraction and purification
Previously collected used culture media was then submitted to the exosome extraction process. This includes two steps: clarification, and ultracentrifugation. For the clarification step, culture media was centrifuged in an Allegra centrifuge (Beckman Coulter, CA, USA) for 30 min at 2100×g. The supernatant was recovered and then filtered using a 0.2 μm syringe filter. The clarified media was then transferred to special clear open top tubes for ultracentrifugation. The tubes were filled up with 10 mM Phosphate Buffer Saline (PBS) to avoid tube collapse and sample loss during the process. Ultracentrifugation was performed in an Optima XE ultracentrifuge equipped with a SW 32 Ti rotor (Beckman Coulter, CA, USA) and the operation conditions were 174,587×g, for 90 min. Once the ultracentrifugation procedure finished, the supernatant was carefully discarded, and the clear pellet was resuspended in 200 μL of PBS and was placed on ice. Exosomes were immediately passed to characterization or stored at −20°C for posterior use. All the processes described here were made at 4°C and the samples were always kept around that temperature to avoid unwanted alterations. Liquid transfers were all done inside a hood in a sterile environment to prevent external contamination.
Sample concentration
Two different strategies were made to maximize protein concentration in the exosomal samples to ensure that the protein quantity was enough for analysis. The first approach was done after the PEGylation reactions by using filter tubes and centrifugation, which is further described later. The second strategy was performed by combining five different exosome tubes that were previously resuspended in 200 μL of PBS in new 1.6 mL tubes. The combined samples were then transferred to the special clear open top tubes for a second round of ultracentrifugation, the tubes were filled with 25 mL of PBS and the ultracentrifugation was performed in the same conditions as in the previous step. (174,587×g, 90 min). The supernatant was discarded, and the pellet was once again recovered in 200 μL of PBS.
Exosome characterization
To assess the presence of exosomes and physicochemical characteristics in the extractions previously performed, total protein content, size, electrical distribution, morphology and biomarker identification were used to prove the presence of exosomes in the samples. For protein content, samples were analyzed in a Nanodrop 1000 spectrophotometer (Thermofisher, MA, USA) at 210 and 280 nm using a calibration curve prepared with Bovine Serum Albumin (BSA) standards of known concentrations (Σ = 0.0005, R2 = 0.9983). Particle size was analyzed by nanotracking analysis (NTA) on a Nanosight NS300 equipment (Malvern Panalytical, UK) at 23°C with a green laser. For this, samples were previously diluted with water at a 1:50 ratio to a final volume of 1 mL. The camera recording analysis was performed 5 times and the results were merged together. To confirm the data obtained from by NTA, size distributions, and to obtain the zeta potential values, the particles in the samples were assessed by dynamic light scattering (DLS) using a Zetasizer Nano SP equipment (Malvern Panalytical, UK) at 25°C an angle of 175° with a 633 nm laser, as previously reported. 30 For this, 10 μL of the samples were suspended in 900 μL of PBS in plastic cuvettes for size measurements. The cuvette contents were then transferred to a zeta potential chamber to evaluate this parameter. Morphology was evaluated by scanning electron microscopy (SEM). Exosomes at total protein concentrations between 180 and 200 µg/mL in ultra-pure water were pelleted by ultracentrifugation using the same equipment and conditions previously described and washed twice in ultrapure water. Then, 10 µL of the sample were added to SEM specimen stubs coated with carbon conductive adhesive tape. Samples were dehydrated in a glass desiccator for at least 8 h and then analyzed by SEM in a Zeiss EVO MA 25 microscope (Carl Zeiss AG, Oberkochen, Germany) after gold sputtering. Exosomal marker CD63 was detected in the obtained exosome samples using the ExoELISA-Ultra CD63 Kit (System Biosciences, Palo Alto, CA) per manufacturer’s instructions to further confirm the presence of exosomes in them.
Exosome PEGylation reactions
After confirming the presence of exosomes and obtaining the total protein quantity in the samples, the amount of PEG to be used for the conjugation was estimated according to traditional N-terminal protein PEGylation reaction conditions reported elsewhere. 27 Since the protein content in exosomes varies after each extraction, a standard procedure was established so that the minimum requirements for any PEGylation reaction to take place are met. In this manner, considering that the previously purified and concentrated exosome samples presented final protein amounts of ∼200 µg/mL and that aliquots of 100 µL of these samples were going to be used in each reaction, 1 mg of either 5 kDa or 20 kDa mono-methoxy polyethylene glycol propionaldehyde (mPEG) (JenKem, Beijing, China) were solubilized in 200 µL of phosphate buffer at pH 5.1 (NaPO4 100 mM;). Out of this polymer mixture 100 µL were transferred to a clean tube and then mixed with the 100 µL of the obtained exosome solution. Finally, 300 µL of the PEG solution with added sodium cyanoborohydride (NaBH3CN, 20 mM) were supplemented to complete the reaction. The final volume for each reaction was 500 µL. The tubes were then agitated at 4°C for 17 h for reaction completion. After this time, the PEGylated exosomes were retrieved and stored at −20°C until further use.
PEGylated exosome separation and characterization
Both 5 kDa and 20 kDa exosome PEGylation reactions were recovered and concentrated separately using Amicon Ultra 4 mL centrifugal filters (Merck, NJ, USA). The original exosome reaction samples before concentration were diluted in around 1.2 mL of PBS. After concentration, the retentates were vortexed to avoid sample losses and were resuspended with 500 µL of PBS. The concentrated PEGylated exosomes were injected in an Äkta Explorer fast protein liquid chromatographer (FPLC) (GE Healthcare, Uppsala, Sweden) to purify and separate the samples by size exclusion. The equipment was equipped with a 500 µL injection loop and a prepacked Superose 12 10/300 column (GE Healthcare, Uppsala, Sweden) was used as a stationary phase. The flow was isocratic and only one elution phase was used, this being a phosphate buffer with potassium chloride (NaH2PO4•H2O 3.1 mM; Na2HPO4 7•H2O 6.9 mM; KCl 150 mM; pH 7.2). The volumetric flow rate for the whole process was kept at 0.4 mL/min. Injected samples were monitored in situ spectrophotometrically at 210 and 280 nm. After the separation was completed 36 fractions were obtained, each of them recovered for further analysis. A pure exosome sample with a protein concentration of 1 µg/mL was submitted to the same process as a control and then compared with the PEGylated exosome results. The recovered fractions were analyzed in the Nanosight NS300 and the Zetasizer Nano to evaluate size and the zeta potential under the same conditions previously described.
Data analysis
All data in this work are reported as the average of at least three replicates, with their respective estimated experimental errors.
Conclusion
This study has shown that with PEGylation the physicochemical characteristics of exosomes can drastically change. However, this is directly related to the size of the polymer used as, 5 kDa mPEG PEGylated exosomes did not present significant changes in size or superficial electrical distribution compared to the original exosomes, only 5 to 10 nm in size and 2-3 mV for zeta potential, while the 20 kDa mPEG PEGylated exosomes showed the largest size differences of up to a 20 nm increase, and a larger reduction of the zeta potential value. However, the way that mPEG interacts with the grafted molecules in the exosomal membrane directly correlates to the measured size of the nanoparticles. Particularly, it is believed that lower polymer molecular sizes tend to interact in a larger proportion with the PEGylation site surroundings than their larger counterparts. However, future studies are needed to evaluate other parameters to better understand these types of reactions and their resulting interactions. After these types of reactions are fully characterized, and more of the involved parameters are known, different PEGylation approaches can be established to exploit them to better harness potential applications of exosomes in pharmaceutical applications. Other than size and electrical distribution, significant changes in absorbance (reduction of about 34% and 67% for 5 kDa and 20 kDa, respectively) and morphology were also present when compared to pure exosomes, all these new characteristics may also affect and improve the modified exosomes capacity in the development of clinical applications. Our research group is currently performing in vitro assays to compare sEVs activity between PEGylated and non-PEGylated samples to evaluate their use as an efficient pharmaceutical or nutraceutical vehicle.
Footnotes
Acknowledgments
The authors would like to thank the School of Engineering and Sciences and the FEMSA-Biotechnology Center at Tecnológico de Monterrey for their support through the Food Security Flagship Project at the Health Research Hub. Andrés Martínez-Santillán thanks the Department of Science, Humanities, Technology, and Innovation of Mexico (Secretaría de Ciencia, Humanidades, Tecnología e Innovación, SECIHTI) for scholarship number 967721.
Declaration of conflicting interests
The author(s) declared no potential conflicts of interest with respect to the research, authorship, and/or publication of this article.
Funding
The author(s) received no financial support for the research, authorship, and/or publication of this article.