






Abstract
Polycaprolactone (PCL) has been widely applied in the fields of medical aesthetics and clinical filling due to its excellent biocompatibility, controllable degradability, and favorable mechanical properties. However, the high crystallinity and hydrophobicity result in a longer degradation period, making it more suitable for long-term and sustained filling treatments. Yet it is difficult to observe the degradation endpoint in a short period of time, which poses a challenge for the safety and efficacy evaluation of the product before its market launch. At present, the differences in in vivo behavior among various PCL microspheres and their clinical implications remain incompletely understood. In this study, a subcutaneous implantation model in rabbits was employed to investigate the in vivo degradation patterns of two types of PCL microsphere fillers and the material–tissue interactions contributing to the establishment of bodily homeostasis. The results demonstrated that PCL microsphere fillers achieve a homeostasis of safety at 12 months through a sequential process involving “surface erosion–cellular involvement–collagen encapsulation.” Furthermore, they maintain a homeostasis of efficacy for at least 30 months via a collagen remodeling strategy characterized by “initial reinforcement, subsequent shaping, and eventual equilibration,” thereby forming a predictable dynamic filler construct. These findings provide a mechanistic basis for individualized clinical application and quality evaluation.
Introduction
Injectable dermal fillers represent an important class of biomaterials in the fields of medical aesthetics and reconstructive surgery, with their core function being the physical restoration of skin volume or the induction of de novo collagen synthesis.1,2 Polycaprolactone (PCL) is a resorbable polymer used in devices approved by the U.S. Food and Drug Administration (FDA) and bearing the European Conformity (CE) mark. 3 Owing to its high crystallinity and hydrophobicity, PCL exhibits a slow degradation rate in vivo, rendering it suitable for long-lasting filling treatments. However, this also poses challenges for the evaluation of the safety and effectiveness of the product - it is difficult to observe the degradation endpoint in a short period of time, resulting in insufficient understanding of the material’s behavior within the body. In 2009, PCL-based fillers entered the aesthetic market, 4 where they activate immune and fibroblast functions through their intrinsic degradation characteristics, thereby inducing collagen deposition and facilitating a functional transition from material-based filling to tissue regeneration.5,6 Ellansé, a filler composed of 70% carboxymethylcellulose gel and 30% PCL microspheres, exhibits clinical durations ranging from 9 months to 4 years and has emerged as one of the most widely recognized materials in the current medical aesthetics market. 7 To date, three products have been approved for market entry in China. Nevertheless, whether subtle differences in the formulations of PCL microsphere fillers lead to distinct clinical outcomes remains insufficiently investigated. Despite the widespread clinical application of PCL-based fillers, the precise relationship between microsphere degradation kinetics and the temporal sequence of tissue remodeling remains poorly characterized across diverse clinical scenarios. Furthermore, how subtle variations in material formulations translate into distinct in vivo behaviors and long-term clinical outcomes is still largely unknown, hindering the establishment of predictive evaluation frameworks and quality control standards. Therefore, elucidating the in vivo degradation kinetics of PCL microspheres and their interaction mechanisms with host tissues, along with establishing evaluation methodologies capable of identifying material differences and predicting in vivo behavior, is of critical importance for advancing the mechanistic understanding and quality standardization of such products.
Existing studies have preliminarily validated the safety and efficacy of PCL-based fillers. Kim et al.4,8 demonstrated that PCL microspheres with varying physicochemical properties exhibit favorable safety profiles in vivo. Liu et al. 9 expounded that the PCL filler can restore the vitality of subcutaneous fat tissue in the cosmetic and reconstructive fields, and at the same time enhance the volume and elasticity of the skin, demonstrating certain effectiveness. Kim JS et al. 6 conducted PCL microsphere injection therapy on multiple Asian women and found that it could stimulate new collagen and angiogenesis, resulting in an increase in skin thickness. The effectiveness may last for more than 4 years. However, current research largely focuses on verifying the outcomes of collagen stimulation induced by different PCL microspheres, while the intermediate processes—specifically how material degradation sequentially guides tissue remodeling and establishes a predictable material–tissue dynamic equilibrium—remain insufficiently elucidated. Regarding the mechanisms underlying the maintenance of filling effects, existing understanding remains confined to the static concept of “longevity,” lacking a deeper perspective grounded in dynamic homeostasis, and the specific connotations and patterns of safety homeostasis and efficacy homeostasis have yet to be systematically characterized. Furthermore, safety evaluations predominantly rely on conventional biocompatibility assays (e.g., cytotoxicity testing), overlooking the temporal tissue responses triggered by dynamic changes in the material’s physicochemical properties during degradation. Moreover, a systematic link between material quality attributes and the predictability of in vivo degradation behavior has not been established, hindering a comprehensive assessment of clinical variability among different products.
The efficacy of PCL-based fillers relies on the coordination between degradation and tissue regeneration, which is fundamentally governed by the interfacial interactions at the material–tissue interface.10–12 Chemical signals released through surface erosion of the microspheres,13,14 along with physical cues arising from morphological changes, 15 collectively modulate cellular behavior and extracellular matrix deposition. This process exhibits distinct temporal stages: an initial phase of recognition and acute inflammation, 16 a middle phase of intensified degradation and cytokine release, 17 and a later phase of matrix deposition and structural remodeling.16,18 Current studies lack longitudinal tracking of the correlation between microsphere degradation and tissue responses,19,20 resulting in an incomplete understanding of the evolutionary patterns underlying the material–tissue dynamic equilibrium and the mechanisms by which homeostasis is established. Therefore, it is particularly important to establish an evaluation framework centered on degradation kinetics, the mechanisms of homeostasis establishment, and the temporal sequence of material–tissue interactions. This study employed a multi-scale evaluation method and used a subcutaneous implant model in rabbits to track the degradation behavior of two types of PCL microsphere fillers within the body. It clarified that the changes in material physical and chemical properties initiated and regulated the sequence of interactions with the tissue, thereby forming a stable state. The study further aimed to reveal the material–tissue interaction mechanism characterized by “surface erosion–cellular involvement–collagen encapsulation,” along with the dynamic evolution of tissue composition and structure throughout this process, and to define the establishment of safety homeostasis and efficacy homeostasis. These findings provide a mechanistic basis for the study of PCL-based fillers and their individualized clinical application.
Materials and methods
In vivo experiments
Experimental materials and methods
Two different PCL-based fillers were selected and designated as sample group T1 (injectable polycaprolactone microsphere filler, manufactured by Xihong Biopharma, Jiangsu, China) and sample group T2 (Ellansé S, manufactured by AQTIS Medical B.V., the Netherlands). A total of 24 Japanese white rabbits, with an equal ratio of males to females and body weights ranging from 2.5 kg to 3.0 kg, were obtained from Pizhou Dongfang Breeding Co., Ltd,China (License No.: SCXK (Su) 2022-0004). All animal procedures were approved by the Institutional Animal Care and Use Committee (IACUC) of Sichuan Medical Device Biomaterials and Products Inspection Center Co., Ltd (Approval No.: YX2023-050002), confirming compliance with experimental animal welfare and ethical requirements. The study design adhered to the 3R principles (Replacement, Reduction, and Refinement) to minimize animal suffering and reduce the number of animals used. The animals were individually housed under constant temperature conditions of 16°C–26°C, with a relative humidity of 30%–70%, a 12 h light–dark cycle, and free access to water. Following an acclimatization period, the rabbits were randomly divided into groups corresponding to 1 month (M), 6 M, 12 M, 18 M, 24 M, and 30 M, along with an additional group, with N = 3 per group (determined according to the minimum requirements of GB/T 16886.6-2022 (ISO 10993-6:2016)
21
for implantation studies). Injection sites were marked on the back of the rabbits, symmetrically on both sides of the midline of the spine. There were four points on each side, among which 6 points were for sample 1 (T1) and two points were for sample 2 (T2). 0.2 mL of the contents were injected at each point. As shown in Figure 1. Overall flowchart of degradation experiments with different PCL microsphere fillers.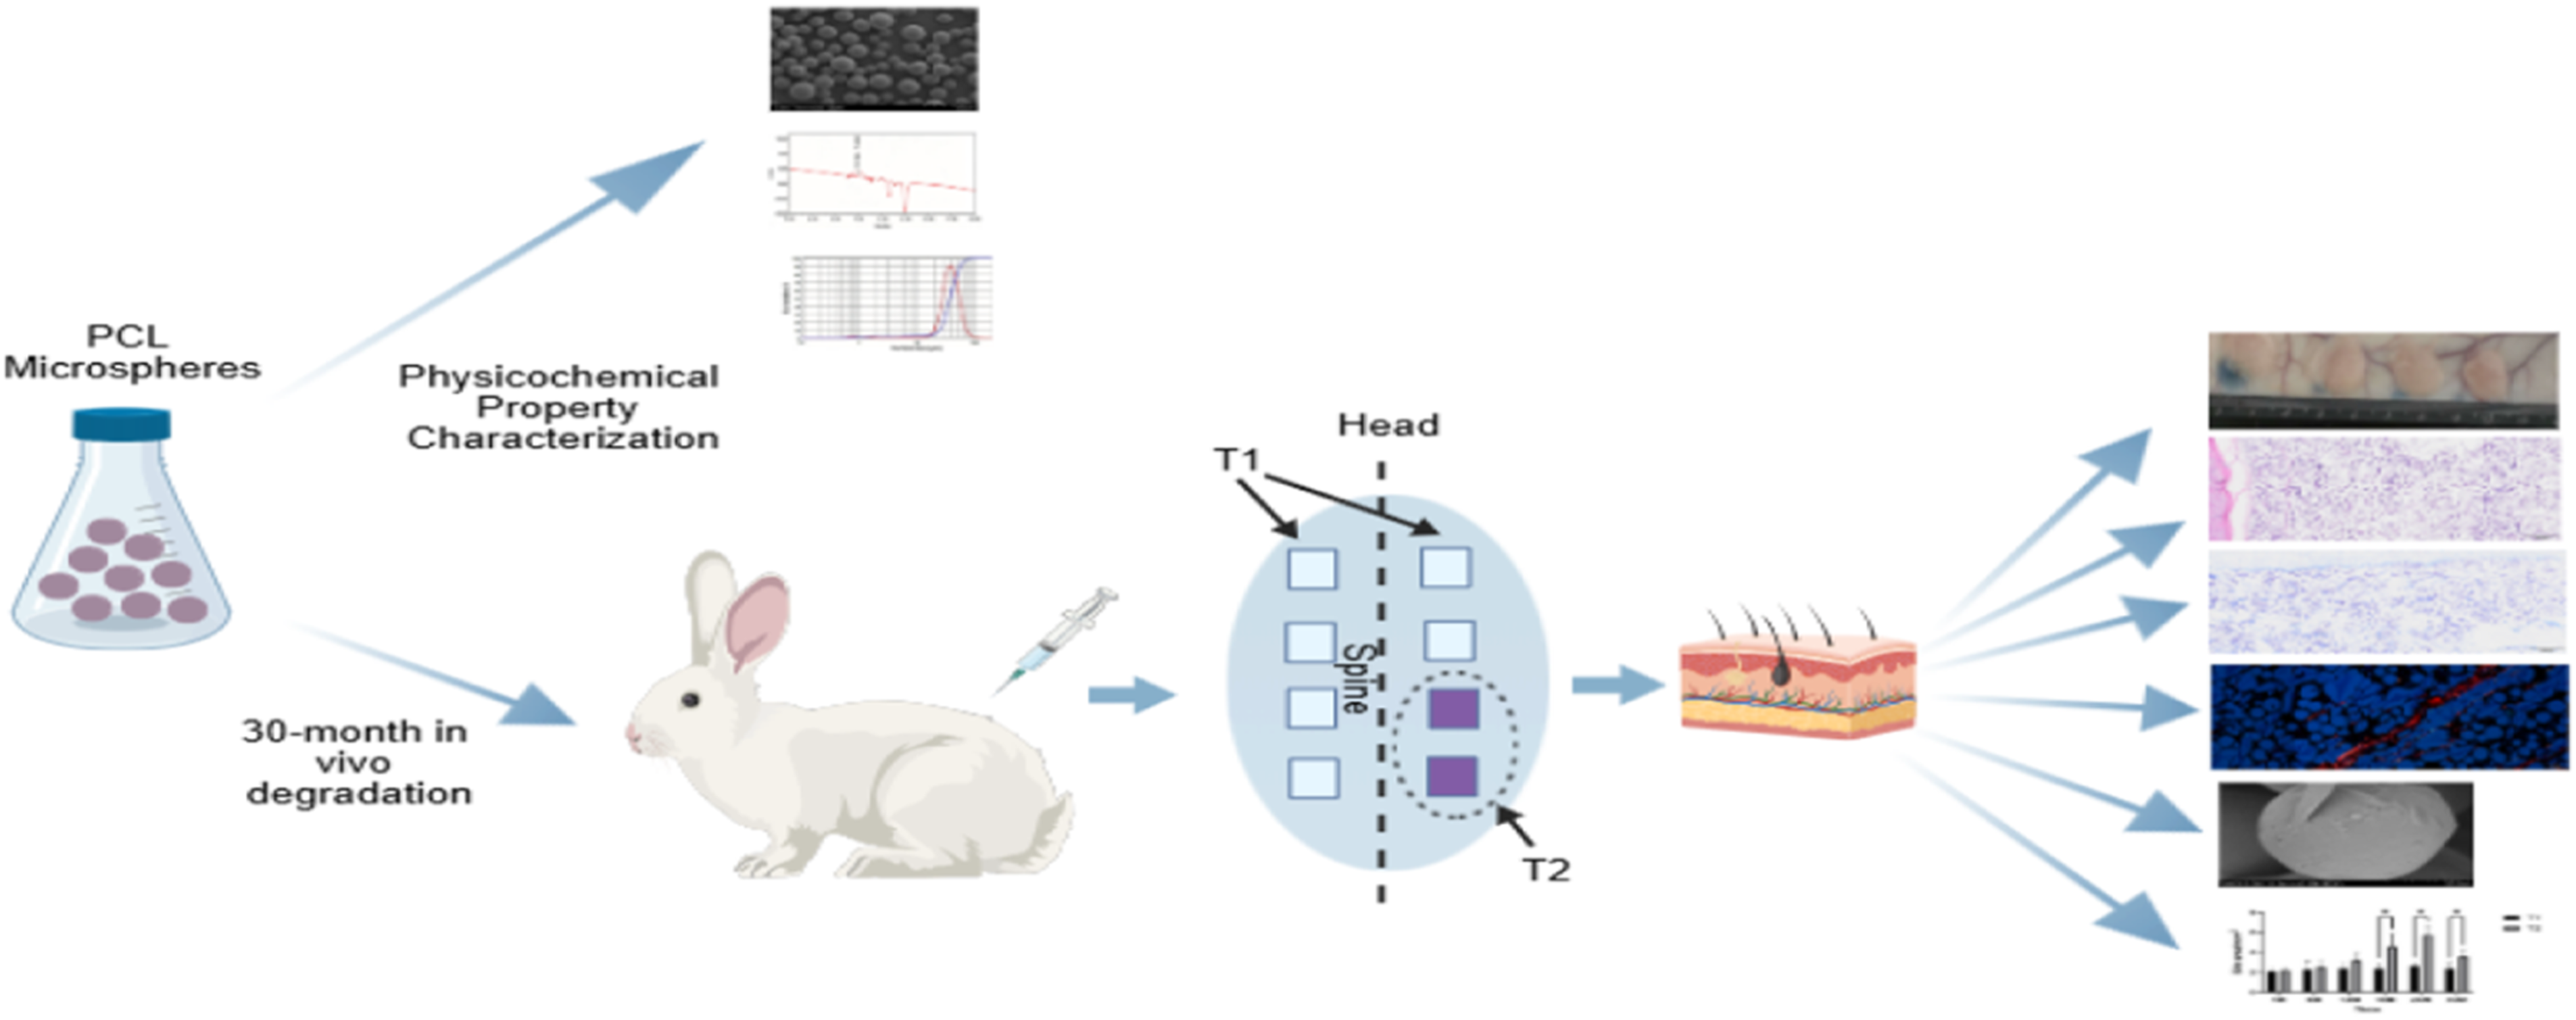
Scanning electron microscopy
At the designated time points post-injection, the rabbits were euthanized, and the skin was incised longitudinally along the dorsal midline to expose the injection sites on the T1 and T2 sides. The excised skin tissues were subjected to fixation, dehydration, drying, and conductive treatment. Specifically, the tissues were fixed, dehydrated through graded ethanol solutions, and dried. Prior to SEM examination, the samples were sputter-coated with gold using an SBC-12 small ion sputtering instrument (JS-19168, KYKY, China). The sputter-coated tissues were observed under vacuum using a field-emission scanning electron microscope (S-4800, Hitachi, Japan) to examine the surface morphology.
Particle size distribution measurement
The particle size distribution of PCL microspheres was measured using a laser particle size analyzer (BT-9300ST, China). Briefly, microspheres were dispersed in an appropriate medium and sonicated to ensure uniform suspension. The particle size distribution was determined by laser diffraction, and the median particle size (D50) was calculated from the cumulative distribution curve. A total of 21 samples were analyzed for each group.
Molecular weight (MW)
The molecular weight of PCL microspheres was determined by gel permeation chromatography (GPC). The analysis was conducted using Waters Empower 3 GPC software, and the weight-average molecular weight (Mw) was calculated using the universal correction method.
Hematoxylin and Eosin (H&E) staining
Subcutaneous tissues were excised and fixed in 10% neutral buffered formalin (ready-to-use, batch No. 23021702, Guangzhou Weigesi Biotechnology Co., Ltd). The fixed tissues were then placed in tissue embedding cassettes (batch No. 23009, Jiangsu Shitai Laboratory Equipment Co., Ltd), rinsed with PBS, and processed through an automatic tissue processor (ASP6025 S, Leica Microsystems, Shanghai) with graded ethanol dehydration (anhydrous ethanol, batch No. 2024022901, Chengdu Kelong Chemical Co., Ltd), clearing with xylene (batch No. 2024031001, Chengdu Kelong Chemical Co., Ltd), and paraffin embedding (high-efficiency sectioning paraffin, batch No. 20230118, Shanghai Hualing Rehabilitation Instrument Factory; embedding center Histo Star, Thermo Fisher Scientific, China). Paraffin blocks were sectioned at 4–5 μm using a semi-automatic rotary microtome (RM2245, Leica Microsystems, Shanghai), mounted on pathological-grade microscope slides (batch No. 23026, Jiangsu Shitai Laboratory Equipment Co., Ltd), and stained using an automated stainer (Gemini AS, Thermo Fisher Scientific, China). H&E staining was performed as follows: hematoxylin solution (Cat. No. 123638, Richard-Allan Scientific LLC) for nuclear staining, differentiation with Clarifier 2 (Cat. No. 122494, Richard-Allan Scientific LLC), bluing with bluing solution (Cat. No. 122283, Richard-Allan Scientific LLC), and counterstaining with eosin solution (Cat. No. 136867, Richard-Allan Scientific LLC). Sections were coverslipped with neutral balsam (batch No. 20230928, Solarbio) and observed under a microscope. The implant boundary area and microsphere counts were semi-quantitatively analyzed using ImageJ, as shown in Figure 5(e).
Masson staining
Tissue preparation (fixation, dehydration, clearing, embedding, and sectioning) was performed as described in Section Hematoxylin and Eosin (H&E) staining. Masson’s trichrome staining was conducted using a Masson’s Trichrome Staining Kit (Cat. No. CR2403005, Wuhan Servicebio Biotechnology Co., Ltd) on an automated stainer (Gemini AS, Thermo Fisher Scientific, China), following the manufacturer’s instructions. This staining distinguishes collagen fibers (blue) from muscle fibers (red). Sections were coverslipped with neutral balsam (batch No. 20230928, Solarbio) and observed under a microscope.
Sirius Red staining
Tissue preparation was performed as described in Section Hematoxylin and Eosin (H&E) staining. Sirius red staining was conducted using a Modified Sirius Red Staining Kit (Cat. No. 240007005, Beijing Solarbio Science & Technology Co., Ltd) on an automated stainer (Gemini AS, Thermo Fisher Scientific, China), following the manufacturer’s instructions. Sections were coverslipped with neutral balsam (batch No. 20230928, Solarbio) and observed under a microscope equipped with polarized light filters. For each section, multiple tissue fields were randomly selected at 400× magnification, and the area percentages of type I and type III collagen fibers were calculated using Image-Pro software.
Data analysis
Data, including the percentage expression of type I and type III collagen fibers, implant site area, histological and cellular scores, and microsphere counts, were analyzed using normal distribution assumptions, two-way analysis of variance (two-way ANOVA), and nonparametric t-tests. Multiple comparisons were performed to compare the mean of each cell with the means of other cells. Results are expressed as mean ± standard error of the mean (X ± SEM), with a significance level set at α = 0.05. Graphical representations were generated using GraphPad Prism version 10.4 in a grouped format. A p-value ≤0.05 was considered statistically significant, while p > 0.05 indicated no statistically significant difference.
Results
Physicochemical characterization
The PCL microspheres in group T1 exhibited a three-dimensional spherical morphology, with most displaying a smooth surface and a tendency toward aggregation. The particle size distribution was heterogeneous, with a median diameter (D50) ranging from 30 μm to 45 μm. The weight-average molecular weight (Mw) ranged from 11,000 to 33,000 Da, and the polydispersity index (PDI) was ≤2.3. In contrast, the PCL microspheres in group T2 also presented a three-dimensional spherical structure, with some showing smooth surfaces and a tendency toward aggregation; however, the particle size distribution was relatively homogeneous, with a D50 of 37 μm. Representative images are shown in Figure 2(a)–(d). (a) Particle size distribution of group T1; (b) Molecular weight distribution of group T1; (c) Scanning electron microscopy (SEM) image of group T1 (x300); (d) SEM image of group T2 (x300).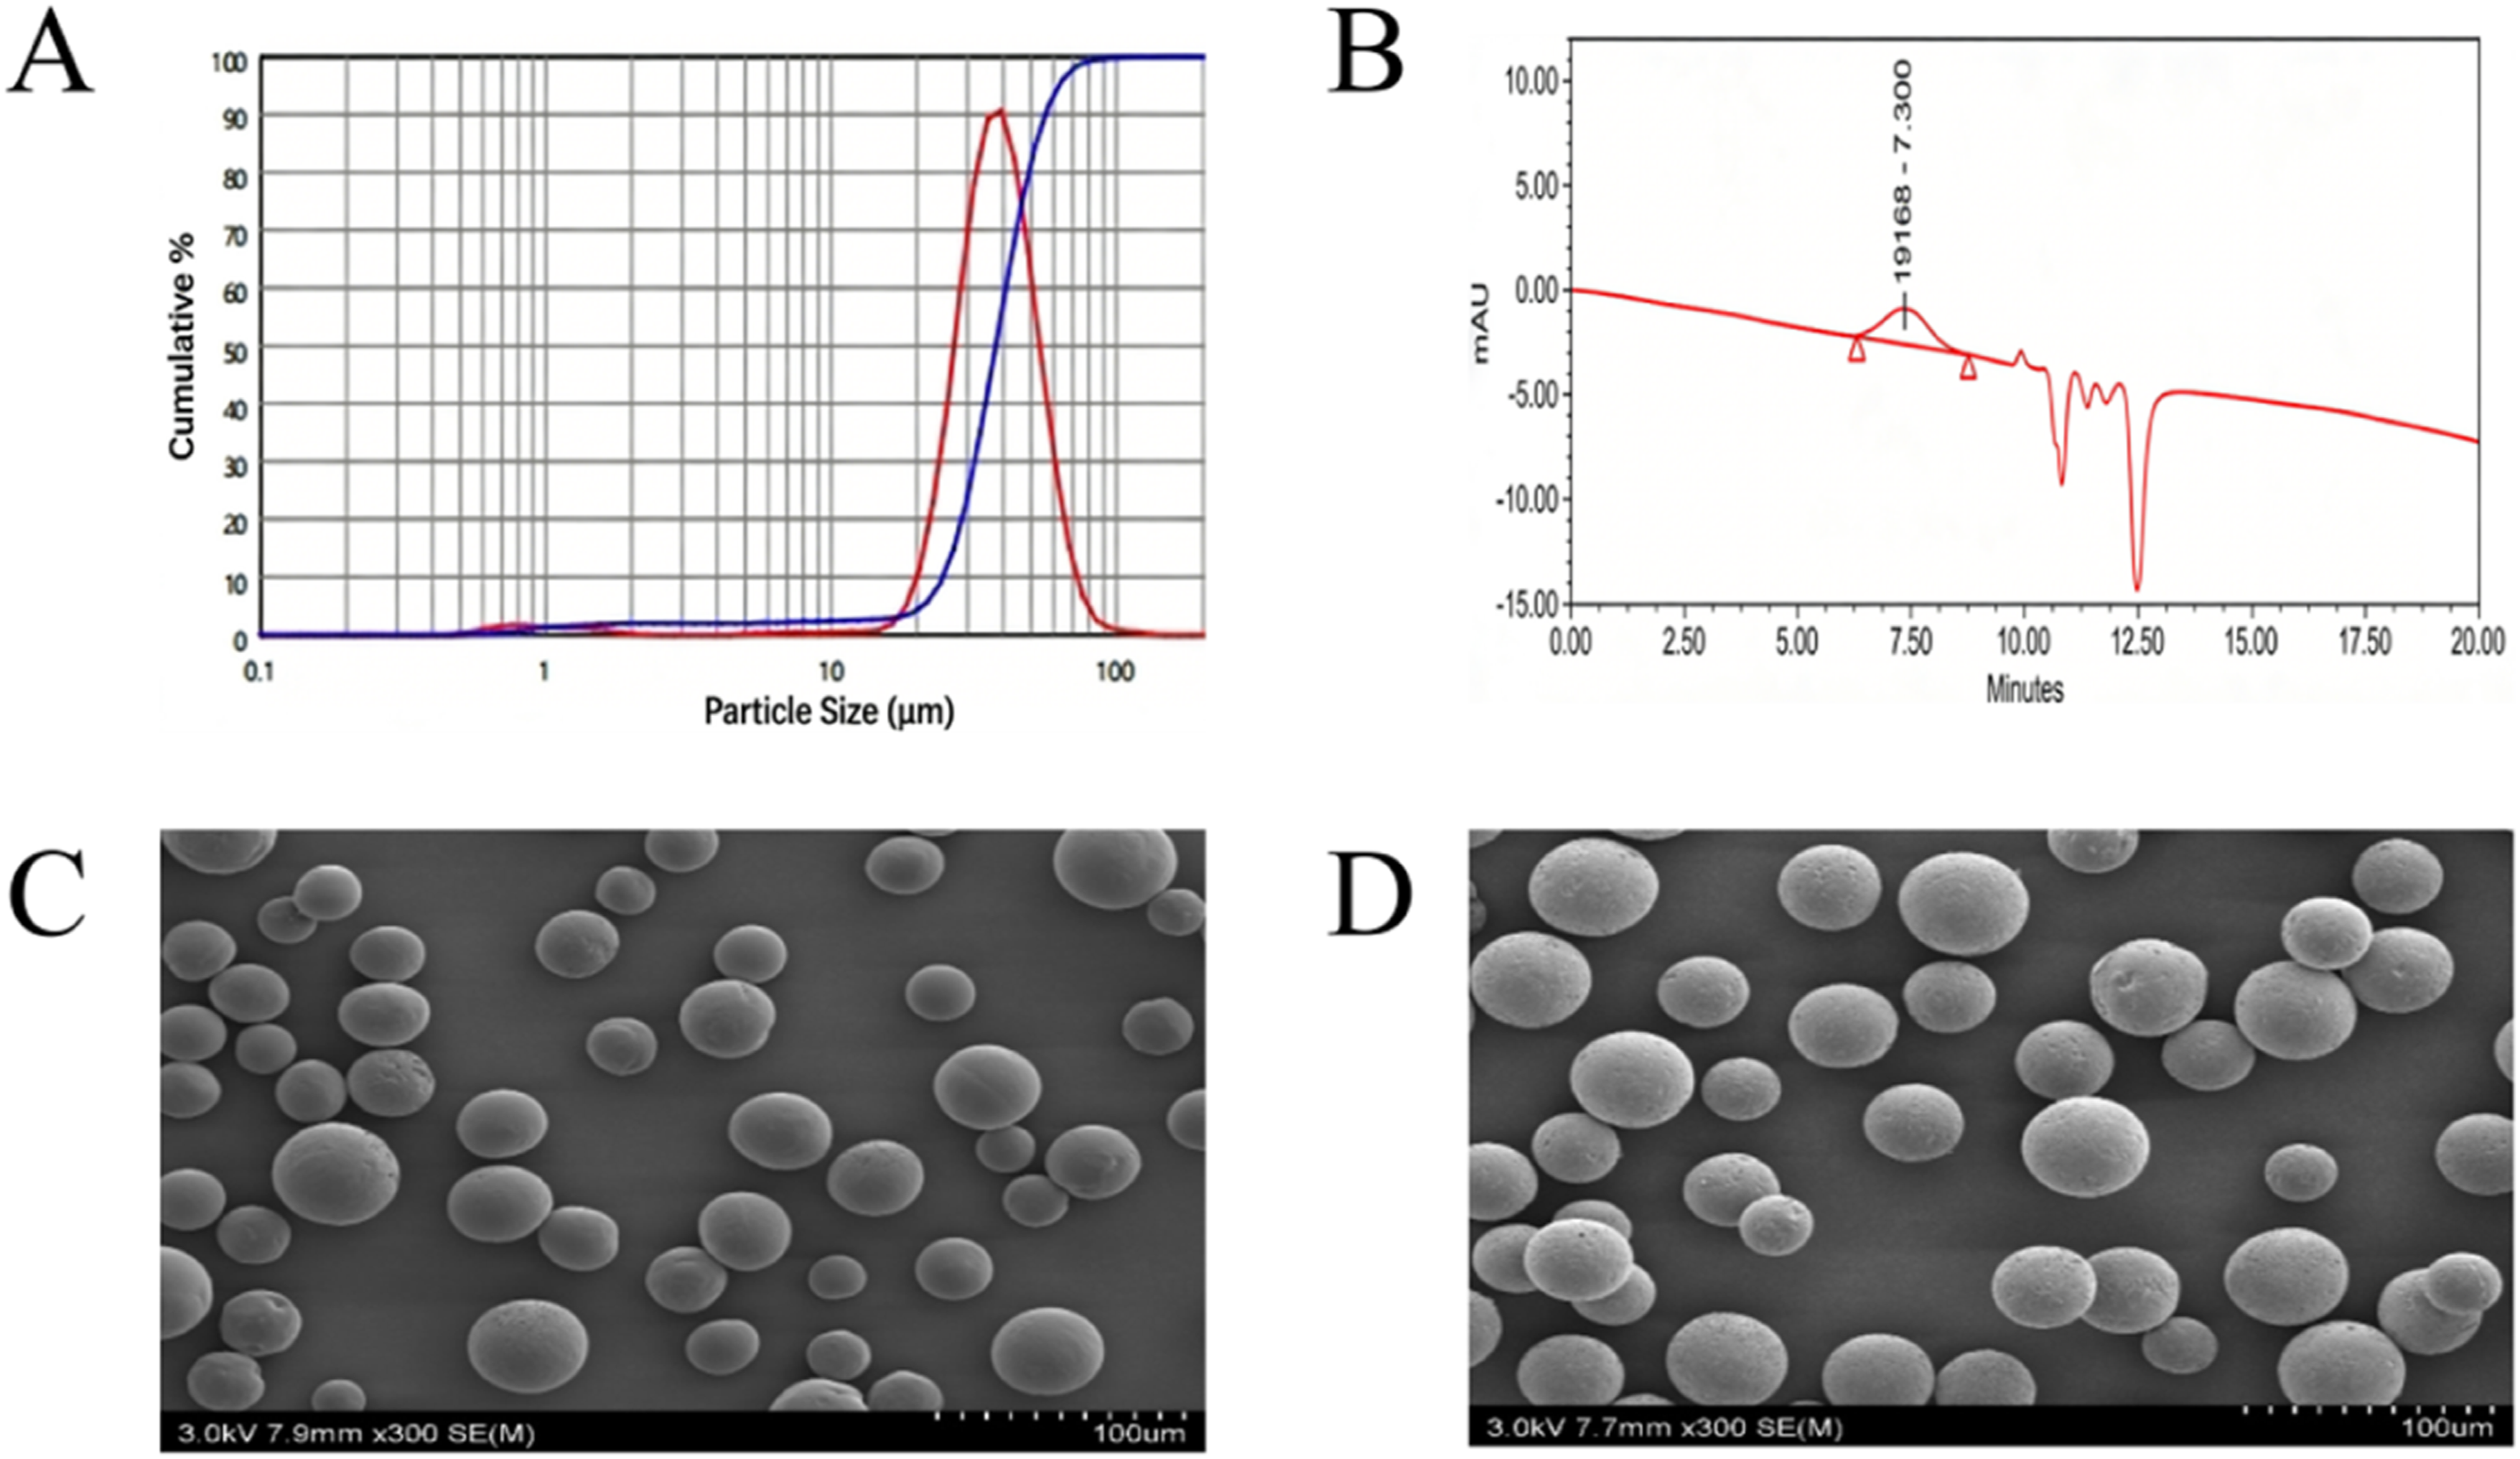
In vivo degradation
Gross observation
Following the injection of PCL microspheres, the animals were observed daily within the first week and weekly thereafter. Throughout the observation period, the animals exhibited good general status with no significant abnormalities in mental state, food intake, water consumption, respiration, defecation, or locomotion. At the 1-, 6-, 12-, 18-, 24-, and 30-months time points, subcutaneous tissues were examined upon dissection, revealing no obvious abnormalities. The filler materials were palpable at the injection sites; the relative hardness was qualitatively assessed by manual palpation. Specifically, experienced researchers gently pressed the material surface with their fingers to evaluate relative hardness and consistency. The hardness of T1 was greater than that of T2 upon palpation, and the hardness of both groups exhibited a decreasing trend with prolonged implantation time, as shown in Figure 3(a). (a) Gross anatomical images; (b) Scanning electron microscopy (SEM) observation of PCL microsphere morphology and surrounding fibrous tissue.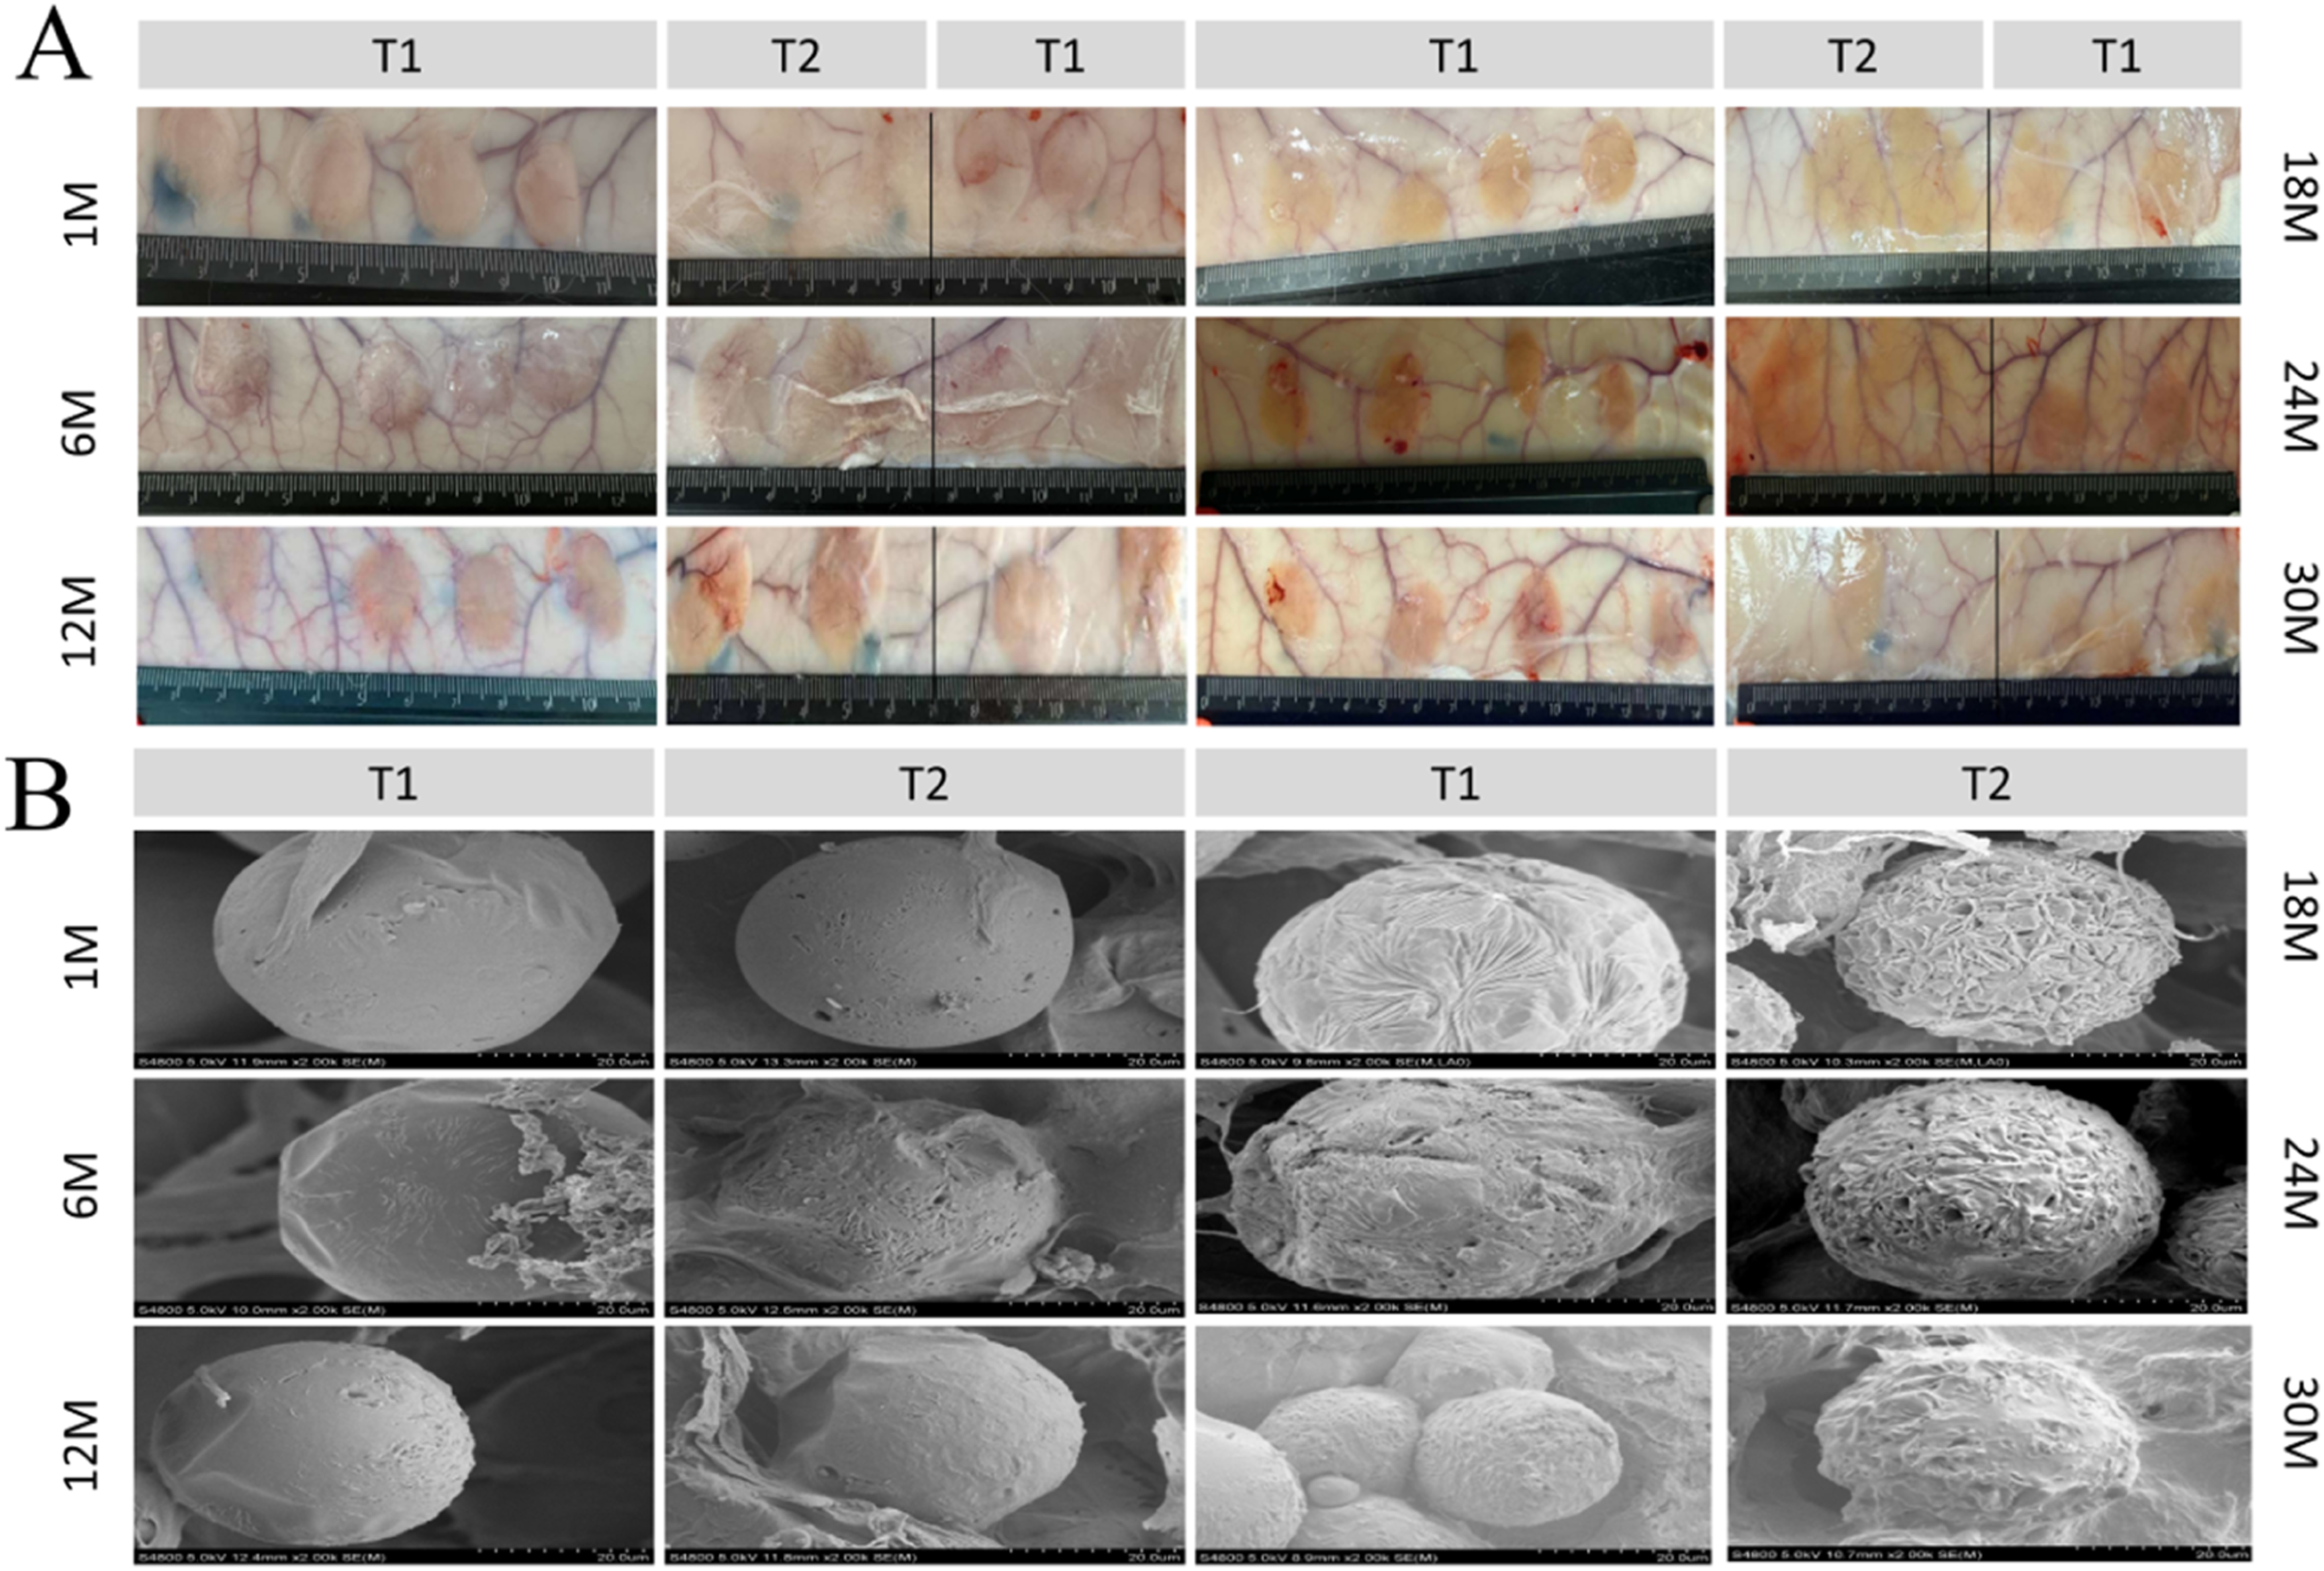
Scanning electron microscopy (SEM) - Microsphere morphology characterization observation
Scanning electron microscopy was employed to observe the number, morphology, and surface characteristics of the microspheres, as well as the state of the surrounding tissues, as shown in Figure 3(b). At 1 month, microspheres in both groups exhibited an aggregated state with smooth surfaces. In the T1 group, a small number of microspheres displayed surface depressions, with visible “pores” and fine “striated” markings. In the T2 group, a few microspheres showed slight surface depressions, with a greater number of “pores” that gradually enlarged and coalesced into “striated” patterns. At 6 months, the smooth surface layers of the microspheres in both groups progressively detached. In the T1 group, a substantial number of microspheres exhibited “striated” surface structures, along with the onset of surface depression, deformation, and pore formation. In the T2 group, the majority of microspheres had undergone obvious deformation, with coexisting “striated” structures and “pores,” indicating a more pronounced degree of degradation compared to the T1 group. At 12 months, in the T1 group, the smooth surface layer had largely detached, exposing a large number of microspheres; the “striated” markings progressively covered the surface and began to exfoliate, while the “pores” enlarged, revealing the internal structure. In the T2 group, the smooth layer on the surface of the microspheres continuously fell off. A large number of “striated” structures on the surface of the microspheres completely covered and gradually deformed and became concave. Local areas formed “crystalline” structures. At 18 months, in the T1 group, the microsphere surfaces were covered with “striated” structures and exhibited surface depression and deformation, with occasional “block-like” and “crystalline” structures observed on individual microspheres. In the T2 group, the “striated” structures exfoliated, while “block-like” and “crystalline” structures extensively formed, accompanied by pronounced overall deformation of the microspheres. Both groups entered a stage of microsphere structural disintegration. At 24 months, in the T1 group, the microspheres remained relatively aggregated, with surfaces covered by an incomplete thin fibrous layer and a reduction in structural integrity. In the T2 group, the microsphere surfaces continued to display irregular “striated” structures, accompanied by the deposition of a thin fibrous layer and evident accumulation of degradation products. At 30 months, in the T1 group, a small number of microspheres remained aggregated, with the majority of the “striated” surface structures covered by a thin fibrous layer. In the T2 group, the microspheres remained relatively aggregated, with most of the “striated” surface structures similarly covered by a thin fibrous layer, and the state of microsphere aggregation tended toward stabilization.
H&E staining – Observation of tissue and microspheres
Hematoxylin and eosin (H&E) staining was performed to evaluate local tissue reactions at the injection sites, as well as the morphology and migration of the microspheres, as shown in Figure 4. Following intradermal injection, the T1 and T2 groups exhibited distinct patterns of inflammatory foreign body responses and material degradation processes. At 1 month, both groups displayed round microsphere structures in the implant area, surrounded by a cellular layer. In the T1 group (microspheres with gel), the thickness of the cellular layer ranged from 4 to 110 μm, with gel extensively distributed in the inter-microsphere spaces. In the T2 group (microspheres only), the cellular layer thickness ranged from 3 to 120 μm. Fibroblasts and fibrocytes were observed within the cellular layers of both groups. Tissue ingrowth into the material region resulted in the encapsulation of microspheres, forming round cavities. Occasional neocapillaries were observed between microspheres, and the inflammatory response was mild, with only scattered polymorphonuclear leukocytes, gaint cells, and minimal numbers of lymphocytes and macrophages. At 6 months, in the T1 group, gel distribution was markedly reduced compared to the earlier time point, and the cellular layer thickened to 10–530 μm. In the T2 group, the cellular layer thickness ranged from 4 to 200 μm. There was a large area of cell layer ingrowth in the material area of both groups, mainly fibroblasts, accompanied by a small amount of fibroblasts and fiber components. At this stage, the inflammatory responses differed between the two groups in certain regions. The T1 group exhibited a more diverse pattern of inflammatory cell infiltration, with polymorphonuclear leukocytes, lymphocytes, giant cells, and numerous foamy macrophages distributed across most regions. In contrast, the T2 group displayed a focal inflammatory response, characterized by the presence of foamy macrophages in only a few regions, where the number of microspheres was markedly reduced, accompanied by scattered lymphocytes, macrophages, and minimal polymorphonuclear leukocytes. At 12 months, no significant gel residue was observed in the T1 group, with the cellular layer thickness decreasing to 4–50 μm. In the T2 group, the cellular layer thickness ranged from 3 to 90 μm. Both groups predominantly exhibited fibrocytes and fibrous components, maintaining a round cavity structure. Inflammatory cells were primarily lymphocytes, accompanied by minimal polymorphonuclear leukocytes and macrophages, with scattered giant cells in some regions. In the T1 group, occasional regions showed aggregation of giant cells. At 18 to 24 months, no gel residue was observed in the T1 group, with cellular layer thicknesses ranging from 7 to 150 μm at 18 months and from 7 to 130 μm at 24 months. In the T2 group, the cellular layer thickness ranged from 6 to 100 μm at 18 months and from 5 to 80 μm at 24 months. Fibrous tissue ingrowth was pronounced, with microspheres encapsulated to form cavities. The inflammatory response was characterized predominantly by lymphocytic infiltration, accompanied by scattered macrophages and giant cells. At 30 months, the cellular layer thickness ranged from 5 to 120 μm in the T1 group and from 5 to 50 μm in the T2 group. Both groups exhibited fibrous tissue ingrowth and peripheral fibrous encapsulation, maintaining a round cavity structure. The inflammatory response persisted but tended toward stabilization, remaining predominantly lymphocytic, with scattered macrophages and giant cells. Hematoxylin and eosin (H&E) staining images.
According to the national standard of the People’s Republic of China GB/T 16886.6-2022, “Biological Evaluation of Medical Devices—Part 6: Tests for Local Effects after Implantation” (ISO 10993-6:2016),
21
as shown in Figure 5(a), the mean score of tissue response in T1 group was not higher than that in T2 group in each cycle, and the tissue response in the two groups was similar. In group T1, the mean tissue reaction score progressively increased from 1 month to 18 months, peaking at 18 months, and subsequently decreased from 18 months to 30 months. In group T2, the mean tissue reaction score exhibited an overall upward trend from 1 month to 24 months, with the peak observed at 24 months, followed by a decrease at 30 months. (a) Mean histological scores based on H&E staining; (b) Macrophage scores; (c) Lymphocyte scores; (d) Giant cell scores; (e) Quantification of microsphere numbers using ImageJ; (f) Statistical analysis of microsphere counts at each time point.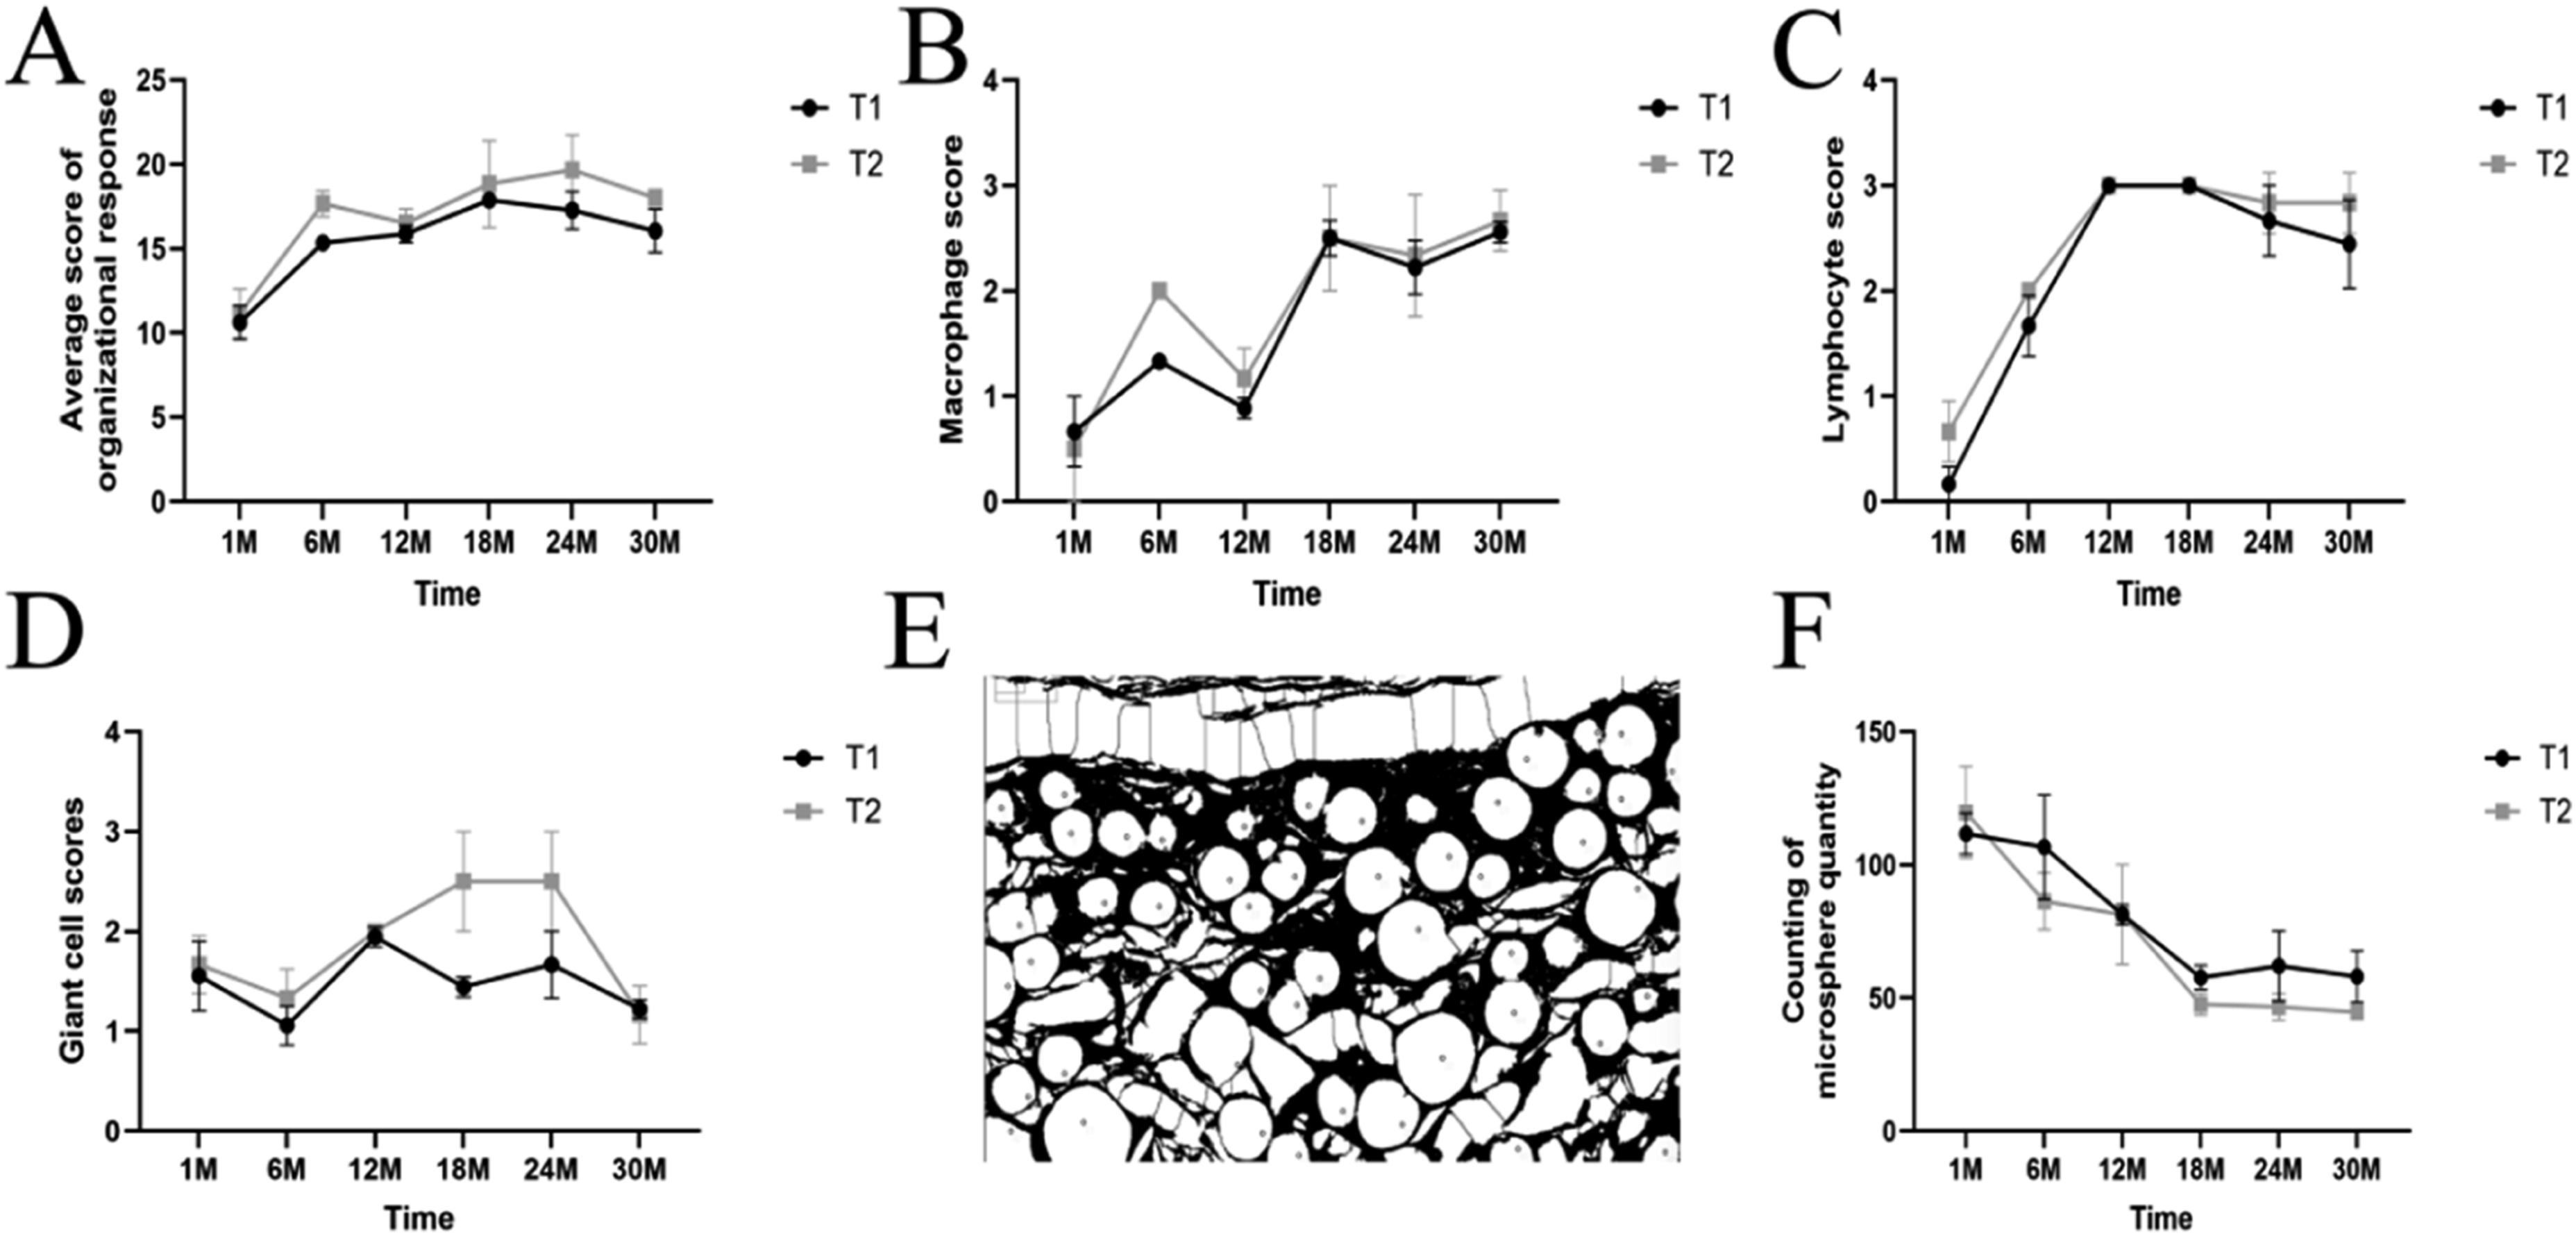
30M quantitative value description.
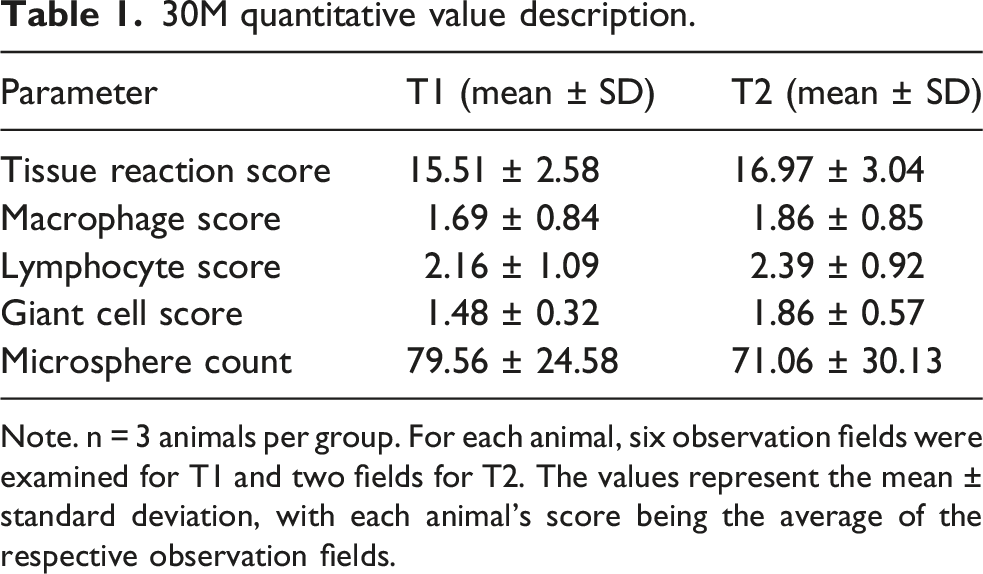
Note. n = 3 animals per group. For each animal, six observation fields were examined for T1 and two fields for T2. The values represent the mean ± standard deviation, with each animal’s score being the average of the respective observation fields.
In the temporal dynamic analysis of macrophage scores, as shown in Figure 5(b), both groups exhibited a gradual increase over the observation period. The scores were similar between the two groups at the early time points; however, from 6 months onward, the scores in group T2 were notably higher than those in group T1, and slightly higher than T1 group at 12 months and 18 months, and converging after 24 months. In the temporal dynamic analysis of lymphocyte scores, as shown in Figure 5(c), the overall trend indicated that scores in both groups gradually increased with prolonged observation time, although the increase was more pronounced in group T2, with scores generally higher than those in group T1 at each time point. Nevertheless, the scores in the two groups were comparable at 12 and 18 months. In the temporal dynamic analysis of giant cell scores, as shown in Figure 5(d), the scores in both groups were similar at the early and late time points. The overall score fluctuation in group T1 was relatively moderate, remaining between 1.0 and 2.0 without a significant upward or downward trend. In contrast, group T2 exhibited an initial fluctuation followed by an increase, with scores continuously rising from 12 to 24 months, reaching a peak of approximately 2.5, and subsequently decreasing to around 1.0 by 30 months. In the quantitative analysis of microspheres, as shown in Figure 5(e) and (f), both groups exhibited a gradual decrease in microsphere numbers over time, with similar trends. From 18 to 30 months, group T1 consistently showed slightly higher microsphere counts compared to group T2.
Changes in implantation site area
The degradation and dispersion of PCL were assessed by analyzing the implant area, as shown in Figure 6(b). Following implantation of T1 and T2, the implant area in the T1 group increased continuously from 1 month to 12 months, remained stable between 12 and 18 months, reached its peak at 24 months, and began to decrease at 30 months. Notably, the implant area in the T1 group was consistently smaller than that in the T2 group throughout the observation period. In the T2 group, the implant area exhibited a sustained increase from 1 month to 24 months, followed by a decrease at 30 months. (a) Masson staining showing collagen fiber growth trends; (b) Implantation site area; (c) Statistical analysis of collagen area.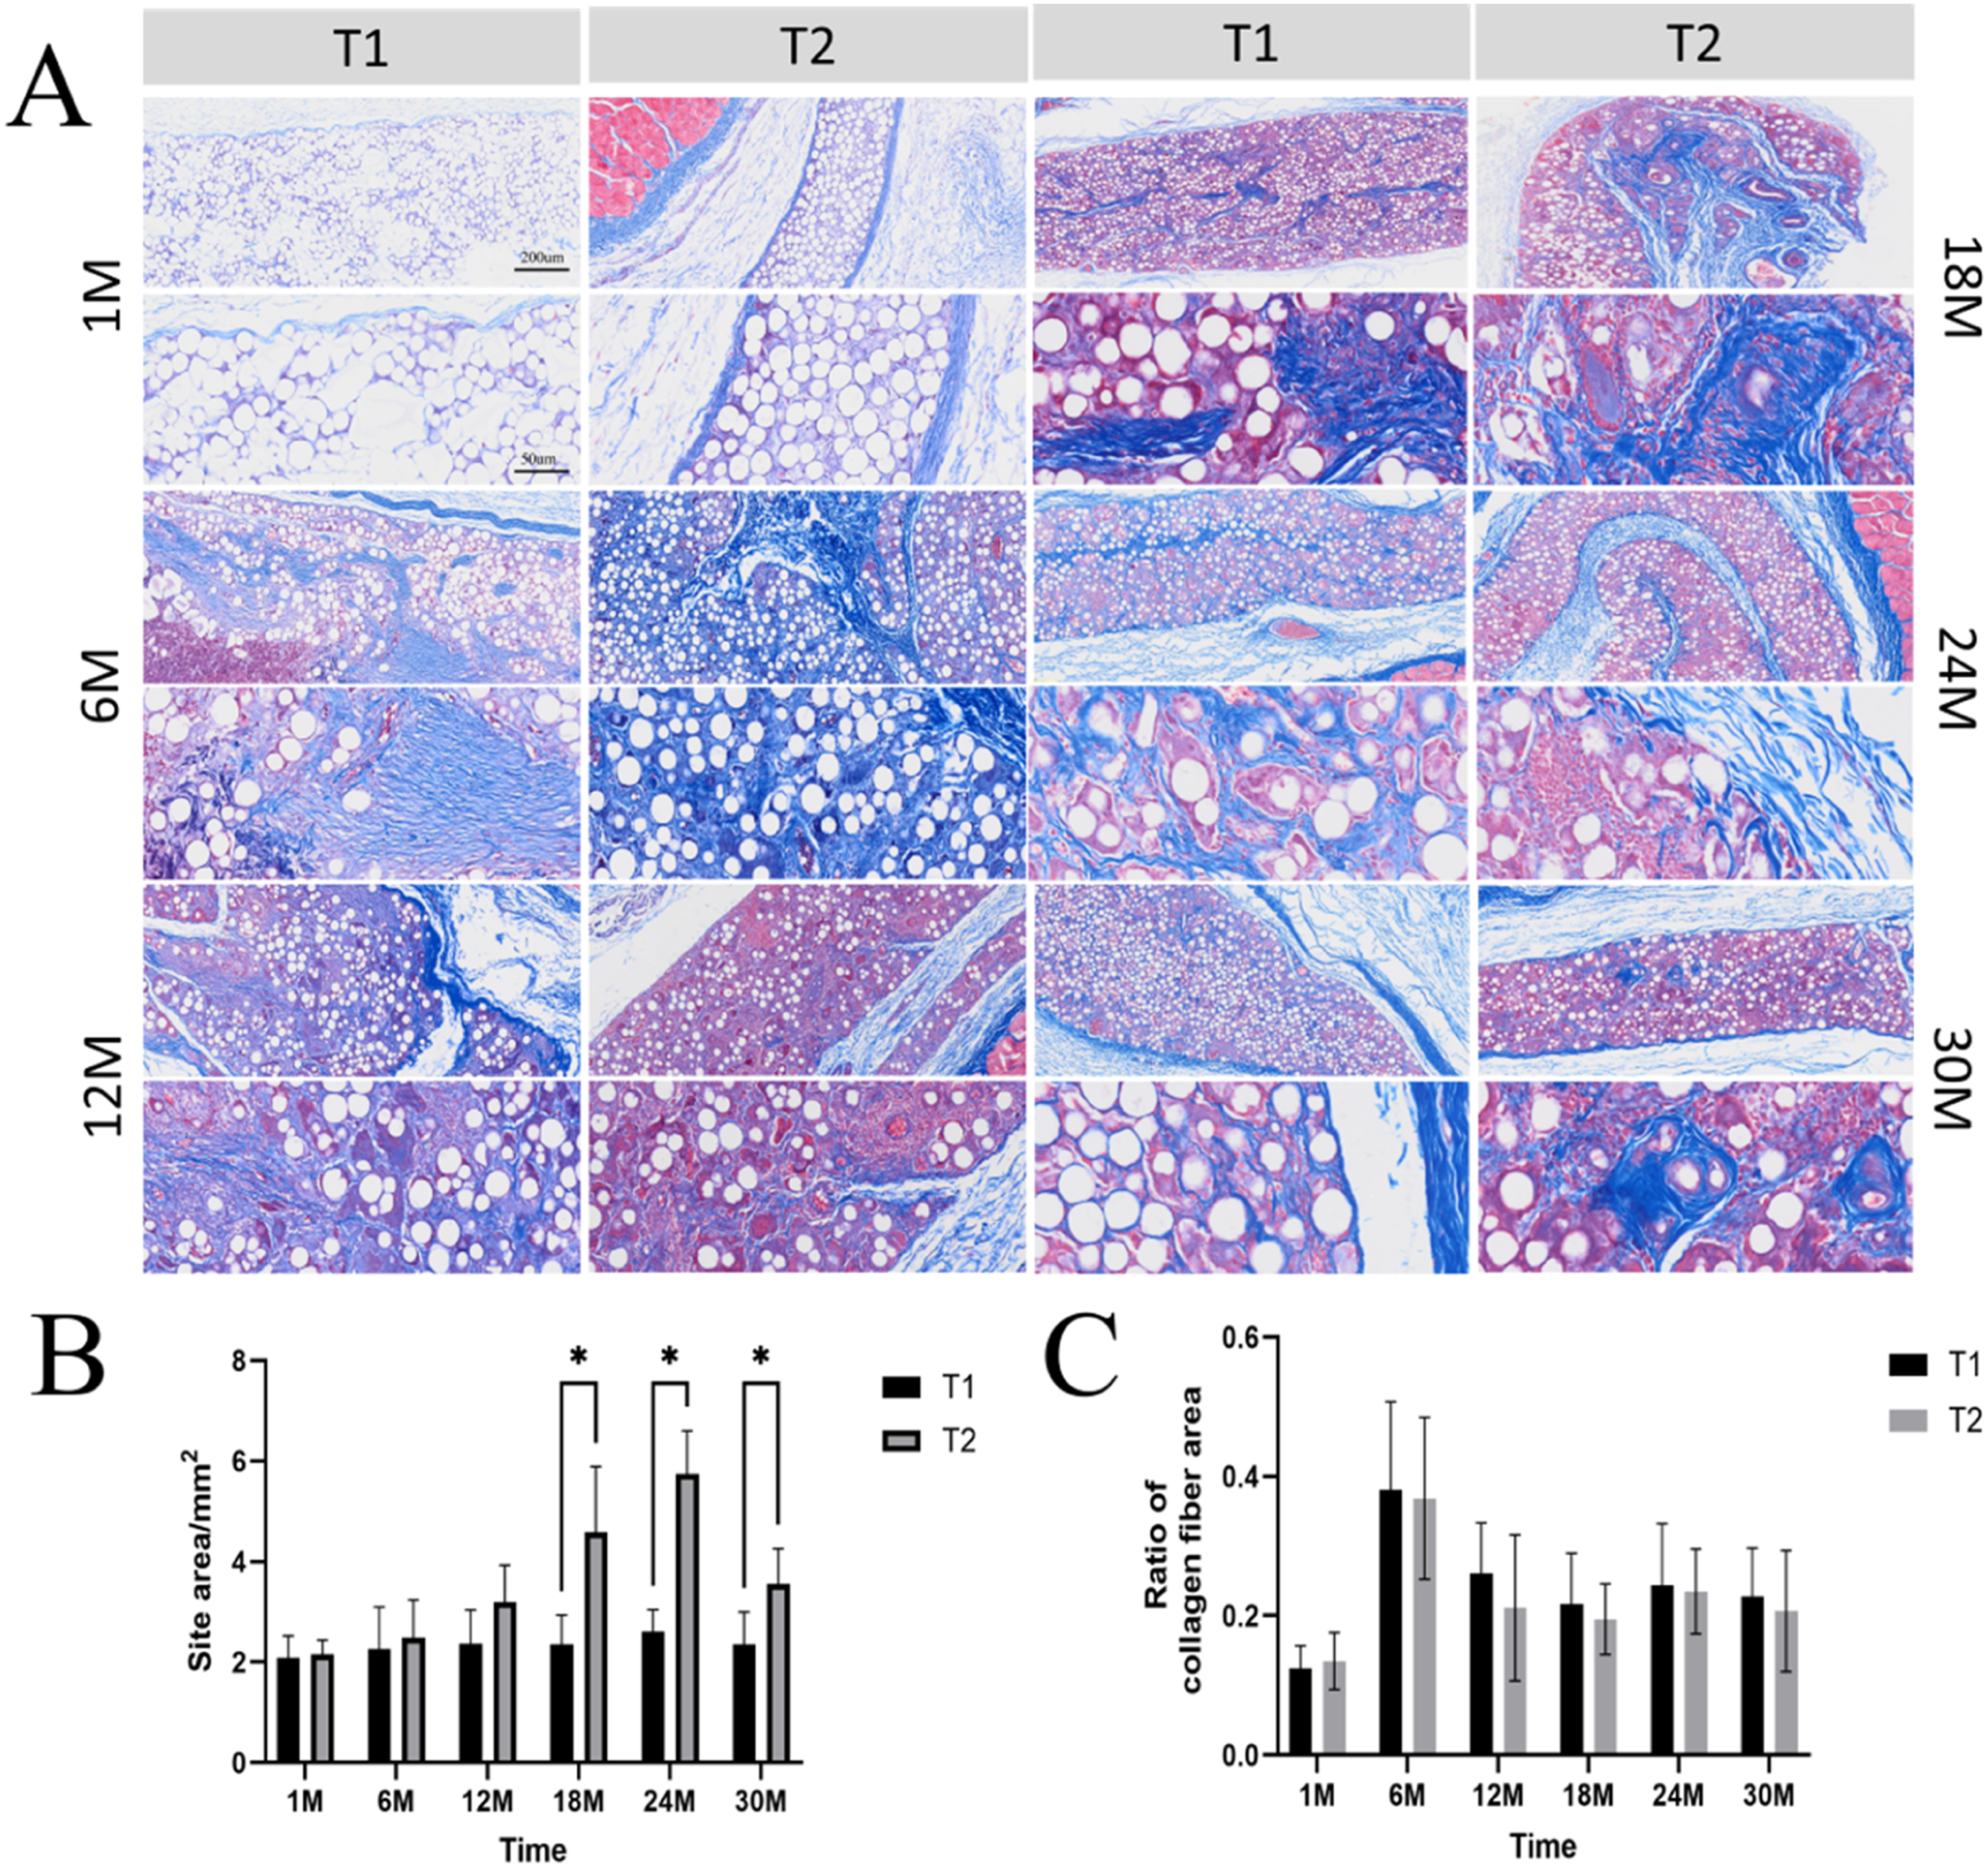
Masson staining – Observation of collagen arrangement
Masson staining was employed to evaluate the overall arrangement and growth of collagen fibers, as shown in Figure 6(a) and (c). At 1 month, proliferated collagen fibers in both groups were predominantly concentrated at the periphery of the material region, forming an encapsulating distribution. In the T1 group, a small amount of collagen fiber ingrowth was observed within the material region. In the T2 group, collagen fiber ingrowth was noted in some sample areas, with the degree of ingrowth slightly surpassing that of the T1 group. At 6 months, extensive collagen fiber ingrowth into the material region was observed in both groups, representing a marked increase compared to the 1-month time point. Collagen fiber encapsulation persisted at the periphery of the material region, and the total collagen fiber area reached its peak. At 12 months, collagen fiber ingrowth remained visible within the material region in both groups; however, the collagen fiber area was significantly reduced compared to that at 6 months. At 18 months, collagen fiber ingrowth was still observed within the implant region in both groups, with a proliferated collagen layer forming a complete encapsulating structure at the periphery, separating the implant region from the surrounding tissue. At 24 months, collagen fiber ingrowth within the implant region persisted, with no significant change in collagen fiber area compared to 18 months, and the peripheral encapsulating structure remained stable. At 30 months, collagen fibers within the implant region formed a reticular structure encapsulating the material, exhibiting a high density but a localized distribution. Peripheral proliferated collagen encapsulation remained visible in some areas. The overall structure tended toward stabilization and maturation, with no significant change in collagen fiber area compared to 24 months.
Sirius Red staining – Observation of collagen type distribution
Quantitative analysis of collagen content was performed using Sirius Red staining, as shown in Figure 7(a). At 1 month, proliferating collagen fibers in both groups were predominantly concentrated at the periphery of the material region. In group T1, a small amount of collagen fiber ingrowth was observed within the material region at some implantation sites, and similar ingrowth was observed in certain areas of group T2. In both groups, type I collagen was the predominant collagen type, accompanied by a small amount of type III collagen. At 6 months, both groups exhibited extensive collagen fiber ingrowth into the material region, representing a marked increase compared to 1 month. Collagen fiber encapsulation remained visible at the periphery of the material region, with type I collagen remaining the predominant type and type III collagen present in smaller amounts. At 12 months, collagen fiber ingrowth remained visible within the material region in both groups; however, the collagen fiber area was notably reduced compared to that at 6 months, with the collagen composition maintained as predominantly type I collagen, supplemented by type III collagen. At 18 months, both groups exhibited a high-density proliferating collagen fiber layer encapsulating the periphery of the implantation region, though the distribution was relatively localized, with type I collagen predominating. Within the material region, collagen fibers formed a reticular structure, representing a compositional shift compared to earlier time points, characterized by a marked increase in type III collagen, which became the predominant component, and a notable decrease in type I collagen. At 24 months, the peripheral encapsulating layer remained stable in both groups, still predominantly composed of type I collagen. The reticular structure within the material region persisted, with a collagen composition similar to that at 18 months, still dominated by type III collagen accompanied by a small amount of type I collagen. At 30 months, the peripheral encapsulating layer in both groups remained predominantly type I collagen. Within the reticular structure of the material region, the content of type I collagen increased significantly compared to that at 24 months, exhibiting an interwoven distribution with type III collagen, and the ratio of collagen types tended toward equilibrium, indicating progression into the maturation phase of tissue repair. (a) Growth trends of type I and type III collagen fibers; (b) Statistical analysis of type I collagen area; (c) Statistical analysis of type III collagen area.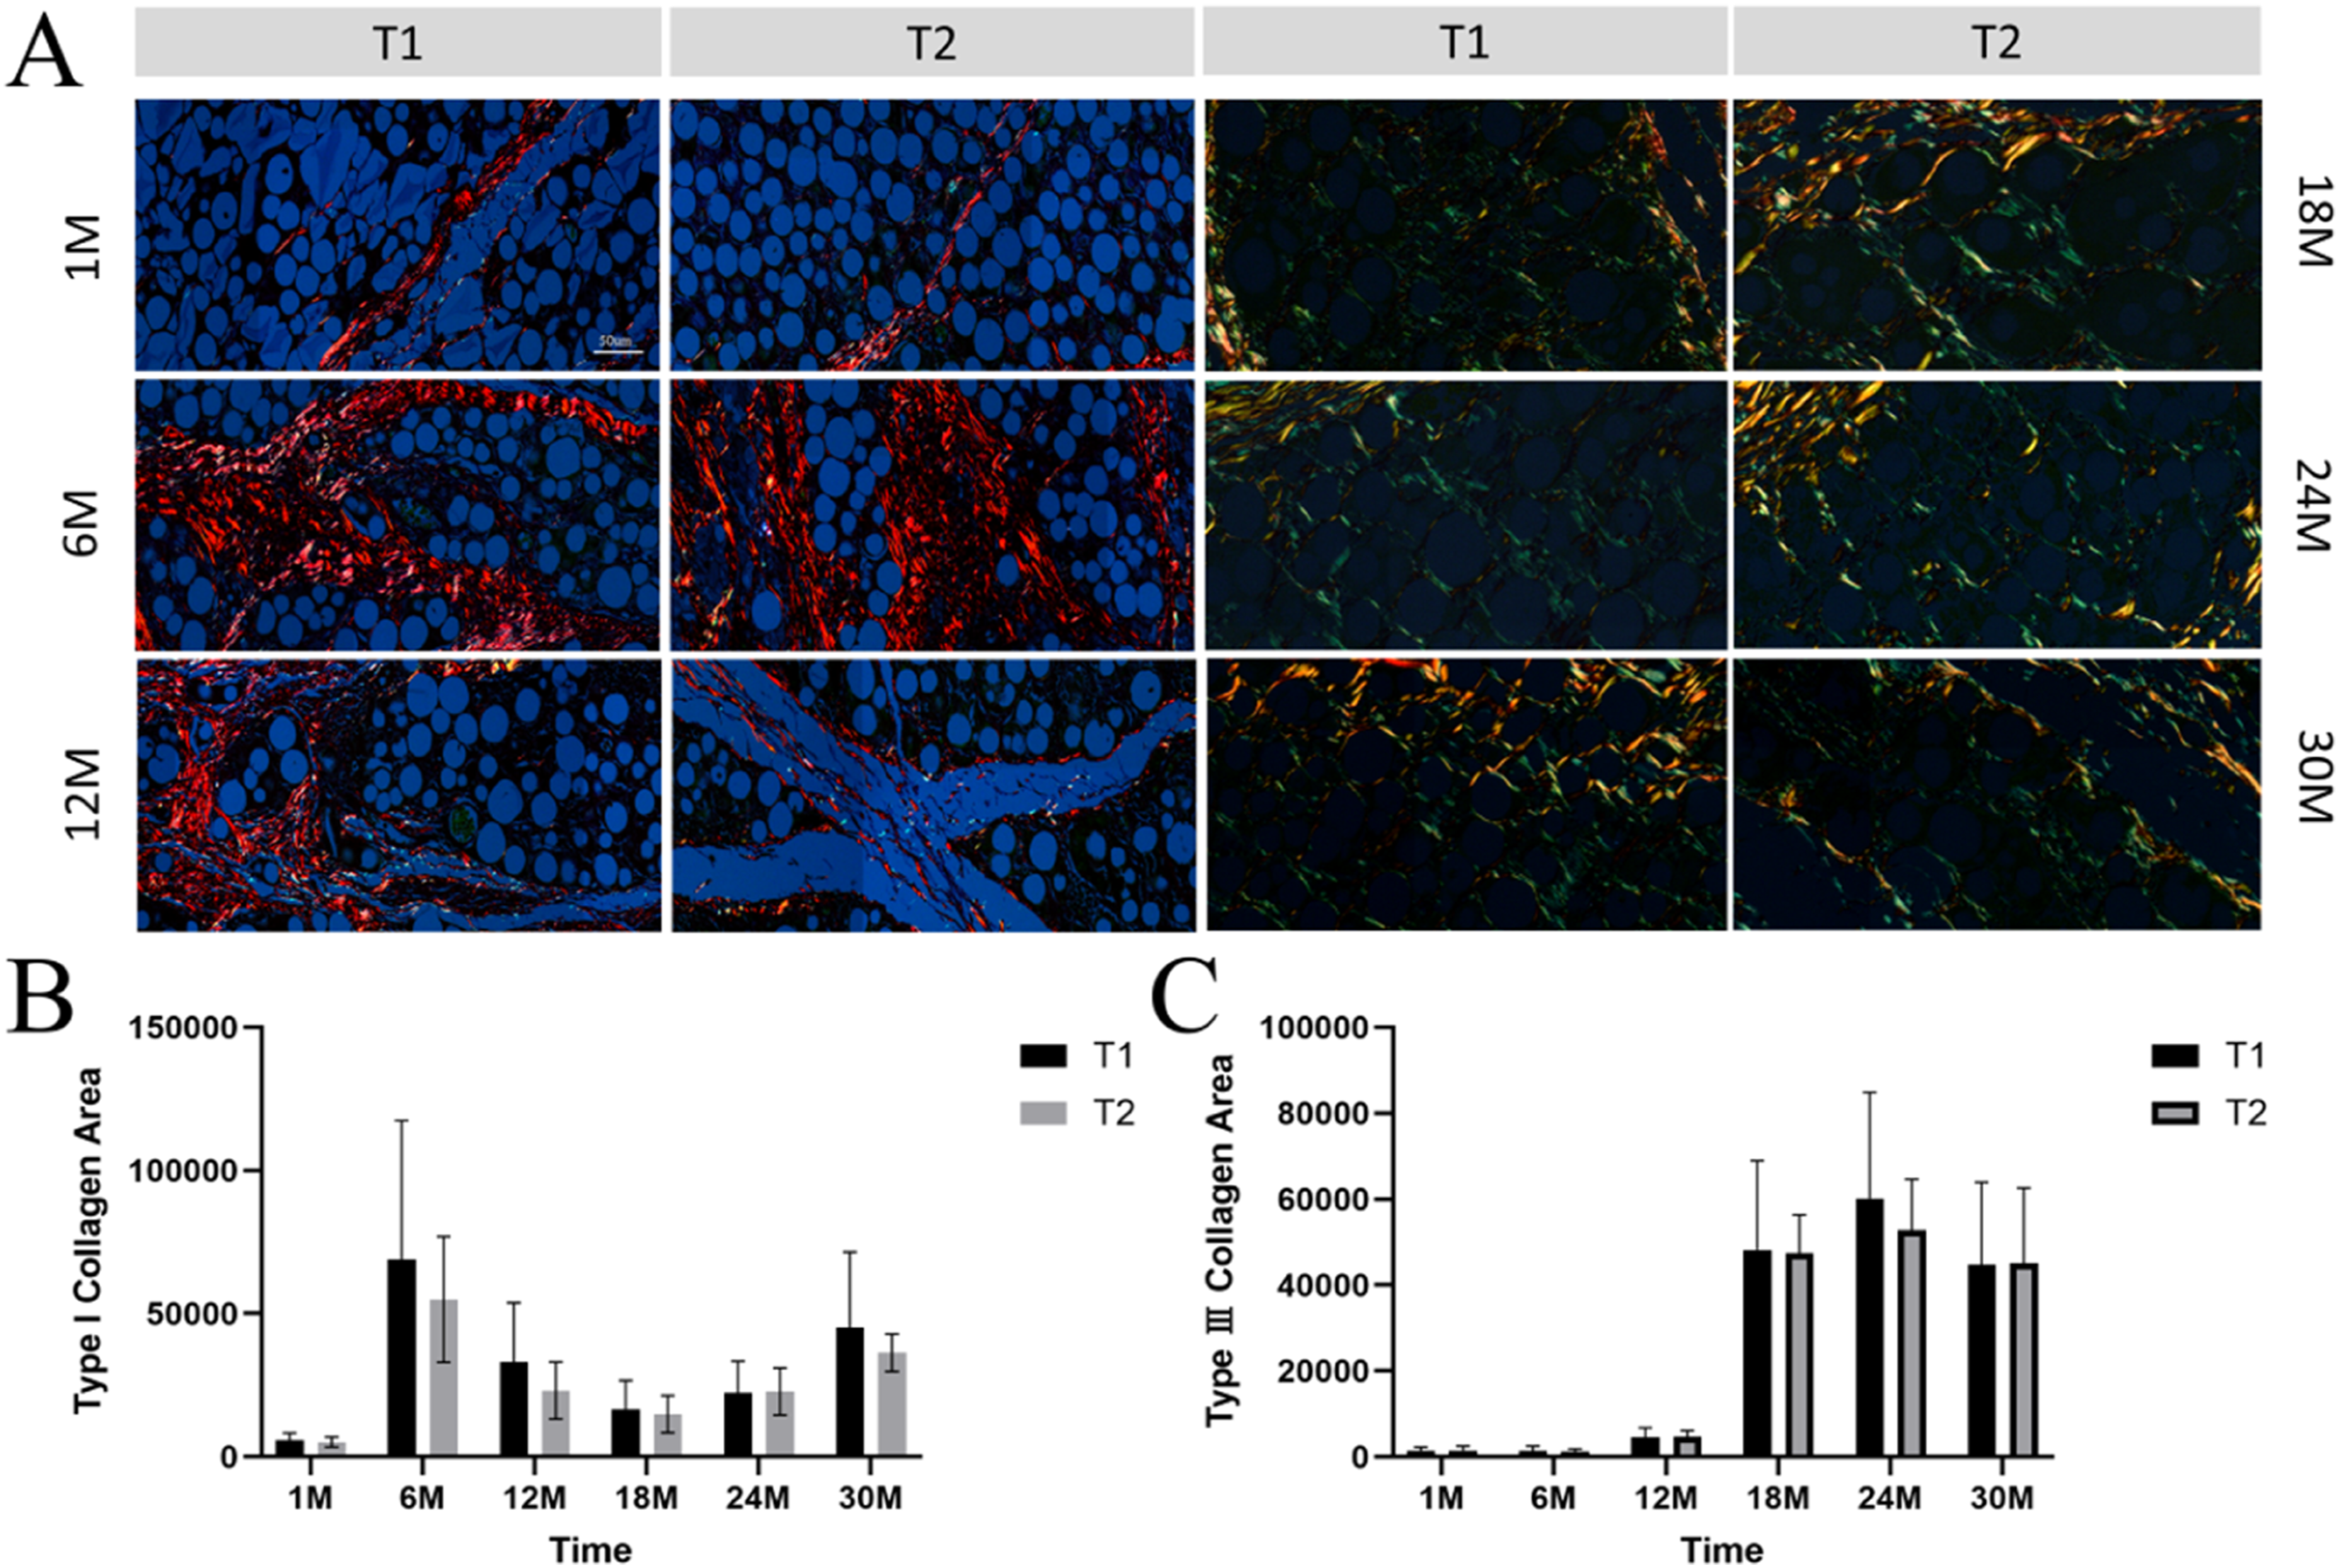
As shown in Figure 7(b) for type I collagen area, the values in group T1 were consistently higher than those in group T2 throughout the degradation period. The maximum type I collagen proliferation in both groups occurred at 6 months, followed by a decrease at 12 months, although the values remained higher than those at 1 month. A secondary increase was observed at 24 months. As shown in Figure 7(c) for type III collagen area, group T1 and group T2 exhibited similar trends. Both groups maintained relatively low type III collagen areas from 1 to 12 months, followed by a substantial increase starting at 18 months. Throughout the degradation period, the maximum type III collagen proliferation in both groups occurred at 18 months, with group T1 showing slightly higher values than group T2, and the values in both groups converged by 30 months.
Discussion
Polycaprolactone (PCL), as a semicrystalline linear aliphatic polyester, undergoes in vivo degradation through a complex biological process dominated by hydrolytic reactions and synergistically regulated by local enzymatic metabolism and immune cell activity.22,23 The clinical value of PCL microsphere fillers depends on their ability to establish and maintain a dynamic equilibrium during degradation—namely, homeostasis between material loss and tissue regeneration. Through 30 months of in vivo longitudinal tracking, the present study elucidates a dual-dimensional framework of this homeostasis: safety homeostasis, reflected in the controllability of the inflammatory response at the material–tissue interface, and efficacy homeostasis, reflected in the sustainability of the filler construct’s structure and function. These two dimensions are synergistically established in accordance with a temporal sequence, collectively constituting the mechanistic basis for the long-term safety and efficacy of PCL-based fillers.
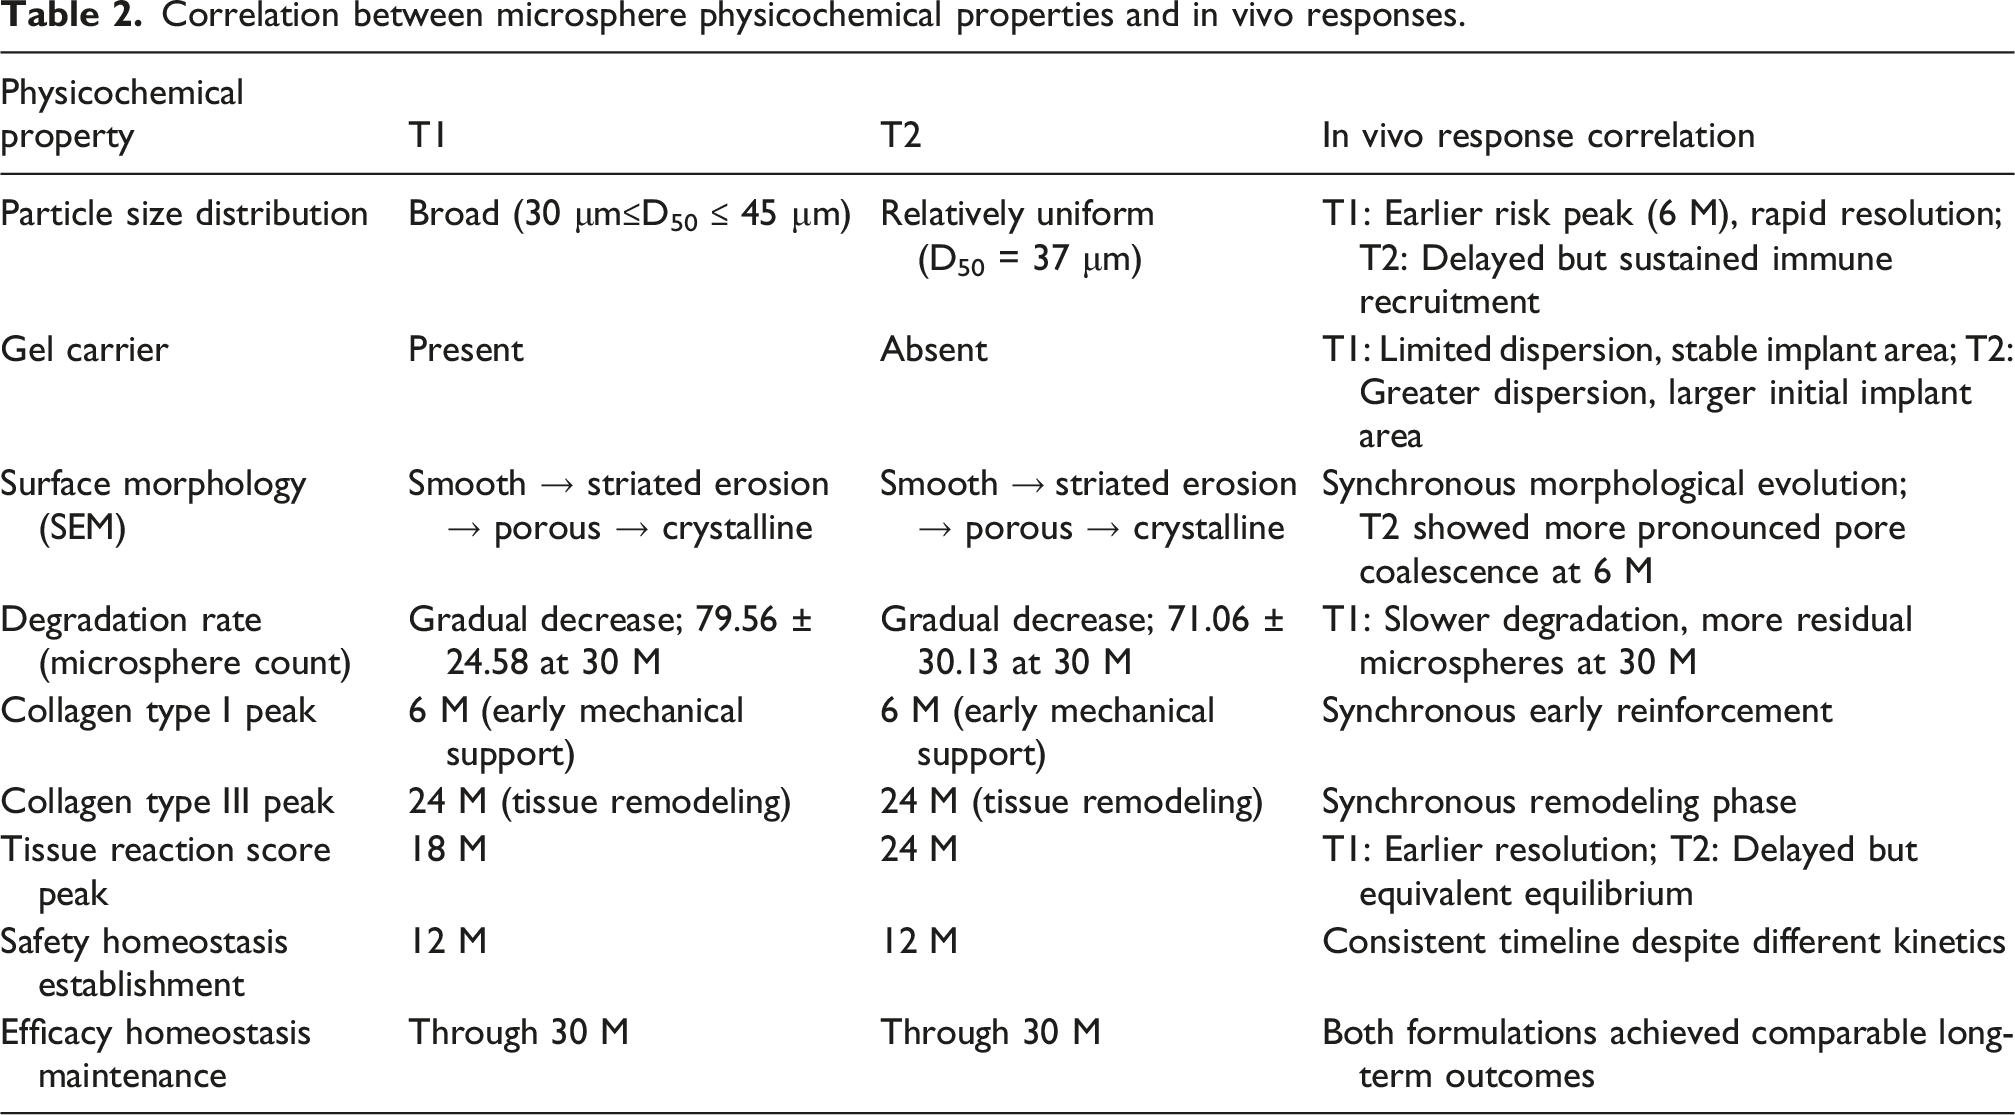
The establishment of a secure homeostasis is centered around the risk peak as the core node. In the early post-implantation period, water molecules preferentially penetrate the amorphous regions of the microspheres, triggering ester bond hydrolysis and resulting in a time-dependent decrease in molecular weight, with the generation of intermediate products such as oligomers and monomers.24,25 Within the first month post-implantation, microspheres in both groups maintained a relatively intact spherical morphology, with only slight surface depressions observed. The tissue response was characterized by acute inflammation but remained localized. According to the GB/T 16886.6-2022 standard, 21 tissue reaction scores in both groups remained at low levels, and no significant differences were observed in the scores of various immune cell types, indicating that the early material–tissue interface was in a similar state of initial recognition. The degradation process of PCL is subject to spatiotemporal regulation by the immune microenvironment at the implantation site.26,27 In the early stage, M1 macrophages predominate and secrete hydrolytic enzymes that accelerate degradation; as inflammation subsides, M2 macrophages polarize to promote tissue repair, forming a fibrous capsule that restricts water and enzyme penetration, thereby exerting negative feedback regulation on later-stage degradation.28,29 Entering the interactive phase at 6 months, degradation accelerated, and the risk peak formally emerged. Scanning electron microscopy revealed pronounced striated erosion on the microsphere surface, along with pore enlargement and coalescence. Differences in physicochemical properties were reflected in distinct tissue reaction kinetics: group T1 (broad particle size distribution, containing gel) exhibited lower tissue reaction scores than group T2 (relatively uniform particle size) at 6 months, while group T2 showed persistently higher macrophage scores from 6 months onward, indicating that microspheres with uniform particle size elicited a more sustained immune cell recruitment. The core mechanism underlying the risk peak lies in the regulation of local degradation product concentration and release kinetics by the surface erosion rate of the microspheres, which in turn determines the intensity and duration of the inflammatory response. The initial risk peak occurred around 6 months in both groups, followed by a resolution phase. At 12 months, the thickness of the cellular layer decreased compared to that at 6 months and tended to stabilize. From 18 to 30 months, a low level of inflammation was maintained, with no persistent aggregation of foreign body giant cells or granuloma formation, indicating that the body had established long-term immune tolerance to PCL degradation products. The fibrous capsule, which initially formed at 1 month, thickened by 6 months, and subsequently stabilized and thinned after 12 months, exhibited a three-stage dynamic adjustment comprising formation, optimization, and maturation, providing structural evidence for safety homeostasis. This pattern of homeostasis restoration following risk peak passage demonstrates the favorable biocompatibility of PCL materials and identifies two critical monitoring time points—6 months and 12 months—for long-term clinical safety assessment.
The in vivo findings of this study are consistent with computational models of PCL degradation kinetics reported in the literature. For instance, Kassab 30 developed a model predicting that PCL microspheres with uniform particle size distribution exhibit slower initial degradation rates but prolonged immune cell recruitment due to more consistent surface-area-to-volume ratios, which aligns with our observation that the T2 group (relatively uniform particle size) showed persistently higher macrophage scores from 6 months onward. Conversely, Miguel 31 simulated the degradation of polydisperse PCL, predicting accelerated early-stage hydrolysis in smaller particles, consistent with our finding that the T1 group (broad particle size distribution with gel) exhibited an earlier risk peak and more rapid inflammatory resolution. Caihong 32 demonstrated through hydrolysis experiments with catalyst-regulated PCL molecular weights that PCL molecular weight reduction follows a nonlinear profile, with rapid initial decline followed by plateauing—a pattern corroborated by our SEM observations of surface erosion progression.
Correlation between microsphere physicochemical properties and in vivo responses.
The temporal establishment and maintenance mechanisms of safety homeostasis and efficacy homeostasis are distinct yet mutually supportive, collectively constituting a comprehensive framework for the long-term safety and efficacy of PCL-based fillers.35–37 Safety homeostasis is predicated on the passage of the risk peak, becoming established at 12 months and persisting through 30 months, thereby providing the immunological microenvironmental foundation for efficacy homeostasis. Efficacy homeostasis centers on the coupling of degradation and regeneration, initiating structural remodeling at 6 months, completing type transition at 18 months, and achieving functional equilibrium at 30 months. The synergy between these two dimensions depends on the controllability of material–tissue interactions, which ultimately manifests as predictability of product quality. Comparison between the T1 and T2 groups revealed that, despite differences in formulation, each group exhibited favorable intra-batch consistency—the timing of risk peak passage was relatively concentrated, the patterns of collagen evolution were synchronous, and the establishment of homeostasis was reproducible. The morphological evolution of microspheres observed by scanning electron microscopy, the temporal dynamics of tissue reaction scores, the differentiation and convergence patterns of immune cell scores, and the differences in degradation rates revealed by microsphere count statistics collectively constitute a core parameter system for evaluating the timing of safety homeostasis establishment and the capacity for efficacy homeostasis maintenance.
In summary, this 30-months longitudinal study elucidates the homeostatic mechanisms of PCL microsphere fillers: safety homeostasis is established at 12 months, while efficacy homeostasis is maintained through 30 months. The filler construct undergoes an evolutionary trajectory characterized by material dominance, composite support, structural remodeling, and functional equilibrium. Group T1 (broad particle size distribution, containing gel) exhibited an inflammatory profile of “early peak and rapid resolution,” with efficacy homeostasis achieved through early, robust inflammation–remodeling coupling. Group T2 (relatively uniform particle size) exhibited a pattern of “gradual rise and delayed peak,” ultimately attaining equivalent functional equilibrium through sustained immune activity. Both formulations, despite their distinct physicochemical properties, achieved at least 30 months of safety and efficacy homeostasis.
Conclusion
This 30-months in vivo longitudinal study elucidates the establishment of homeostasis in PCL microsphere fillers. Safety homeostasis is characterized by the passage of the risk peak at 6 months as a critical node, wherein accelerated surface erosion of the microspheres triggers a controllable peak in inflammation, followed by immune cell phenotype switching and dynamic optimization of the fibrous capsule, leading to the establishment of long-term immune tolerance by 12 months. Efficacy homeostasis relies on the coupled matching of degradation and regeneration, with the filler construct undergoing a three-stage evolution consisting of “early type I collagen reinforcement—mid-term type III collagen remodeling—interwoven type I/type III collagen equilibration,” achieving seamless replacement of the functional scaffold from exogenous material to endogenous tissue, with homeostasis maintained for at least 30 months. The gel-containing group (broad particle size distribution) exhibited higher degradation synchrony and greater total collagen deposition, whereas the microsphere-only group (relatively uniform particle size) demonstrated earlier initiation of remodeling with a more dispersed progression pattern, providing a basis for individualized clinical selection. The analytical framework of “interaction–risk peak passage–dual-dimensional homeostasis” established in this study offers a methodological foundation for the rational design, quality evaluation, and long-term safety assessment of biodegradable fillers.
Footnotes

Ethical considerations
This study was approved by the Institutional Animal Care and Use Committee (IACUC) of Sichuan Medical Device Biological Materials and Products Inspection Center Co., Ltd (Approval No: YX2023-050002). The experimental procedures were conducted in accordance with the GB/T 16886.2-2011 “Biological Evaluation of Medical Devices - Part 2: Animal Welfare Requirements”. A total of 24 healthy Japanese White rabbits (initially adult, nulliparous and non-pregnant, not previously used in experiments), weighing 2.5–3.0 kg, were comed from Pizhou Dongfang Breeding Co., Ltd (License No: SCXK (Su) 2022-0004, Certificate Nos: 202343308 and 202368764). The animals were acclimatized for at least 7 days before the experiment. Rabbits were housed individually in stainless steel cages at the Laboratory Animal Center of Sichuan University under conventional conditions (temperature: 16–26°C, relative humidity: 30–70%, ventilation frequency: ≥8 times/h, 12-h light/dark cycle). Animals had free access to rabbit maintenance feed (produced by Keao Xieli (Tianjin) Feed Co., Ltd, License No: Jin Feed Certificate (2020) 01005) and municipal tap water ad libitum. All personnel involved in this study were properly trained and qualified. Animal facility management complied with national standards (CMA 240015142491, CNAS L3940, SYXK (Chuan) 2023-0017).
Consent to participate
Not applicable (this study did not involve human participants).
Funding
The authors disclosed receipt of the following financial support for the research, authorship, and/or publication of this article: This work was funded by the National key research and development programs of China: 2022YFC2405800, Beijing Natural Science Foundation: L234022 and L244001, China NMPA Research on performance and safety evaluation of innovative biomaterial medical devices: RS2024X004.
Declaration of conflicting interests
The authors declared no potential conflicts of interest with respect to the research, authorship, and/or publication of this article.