
Abstract
Many college women believe that their chances of experiencing a sexual assault are less than their peers. This phenomenon, called optimistic bias, has been hypothesized to be one important element to address in sexual assault risk reduction and awareness programs aimed at reducing women’s chances of experiencing a sexual assault. The present study examined the role that participants’ (N = 89) perceived similarity to a narrator (portraying a sexual assault survivor) describing an assault plays in reducing this bias. The age of the narrator was manipulated (similar or dissimilar to age of participants) with the aim of assessing whether the program could produce reductions in optimistic bias for those participants who watched a video of someone similar to them in age. A significant interaction between pre- and post-program and age similarity indicated a significant decrease in optimistic bias from pre- to posttest for the similar group. Furthermore, an exploratory analysis indicated optimistic bias for White participants decreased from pre- to posttest, whereas optimistic bias for the Black participants increased. These results suggest that some factors such as age similarity may reduce optimistic bias in sexual assault risk reduction and awareness programs. However, a race dissimilarity may increase optimistic bias. Thus, more research is needed to understand the factors that affect optimistic bias with regard to sexual assault awareness.
Many college women believe that their chances of experiencing a sexual assault are less than their peers. This phenomenon, called optimistic bias, has been hypothesized to be one important element to address in sexual assault risk reduction and awareness programs aimed at reducing women’s chances of experiencing a sexual assault. Further exploration of this bias is particularly important as women in college are at greater risk of experiencing a sexual assault than women of the same age who are not in college (Corbin, Bernat, Calhoun, McNair, & Seals, 2001). Between 3% and 10% of women experience rape during one academic year (Daigle, Fisher, & Stewart, 2009), and up to 55% of college women report experiencing some form of sexual victimization during their college career (Harrington & Leitenberg, 1994). The present study was designed to further explore the role of optimistic bias as it relates to risk reduction and awareness programming.
Due to the high prevalence of sexual assault experiences on college campuses and U.S. Federal Law, which mandates violence prevention programs on federally funded universities, there is a continued need for program development, implementation, and evaluation (Daigle et al., 2009; Orchowski, Gidycz, & Raffle, 2008). The most common sexual assault programs for college women consist of awareness interventions (such as presentations from assault survivors or discussions of assault prevalence), self-defense training (participants learn ways to resist an assault), bystander interventions (participants are challenged to intervene when witnessing threatening situations), and skills-based training (participants learn skills to identify risk, respond effectively, etc.). See Daigle et al. (2009) for a review of programs.
Evaluation of Sexual Assault Risk Reduction Programming
Several researchers have examined the effectiveness of sexual assault risk reduction programming specifically within the college population (Breitenbecher & Gidycz, 1998; Gidycz, Rich, & Marioni, 2002; Hanson & Gidycz, 1993; Marioni, 2002; Marx, Calhoun, Wilson, & Meyerson, 2001; Orchowski et al., 2008; Rothman & Silverman, 2007). Some programs have been shown to be ineffective in reducing rates of sexual victimization (Breitenbecher & Gidycz, 1998), whereas others have been successful (e.g., Marioni, 2002). Similarly, some programs have been shown to be effective in reducing some of the after effects of sexual assault such as posttraumatic stress disorder (PTSD) symptoms, depression, and self-blame (Marioni, 2002; Mouilso, Calhoun, & Gidycz, 2011). Overall, there is a continued need for additional development and evaluation of risk awareness and reduction programming, and it is important to explore and evaluate specific components and factors that affect the efficacy of programs.
Optimistic Bias and Risk Perception
Despite campus requirements and the effectiveness of many program components, researchers and program creators are consistently faced with the challenge of reducing or eliminating preexisting optimistic bias (defined as the belief that one is less likely than his or her peers to experience a negative event) among participants. Over the past several decades, researchers have begun to explore how this bias relates to one’s perceived risk to experience a variety of negative concerns. Within the domain of sexual trauma research, existing studies have fairly consistently demonstrated that women tend to report that their chances of experiencing an assault are less than other women (Cue, George, & Norris, 1996; Hickman & Muehlenhard, 1997; Norris, Nurius, & Graham, 1999), and they tend to believe they are better able than others to effectively manage potentially dangerous situations (Parks, Miller, Collins, & Zetes-Zanatta, 1998). For example, Yeater, Viken, Hoyt, and Dolan (2009) utilized sexual assault vignettes and assigned college women to either “imagine yourself in that situation” or “imagine an anonymous woman in the situation.” Respondents reported higher risk for the anonymous woman than for themselves in that situation. Thus, optimistic bias can leave women more vulnerable to assaultive experiences as they may ignore risk cues that are indicative of danger (Cue et al., 1996).
Reducing Optimistic Bias and the Elaboration Likelihood Model of Persuasion (ELM)
Certain factors have been shown to successfully lessen one’s optimistic bias. Specifically, individuals tend to show a reduction in optimistic bias when they compare themselves with someone who is similar and closer to themselves in physical appearance and when they are presented in greater detail (Helweg-Larsen & Shepperd, 2001). As such, sexual assault risk reduction programs may increase their effectiveness if interventions include a depiction of a sexual assault survivor who is similar to program participants in a variety of ways (Gidycz, McNamara, & Edwards, 2006). Moreover, Gidycz et al. suggested that women tend to distance and separate themselves from “the typical sexual assault victim”; thus, programming could aim to show women that they are similar in several ways (such as in race, sexual orientation, socioeconomic status [SES], education level, age) to women who are sexually victimized. This portrayal may help dispel the myth, “It couldn’t happen to me.” Ideally, programs would be designed so that participants evidence a reduction in optimistic bias during and after program completion. In theory, this reduction in optimistic bias would then result in an immediate as well as lasting increase in self-protective behaviors and a reduction in risky behaviors. As a result of behavioral changes, a subsequent decline in rates of sexual victimization would ideally result. Given these aims, the elaboration likelihood model (ELM) of persuasion is one theory that has been used to account for differences in sexual assault risk reduction program outcomes (Heppner, Good, et al., 1995).
The ELM suggests that attitudes change via two routes on a continuum: the peripheral and central routes. In the peripheral route, a mental shortcut occurs in that the characteristics of the person presenting persuasive information are attended to more than the message as the listener does not find the message to be personally relevant or the argument is thought to be weak or too complex. Instead of thinking about the topic and content, the listener focuses on other cues such as the perceived degree of expert knowledge or trustworthiness of the presenter. This route of processing information is problematic because the message will likely be accepted or rejected based on external cues rather than issue-related evaluation and thought. Therefore, attitude change is considered transitory and unlikely to result in a lasting change when processed peripherally. In contrast, the central route involves a more lasting and stable attitude change as the listener considers the validity, construction, or utility of the message instead of attending to non-message related cues such as attractiveness of the speaker. Information is processed centrally when the listener has a high level of personal involvement and is motivated to listen to what is presented (Heppner, Good, et al., 1995; Petty & Cacioppo, 1981; see Petty and Wegener, 1999, for an extensive overview of the ELM).
According to this theory, programs would benefit from increasing the likelihood of central route processing by enhancing the personal relevance of the message (or, as relevant to the present study, providing information that the listener has an equal chance as her peers to experience a hazard). This model has been applied in several different health-related domains including involvement in an automobile accident (Levi, 2009), risk of developing breast cancer (Park et al., 2009), and chance of experiencing a sexual assault (Heppner, Good, et al., 1995; Heppner, Humphrey et al., 1995). In sum, the ELM of persuasion highlights the significance of message delivery, the perceived relevance of the message, and the importance of ensuring that participants find the message to be personally relevant (Heppner, Good, et al., 1995; Heppner, Humphrey et al., 1995; Petty & Cacioppo, 1981).
The Current Study and Hypotheses
The ELM of persuasion underscores the importance of ensuring participants believe that the program message is relevant to their lives (Heppner, Good, et al., 1995; Petty & Cacioppo, 1981). Messages about the prevention of sexual assault are important as sexual assault experiences can be traumatic and result in lasting effects (Frazier et al., 2009). Programming aimed at informing participants of their risk of experiencing an assault could serve to reduce an individual’s risky behavior while also increasing protective behaviors. The present study examined the role of optimistic bias in relation to college students’ awareness of the risk of sexual victimization.
First, it was proposed that the two groups (similar and dissimilar groups) would not differ in pretest optimistic bias scores. Second, it was hypothesized that participants in the similar condition would evidence a greater reduction in their optimistic bias scores from pretest to posttest than participants in the dissimilar condition. Last, studies have yet to examine how participants’ and narrators’ race affects optimistic bias scores in sexual assault risk reduction and awareness programs. As such, we explored whether optimistic bias scores among the two groups would differ based on participants’ self-identified race.
Method
Participants
Data were collected from 164 undergraduate female students enrolled at a college in the Midwest and recruited through a psychology department participant pool. Participants with a history of attempted or completed sexual victimization (n = 75) and participants with missing or incomplete responses (n = 3) were excluded from analyses. As such, the final sample was composed of 86 undergraduate female students. The age of these participants ranged from 18 to 22. Students were fairly equally represented across the 4 years in college: 24% freshman, 22% sophomores, 25% juniors, 14% seniors, and one student identified as “Other.”
The vast majority of participants selected non-Hispanic or Latino (n = 82, 95.3%) to describe their ethnicity; 4 participants identified as Hispanic or Latino (4.7%). Participants were then instructed to check all races that apply to them from a provided list. A majority of participants indicated one race (n = 84, 97.7 %). The race percentages reported next were calculated based on 88 responses to the race question rather than the sample size of 86 as 2 participants indicated more than one race. The majority of students identified as White (n = 74, 86.0 %), and 9.3% of students identified as Black (n = 8). One student identified as Asian (1.2 %), and one student identified as Pacific Islander (1.2%); two students selected “Other” (2.3%).
Materials
Educational video
Two versions of a 4-min video were utilized. Participants were randomly assigned to view one of the two videos; one narrator was 45 years old (dissimilar group), and the other narrator was 21 years old (similar group). The actors did not directly state their ages during the video. Identical scripts and filming environments were used for the two videos. The narrators were Caucasian, and they were similar in dress, height, and attractiveness. The video began with the narrator describing a recent social event where she went to dinner with several of her male friends. She then spoke about how she went back to her friend’s house later in the night and was subsequently sexually assaulted by this friend. At the end of the video, the narrator says, “I was raped.” The video ends after her story. The narrators were not themselves survivors of a sexual assault, but they played the role of a survivor for this video, and participants were only exposed to information that the woman in the video was a survivor.
Global Perception of Risk
This measure (Koss & Oros, 1982; Norris et al., 1999) is based on global perceptions of victimization and was used to attain respondents’ optimistic biases regarding their personal risk of sexual victimization compared with their peers. Participants were asked to determine whether their level of risk for eight unwanted sexual behaviors is (a) same as their friends’ risk (coded 0), (b) less than their friends’ risk (coded +1), or (c) greater than their friends’ risk (coded −1). Each item was individually coded, and then items were summed to generate a score ranging from −8 to +8. A score of 0 indicated that the participant rated her risk to be the same as her friends’ risk on all eight items. A negative score indicated that she rated her risk as greater than her friends’ risk, and a positive score indicated that she rated her risk as less than her friends’ risk. Thus, a positive score indicated that the participant displayed optimistic bias because she believed her friends were more likely than her to be sexually assaulted.
This measure was administered before watching the video and again after watching the video. The instructions were modified slightly on the posttest in an attempt to reinforce the similarity between the participant and assault survivor. Specifically, the participants were reminded that they “just watched a video in which someone similar to you (or a former college student for the dissimilar group) discussed her experience being sexually assaulted.”
Similarity Questionnaire
Participants were instructed to rate how similar they perceived themselves to be to the woman presented in the video. This manipulation check was used to ensure that participants in the similar condition reported higher ratings of similarity to the woman in the video than participants in the dissimilar condition. Respondents were given a scale ranging from 1 (very dissimilar) to 7 (very similar).
Sexual Experiences Survey–Short Form Victimization (SES-SFV)
This self-report measure (Koss et al., 2007) is used to identify victims of sexual assault (after the age of 14) regardless of whether they labeled the experience as a sexual assault. The SES was originally developed in 1982 (Koss & Oros, 1982) and revised in 1987 (Koss, Gidycz, & Wisniewski, 1987). It was later revised in 2007, and the short form of that version was used in the current study. This survey utilized seven sets of questions to which participants indicated how many times they had certain sexual experiences in the past 12 months from 0 (never) to 3+ (three or more times) and how many times they had that experience since the age of 14 from 0 (never) to 3+ (three or more times). Respondents were classified into groups based on whether they have (a) experienced rape or attempted rape or (b) no history of rape or attempted rape (using the time frame of “since the age of 14”). The original SES has shown high internal reliability with women (α = .74), and the test–retest reliability for the SES is also high (r = .93; Koss & Gidycz, 1985).
Demographics Questionnaire
The Demographics Questionnaire was utilized to obtain participants’ characteristics including age, race, and ethnicity (as described in the Participant section), and other relevant information (such as dating status, current year in school, etc.).
Procedure
Participants completed surveys during one session in a small group format. Each group of participants was randomly assigned to the similar (n = 41) or dissimilar (n = 45) group. After participants consented to participating in a study assessing dating behaviors, they completed the Global Perceptions of Risk Questionnaire. Participants then watched the educational video. Finally, participants responded to several measures indicating their personal experiences and perceptions of the assault, including their (a) perceived risk of experiencing a similar assault as assessed by the Global Perceptions of Risk Questionnaire, (b) perceived similarity to the narrator playing an assault survivor included in the Similarity Questionnaire, (c) sexual experiences assessed by the Sexual Experiences Survey, and (d) personal characteristics using the Demographics Questionnaire.
Results
Manipulation Check: Perceived Similarity
Results indicated that the similarity ratings to the woman depicted in the video did not differ between the similar group (M = 4.29, SD = 1.31) and the dissimilar group (M = 3.89, SD = 1.53), t(84) = 1.31, p = .19.
Pretest Optimistic Bias
To test whether participants displayed optimistic bias at pretest, a one-sample t test compared the pretest optimistic bias scores with 0, with a score of 0 indicating that respondents perceived their risk of experiencing a sexual assault to be equal to their friend’s risk. Results indicated that participants’ optimistic bias scores were significantly greater than 0, t(85) = 7.79, p < .001, suggesting that participants displayed optimistic bias at pretest.
Change in Pretest to Posttest Optimistic Bias
A Test (pre vs. post) × Group (similar vs. dissimilar) ANOVA was used to examine the effect of the intervention on the optimistic bias scores. These scores are depicted in the Total column of Table 1. There was not a significant main effect of Test, F(1, 84) = 2.34, p = .13, nor was there a significant main effect of Group, F(1, 84) = 0.77, p = .38. However, there was a significant Test × Group interaction, F(1, 84) = 4.31, p < .05. This interaction was decomposed by group and revealed a significant decrease in optimistic bias from pre- (M = 2.93, SD = 2.64) to posttest (M = 2.05, SD = 3.37) for the similar group, t(40) = 2.29, p < .05, but not for the dissimilar group from pre- (M = 1.89, SD = 2.95) to posttest (M = 2.02, SD = 3.09), t(44) = 0.43, p = .67.
Optimistic Bias Scores.
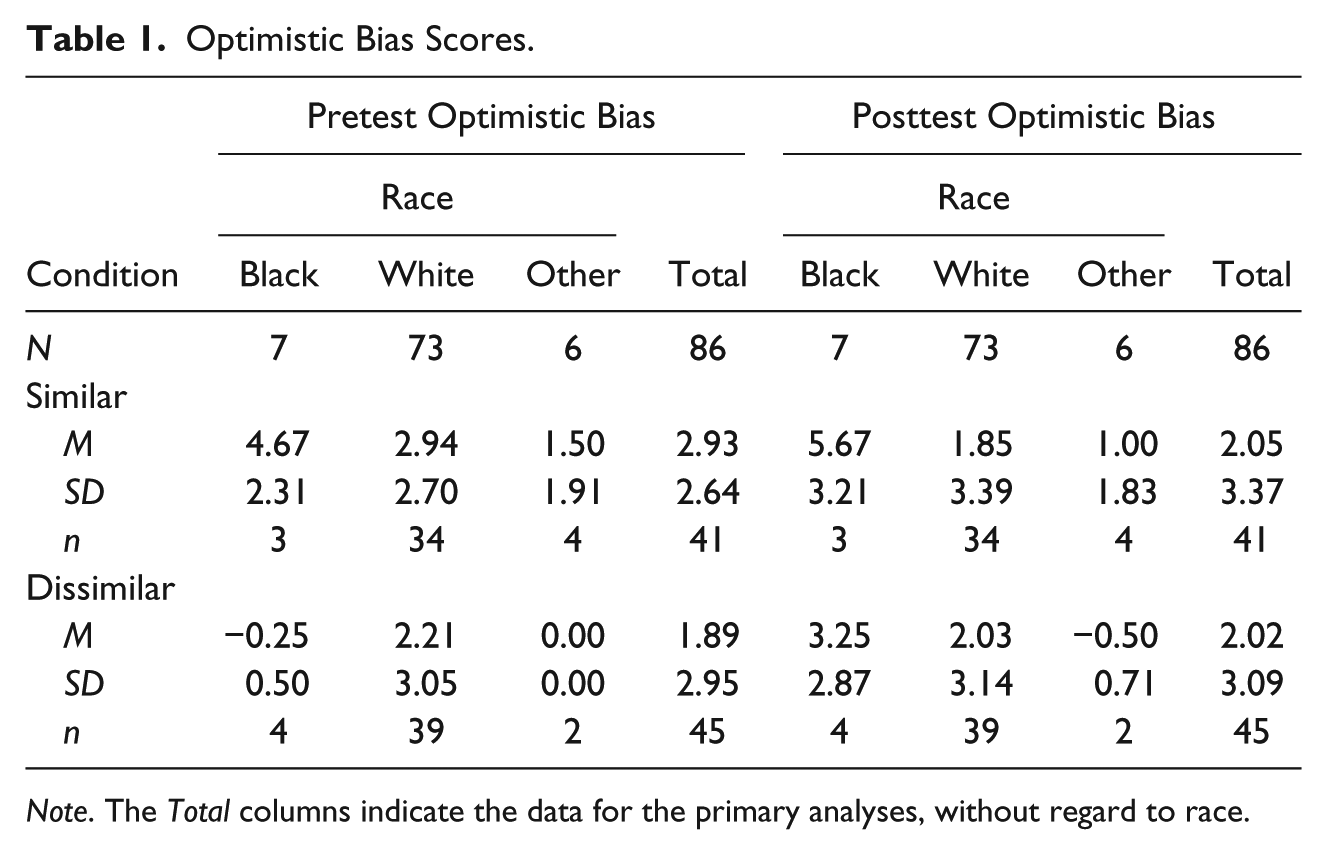
Note. The Total columns indicate the data for the primary analyses, without regard to race.
Differences by Race
Participants’ race was divided into three categories: “White,” “Black,” and “Other.” The Other category was composed of a heterogeneous group of participants who did not identify as solely White or Black; the Other classification included 1 participant who identified as Asian, 1 participant who identified as Pacific Islander, 2 participants who identified as Other, and 2 participants who identified as Biracial. Because biracial students were categorized as Other for this analysis, there was a reduction in the number of Black, White, and Other students compared with the previously reported demographics. Therefore, 7 participants were categorized as Black, 6 participants as Other, and 73 participants as White. A Group (similar vs. dissimilar) × Race Category (Black vs. White vs. Other) ANOVA was used to examine perceived similarity scores. There was no main effect for Race Category, F(2, 80) = 2.67, p = .08. There was a significant main effect for Group, F(1, 80) = 5.05, p < .05. However, this main effect was qualified by a significant Group × Race Category interaction, F(2, 80) = 3.75, p < .05. Separate one-way ANOVAs revealed that there was not a significant main effect of race for the similar group, F(2, 38) = 2.78, p = .07, but there was a significant main effect of race for the dissimilar group, F(2, 38) = 4.31, p < .05. Tukey post hoc tests indicated that for the dissimilar group, the similarity ratings for Black participants (M = 2.00, SD = 1.41) were significantly lower than the ratings for White participants (M = 4.03, SD = 1.44) and for Others (M = 5.00, SD = 0.00), ps < .05. Note that these analyses were conducted with extremely small sample sizes for some groups and therefore, should be regarded with much caution. A Test (pre vs. post) × Group (similar vs. dissimilar) × Race Category (Black vs. White vs. Other) ANOVA was used to examine optimistic bias scores. These data are depicted in Table 1. Only the Test × Race Category interaction was significant, F(2, 80) = 5.72, p < .01. Follow-up t tests revealed that this interaction was due to a reduction in optimistic bias from pre- to posttest for the White participants, t(72) = 2.33, p < .05; no change for the Other participants, t(5) = 2.24, p = .08; and an increase for the Black participants, t(6) = 2.56, p < .05.
Discussion
The present study examined the role of optimistic bias in a sexual assault awareness program. As a manipulation check, we examined whether participants in the similar condition would report higher ratings of similarity to the woman in the video than participants in the dissimilar condition. However, analyses revealed that the women in the two groups did not significantly differ in their perceived similarity to the narrator portrayed in the video.
Additional notable findings regarding changes in optimistic bias scores emerged. First, participants in the similar condition evidenced a greater reduction in their optimistic bias scores from pre- to posttest whereas participants in the dissimilar condition evidenced a negligible increase in optimistic bias scores. It may be that the women in the similar condition identified with the narrator as similar in age or some other characteristic in spite of the responses obtained from the similarity rating. This identification may have resulted in more central route processing consistent with the ELM. Processing information in this way increases the chance that participants evaluate the message and engage in additional contemplation about the topic. An exploration of the effect of race revealed interesting findings. With regard to similarity ratings, Black participants in the dissimilar group reported a significantly lower similarity to the narrator than Other and White participants. With regard to optimistic bias scores, White participants displayed a reduction in optimistic bias. This finding suggests that something about the video and/or study participation resulted in White participants’ believing that they were more likely to be assaulted at posttest as compared with pretest regardless of age similarity.
Although the reduction in optimistic bias is an important finding from an empirical perspective, it does warrant caution when considering practical ramifications. We suggested that programming aimed at informing participants of their risk of experiencing an assault could serve to reduce an individual’s risky behavior. However, reducing or eliminating optimistic bias could unintentionally leave participants feeling more vulnerable after they complete similar programs. Participants may experience undesirable emotional reactions as a result of participation if they are not also presented with information and education about how to lessen one’s risk of experiencing an assault. We agree with other researchers who suggest that it is important to avoid exaggerating or distorting one’s actual risk (Chapin & Coleman, 2006). Ideally, participants would leave awareness and risk reduction programs with the belief that although they are at higher risk of sexual assault than they might have reported prior to the program, they also have the skill, confidence, and ability to engage in behaviors to reduce their risk of sexual assault. As such, we hope that programs aimed at reducing optimistic bias leave women feeling safe and more aware of the need to protect themselves. Furthermore, a program that highlights the risk of sexual trauma must also concurrently avoid placing blame on program participants by suggesting that they are at fault for any subsequent sexual assaults. As such, further consideration and exploration in this area (coupled with caution) are needed.
Interestingly, Black participants in both conditions believed that they were less likely to be assaulted than their peers to an even greater extent after they watched the video. The mechanism that resulted in this increase in optimistic bias is unknown. It may be that Black participants were provided with evidence that sexual assault “will not happen to them.” They may have unintentionally and subconsciously labeled the narrator as “different” due to race, which provided evidence that they are less likely than their peers (or the majority of the other women in the room with them during the study) to be assaulted. However, this possibility should be interpreted with caution due to the small number of participants who identified as Black. Moreover, women in the Black subgroup varied greatly even from each other in optimistic bias scores; changes in responses from even one or two of these women would have greatly affected the results presented here. These two points underscore the importance of carefully interpreting any findings gleamed from this subgroup’s data. Given that this study used such a small sample, additional studies are needed to determine the generalizability of these findings.
Additional studies should examine whether Black participants not only do not benefit from risk reduction or awareness programs with White survivors telling their assault stories, but they may actually be harmed by such a program. It may be that Black participants listening to a White survivor gain additional evidence inadvertently that they are less likely than White participants to be raped because the survivor was White. Especially if this program is their only encounter with a sexual assault survivor, the program may be specifically powerful in increasing rather than decreasing their optimistic bias. Furthermore, participants in different racial groups may judge their similarity differently depending on how closely their race and other physical features match that of the survivor. It may be that certain groups perceive themselves to be more similar to one racial group than another. In that case, we would expect to see differing effects of interventions dependent on their perceived similarity with the survivor.
Although this study provided additional insight into the role of optimistic bias in risk awareness and reduction programs, the study was limited in a few notable ways. In our opinion, the most important limitation is that changes in scores evidenced in this study were quite small. This finding is partly a result of the way in which the constructs were measured. Although scores of optimistic bias appeared to increase or decrease for participants in this study, most participants demonstrated only a small amount of optimistic bias at the outset. It is likely that there may be other, more effective ways to measure optimistic bias; additional research in this area may yield more reliable and valid measures of this construct. It is also important to note that we relied on random assignment to equalize the groups with regard to pretest optimistic bias, but the pretest optimistic scores suggest random assignment did not work well in this instance. However, our central question was whether the intervention would reduce optimistic bias from pre- to posttest, regardless of the participant’s initial level of optimistic bias. As such, replication of the findings with participants who are similar in pretest optimistic bias is warranted. Moreover, a question assessing perceived similarity in age specifically was not included in the measures. In addition, the woman in the video may not have been different enough from participants in the dissimilar group or similar enough to the participants in the similar group. Generalizability to other racial and ethnic groups is limited due to the small sample size in the current study. Future studies may want to include videos of individuals from several different racial/ethnic groups and match participants accordingly, or it may be most effective to create one video with several individuals of varying characteristics.
This study measured optimistic bias directly after viewing the video; however, results may differ depending on when participants are asked about their perceived chance of experiencing an assault. It may be informative to have participants complete a measure of optimistic bias after a delay (e.g., a day or a week later) or over several time periods. It may be that women who initially show a reduction in optimistic bias rebound to preprogram levels after a few months possibly as a result of the way they process the information.
Furthermore, the Black participants in this study who demonstrated significant increases in optimistic bias may not experience this change as a lasting effect. This finding would be consistent with the ELM in that the Black participants may have been attending more to peripheral cues, such as what the woman looked like or her trustworthiness, instead of the message because they did not perceive the message to be particularly relevant. If this is the case, then the ELM suggests increases in optimistic bias would likely be reduced to or near preprogram levels after an amount of time passes (Heppner, Good, et al., 1995; Petty & Cacioppo, 1981).
In summary, the results of this study suggest that perceived similarity to the survivor (e.g., age or race) in a sexual assault awareness program may play a role in the success or failure of such a program, at least as measured by changes in optimistic bias. There is a great deal of progress to be made in understanding the role of optimistic bias, and the prevalence and implications of this bias appear to vary in important and meaningful ways.
Footnotes
Declaration of Conflicting Interests
The author(s) declared no potential conflicts of interest with respect to the research, authorship, and/or publication of this article.
Funding
The author(s) received no financial support for the research, authorship, and/or publication of this article.