






Abstract
This article presents an analysis of determinants of intimate partner violence (IPV) in the European Union (EU). Based on an EU-wide survey with 42,000 women that examined women’s diverse experiences of violence—from violence by strangers to sexual harassment—this article looks specifically at the survey’s research with respect to the occurrence of IPV in current partnerships. The analysis explores selected determinants of IPV by focusing on specific indicators in relation to a couple’s socioeconomic status, and analyzes inequalities in the sense of unequal distribution of resources. In addition, a partner’s behavior outside a relationship, as captured through specific survey questions, is looked at as providing additional evidence of factors that strongly indicate IPV. The results of the article show that, when averaging across the EU Member States, among couples with lower socioeconomic status, there is higher prevalence of violence. In particular, women reporting problems with their household income also report higher rates of IPV. Furthermore, women suffer more often from violence if they do not have an equal say about household income. While reported inequality in income between partners, in the sense of a partner earning more or less than a woman, does not show a consistent result, a woman who reports having less say about the family income is more likely to experience IPV. This result points to the importance of “norm” related inequality compared with actual inequality with respect to IPV, which holds true across all EU Member States. Finally, a partner’s behavior—in terms of being violent outside a relationship and frequently getting drunk—shows a strong influence on women reporting incidents of IPV across all countries in the survey.
Introduction
Intimate partner violence (IPV) is a reality in all countries affecting women of all social backgrounds and ages (European Union Agency for Fundamental Rights [FRA], 2014a; Heise & Kotsdam, 2015). However, not all women are affected, sometimes men also suffer from IPV, and not all victims of IPV are affected in the same way. This makes it important to analyze the occurrence of violence in more detail. Research on factors exploring IPV needs to be based on rich data sources that allow us to further our understanding of determinants of IPV against women. An increased understanding of IPV helps to design policies that aim to prevent violence and better support those who are at particular risk. At its most extreme, IPV is not only a major risk factor for intimate partner homicide (Campbell, Glass, Sharps, Laughon, & Bloom, 2007), but it generally undermines the dignity of every woman affected by violence perpetrated by their intimate partner(s).
This article contributes to the research on IPV against women by exploring the prevalence of physical and sexual violence against women in all 28 European Union (EU) Member States—drawing on a unique dataset. Based on a survey conducted with 42,000 women across the EU, the analysis explores which indicators related to socioeconomic status, inequality, and partner behavior are associated with violence committed by current partners against women. It shows the strong correlation between economic gender inequality and IPV across all countries, and reiterates research results showing the strong correlation of alcohol abuse and IPV.
The article begins with an outline of theoretical considerations and a formulation of hypotheses for the analysis, which are based on existing literature. Following this, the data source and analytical methodological approach are described, and descriptive statistics are presented. This is then followed by the results of logistic regression models evaluating the influence of determinants of physical violence against women by current partners. The “Conclusion” section concludes the article by pointing to further research needed in the area.
Selected Determinants of IPV: Hypotheses and Existing Research
This article looks into factors at the partner and relationship level for exploring the occurrence of IPV. Given the broad extent of research on IPV, the current analysis will limit itself to looking into three main aspects related to IPV, namely, the socioeconomic status of the couple, (economic) inequality in relationships, and partner behavior that is associated with a certain expression of masculinity. Specifically, the article explores the following hypotheses:
This set of hypotheses is not considered to fully determine IPV. Other important factors, such as childhood experience of violence, are not included in the analysis. In sum, these three hypotheses have been selected because of their prominence in existing research, which is briefly referred to here.
As reported in an overview prepared by the World Health Organization (WHO), lower socioeconomic status, indicated through lower levels of education, is consistently reported across studies as influencing IPV against women. While the WHO (2010) report mostly refers to studies carried out in countries outside Europe, its comparative research is informative as it consistently shows that lower levels of education correlate with higher perpetrating as well as with higher levels of victimization, and therefore is relevant with respect to the current analysis. Reasons for this correlation often refer to a woman’s lack of access to resources and higher acceptance of violence (McCloskey, Williams, & Larsen, 2005; WHO, 2010). In addition to lower education, studies report considerably higher levels of IPV among low-income women—indicating that IPV does not affect all women equally (Sokoloff & Dupont, 2005). Furthermore, men’s recent employment problems are included as risk factors in risk assessment instruments (Messing & Thaller, 2014). The relationship of socioeconomic status is, however, not straightforward and still controversially discussed, noting too that consideration needs to be given to the intersection of class, race, and sexuality—among other factors—in manifestations and understandings of IPV. 1
In addition to the general socioeconomic status of a couple, inequality in a relationship is related to higher levels of IPV. Inequality can be understood and measured in a variety of ways, but is mainly discussed in the sense of (though not always reduced to) economic differences. There is a complex relationship between economic inequality and violence. Violence is not just a tool of economic power, but economic structures do play an important role with respect to social inequality and in creating social relations in which violence takes place (Walby, 2013). The complexity of violence and power structures is also evident in Arendt’s (1970) work on violence, which argues that violence can be used as a means to create a power relationship or to maintain it in case there is the danger of the power relationship weakening.
Some studies have pointed to the relationship of women’s dependency and IPV, particularly pointing to the role of economic dependency (e.g., Babcock & DePrince, 2013). However, at the same time, a man’s economic dependency on a woman might also be related to increased IPV perpetrated by the man, due to a man feeling challenged in his masculine role (Atkinson, Greenstein, & Lang, 2005). Men’s inability to earn money for the family is, for instance, discussed in relation to the “troubled masculinities” of Chechen refugees in the Czech Republic, which is linked to IPV (Szczepanikova, 2008). Moreover, Hagemann-White (2002) points out that some previous empirical research fails to show the link between economic dependency of a women and IPV, but that the level of male dominance in the relationship positively correlates with violence.
The relationship between male dominance and IPV is reflected in some widespread social theories about gender equality. This established research indicates a link between IPV and a patriarchal understanding of a relationship in the sense of believed (and lived) inequality between men and women. This is supported by sociological theories of masculinity that underline that male dominance (Bourdieu, 2005) or “hegemonic masculinity” (Connell, 1999; Connell & Messerschmidt, 2005) is related to the belief that women should be subordinated to men. According to Bourdieu (2005), male dominance is very much related to symbolic violence that is expressed through a variety of gender specific behavior. A general patriarchal expression of masculinity is also related to “masculine behaviour” of men, such as violence toward other men. While it is important to point out that violence by men against men is conceptually different than violence against women, it still indicates a behavior that follows a certain expression of masculinity that can also be related to violence against women (Bourdieu, 2005; Connell, 1999; Meuser, 2002; Wojnicka, 2015).
The importance of norms related to gender equality is highlighted in several studies. Heise and Kotsdam (2015) made an extensive macro-level analysis of 12-month prevalence rates for IPV based on data from 66 surveys from 44 countries. The study shows that norms related to male authority over female behavior, norms justifying “wife beating,” and the extent to which legal regulations put women at a disadvantage compared with men—with respect to access to resources—help to predict levels of physical and sexual violence. While the study finds that gross domestic product (GDP) is correlated with levels of IPV, the statistically significant influence of GDP disappears when the aforementioned norm-related data are included in the analysis alongside GDP (Heise & Kotsdam, 2015). This indicates the stronger influence of norms as compared with the economy.
Furthermore—reflecting data collected in the survey on alcohol use by male partners—alcohol abuse is assumed to significantly increase IPV (Messing & Thaller, 2014; Reingle, Jennings, Connell, Businelle, & Chartier, 2014; Sapra, Jubinski, Tanaka, & Gershon, 2014; WHO, 2006). The literature provides several reasons for the correlation of alcohol consumption and increased IPV. A literature review published by the WHO (2006) lists, for example, the impact of alcohol on cognitive and physical function, the use of alcohol as an excuse for violence, or the fact that alcoholism could lead to other risk factors such as financial difficulties or child care problems. Moreover, research has indicated that persons who experienced violence in childhood are more likely to develop harmful drinking patterns in later life (WHO, 2006). What is more, alcohol-related violence against women is also related to and interacts with normative views on gender relations; alcohol abuse as such might be seen by some as a “masculine behaviour” in the sense of hegemonic masculinity, because alcohol (ab)use can be conceptually linked to a certain expression of masculinity (Schmitt, 2009). In particular, experimental studies on sexual violence against women show that the impact of alcohol on (sexual) violence is also moderated by prior beliefs about the impact of alcohol. This means that men who expect that alcohol makes men more aggressive also become more aggressive and describe violence as more typical for men or when supporting rape myth attitudes (Davis, Danube, Stappenbeck, Norris, & George, 2015; Norris, Davis, George, Martell, & Heiman, 2002). This correlation has also been related to the concept of “hypermasculinity,” consisting of callous attitudes toward women, aggression as “manly,” and danger as exciting (Norris, George, Davis, Martell, & Leonesio, 1999).
Measuring IPV—Data and Method
To address the association of IPV with socioeconomic status, inequality in a relationship, and partner behavior, the data from the EU-wide survey on violence against women were used. The survey was carried out in all 28 EU Member States in 2012 on behalf of the FRA. The survey interviewed 42,000 women. The samples per country were on average slightly higher than 1,500, ranging from 1,500 up to 1,620. The only exception is Luxembourg with a sample of 908 (FRA, 2014a, 2014b). For the purpose of this article, the sample was reduced to all women who had a partner at the time of the survey and where information on partner characteristics was available, which led to a sample of 26,404.
The survey collected information on violence committed by a woman’s current partner. It asked whether or not the current partner has ever “pushed or shoved you,” “slapped you,” “thrown a hard object at you,” “grabbed you or pulled your hair,” “beat you with a fist or a hard object or kicked you,” “burned you,” “tried to suffocate you or strangle you,” “cut or stabbed you, or shot at you,” or “beat your head against something.” Moreover, forms of sexual violence were also asked about, namely, women were asked to indicate whether or not their current partner has ever, “forced you into sexual intercourse by holding you down or hurting you in some way,” “attempted to force you into sexual intercourse by holding you down or hurting you in some way,” “made you take part in any form of sexual activity when you did not want to or you were unable to refuse,” and whether a woman has “consented to sexual activity [with a current partner] because you were afraid of what might happen if you refused.” The dependent variable takes the value of 1, if one of the mentioned items has been experienced by the respondent at least once, and the value 0 if none of the incidents have been mentioned. This means that the dependent variable also includes cases where violence has taken place several years ago but not in the recent past. 2
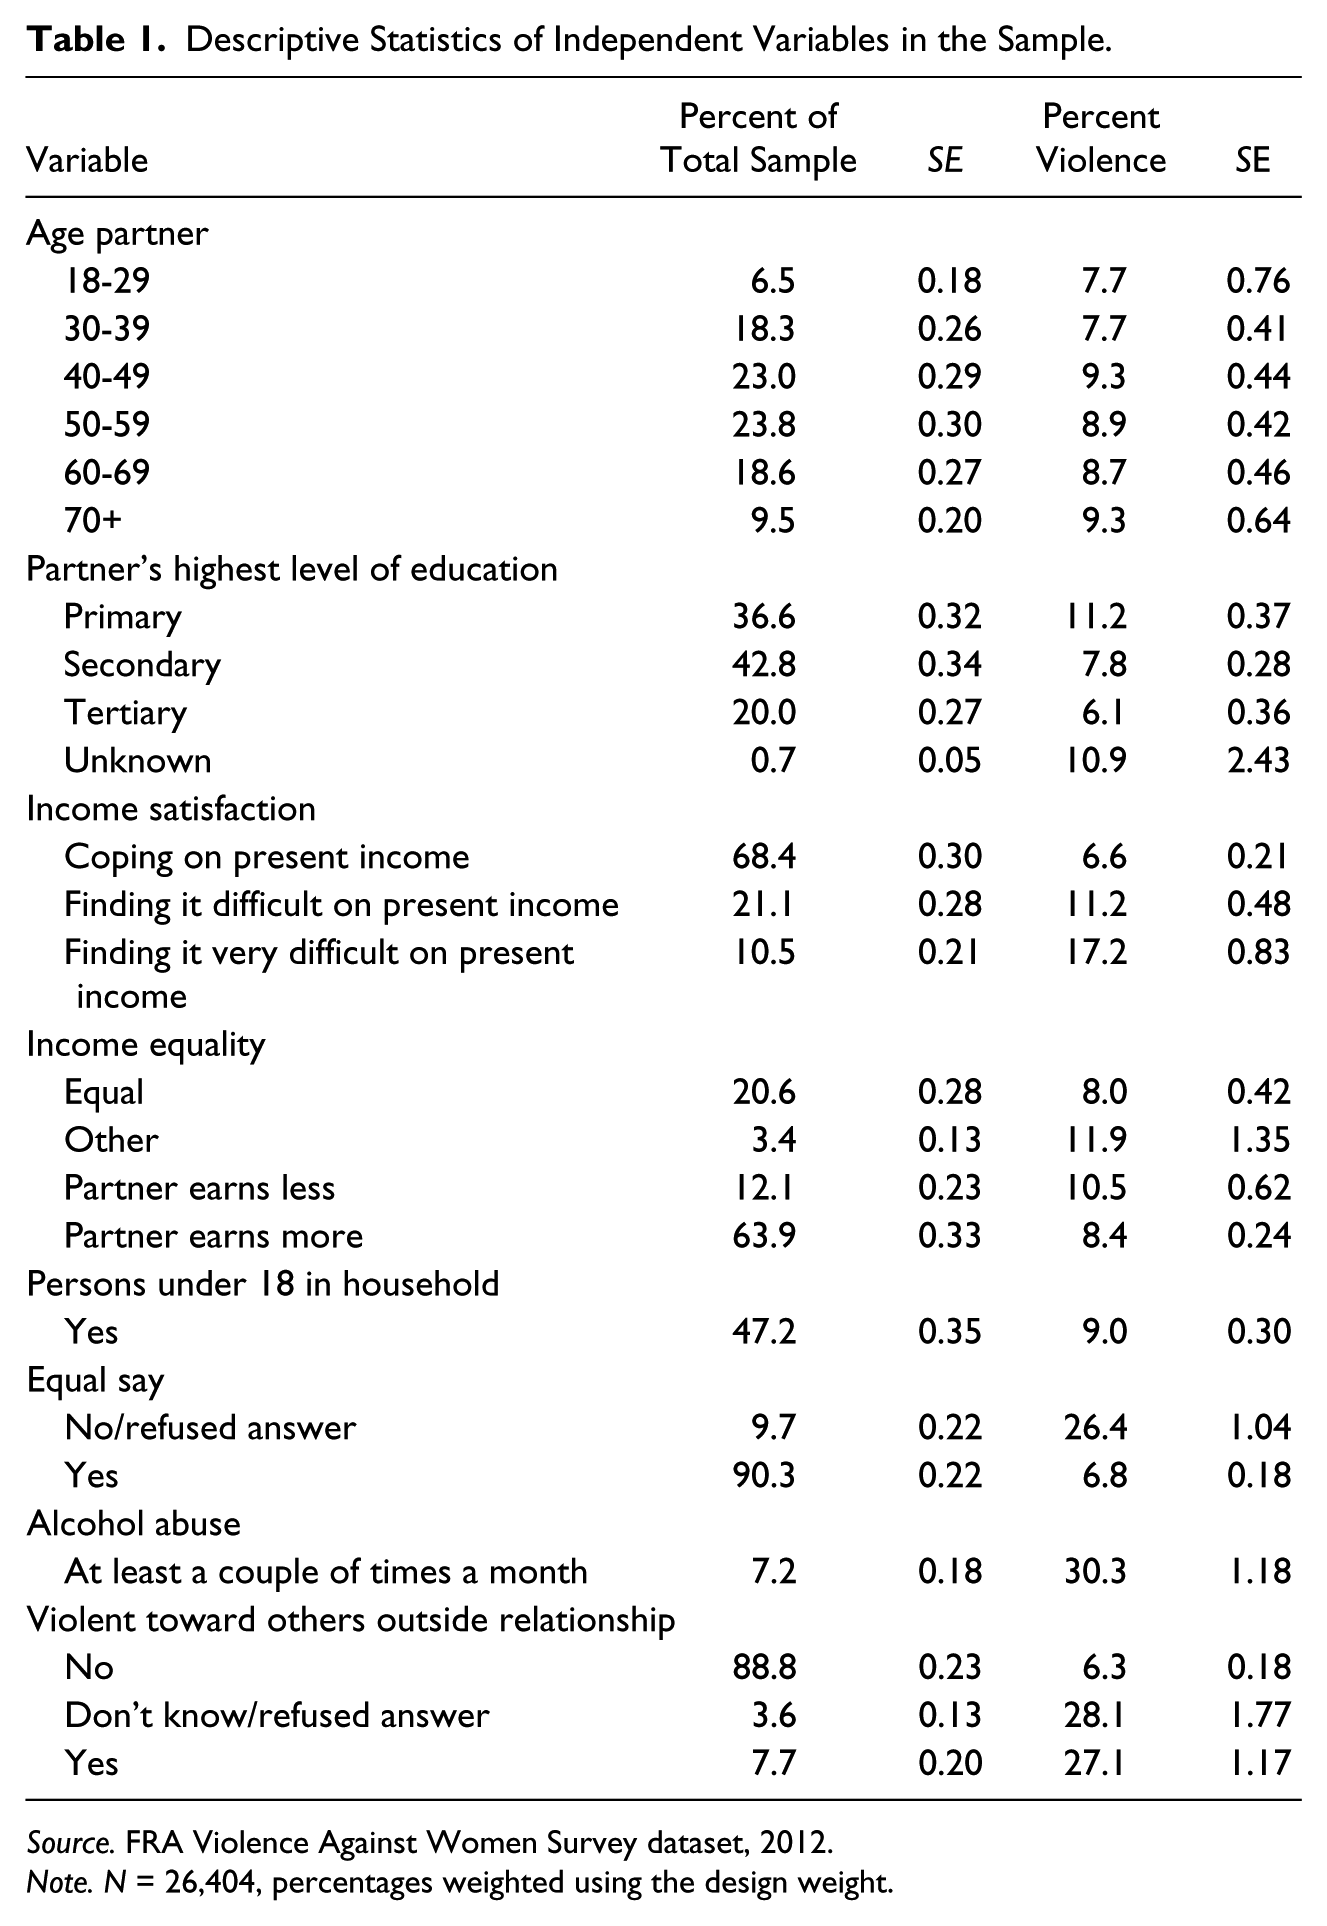
The explanatory variables are summarized in Table 1. Here, a partner’s age was summarized in 10-year categories and used as a continuous variable in the regression analysis. Socioeconomic background was measured based on the partner’s level of education and the income satisfaction of respondents in the survey. Education took the values of primary education (including completed primary education or less, and lower secondary or second stage of basic education), secondary education (including upper secondary and postsecondary, nontertiary), and tertiary education. In several cases, the educational attainment of the partner was not known or not reported, which was included as a separate category. Income satisfaction was categorized into “coping on present income” (including “living comfortably on present income” and “coping on present income”), “finding it difficult on present income,” and “finding it very difficult on present income.”
Descriptive Statistics of Independent Variables in the Sample.
Source. FRA Violence Against Women Survey dataset, 2012.
Note. N = 26,404, percentages weighted using the design weight.
Economic inequality is measured through inequality in earnings. In the survey, the respondent could indicate if she earned roughly the same as her partner, if her partner earned less, or if her partner earned more than the respondent (some respondents answered this question with “don’t know” or refused to answer this question—these cases were kept in the analysis as “other”). In addition to this factual statement, equality was also assessed through the question “Do you feel you have an equal say with regard to the use of the household income?” where the variable takes the value 1 if the woman answered with “yes” and the value 0 if otherwise. This question is related in the analysis to male dominance and partner behavior.
Alcohol abuse by a woman’s partner was based on the survey question “How often does your partner drink so much that he or she gets drunk.” 3 The analysis included a dummy variable taking the value 1 if the response was that the partner got drunk a couple times a month or more frequently, and the value 0 if otherwise. Violent behavior by a woman’s partner—outside a relationship setting—was based on the question “Has your partner ever been physically violent toward anyone outside the family?” taking the value 1 if the answer was “yes” and 0 otherwise. The current analysis does not include any explicit indicators on controlling behavior by the partner, which would more clearly point to issues related to male dominance. However, as more explicit cases of controlling behavior would already present a certain form of psychological violence, such information was not included in the analysis to focus on the above-mentioned operationalization of male dominance and partner behavior. The article by Nevala in this special issue explores the survey data with respect to psychological violence in the sense of coercive control.
The data were analyzed by using a logistic regression model weighted by the design weight of the survey. The model estimates the binary response variable Y (here experienced physical violence = 1, not experienced physical violence = 0), which uses the logit function to estimate the average differences for a one unit difference in the explanatory variable X, where k is the number of predictor variables included in the model, β is the coefficients for the average differences in the logitP[Y = 1], and α (or intercept) is the coefficient estimate for the logitP[Y = 1] when all Xs take the value 0:

The calculations were implemented using the “survey” package (Lumley, 2010) of the statistical programming software R (R Core Team, 2015). As mentioned before, the analysis used the design weight in the dataset, which means that it only controls for selection probabilities within the countries, but not for population sizes across countries, hence, treating all countries in the sample with equal importance.
Countries entered the regression model as a categorical variable. Belgium was selected as the reference category, because it is the country that shows a prevalence rate closest to the overall mean. This means that differences across countries were assessed in comparison with Belgium, holding the overall effect of all other variables in the model constant. In addition to this, the model was estimated for each country separately. To control for one other potentially important demographic factor related to IPV, the presence of children in the household was included in the model, measured through a variable taking the value 1 if there were persons aged under 18 living in the household and 0 if not. 4
Levels of Violence and Its Relation to Socioeconomic Status, Inequality, and Partner Behavior—Descriptive Statistics
Across all 28 EU Member States, 7.8% of women, who had a partner at the time of the survey, reported to have experienced at least one incident of physical or sexual violence by their current partner. This percentage varies across the countries ranging from very low percentages of around 2.9% in Austria up to 14.1% in Romania. While this article does not address possible cultural and contextual explanations relating to specific country differences, the Main Results Report from the FRA (2014a) survey does explore possible explanations, which are also addressed in some of the other papers in this special issue (see paper by Latcheva in this special issue).
The percentages including 95% confidence intervals are displayed in Figure 1.
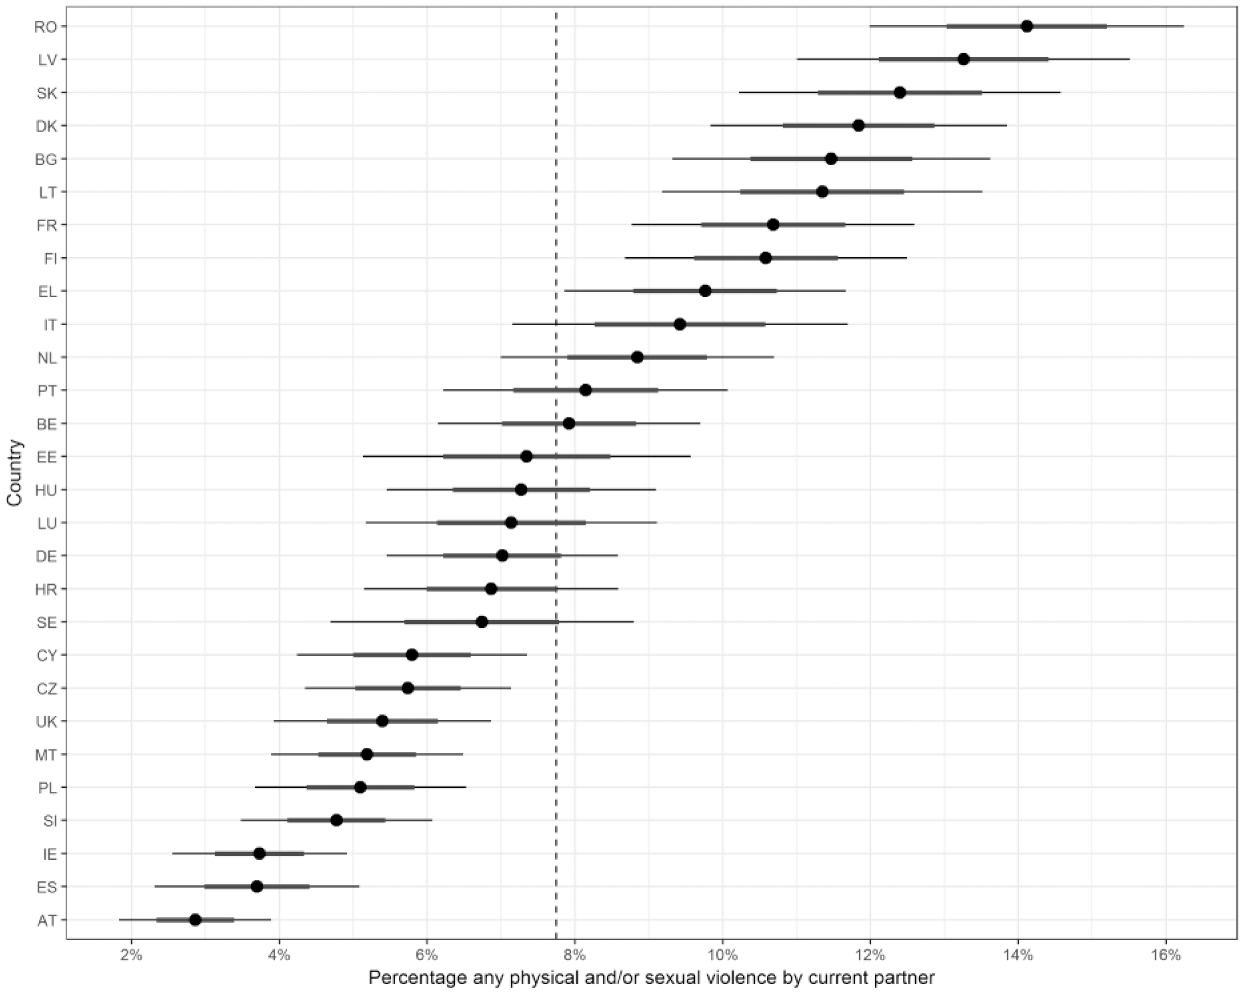
Percentage of women, with a partner, with at least one incident of violence perpetrated by the current partner by country.
Table 1 summarizes the explanatory variables and their relation to the prevalence of violence by the current partner. The percentages of reported violence are slightly lower for younger ages, but the differences are not statistically significant. Moreover, the findings show that partners with lower levels of education are more often violent toward their partners, and the rates of IPV are significantly higher for women reporting difficulties with their present income.
Compared with couples where both partners earn approximately the same, we find a statistically significant higher percentage of violence among couples where the partner earns less. If the partner earns more, which is the case in the majority of couples, the percentage is not significantly higher.
In close to half of the sample, children live in the household; however, no significant difference in the prevalence of IPV is found if children live in the household. The strongest differences can be observed for cases where women report not having an equal say on household income, where the partner gets drunk frequently, and where the partner shows violent behavior outside the family. In these cases, the percentage of violence in the sample increases to 26.4% (unequal say), 27.1% (violent outside relationship), and a high of 30.3% in the case of frequent alcohol abuse.
The higher prevalence of IPV for couples where the woman does not have an equal say on household income is consistently found across all countries (see Figure 2); in close to all countries (with the exception of Estonia, Luxembourg, Sweden, and Austria), significantly higher rates of IPV can be found for those couples where the woman indicates that she does not have an equal say about household income. However, it also needs to be pointed out that approximately one in 10 women across all countries report this inequality, and country levels range from a minimum of 3% and 4% in Croatia and the Netherlands up to 22% and 25% in Bulgaria and Austria, respectively. This means that the majority of women feel that they have an equal say regarding household income, but if they do not feel so, rates of violence go up. For example, in Croatia, women who feel they have an equal say about income report IPV in 7% of cases, whereas 33.7% of women who do not feel they have an equal say report IPV. In Bulgaria, where many women report not having an equal say about income, the rates are 7.4% for those women who do have an equal say in comparison with 24.5% for women who do not. The strongest difference in this respect can be found in Romania, where the rate of violence increases from 14.4% to 60.2%, if no equal say about income is reported. A partner’s alcohol abuse and violence outside the family is also reported by a small share of the sample of approximately 7% to 8%. The lowest percentages of women reporting that their partner gets drunk frequently are found in Italy and Malta, with just over 1%. The highest levels can be found in Estonia and Ireland, at 16% and 17%, respectively. Violent behavior outside the family is lowest in the Czech Republic at 2.8%, and highest in Luxembourg with 13.7%. However, in some countries, there are high shares of women who report that they do not know whether or not their current partner shows violent behavior outside the family (e.g., in Lithuania 23% do not know or refuse to answer this question).
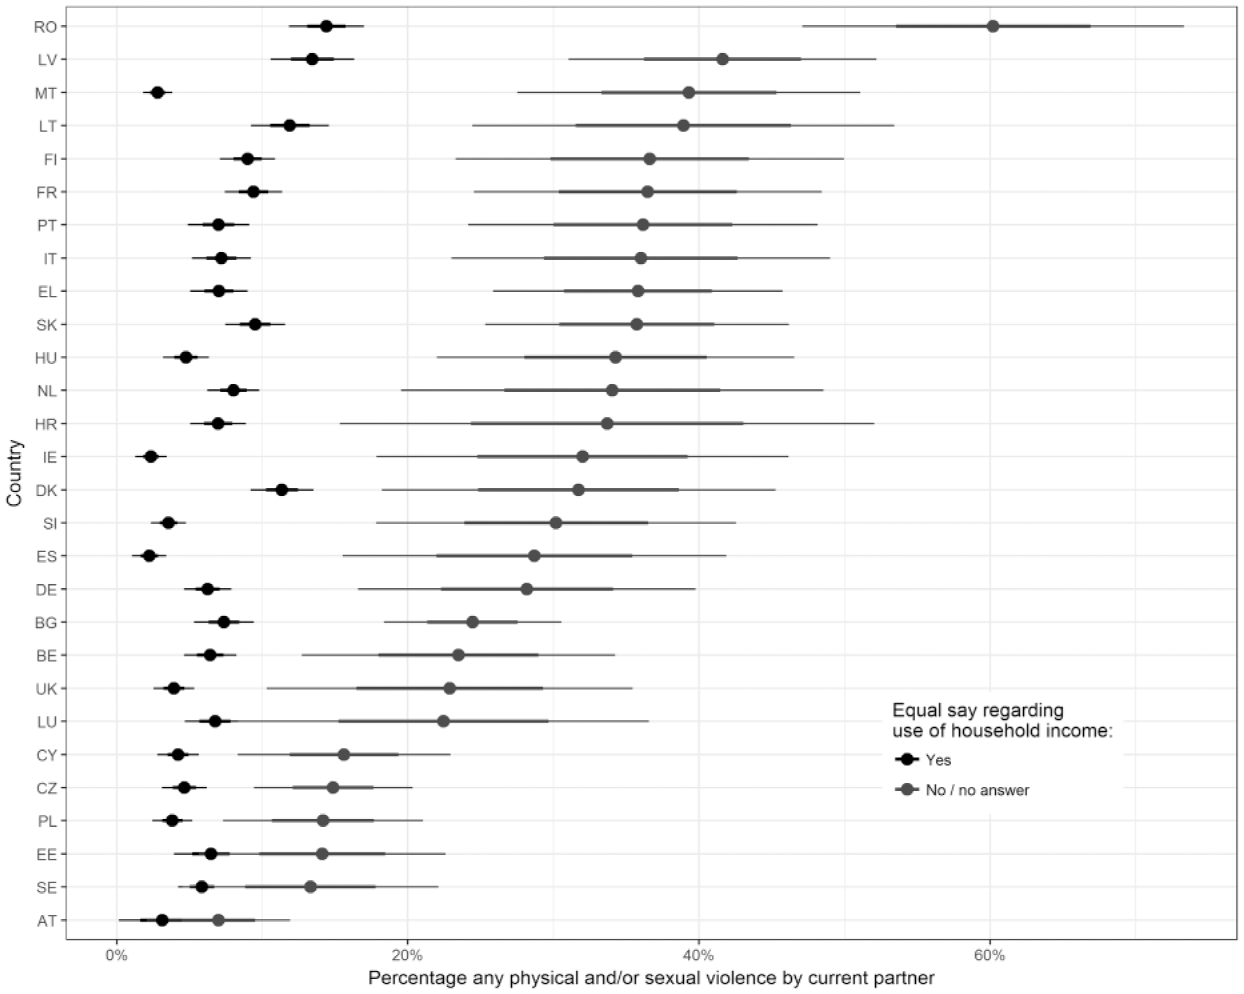
Prevalence of physical and/or sexual violence by country and equality regarding use of household income.
Determining Violence—Main Results
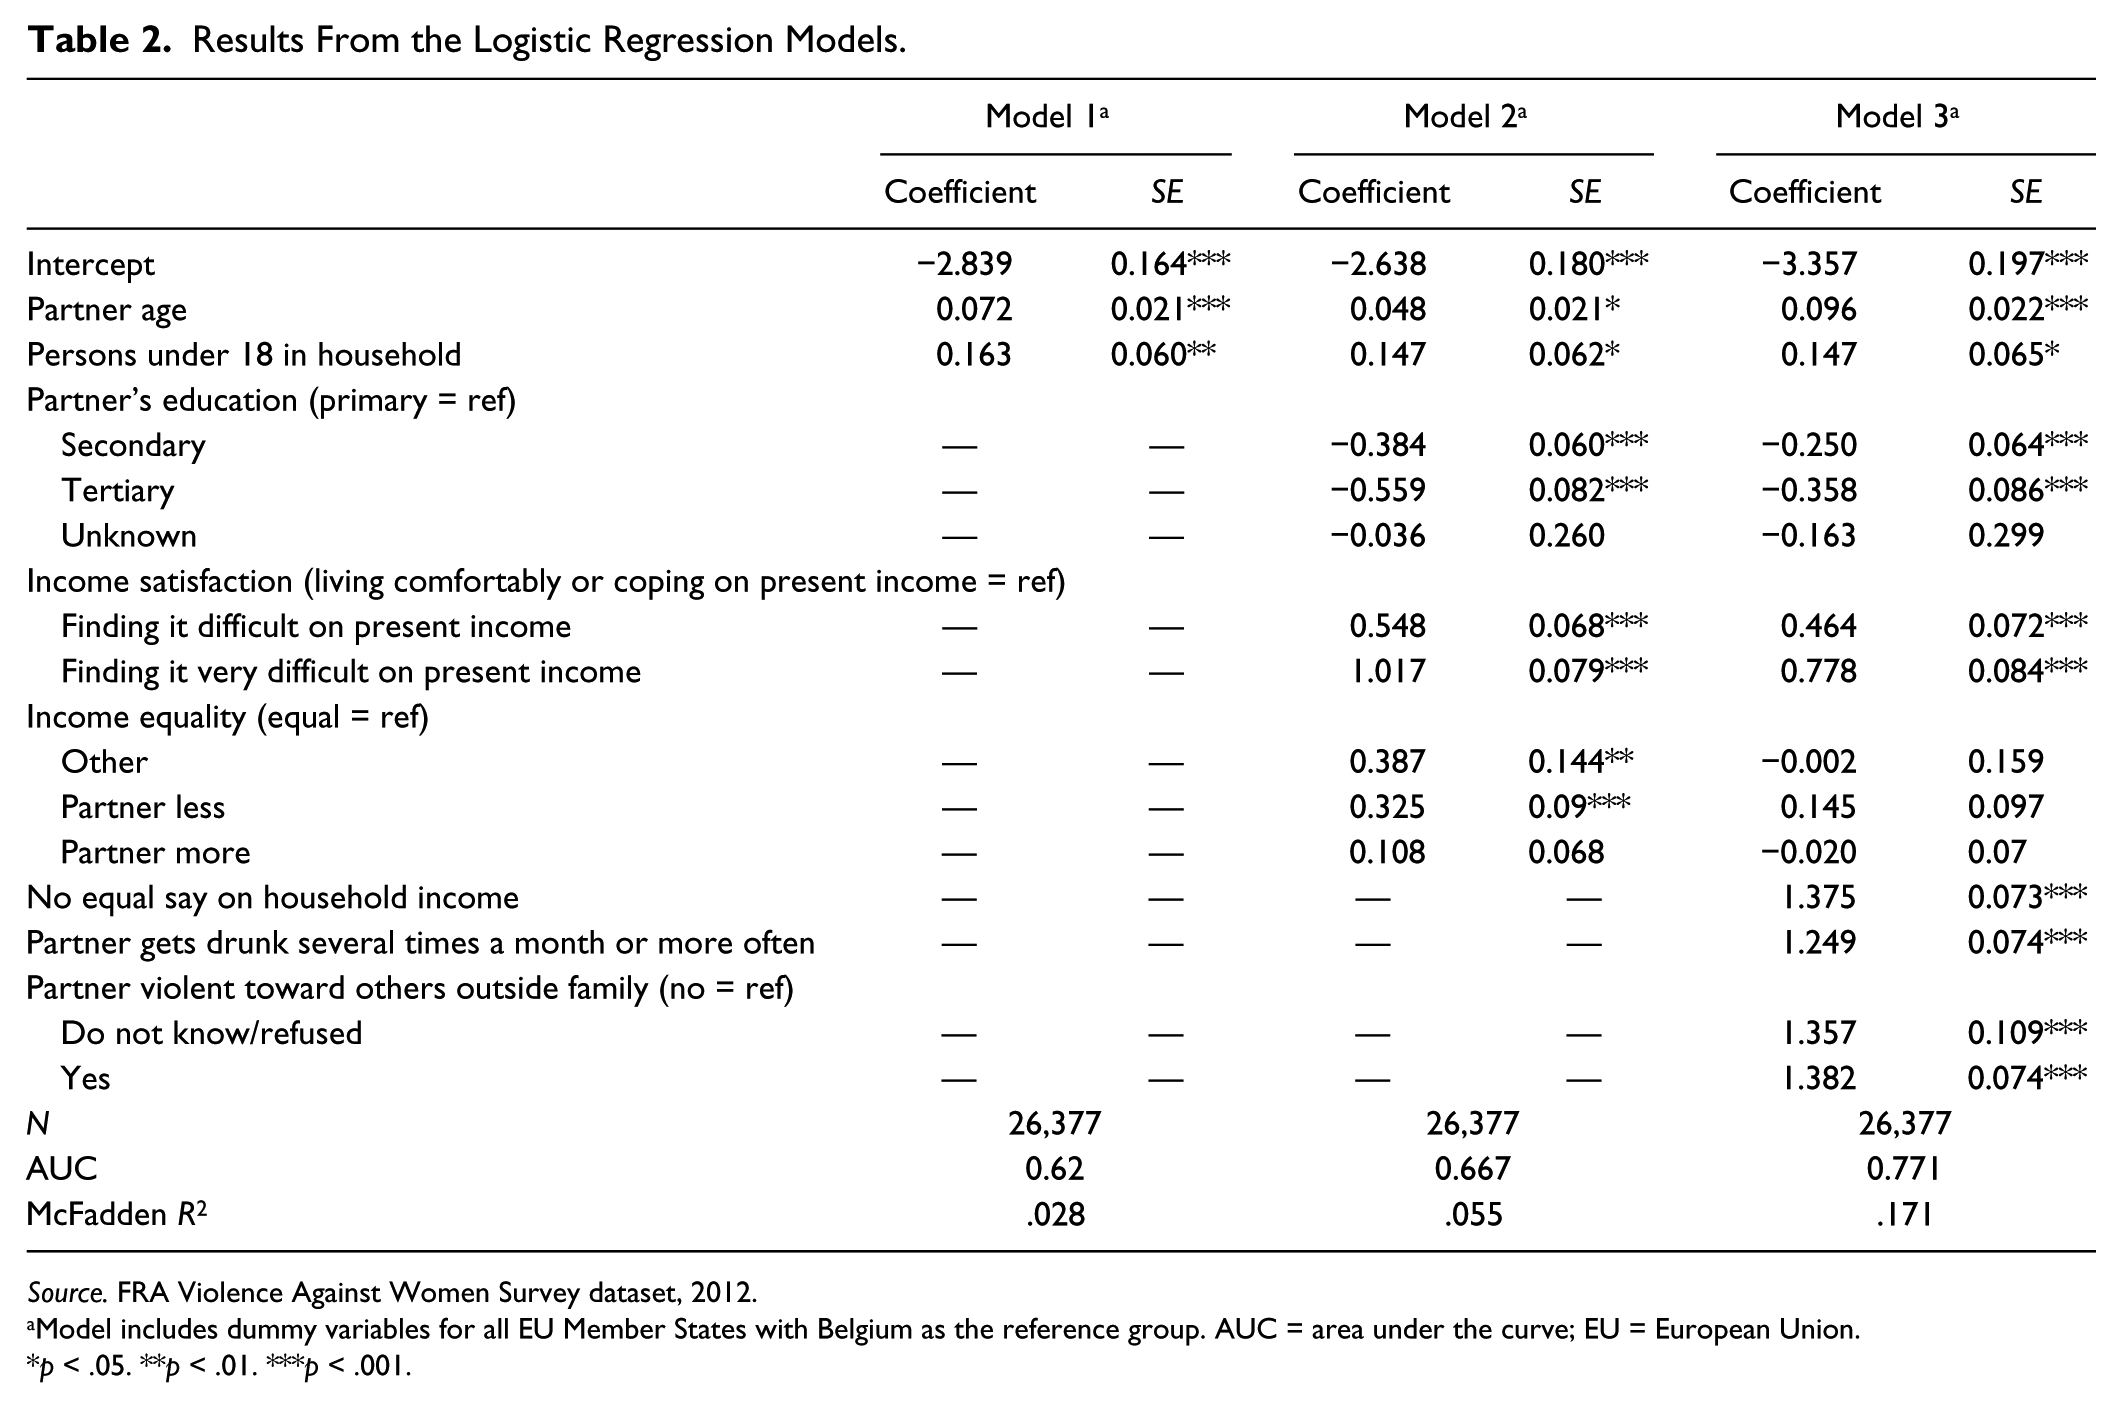
This section reports the results of the logistic regression models—testing the influence of socioeconomic status, economic inequality in the relationship, and partner behavior in three steps. Model 1 includes only the control variables, which are dummy variables for the countries (reference = Belgium), age of the partner and children in the household. These variables were included to control for contextual information, though not explicitly addressed in the hypotheses. Given that age structures and several other contextual factors—which are not looked into in the analysis—may vary considerably across countries, these two variables were included in all models. Model 2 includes the same predictors as Model 1 and additionally includes the variables related to socioeconomic status and income inequality. Model 3 adds variables on partner behavior—whether the woman perceives to have an unequal say about the household income, alcohol abuse by the partner, and violent behavior outside the family. The country results are not shown in Table 2 but in Figure 4. Generally, most of the differences in the rates of IPV reported in the bivariate correlations (above) remain relevant factors in the multivariate analysis as well. However, some differences can be reported. Table 2 summarizes the results from the three logistic regression models.
Results From the Logistic Regression Models.
Source. FRA Violence Against Women Survey dataset, 2012.
Model includes dummy variables for all EU Member States with Belgium as the reference group. AUC = area under the curve; EU = European Union.
p < .05. **p < .01. ***p < .001.
In the sample, the older age of a partner tends to be related to higher prevalence of IPV. This tendency is not statistically significant in the first model, but the coefficient increases in Models 2 and 3 with the standard error remaining the same. Therefore, age only plays a role when controlling for inequality in the relationship and partner behavior. This, however, does not say that older partners are more violent, but that women with older partners (who are generally older as well) are more likely to have experienced violence at some point during their relationship. The violence reported in the survey often dates back several years. And, as shown by previous studies (e.g., WHO, 2010), younger age is usually related to IPV (perpetrators and victims). The current correlation can be explained by the fact that older couples usually have had longer relationships and therefore a longer period of time where violence could have taken place. In this sense, a potential decrease in violence in the past decades could, conversely, be reflected in higher levels of experienced violence among older couples, when taking into account the overall length of a relationship. 5
The general trend of less IPV among couples with more highly educated partners is confirmed in the sample. In addition, there is a higher prevalence among those women who report difficulties with their present income. Both factors indicate that lower socioeconomic status remain valid for the other model. Therefore, in the EU, women with lower socioeconomic status are more affected by IPV, which confirms Hypothesis 1.
With respect to income inequality, there is no difference between couples where both have an equal income and couples where the partner earns more. There is a higher rate of violence among couples where the partner earns less than the woman as compared with equal earnings (Model 2). This difference, however, is significantly reduced when including variables for partner behavior in Model 3, which renders the coefficients for unequal income statistically insignificant. Contrary to this, there is a strong influence on manifestations of violence of whether or not a woman has an equal say about family income. If a woman does not report having an equal say on family income, the rate of IPV increases significantly. For Hypothesis 2, we can only confirm the negative impact of economic inequality on IPV in the following way: In relationships where the woman does not have an equal say about income, we can confirm higher levels of IPV; however, where actual income differences are reported, no consistent differences in violence rates are found. This points out that the actual economic dependency—in terms of the woman earning less than her partner—might not be a cause of violence, but rather that the level of male dominance in the partnership is the main driving factor influencing partner violence (as pointed out by Hagemann-White, 2002).
Finally, both variables on partner behavior show strong associations with the outcome variable. Men who frequently get drunk and who show violent behavior outside the relationship are significantly more often violent toward their partners, which confirms Hypothesis 3.
Due to the unintuitive interpretation of coefficients of logistic regression models, Figure 3 shows differences in the expected values based on Model 3. This means that specific values for all variables in the model were chosen in a certain combination, the logit coefficients were added up and transformed into expected (estimated) probabilities. The cases are not real, but give a sense of differences in estimated rates of IPV based on the results. In the base-line case (all variables take the value zero, except age, which was set to the average value), we can look at a hypothetical couple living in Belgium with no children in the household: where the woman reports that they cope with or live comfortably with their present income, where the woman’s partner is of average age and has primary-level education, where income is equal, and where the woman’s partner does not get drunk several times a month or more often, and does not show any violent behavior outside the relationship (Case A). In this case, the expected rate of IPV is 4.7%. Looking at the same situation, but changing it to a woman finding it very difficult to cope on the couples’ present income, the expected percentage increases to 9.8%. When adding the factor of not having an equal say on household income, the estimated percentage increases to 29.9%. Adding the coefficient of frequent alcohol abuse increases the rate to 59.6%, and further adding violent behavior outside the relationship increases the estimated rate of violence to 85.3% (the predicted percentages for these cases are shown in Figure 3).
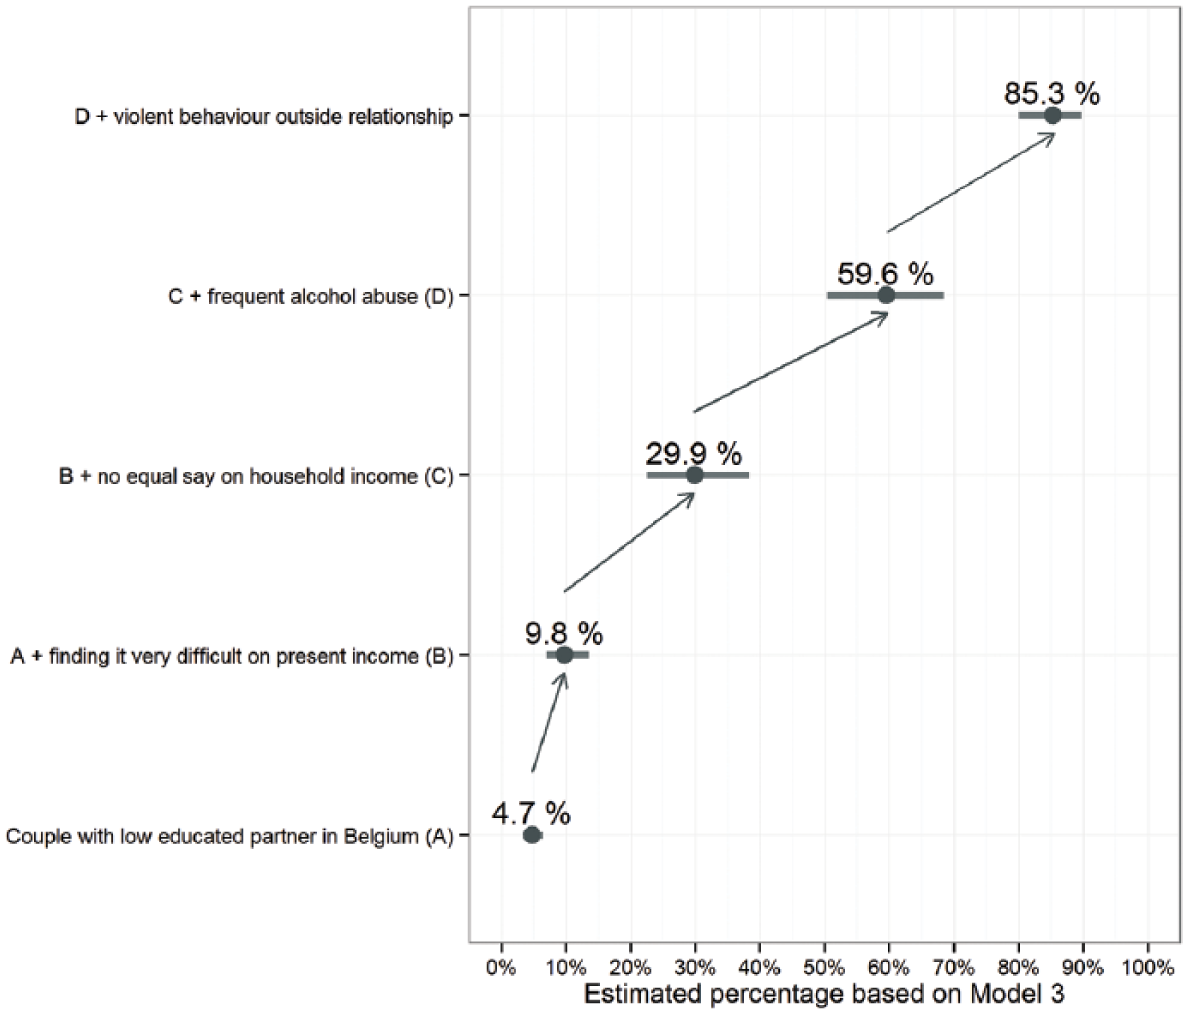
Expected values of IPV based on Model 3 for selected cases.
This means that, based on the survey’s EU-wide data, we can confirm the very strong influence of low income, unequal say about income, alcohol abuse, and violent behavior outside the relationship as factors influencing women’s experiences of violence. As these factors contribute to but do not fully explain the prevalence of IPV, there are differences in the rates across countries. Figure 4 shows the coefficients for the countries in the regression models. The coefficients indicate the differences to the reference country Belgium. It shows that several countries, including Austria, Ireland, Spain, Cyprus, Poland, Slovenia, the Czech Republic, Hungary, and the United Kingdom, show significantly lower rates compared with Belgium, even when controlling for the factors included in the models. Only for Romania and Denmark, higher rates can be confirmed for all models. These unexplained differences might come from not only individual factors not considered in the analysis but also contextual and structural factors at the country level (see, for instance, the discussion on country differences in FRA, 2014a).
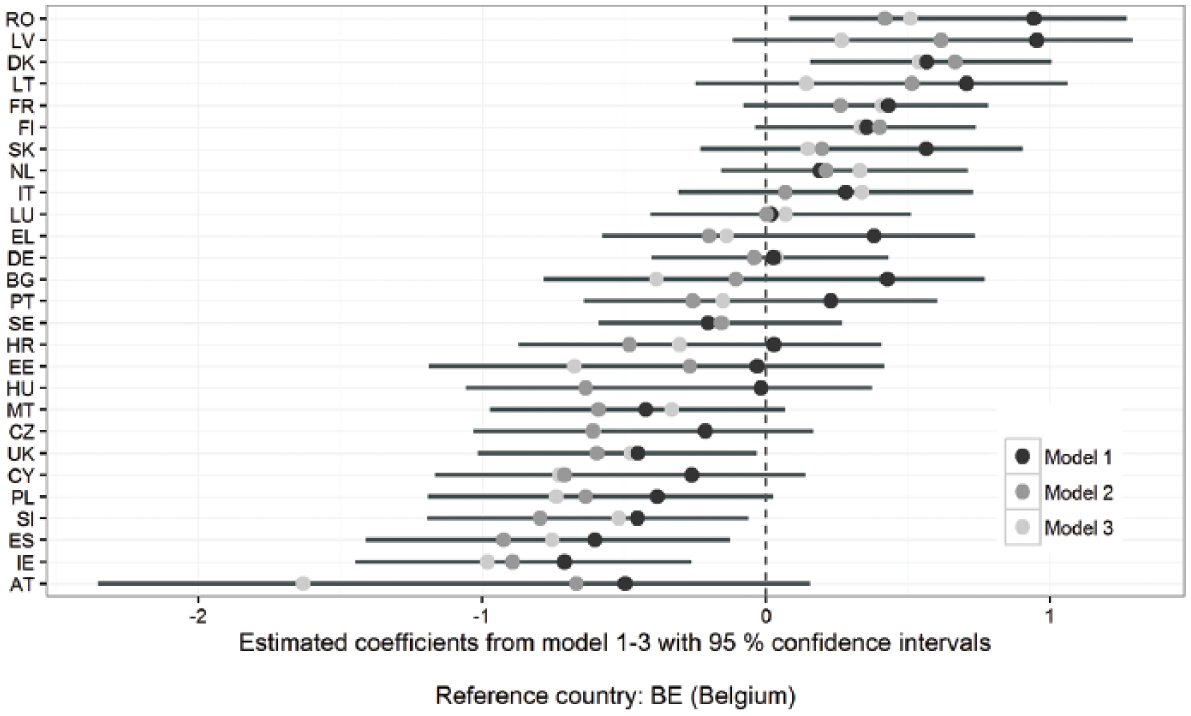
Country coefficients from logistic regression models.
The model quality also indicates that there is still some unexplained variance in the rates. The predictive power of the model is fair, where up to two thirds of predicted violent cases actually were cases of violence in the dataset. The area under the curve (AUC) statistic of the receiver operating characteristics (ROC) reaches 0.77 for Model 3, which is not particularly high, especially when considering that it was estimated on the same data that were used to build the model (for the AUC statistics, 0.5 means that the independent variables have no predictive power and 1 would mean perfect predictive power). 6 In general, low predictive power is rather common for instruments used for risk analysis (of reassault) of IPV. Messing and Thaller (2013) compare the predictive power of several risk analysis instruments used for predicting reassault in cases of IPV—mainly from North America—showing similar or lower values to the AUC statistic. In addition, as mentioned before, the present analysis does not aim at fully predicting IPV but sets out to analyze the relationship of socioeconomic status, inequality in the relationship, and partner behavior on IPV.
What is important to highlight from the present analysis is the strong confirmation of the hypotheses related to partner behavior. When running the regression analysis (Model 3) separately for all the 28 EU Member States, the main factors, namely, violence outside the relationship and unequal say about household income, point in the same direction in all countries and yield significant coefficients for the majority of countries. 7 The same applies to alcohol abuse, with the exception of Germany, Denmark, and Estonia, where the coefficient is (close to) zero. Other factors, such as education, show different results across countries, which is partly explained by low sample sizes for different levels of education. However, these differences also indicate that the importance of educational level does vary to some extent. As this analysis mainly looked at the level for the EU as a whole, more research is needed to identify and explain potential differences across countries.
Conclusion
The analysis shows that many of the results from previous research on IPV hold true in the EU Member States. There is more IPV among couples with a lower income and where a woman has a lower educated partner—therefore confirming the tendency of higher prevalence of IPV among couples with lower socioeconomic status.
While reported differences in income between partners (i.e., partner earns more or less) does not show a consistent result, a woman who reports having less say about the family income is more likely to report cases of IPV. This result points to the higher importance of norm-related inequality compared with an actual unequal income situation with respect to IPV. Notwithstanding the problems that can be related to actual economic differences, a man’s dominant behavior in a relationship and patriarchal lifestyle appear to be the driving forces behind inequality-related IPV against women.
Moreover, a partner’s behavior in terms of getting drunk frequently and showing violent behavior outside the relationship also strongly points to the occurrence of IPV. Such behavior points to a certain understanding of gender relations and masculinity that is linked to IPV, often termed as a patriarchal, traditional, hegemonic, or dominant representation of masculinity.
The percentage of the population where a woman feels that she does not have an equal say about family income, reports a partner’s alcohol abuse, or indicates a partner’s violent behavior outside the family relates to less than one in 10 women in each of these cases when taken individually, and is much lower for all three at the same time (approximately 0.3%). Nevertheless, if these situations occur together, the risk of IPV—as indicated in the above model—increases considerably.
While future research should investigate the influences of these factors in more depth, by using different indicators for socioeconomic status, alongside male dominance and controlling behavior, and should further compare norm-related and actual inequalities, other factors need to be examined as well. As shown by other contributions to this volume, there are several other factors influencing violence against women, such as childhood experiences (see Till-Tentschert in this special issue) and the relationship of psychological violence and severity of violence (see Nevala in this special issue). Finally, differences across countries might be influenced by structural factors, most notably different legal frameworks and policies. These can be explored closely through more detailed country comparisons to identify policy frameworks that might influence the occurrence of violence. As discussed by Goodey in this special issue, empirical research and data are crucial to inform policies to address violence against women, where concrete steps can be taken to reduce violence against women in relationships.
Footnotes
Appendix
List taken from http://publications.europa.eu/code/en/en-370100.htm, countries in alphabetical order.
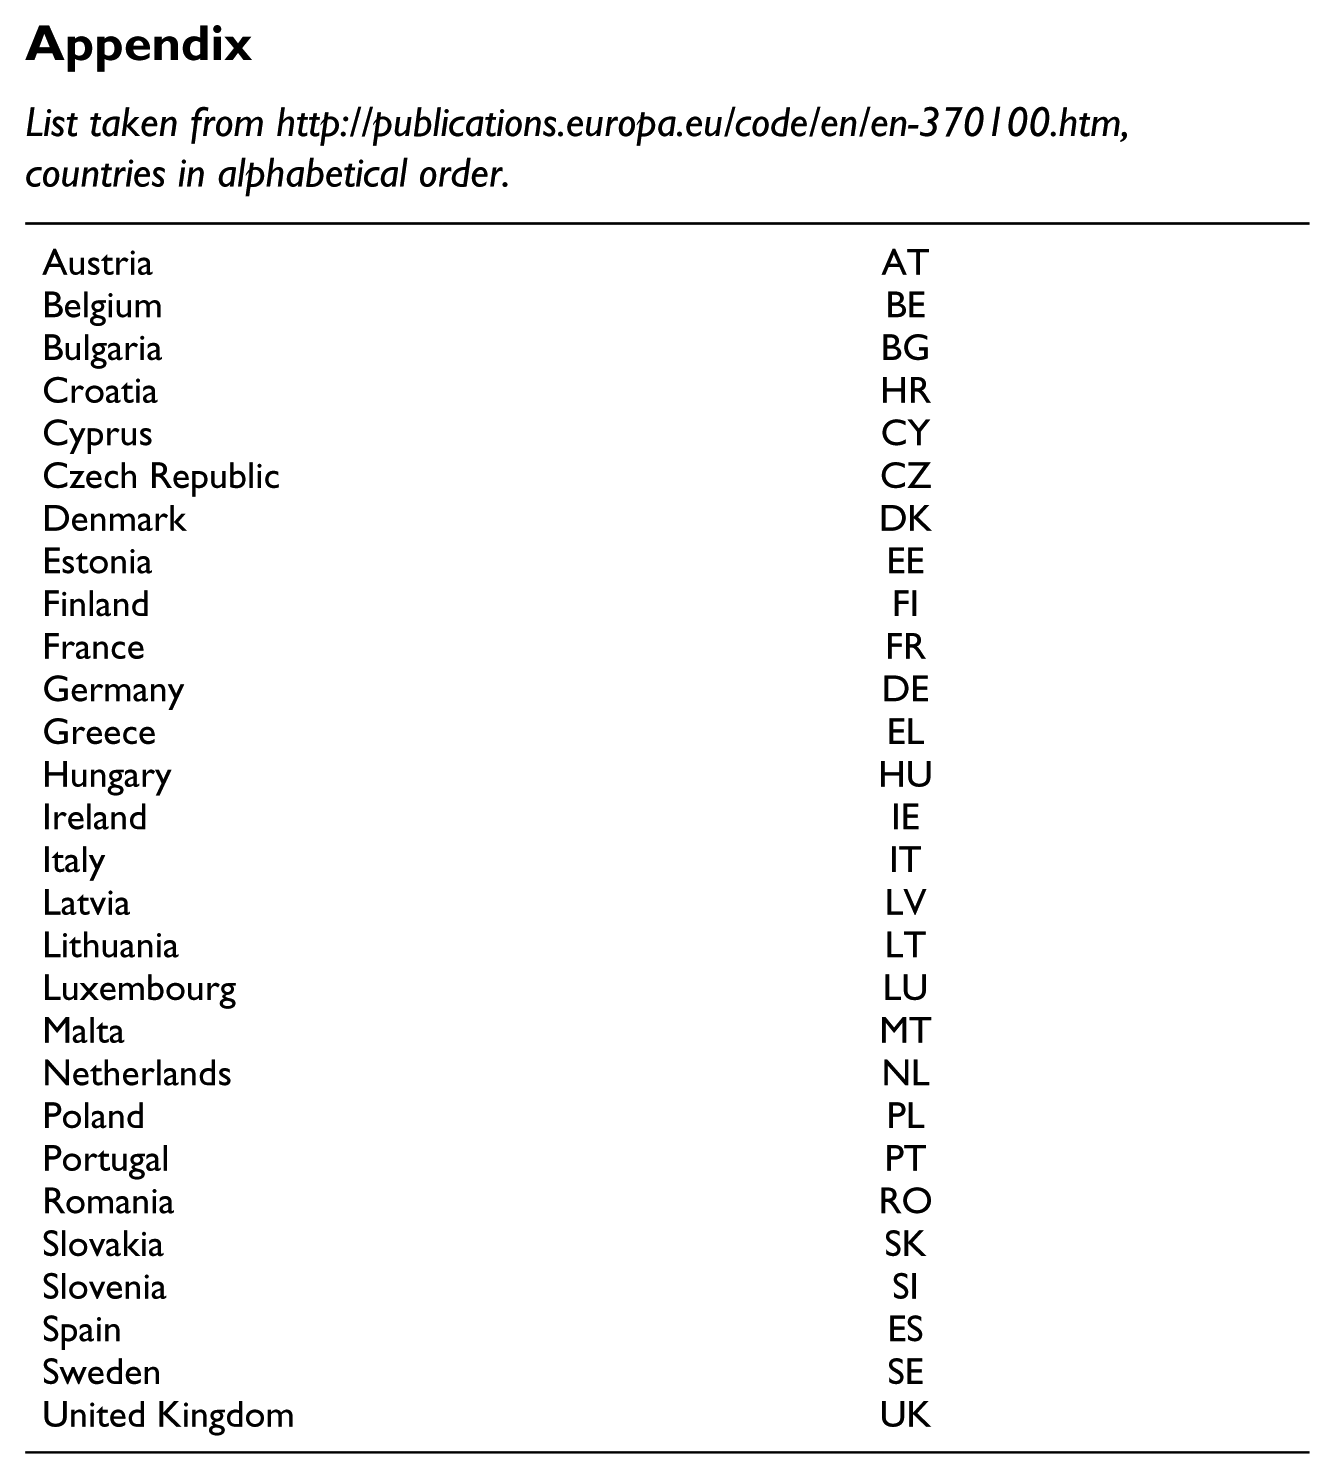
| Austria | AT |
| Belgium | BE |
| Bulgaria | BG |
| Croatia | HR |
| Cyprus | CY |
| Czech Republic | CZ |
| Denmark | DK |
| Estonia | EE |
| Finland | FI |
| France | FR |
| Germany | DE |
| Greece | EL |
| Hungary | HU |
| Ireland | IE |
| Italy | IT |
| Latvia | LV |
| Lithuania | LT |
| Luxembourg | LU |
| Malta | MT |
| Netherlands | NL |
| Poland | PL |
| Portugal | PT |
| Romania | RO |
| Slovakia | SK |
| Slovenia | SI |
| Spain | ES |
| Sweden | SE |
| United Kingdom | UK |
Author’s Note
Researchers are encouraged to work with FRA’s violence against women survey dataset, which can be accessed as follows: https://discover.ukdataservice.ac.uk/catalogue/?sn=7730&type=Data%20catalogue – or by contacting the Fundamental Rights Agency at
Declaration of Conflicting Interests
The author(s) declared no potential conflicts of interest with respect to the research, authorship, and/or publication of this article.
Disclaimer
The views expressed in this article are solely those of the author and do not necessarily reflect the views or position of the European Union Agency for Fundamental Rights.
Funding
The author(s) received no financial support for the research, authorship, and/or publication of this article.