
Abstract
Interpersonal crimes such as aggravated assault greatly impacts upon an individuals’ sense of personal safety and security as the crime results in a physical injury. Understanding where and when aggravated assaults are most likely to occur is therefore vital to minimize the victimization risk associated with this crime. The main aim of this study is to explore the relative importance of space and time in aggravated assault victimization. This was done using national level aggravated assault data (2008-2010) obtained from New Zealand Police and census data from Statistics New Zealand. Both the spatial and temporal distribution of aggravated assault are outlined to examine their association with aggravated assault victimization. Aggravated assault is found to cluster in space but not in time. The relationships between aggravated assault risk in space and time and a suite of social, economic, and lifestyle variables was then examined. A clear socioeconomic gradient was found between aggravated assault risk by space and all neighborhood characteristics with high-risk neighborhoods having greater residential mobility and ethnic/racial diversity, as well as being more deprived, having higher rates of unemployment, and lower median household incomes. No clear pattern emerged between aggravated assault by time and the selected neighborhood characteristics. The policy implications of these findings in terms of policing and diversity conclude.
Introduction
“I was at the wrong place at the wrong time” is a coin of phrase commonly used by individuals to describe and/or somehow justify personal criminal victimization. The implication being that had the individual been at the ostensible right place at the right time, the risk of victimization would have been lower or the individual would not have been a victim at all. But what constitutes “high” and “low” risk in terms of space and time? In this national study, the importance of space and time in understanding aggravated assault victimization is explored. This is done by analyzing the spatial and temporal distribution of all incidences of aggravated assault committed in New Zealand from 2008 to 2010 and examining the association between places and times stratified by high-to-low risk across a range of social, economic, and “lifestyle” variables. The rest of the article proceeds as follows. First, the more popular theories that have been used to explain the role that space and time play in criminal victimization are outlined. While the main focus of this work is on aggravated assault victimization, these theories provide an important broad theoretical framework by which to understand criminal victimization in general. It is emphasized that the review provided here is not exhaustive but rather a brief historical overview of key theories and contemporary debates. Second, the data and methodology used in the study are described and outlined. The results follow and a discussion of the limitations and strengths of the study concludes.
Theoretical and Literature Review
Sampson and Lauritsen (1994) provided an exhaustive review of the three main factors linked to violent interpersonal victimization and offending: individual, community, and situational. The community-level factor has an explicit spatial component in that it aims to identify what it is about neighborhood structures that produces differential rates of violent crime. For example, households with adverse economic characteristics consistently experience an overwhelmingly greater proportion of violent victimization. The situational-level factor has a tacit temporal factor in that it refers to those factors that influence the initiation or outcome of a violent event, of which time is crucial. Collectively, all three factors are causally related to violent victimization as they represent different levels of risk. From the individual through to the situation level, there are factors that increase the likelihood of victimization. Understanding the often neglected role of space and time in terms of these three factors is key to explaining violent victimization. In this section, we explore the importance of both the spatial and temporal components in the commission of aggravated assault. Although we are weary of conflating crime rates with victimization rates in undertaking this review, there is significant overlap in the theory and literature that examines these phenomena.
Crime and Space
It is largely accepted that space is one of the cornerstones essential to understanding crime and criminality (Ratcliffe, 2010). It was scholars from the Chicago School (at the University of Chicago’s sociology department) in the early 20th century who first proposed that geography affected neighborhood order. The main outcome of their work was the now well-known social disorganization theory of Shaw and McKay (1942). According to the theory, neighborhoods with high levels of economic deprivation, racial heterogeneity, residential mobility, and family disruption experience more crime and disorder than other neighborhoods. Adding to the theory, Sampson and Groves (1989) later suggested that these various community-level structural factors are mediated by informal social control, loosely defined as the willingness of neighborhood residents to intervene in local problems (Sampson & Raudenbush, 1999).
It was, however, the emergence of environmental criminology in the 1980s that “formalized” the important role of place in the criminological literature. In their seminal work “Environmental Criminology,” Brantingham and Brantingham (1981) suggested that any crime comprised four dimensions: the law, the offenders, the target, and the place. Importantly, the place is not simply a spatial location but is a setting at which the other three dimensions of crime intersect and a criminal event occurs. Three main theoretical perspectives housed within the school of environmental criminology play a central role in understanding the relationship between crime and place: the routine activities theory (Cohen & Felson, 1979), rational choice theory (Cornish & Clarke, 1986), and crime pattern theory (Brantingham & Brantingham, 1991). Although inherently different, the general premise of these theoretical frameworks are the same in that they attempt to spatially link offenders with crime opportunities. The main aim of these and other spatial theories of crime are essentially to identify what makes a place at an increased risk of criminal victimization.
Studies of crime and space have largely been based on these theoretical perspectives with researchers quick to integrate additional dimensions to these spatial crime theories (see, for example, Bursik & Grasmick, 1993; Sampson & Groves, 1989) and introduce various methodological innovations to allow for more thorough and rigorous testing of the theory’s propositions (see, for example, Morenoff & Sampson, 1997; Sampson, Raudenbush, & Earls, 1997), with varying degrees of success. In terms of scale, spatial studies of crime have taken place at increasingly smaller levels of spatial aggregation, the finest being the street segment where researchers have examined how the configuration (Davies & Johnson, 2015), permeability (L. Wu etal., 2015), and sociodemographic character (Weisburd, Groff, & Yang, 2012) of street segments increase the risk of various types of criminal victimization. At a broader level, a plethora of studies have explored the causes of variation in crime rates using spatial data with the “neighborhood” as a unit of analysis. In these studies, the “neighborhood” is an administratively defined spatial boundary such as a census tract, suburb, sub-place, census areal unit (CAU), or some other arbitrary measure depending on the geographical focus area under investigation. As anticipated by environmental criminology theory, the general consensus of this literature is that the spatial distribution of crime is largely a consequence of various endogenous factors such as concentrated deprivation and disadvantage (Andresen, 2006; Boyle & Hassett-Walker, 2008), racial/ethnic group inequality (Hipp, 2007), residential mobility (Breetzke & Horn, 2006), segregation (Krivo etal., 2015), and collective efficacy (B. Wu, 2009). The latter refers to the ability of communities to orientate themselves toward achieving a certain shared objective as well as a willingness to intervene on behalf of the common good (Sampson etal., 1997). Related to this work, researchers have also found how various other characteristics of the built and physical environment within neighborhoods affect crime risk. These include public transport systems (Qin & Liu, 2016), sexually orientated businesses (McCord & Tewksbury, 2013), alcohol outlets (Waller etal., 2012), and even the slope and altitude of the landscape (Breetzke, 2012).
Crime and Time
The temporal analysis of crime has lagged behind spatial considerations in crime analysis despite time being an important component in the understanding of criminal victimization. This is largely due to the difficulty in accurately recording the exact time at which a criminal incident takes place. Although mainly an issue for property crime and less for interpersonal crime, a number of researchers have attempted to address this problem, including Ratcliffe and McCullagh (1998) and Townsley, Homel, and Chaseling (2000), who used the midpoint halfway between the possible start and end date and time to assign a single temporal point to a criminal event. A more complex technique developed by Ratcliffe (2002) also used police start and end crime times but uses aoristic analysis to generate a crime occurrence probability at any given time. Knowing the exact time that a criminal incident took place is important in crime analysis because it allows law enforcement agencies to adequately develop temporally targeted crime prevention policies and implement suitable prevention practices operationally, tactically, and strategically.
Most previous temporal crime research has sought to identify periods of time during which the risk of victimization for certain types of crimes is greatest. Similar to the discussion on crime and space above, studies have occurred at increasingly finer levels of temporal resolution. At the finest temporal level, researchers have conducted hour-by-hour temporal analysis of crime which allows variation during the course of the day and night to be observed. This limited literature has found that property crime such as robbery generally peaks in the late afternoon and early evening (Felson & Poulsen, 2003), whereas interpersonal crimes such as assault have found to concentrate in the late evening and early morning (Breetzke, 2015; Harries, 1989). The identification of temporal patterns of crime at broader levels of granularity (daily, monthly, seasonal) has dovetailed somewhat with crime seasonality research. In this type of research, temporal variations of crime are used to test climatic influences of crime patterns (see, for example, Kaplan, 1960; Lewis & Alford, 1975). Cycles of crime by time are combined with various meteorological parameters such as rainfall, humidity, and wind speed, among many others, to assess and predict their impact on crime victimization. In this context, Rotton and Cohn (2000) found aggravated assault to be an inverted U-shaped function of temperature. That is, aggravated assault increased as temperature increased but decreased when temperatures got too high. This curvilinear relationship was found to be dominant during daylight hours and spring months. Finally, at the broadest temporal resolution, crime can be examined annually, biannually, decadally, and significant patterns and fluctuations identified and analyzed.
While the spatial dimension to crime has received much theoretical attention in recent years, theoretical aspects pertaining to the temporal patterns of offender behavior have been far less forthcoming. One notable contribution in this regard, however, is the work of Ratcliffe (2006) who developed a temporal constraint theory to understand temporal patterns of offender spatial behavior. Drawing on Miller’s (2005) time measurement theory, Ratcliffe explored the criminological implications of temporal constraints as a mechanism to explain a number of key concepts within environmental criminology. Ratcliffe theorized how temporal constraints, in conjunction with the locations of offender nodes, are a major determinant in spatio-temporal patterns of property crime. Although numerous studies utilize Ratcliffe’s theory, sadly, none extend or attempt to build on his work or indeed provide any further theoretical explication of the linkage between time and crime.
The notion explicit in all this work is that there is a space and a time when the risk of being a victim of crime is elevated. Surprisingly, few very studies have examined the space and time risk associated with aggravated assault. In fact, to our knowledge, this is the first empirical examination of space and time—and factors associated with space and time—on aggravated assault victimization, and certainly the first of its kind at a national scale.
The Current Study
The main aim of this study is to explore the role of space and time in aggravated assault victimization. In achieving this aim, the study will extend the literature on this topic is in a number of ways. First, the relative importance of space and time are examined in terms of aggravated assault victimization. Most previous research examining the correlates of violent victimization neglect to examine the temporal aspect related to this type of victimization. In this study, we explore and contrast the relative importance of each of these aspects. Second, unique social, economic, and lifestyle characteristics associated with high-to-low risk places and times are outlined. Third, an important international comparison with the existing United States and Eurocentric notions of the importance of place and time in aggravated assault victimization is provided. This is important in terms of establishing a frame of reference for future studies of this nature conducted outside the United States and Europe. Ratcliffe (2010) noted that the most underresearched area of spatial criminology lies in spatial and temporal crime patterning, and prediction. This article aims to provide a better understanding of the unique yet interdependent role that both factors play in this regard.
Based on the criminological literature, two hypotheses are tested regarding aggravated assault victimization in New Zealand. The first hypothesis states that aggravated assault will cluster and will be more prominent in more socially disorganized neighborhoods. Disorganized neighborhoods struggle to supervise and control teenage peer groups—especially gangs (Sampson & Groves, 1989)—and this decrease in social control can lead to greater interpersonal crimes (Thrasher, 1963). The second hypothesis asserts that a disproportionate number of aggravated assaults will occur in the evenings. Nighttime activities can be considered to be a direct measure of lifestyle in that these activities typically occur away from the home and are assumed to result in increased contact with potential offenders. Previous victimization research has shown how the extent of nighttime activity significantly and positively influences an individuals’ risk of violent victimization (Miethe, Stafford, & Long, 1987).
Data and Method
Crime Data
The data used to measure aggravated assault in New Zealand was obtained from New Zealand Police. The national dataset included the location (easting, northing), date, time, as well as a unique code for each aggravated assault incident for the years 2008 to 2010. A total of 13,287 1 aggravated assaults were committed in New Zealand over the 3-year study period. Aggravated assault was defined based on the Australian and New Zealand Standard Offence Classification’s (ANZSOC; 2011) description. According to ANZSOC, aggravated assault is, “The direct (and immediate/confrontational) infliction of force, injury or violence upon a person or persons resulting in an injury” (p. 29). The aggravated assault data were aggregated to the CAU level and a mean annual rate per 1,000 population was used as the measure of aggravated assault. A CAU is the second smallest unit of dissemination of census data in New Zealand, with each CAU representing approximately 2,300 people.
There were a total of 2004 CAUs covering the whole country, but 155 neighborhoods had a low number of residents (<50) and these were excluded in the analysis. Statistics New Zealand prohibits the dissemination of census data in CAUs with low population numbers.
Census Data
A total of nine neighborhood-level variables were created or extracted from Statistics New Zealand census data of 2013 to understand the underlying factors associated with aggravated assault in New Zealand. These nine variables were split into three broad neighborhood categories: social, economic, and “lifestyle.” The latter category of variables are included to assess the possible impact of “lifestyle”—in an aggregated form—on aggravated assault victimization. An individuals’ lifestyle is considered one of the most important factors underlying their risk of violent victimization (Sampson & Lauritsen, 1994). In this context, an individuals’ lifestyle is a measure of the likelihood of coming into contact with risky or dangerous persons or places. Most previous research identifying “lifestyle” correlates on violent victimization has focused on factors that increase the likelihood of individuals coming into contact with members of groups that contain a disproportionate share of offenders such as gangs (J. Wu & Pyrooz, 2016) or on other demographic, cultural, and psychological factors, most notably sexual orientation (L. M. Johnson, Matthews, & Napper, 2016). Other measures or proxies for lifestyle include gambling outlets (Breetzke & Pearson, 2015) and fast food restaurants (Pearce, Blakely, Witten, & Bartie, 2007). In this study, these factors are expanded to investigate whether aggregated measures related to alcohol and smoking are possible correlates with aggravated assault victimization.
The variables selected within each category are loosely informed by the social disorganization theory outlined earlier although it is emphasized that this study is not a test of this theoretical framework. Rather, the emphasis here is on selecting theoretically informed variables which have universally been found to be associated with increased assault risk in neighborhoods. All variables were calculated at the CAU level of aggregation.
The three social variables include the percentage of residents renting, the percentage of residents residing in the neighborhood for less than 5 years, and a diversity index (DI). The first two social variables were selected as a measure of residential mobility. Residential mobility can be traditionally associated with collective efficacy and neighborhood cohesion as there are relatively few opportunities for neighborhood residents to form bonds and integrate in highly mobile neighborhoods (Bernasco & Nieuwbeerta, 2005). Similar to collective efficacy, neighborhood social cohesion in this instance refers to the trusting network of relationships and shared values and norms of residents in a neighborhood. The DI (see Meyer & McIntosh, 1992) was calculated to provide a measure of racial and ethnic diversity within a CAU. The DI measures the probability that any two people chosen at random from a given CAU are of different races or ethnicities, and is measured on a scale of 0 to 100, with 0 indicating that a CAU is totally homogeneous and 100 stating a CAU is totally heterogeneous. The DI is frequently been used in population studies (see K. Johnson & Lichter, 2010; Tam & Bassett, 2004) and is calculated as,

where E is the proportion European, M is the proportion Māori, A is the proportion Asian, P is the proportion Pacifica, and MELAA is the proportion Middle Eastern/Latin American/African populations. The DI was then multiplied by 100 to deal in whole numbers, rather than decimals.
The economic variables include NZDep, which is a score calculated as a means of describing the deprivation within an administrative area. The score combines nine variables from the New Zealand census which reflect eight dimensions of deprivation, including access to transport and communication services, home characteristics, and education—the higher the score the higher the deprivation. 2 Median household income and percentage unemployed are universal indicators of neighborhood level affluence previously shown to be associated with assault rates both in New Zealand and internationally (see Breetzke & Cohn, 2012; Newbold, 2009). For information about the construction of the NZDep measure, see Atkinson, Salmond, and Crampton (2014).
Finally, the lifestyle variables included the percentage of residents who smoke and the total number of alcohol outlets (both on and off license) per 1,000 residents within a CAU. The trading names and addresses of premises licensed (as at July 2008) to sell liquor in New Zealand were provided by the Liquor Licensing Authority which has statutory authority to collect licensing information. Licensed premises with on and off license types were included in the analysis. There is some international evidence that neighborhoods with an increased number of smokers have increased rates of crime (Virtanen etal., 2007), while there is a well-known strong and positive relationship between the presence of alcohol outlets and interpersonal crime both internationally (see Gyimah-Brempong, 2001; Lipton & Gruenewald, 2002) and in New Zealand (see Day, Breetzke, Kingham, & Campbell, 2012).
Analysis of Aggravated Assault and Space
To examine the strength of the association between space and aggravated assault victimization, a quintile map of neighborhood level aggravated assault was first created. Rates of aggravated assault per CAU were calculated, ranked, and classed into quintiles of low (1) to high (5) assault; all five quintile groups had 370 CAUs except for one group which had 369 CAUs. Neighborhoods in Quintile 1 (Q1) can be considered low-risk neighborhoods (mean rate per CAU = 0.02 assaults per 1,000), whereas neighborhoods in Quintile 5 (Q5) can be considered high-risk neighborhoods (mean rate per CAU = 11.31 assaults per 1,000).
The mean value for each social, economic and “lifestyle” variable per quintile group was then calculated and Spearman’s rank correlation coefficient was used to determine whether the quintile groups (ranked from low to high) differed per variable. So, for example, the mean unemployment rate was calculated for each quintile group (from low-risk to high-risk neighborhoods) and a correlational analysis undertaken to determine whether there was any association between unemployment rates in neighborhoods ranked from low to high rates in terms of aggravated assault victimization.
Analysis of Aggravated Assault and Time
To examine the strength of the association between time and aggravated assault victimization, a quintile map of point aggravated assault was created. The number of aggravated assault incidents per hour was calculated, ranked, and categorized into quintiles of low (1) to high (5) assault; each period was 288 min. Assaults in Q1 occurred mainly between 4:00 a.m. and 8:00 a.m. and can be considered assaults committed at a low-risk time (mean number of assaults per minute = 1.31), while assaults in Q5 occurred mainly between 22:00 p.m. and 2:00 a.m. and can be considered assaults committed at a high-risk time (mean number of assaults per minute = 4.61).
Again, the mean value for each social, economic, and “lifestyle” variable per quintile group was calculated and Spearman’s rank correlation coefficient was used to determine whether the quintile groups (ranked from low to high) differed per variable in terms of time. As outlined, a similar quintile method was used to examine the strength of the association of both space and time in aggravated assault victimization. This was done to compare the relative risk of victimization in terms of both space and time. Quintile categorizations were used as it adds statistical power to the analysis and allows for meaningful comparisons to be made between categories.
Results
Aggravated Assault and Space
Figure 1 shows the spatial distribution of aggravated assault nationally and within major cities of New Zealand. The most high-risk areas for aggravated assault are in areas in the east, central, and northern areas of the North Island. Each of the major cities in New Zealand has a fairly even spatial distribution of high-risk areas. A Moran’s I value calculated for the country was 0.21 (p < 0.001, k-nearest neighbor = 5) indicating significant global spatial clustering of aggravated assault by space.
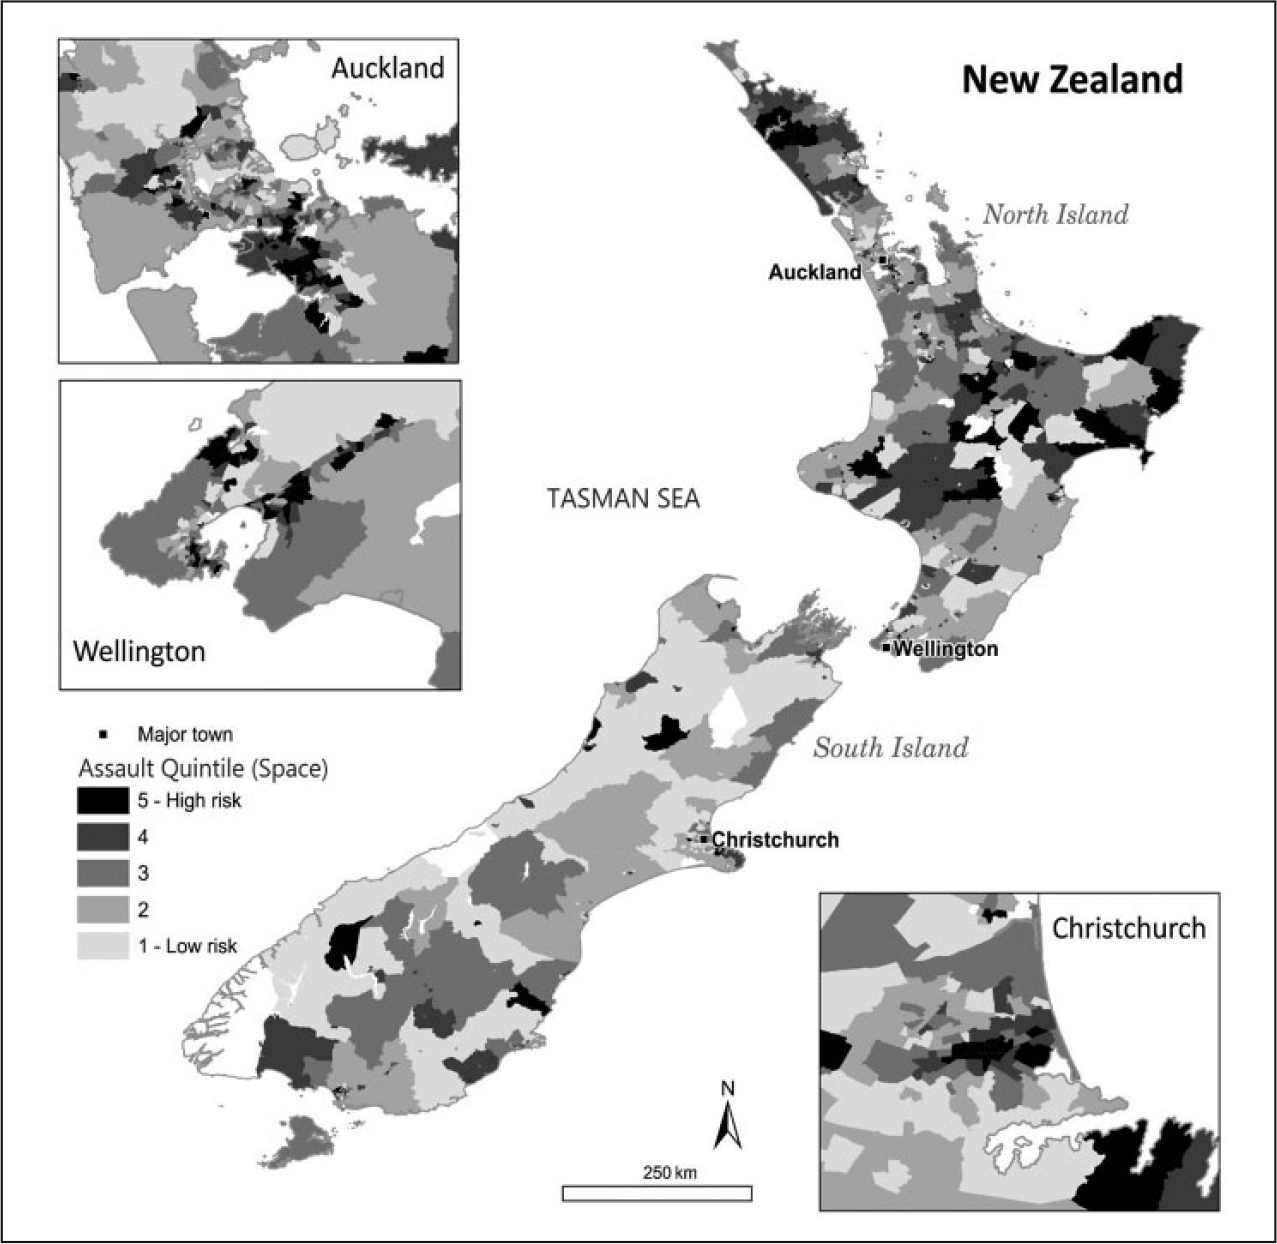
Quintile map of aggravated assault in New Zealand by neighborhood.
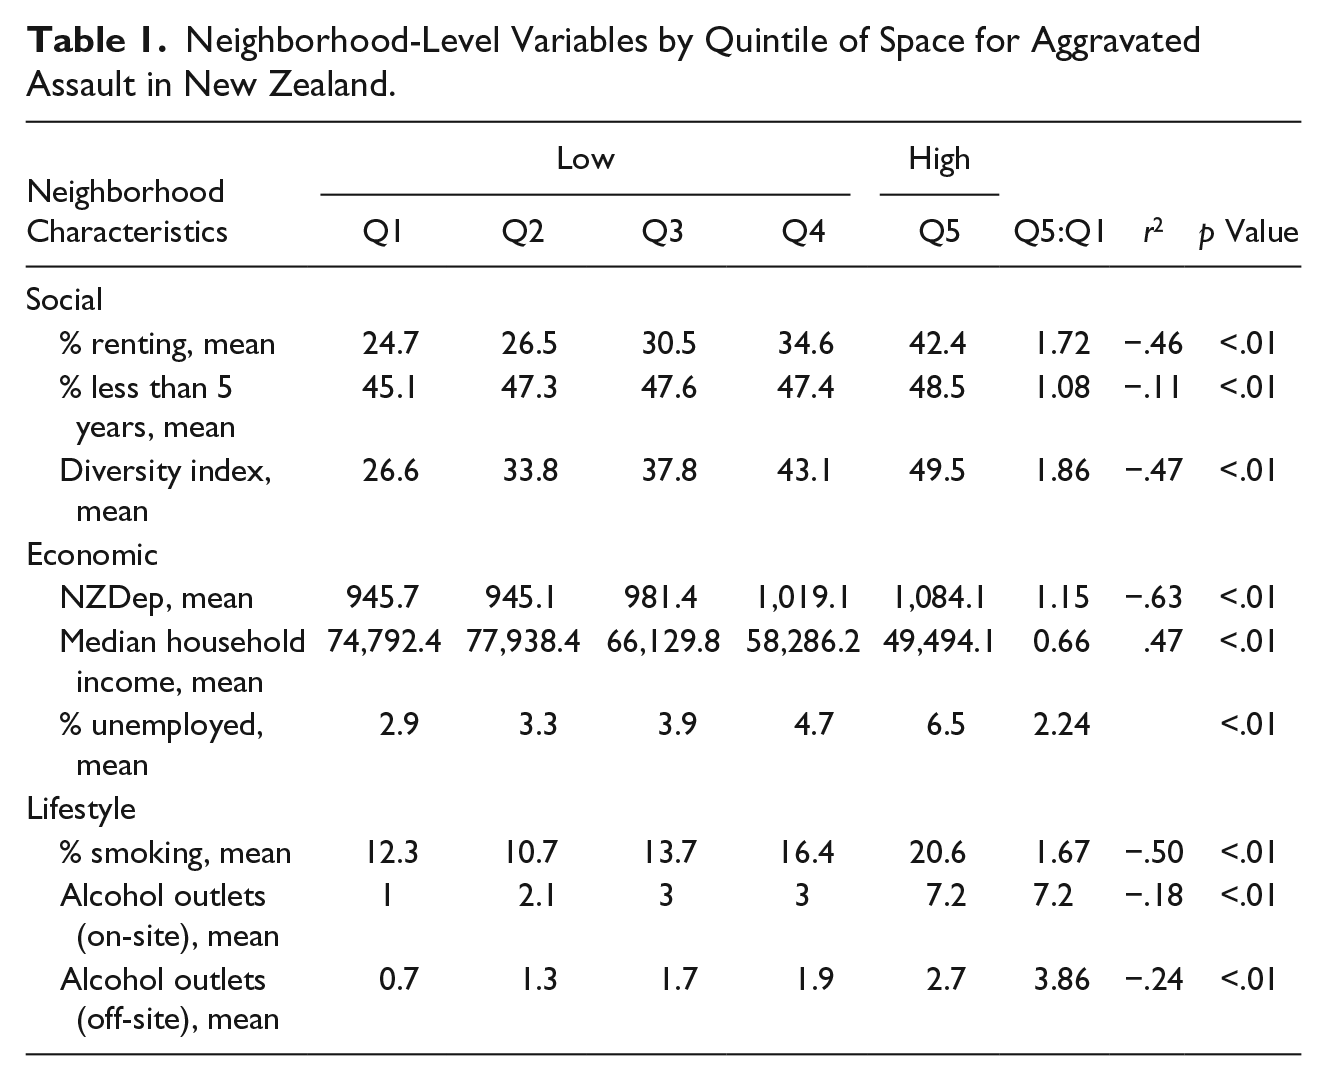
A clear gradient emerges between the quintiles of aggravated assault by space and all neighborhood characteristics (see Table 1). High-risk neighborhoods (Q5) for aggravated assault in New Zealand can be characterized as having greater residential mobility and ethnic/racial diversity. From an economic perspective, high-risk neighborhoods are more deprived, and have higher rates of unemployment and lower median household income. In terms of lifestyle, high-risk neighborhoods have more smokers and significantly greater rates of on-site and off-site alcohol outlets. In fact, this last finding is the most notable as high-risk neighborhoods were found to have more than 7 times the rate of on-site alcohol outlets than low-risk neighborhoods. Overall, these findings suggest high levels of concentrated disadvantage and aggravated assault occurring within certain CAUs in New Zealand. All Spearman’s rank correlation coefficients were significant and modest.
Neighborhood-Level Variables by Quintile of Space for Aggravated Assault in New Zealand.
Aggravated assault and time
Figure 2 shows the spatial distribution of aggravated assault nationally and within major cities of New Zealand by quintile of time. Aggravated assault in New Zealand that occurred at high-risk times (Q5) are evenly located nationally; at the city level, however, more incidents of aggravated assault are committed at high-risk times in the center of cities rather than in the surrounding neighborhoods. This could be a reflection of the large number of entertainment establishments which are commonly located in city centers of New Zealand and are open during these high-risk hours. A Moran’s I value calculated for the country was 0.06 (p < .15, k-nearest neighbor = 5), indicating no significant global spatial clustering of aggravated assault by time.
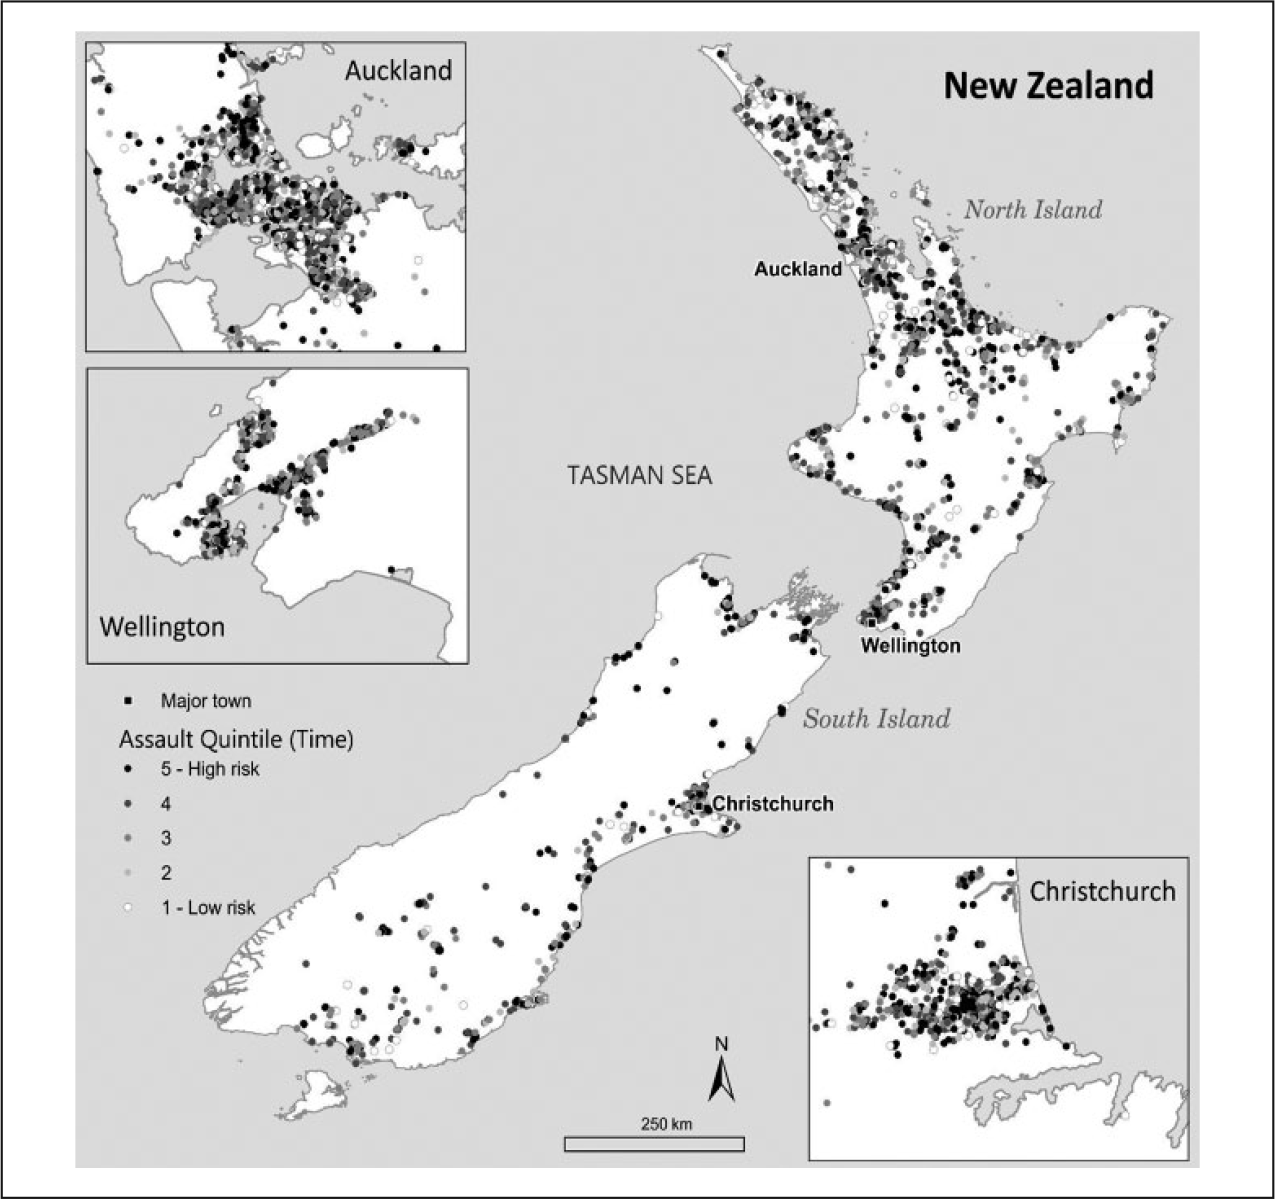
Quintile map of aggravated assault in New Zealand by time.
In contrast to the results above, no clear pattern emerges between the quintiles of aggravated assault by time and the selected neighborhood characteristics (see Table 2). This is reflected in the nonsignificant Spearman’s rank correlation coefficients for all but two variables (the DI and the percent unemployed). That is, there is no substantive difference in the types of neighborhood by time of aggravated assault. Assaults committed at high-risk times are located in neighborhoods which are broadly similar to neighborhoods in which aggravated assaults are committed at low-risk times or any other times.
Neighborhood-Level Variables by Quintile of Time for Aggravated Assault in New Zealand.
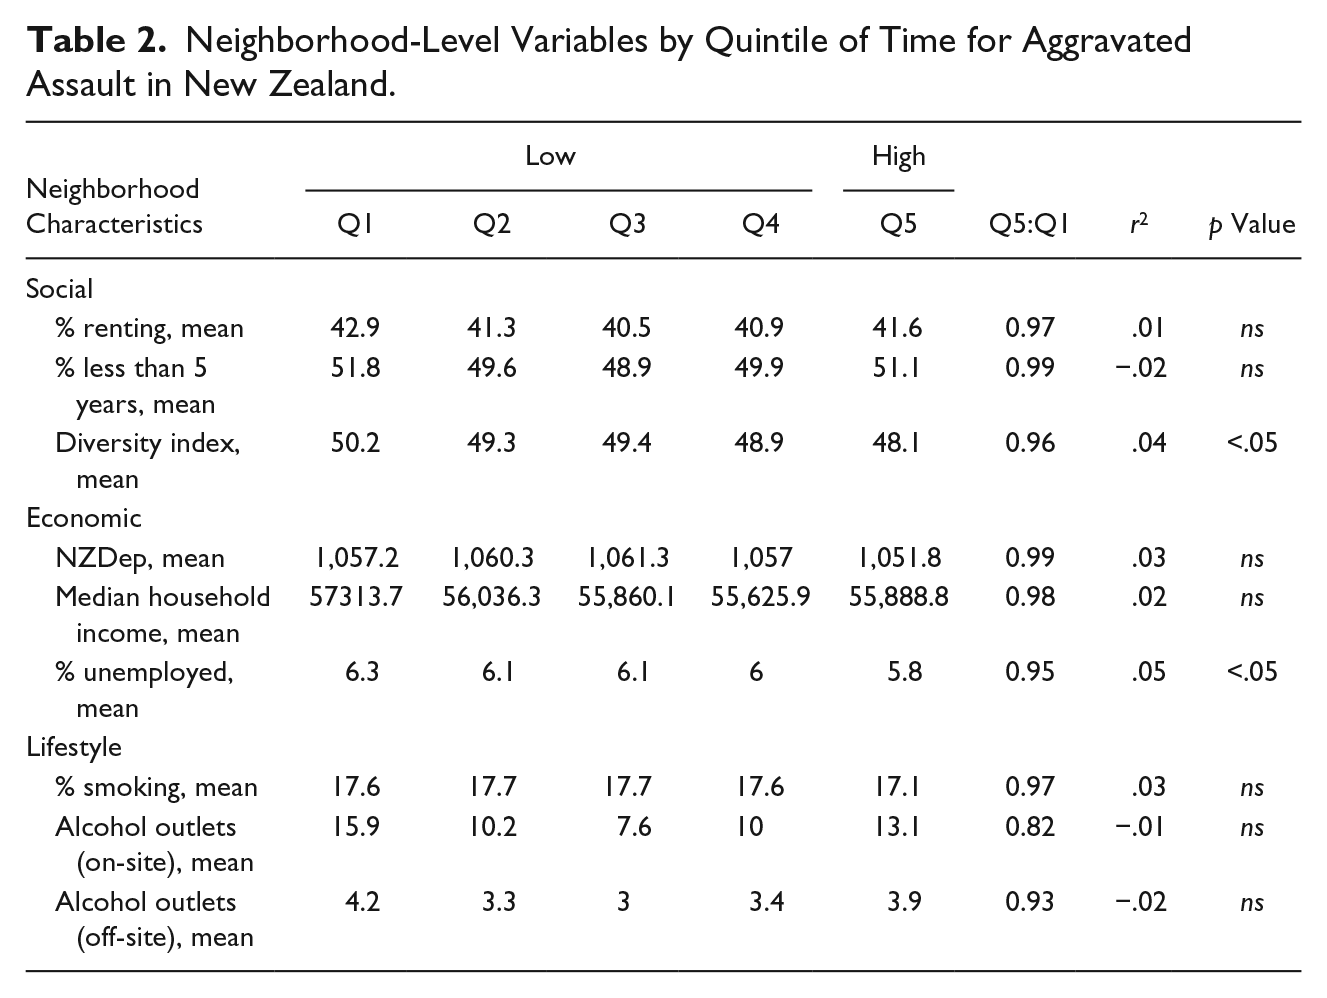
For the social variables, only the DI variable exhibits a notable relationship from low to high risk in terms of time. Similarly, only the percent unemployed among the economic variables exhibited any notable relationship, with assaults committed in high-risk times (Q5) being committed in neighborhoods with greater unemployment. No relationships were found to be significant with any of the three lifestyle neighborhood characteristics.
Discussion
The initial results of this study support a number of well-known theoretical frameworks housed within the school of environmental criminology in that the majority of aggravated assault incidents in New Zealand occur in more deprived, residentially unstable, and ethnically heterogeneous neighborhoods. As a result, some initial support is found for our first hypothesis that aggravated assault will be more prominent in more socially disorganized neighborhoods. While aggravated assault rates in New Zealand appear to be associated with socioeconomic factors, the big discrepancy in alcohol outlets by space suggests the built environment may also have an important role to play. Of course the correlational analysis used in this study carries no assumption as to causality, and a causal relationship cannot therefore be presumed between the selected variables although there is certainly evidence of an association. In terms of time, the greatest risk of aggravated assault victimization in New Zealand occurs during the late evening and early morning. These findings support our second hypothesis that a disproportionate number of aggravated assaults will occur in the evenings. Interestingly, regardless of the time of aggravated assault, all incidents occur in similar types of neighborhoods although two moderately significant associations were found with assaults in high-risk times being committed in neighborhoods with less diversity and greater unemployment. Possible explanations for these associations are speculative but it could be that these variables have an additional disorganizing effect on neighborhoods during certain high-risk times. The percent unemployed in particular has been commonly associated with increased risk of violent victimization (see U.S. Department of Justice, 1989); the findings of this study suggest that this relationship may be time dependent at the neighborhood level, although future research is warranted.
Finally, one would possibly expect aggravated assault committed during high-risk times to be committed in less affluent neighborhoods and/or in neighborhoods with higher rates of alcohol outlets, but this was not found to be the case. As discussed, with the exception of the DI and unemployment, the type of neighborhood has little bearing of the timing of aggravated assault. No significant differences were found across almost all neighborhood-level variables by quintile of time for aggravated assault in New Zealand.
So, what are the policy implications of these findings in terms of policing and diversity? Of course, both space and time are important considerations guiding the deployment of often limited policing resources. Although this research is admittedly exploratory, the results generated may help to inform interpersonal crime prevention policies at three levels: operational, tactical, and strategic. At the operational level, policy directives should be aimed toward assisting operational personnel in identifying specific and immediate aggravated assault spatial and temporal trends, and patterns, and also in providing investigative leads. Knowing, for example, that 80% of aggravated assaults occurred in 32% of neighborhoods can inform a number of operational actions that are undertaken by law enforcement agencies. For example, vehicle and foot patrols could be ramped up in high-risk spaces and times; similarly, stop-and-frisk operations could also be increased and/or better targeted should periodic peaks in space and time be identified.
At the tactical level, directives should involve an evaluation of information and factors directly relevant to police actions aimed at crime detection and the prevention of aggravated assaults. Furthermore, these directives should be aimed at the identification of specific and immediate aggravated assault tendencies in space and time. The intelligence garnered from knowing that aggravated assault concentrates more in space than in time can be used to guide operational policing units to specific locations and individuals linked to criminal activities regardless of the time, potentially leading to the arrest of suspects and suspicious persons. In the context of this study, knowing when aggravated assault increases significantly can result in specialized units being deployed in high-risk areas and/or known crime attractors and generators within the city.
Last, from a strategic perspective, it is New Zealand Police (under the auspices of the New Zealand government) who aim to address the underlying “root” causes of interpersonal crime in the country. New Zealand Police and other role players who are responsible for specifically addressing these long-term solutions to interpersonal crime can utilize the understanding of the neighborhood characteristics found to be associated with increased aggravated assault victimization to measure ways to address them. This will most likely involve exploring aggravated assault at finer spatial scales and possibly at finer temporal levels in an attempt to outline geographically targeted longer term strategies.
Importantly, these crime prevention policies should not be uniformly applied across the country but should rather be adapted based on the diversity inherent in neighborhoods. In this work, we found that neighborhoods at a high risk of aggravated assault were the most diverse in terms of race and/or ethnicity. From a temporal perspective, the DI was one of only two variables that exhibited a notably significant relationship with assault from low to high risk with assaults committed in low-risk times being committed in more diverse neighborhoods, although the differences are slight. It is, therefore, increasingly clear that the racial and/or ethnic composition of neighborhoods have an association with aggravated assault victimization in New Zealand, and crime prevention policies at these three levels should be cognizant of the racial and/or ethnic makeup of neighborhoods upon their implementation. Māori, the indigenous population of New Zealand, are the largest ethnic minority group in the country (14%) and are also grossly overrepresented at all three stages of the criminal justice process in New Zealand: apprehension, prosecution, and conviction (Statistics New Zealand, 2016). This group is therefore more likely be both victims and perpetrators of assault. In fact, Māori are greatly overrepresented in our data as almost 48% (n = 6,381) of victims of aggravated assault over the study period were Māori. Current policing paradigms in New Zealand have previously been criticized for being partial toward White New Zealanders and pertinent to “Western” culture and protocol (Fergusson, Horwood, & Swain-Campbell, 2003; Gray, 2012; Maxwell, 2005). This drawback has particular relevance to Māori, whose philosophy of crime and justice differs considerably from Western frameworks (see Webb, 2003). Policing policies are therefore required that are sensitive to the unique to the historical, cultural, and social structural characteristics of Māori society regardless of the place and time of implementation.
Limitations and Strengths
Despite this work providing important insights into aggravated assault victimization, it has limitations. First, is the reliance on police data to gain a measure of aggravated assault victimization per CAU. Indeed, studies of victimization patterns and trends are generally based on data gathered from victims rather than police records. Moreover, the use of reported police data to measure crime has well-known limitations (see Herbert & Harries, 1986). Despite this, however, previous research has shown that using official police data usually produces results consistent with victimization surveys (see Byrne & Sampson, 1986; Ceccato & Dolmen, 2011; McDowall & Loftin, 1992). Besides, official records from the New Zealand Police represent the only official and spatial crime dataset available in the country by which to conduct a nationwide geographically representative study. The second limitation relates to the temporal classification of the aggravated assault data. This is a common problem in temporal crime research where the exact time of occurrence for an incident is often not known to the victim or to the police. This problem is, however, most pertinent for property crimes such as burglary where the police would typically report the burglary at the time the incident is reported; however, if the homeowner was away for any length of time, the time recorded would be prone to error. For interpersonal crime such as assault, however, both the offender and the victim are present at the offense, and, in some instances, the assault could be witnessed by the police or another person willing to contact the authorities or the crime is detected by a time-stamped closed circuit television system (CCTV). We are therefore reasonably confident that the data provided is temporally accurate and spatially replete. Third, is the method used to identify high- and low-risk spaces and times. In the analysis, we were interested in categorizing aggravated assault risk in terms of space and time without relying on a plethora of neighborhood variables, as is common in previous spatial crime research. The data-driven logic espoused in this study was the opposite. That is, neighborhoods with the most aggravated assault were categorized as high risk, and times during which the most aggravated assault are committed were categorized as high risk (i.e., Q5 in the study). Understanding why they are high and low risk was not relevant, at least not at that point in the study. Using quintiles of data is a well-utilized mechanism commonly used in criminology and crime analysis to measure crime concentrations and was therefore considered a viable option to use. Moreover, research by Andresen and Malleson (2011) and Weisburd (2015) showed that concentrations of crime at various levels of spatial aggregation remain relatively stable over time, which suggest that the use of quintiles used in this research provides an accurate and temporally relevant portrayal of aggravated assault in New Zealand. Finally, it is possible that other neighborhood characteristics, particularly in the built environment, could affect rates of aggravated assault. Factors such as the location of entertainment establishments (shopping malls, restaurants, bars), proximity to transportation routes, land-use and zoning, and traffic patterns could all have a potential role to play. The main focus of this study was, however, on identifying the underlying socioeconomic factors that may have an association with aggravated assault victimization. The results did show a strong gradient of socioeconomic neighborhood characteristics by neighborhoods stratified by low-to-high risk in terms of space but not time, validating our selection of variables. Of course, future research could use other factors in the built and/or urban environment to gain additional insight into the risk of aggravated assault victimization.
Offsetting these limitations, this study has a number of strengths. Most notably, the results gave unique insight into the association between space and time and aggravated assault victimization. While aggravated assault clustered in both space and time, aggravated assault was generally more dispersed temporally than skewed spatially. In addition, high-risk neighborhoods were found to be different from low-risk neighborhoods in terms of space, but similar in terms of time, having significant policy and policing implications. An additional methodological strength of this study is the use of official and spatially replete geocoded crime data. The data obtained was voluminous and exhaustive, which increased the statistical power of the analysis. A final additional strength of this study was the ability to loosely test the applicability of a certain well-established international spatial theory of crime in a New Zealand context. Although not the central aim of the work, the results did indicate that crime in the country is largely a consequence of several of the main tenets of the social disorganization theory, although more detailed analysis is certainly required. For these reasons, this study makes a significant contribution to the literature of interpersonal criminal victimization as well as to the growing literature that is developing methods to better understand the relationship between space, time, and interpersonal crime.
Footnotes
Acknowledgements
The author would like to thank New Zealand Police who provided crime data for this work. All support and guidance provided is greatly appreciated. The results presented here are the work and opinions of the author, and not of New Zealand Police.
Declaration of Conflicting Interests
The author(s) declared no potential conflicts of interest with respect to the research, authorship, and/or publication of this article.
Funding
The author(s) received no financial support for the research, authorship, and/or publication of this article.