
Abstract
Adolescents and young adults are the main perpetrators and victims of violence in almost all parts of the world. Theories of human behavior predict that the intention to behave violently is formed in part by the individual’s attitude toward violent behavior. The purpose of this study was thus to investigate factors which both promote and protect against violent youth attitudes in Toronto, Canada’s largest urban center. Multinomial logit models were fit separately for males and females in Grades 7 to 9 using cross-sectional data from the 2006 International Youth Survey. Odds ratios were estimated for the associations between levels of attitude toward violence and select factors in each of the biological, familial, peer-related, school and community domains. A graded effect of school attachment on violent attitude was observed for both sexes; male and female students who do not like school at all are 9.89 (3.15-31.0) and 6.49 (2.19-19.2) times as likely as those who like school a lot to have the “most” versus “least” violent attitude, respectively. For every one-unit increase in (negative) perception of neighborhood score, male and female students are 1.15 (1.07-1.23) and 1.20 (1.12-1.28) times as likely to have the “most” versus “least” violent attitude. The number of victimization events was associated with attitude toward violence in males but not females, while the reverse was true for academic performance and exposure to prejudice. Our findings highlight the important relationships between connections to social environments and youth attitudes toward violence, and identify modifiable factors which may be amenable to intervention. Sex-specific differences in the predictors of violent youth attitudes warrant additional investigation and have implications for policy design.
Background
In response to the worldwide increase in the incidence of intentional injuries, the World Health Assembly adopted a resolution in 1996 declaring that violence was a “leading public health problem” (World Health Assembly, 1996). The 2002 World Report on Violence and Health describes adolescents and young adults as the main perpetrators and victims of violence in almost all parts of the world; fatal and nonfatal assaults involving youth thus contribute greatly to the global burden of premature death and disability (Krug, Dahlberg, Mercy, Zwi, & Lozano, 2002). Violent youth commit a range of crimes and often display other problem behaviors, including truancy, substance abuse, and recklessness. Violence and related behaviors add significantly to the costs of health and welfare services, reduce productivity, and decrease the value of property (Krug et al., 2002).
As in other countries, Canadian youth are more likely to engage in criminal offending and violent behavior than older Canadians. In 2007, 52% of Ontario residents charged with a violent crime were between 12 and 29 years of age (Wortley, 2008). The rate of violent crime declines dramatically after 30 years of age, to the extent that criminal behavior is largely synonymous with the behavior of young people (National Crime Prevention Centre, 2012; Wortley, 2008). Trends indicate that serious violence is increasingly concentrated among young and socially disadvantaged minority males (Centre for Addiction and Mental Health, 2006; National Crime Prevention Centre, 2007). In Ontario’s urban areas, violent crimes involving firearms have increased significantly in the past decade; the wave of gun-related violence in 2005 was dubbed Toronto’s “summer of the gun” (Centre for Addiction and Mental Health, 2006; Ross, Chowdhry, & White, 2012).
Police-reported crime statistics suggest that between 2007 and 2012, there were declines in both the volume and severity of youth crime (Perreault, 2013). It is nevertheless important to note that most victimization experiences involving youth go unreported to the police, and surveys suggest that most young people in Ontario will suffer from some form of violent victimization (Wortley, 2008). The human and economic costs exacted by youth violence are deeply harmful to each of family, community, and societal cohesion (Krug et al., 2002). Factors which increase the risk of young people being the perpetrators of violence are candidate targets for violence prevention programs (Krug et al., 2002; World Health Assembly, 1996).
Risk factors for violent youth behavior are well documented in the academic literature, and span each of individual, family, school, peer, and community domains (Hawkins et al., 2000; Herrenkohl et al., 2000; Resnick, Ireland, & Borowsky, 2004). Factors including problems at school, peer delinquency, and drug availability are predictably associated with youth violence, and youths exposed to multiple risks are notably more likely to engage in violent behavior (Herrenkohl et al., 2000). Sociodemographic differences in violent behavior have been observed, and may be due to variation in values and attitudes consistent with the attitude mediation thesis (Markowitz & Felson, 1998). Analyses of factors protective against violence perpetration highlight possible points of intervention and opportunities for building resilience (Losel & Farrington, 2012; Resnick et al., 2004).
Popular theories of human behavior suggest that behavioral intentions are formed in part by the individual’s attitude toward that particular behavior (Armitage & Conner, 2001; Azjen & Fishbein, 2005; Bandura, 1977; Montano & Kasprzyk, 2008). Indeed, the Centers for Disease Control and Prevention lists “antisocial beliefs and attitudes” as a risk factor for the perpetration of youth violence (Centers for Disease Control and Prevention, 2016). It is thus reasonable to expect that targeting youth attitudes toward violence can contribute to reductions in violent behavior (Cotten et al., 1994; Funk, Elliott, Urman, Flores, & Mock, 1999). This concept has been applied widely in the health promotion domain, where researchers have a substantive interest in influencing behaviors such as condom use and physical activity (Azjen & Fishbein, 2005; Montano & Kasprzyk, 2008).
While tools have been developed to measure violence-related attitudes in youth (Dahlberg, Toal, Swahn, & Behrens, 2005; Funk et al., 1999), studies which investigate attitudes toward violence in the context of adolescent risk factors are largely absent from the literature. In addition, analyses differentiated by gender are needed to better understand sex-specific factors related to violent youth behavior (Losel & Farrington, 2012; Markowitz & Felson, 1998), especially outside of dating and relationships. The objective of this study is to examine the associations between select factors and youth attitudes toward violence in Toronto, Canada’s largest urban center and “murder capital” (Wortley, 2008).
Method
International Youth Survey (IYS)
The IYS is the Canadian portion of the International Self-Report Delinquency Study (ISRD) involving youth in Grades 7 to 9 in approximately 30 European countries, the United States and Canada (Statistics Canada, 2007). The IYS provides comprehensive information about the delinquency and misbehavior of young people in the context of their relationships with parents, school, and friends. To the authors’ knowledge, this is the first study to examine violent attitudes in youth using IYS data.
Sampling Strategy
Statistics Canada conducted the cross-sectional IYS in the city of Toronto in 2006, the most recent year in which data were collected. The target population consisted of students in Grades 7, 8, and 9 attending a public school belonging to the Toronto District School Board (TDSB) or private school in the Toronto Metropolitan Area (TMA) at the time of collection (roughly 60,000 youths). Not represented in this sample are youths who were not enrolled in school and students attending Catholic schools (comprising approximately 25% of the student population in the TMA).
The target population was stratified by grade and two geographic areas, yielding six strata. In each stratum, schools were selected systematically with probability proportional to the school enrolment count for the grade of interest. A Statistics Canada interviewer randomly selected one class in the desired grade from the selected school. The final sample consisted of 3,290 students in 210 classrooms from 176 selected schools. Statistical weights were placed on each record to indicate the number of sampled students that the record represents. Additional details concerning the sampling and weighting scheme can be found here.
Ethical Considerations
Data collection activities were approved by the TDSB after a lengthy review process beginning in September 2005. Student participation in the study was strictly voluntary. Consenting students completed anonymous paper questionnaires during classroom sessions lasting 40 to 50 min. Teachers were asked to refrain from circulating around the classroom to protect the privacy and confidentiality of the students taking part in the survey. The IYS data are available for public use and are subject to confidentiality rules that prevent the direct or residual disclosure of potentially identifiable information. Several variables were removed and/or suppressed in the microdata file for this reason, including immigrant status, country of birth, language(s) spoken at home, family composition, and parents’ employment status.
Dependent Variable of Interest
The attitude toward violence score is a derived variable based on five questions concerning violent behavior done by young people. The variable measures student agreement with statements about potentially violent scenarios (e.g., “one needs to make use of force to be respected” and “if somebody attacks me, I will hit him or her back”). The score is a sum of values where the responses “fully agree,” “somewhat agree,” “somewhat disagree,” and “fully disagree” are equal to 4, 3, 2, and 1, respectively. Allowed values range from 5 to 20; the higher the total score, the more positive is the attitude toward violence.
It is difficult to ascribe meaning to small changes in the derived attitude toward violence score; scores were thus categorized into three levels to better compare qualitatively different outcomes. Scores ranging from 5 to 10 (inclusive) comprise the “least violent attitude” category; on average, these youths “fully disagree” or “somewhat disagree” with the statements concerning violent behavior (n = 1,656). Scores ranging from 11 to 15 (inclusive) comprise the “moderately violent attitude” category; these youths “somewhat agree” with at least one of the statements concerning violent behavior (n = 1,228). Scores ranging from 16 to 20 (inclusive) comprise the “most violent attitude” category; these youths “fully agree” with at least one of the statements concerning violent behavior (n = 286).
Independent Variables of Interest
Potential risk factors for attitude toward violence were identified a priori based on a scan of the relevant literature (Herrenkohl et al., 2000; Losel & Farrington, 2012; Markowitz & Felson, 1998; Resnick et al., 2004). It was assumed that predictors of violent behavior in youth would be reasonable proxies for proviolence attitudes among youth of a similar age. A proposed classification scheme divides predictors of youth violence into five broad domains, including biological, familial, peer-related, school, and community factors (Herrenkohl et al., 2000). Thirteen survey questions which captured a range of plausible risk factors in each domain were selected from the IYS.
Biological factors
Predictors in this domain included sex and school grade, a proxy for age and maturation through the Canadian school system. Students generally turn 12, 13, and 14 years of age in the year they attend grades 7, 8 and 9, respectively.
Familial factors
Predictors in this domain included social economic situation (SES), family conflict, relationship with mother, and relationship with father. SES is a derived binary variable that approximates the SES of the student’s household by highlighting their access to four material items (e.g., a cell phone or a family vehicle). The two categories of SES include having access to “0, 1, or 2 items” or “3 or 4 items.”
Family conflict is a derived binary variable that indicates the presence (“1 or more problems”) or absence (“no problems”) of serious family conflicts. Potential conflicts include separation/divorce of parents, repeated serious conflicts/physical fights between parents, or problematic alcohol/drug use by parent(s).
Relationship to mother and father are categorical variables that describe the student’s usual relationship to their female and male parents. The three categories of both variables include getting along with their parent “just fine,” “rather well,” and “not so well/not at all.”
Peer-related factors
Predictors in this domain include tolerance for illegal activity, gang membership, and victimization events. Tolerance for illegal activity is a binary variable that indicates whether or not illegal activities are accepted by the student’s friend group. Similarly, gang membership is a binary variable that indicates whether or not the student considers his or her friend group to be a gang.
Victimization events is a derived categorical variable that counts the number of times the student has been victimized in the preceding 12 months; the levels of this variable include “none,” “once,” and “more than once.” Potential victimization events include violent injury, bullying, theft, or extortion.
School factors
Predictors in this domain include school attachment and academic performance. School attachment is a categorical variable that describes the student’s usual opinion of school. The four categories of school attachment include “like a lot,” “like fairly well,” “do not like very much,” and “do not like at all.” Academic performance is likewise a categorical variable that describes the student’s classroom performance relative to their peers; the three categories include “doing better than most,” “average student,” and “not doing very well.”
Community factors
Predictors in this final domain include exposure to prejudice and perception of neighborhood score. Exposure to prejudice is a categorical variable that counts the number of times the student has been treated badly due to their religion, language, or skin color. Levels of this variable include “none,” “once,” and “more than once.”
Perception of neighborhood score is a derived continuous variable based on five questions concerning the social and physical conditions of student neighborhoods. The variable measures student agreement with statements about potentially negative exposures (e.g., “there is a lot of crime in my neighborhood” and “there are a lot of empty/abandoned buildings”). The score is a sum of values where the responses “fully agree,” “somewhat agree,” “somewhat disagree,” and “fully disagree” are equal to 3, 2, 1, and 0, respectively. Allowed values range from 0 to 15; the higher the total score, the more negative is the student’s perception of their neighborhood.
Statistical Analysis
Preliminary analyses revealed significant differences in attitude toward violence by student sex (Figure 1a and 1b), and therefore, separate models were fit for males and females using STATA/IC 14 software (StataCorp LP, 2013). Both sets of data failed to meet the assumption of proportional odds required to fit parsimonious ordinal logit models for multiclass outcomes (p = .03 and p < .01 for the male and female models, respectively, as per the Brant test in STATA). Multinomial logit models were thus deemed a more appropriate fit for the sex-specific data. Sampling weights included in the microdata file were applied to the data to adjust for the sampling design. Independent variables were screened for inclusion based on their univariate associations with attitude toward violence. Predictors that were significant at a liberal p value (p ≤ .2) were retained as candidates for the multivariable model.
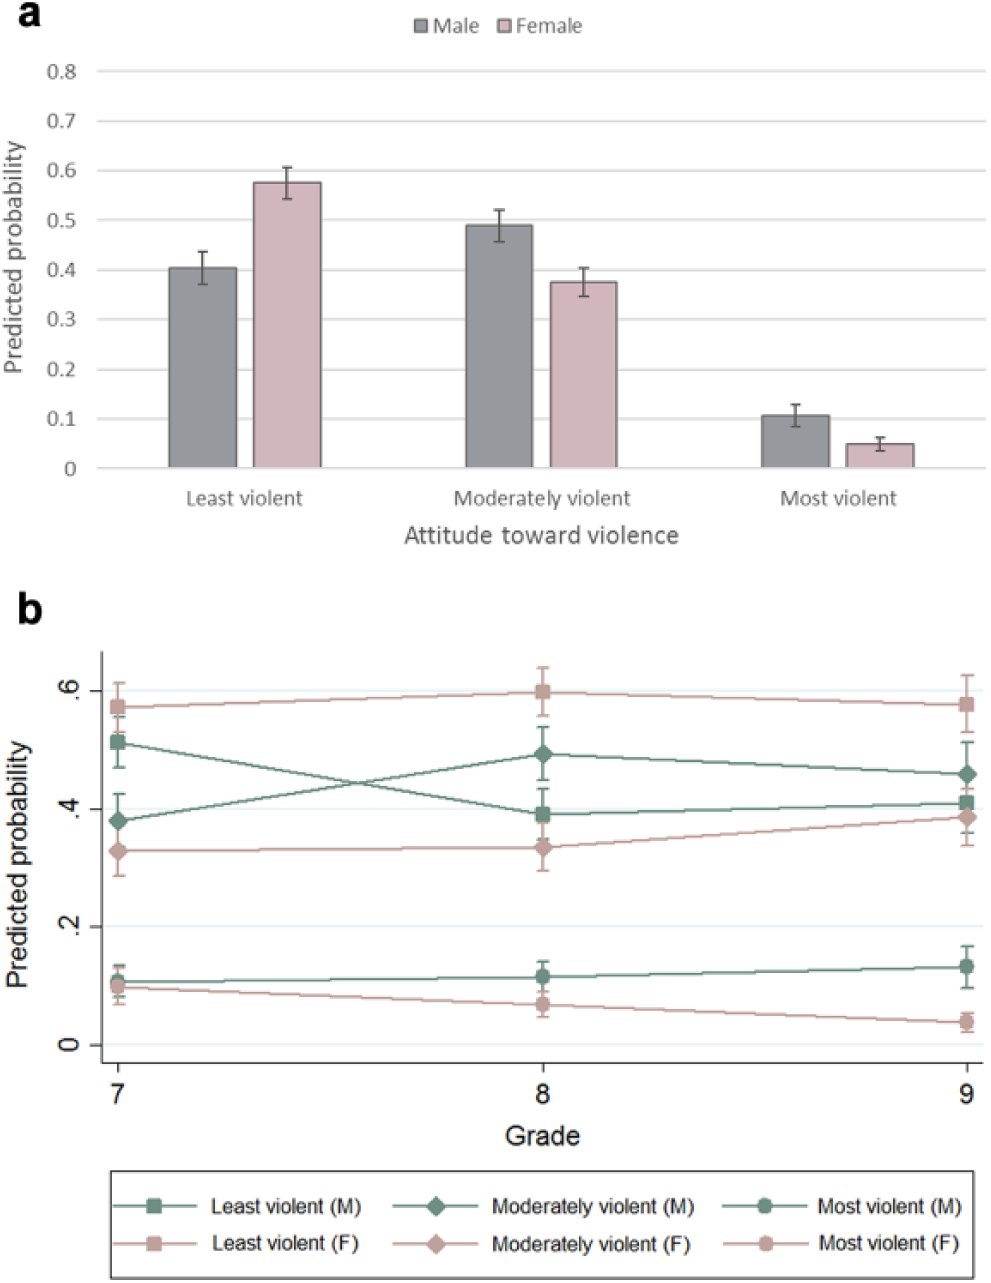
Predicted probability of attitudinal outcome by (a) student sex; and (b) student sex, stratified by grade.
Correlation coefficients were generated for each pair of predictor variables and assessed for collinearity problems. Moderately strong correlations were observed between relationship with mother and relationship with father in both male and female models (ρ = 0.49 and 0.45, respectively); in the interest of being conservative, the collinear variable with fewer observations (relationship with father) was removed from the analyses. No additional collinear pairs were identified by variance inflation factor (VIF) diagnostics (all VIF < 2.5). The assumption of linearity was satisfied for continuous variable perception of neighborhood in both models, as per an examination of the relevant scatterplots (Figure 2a and 2b).
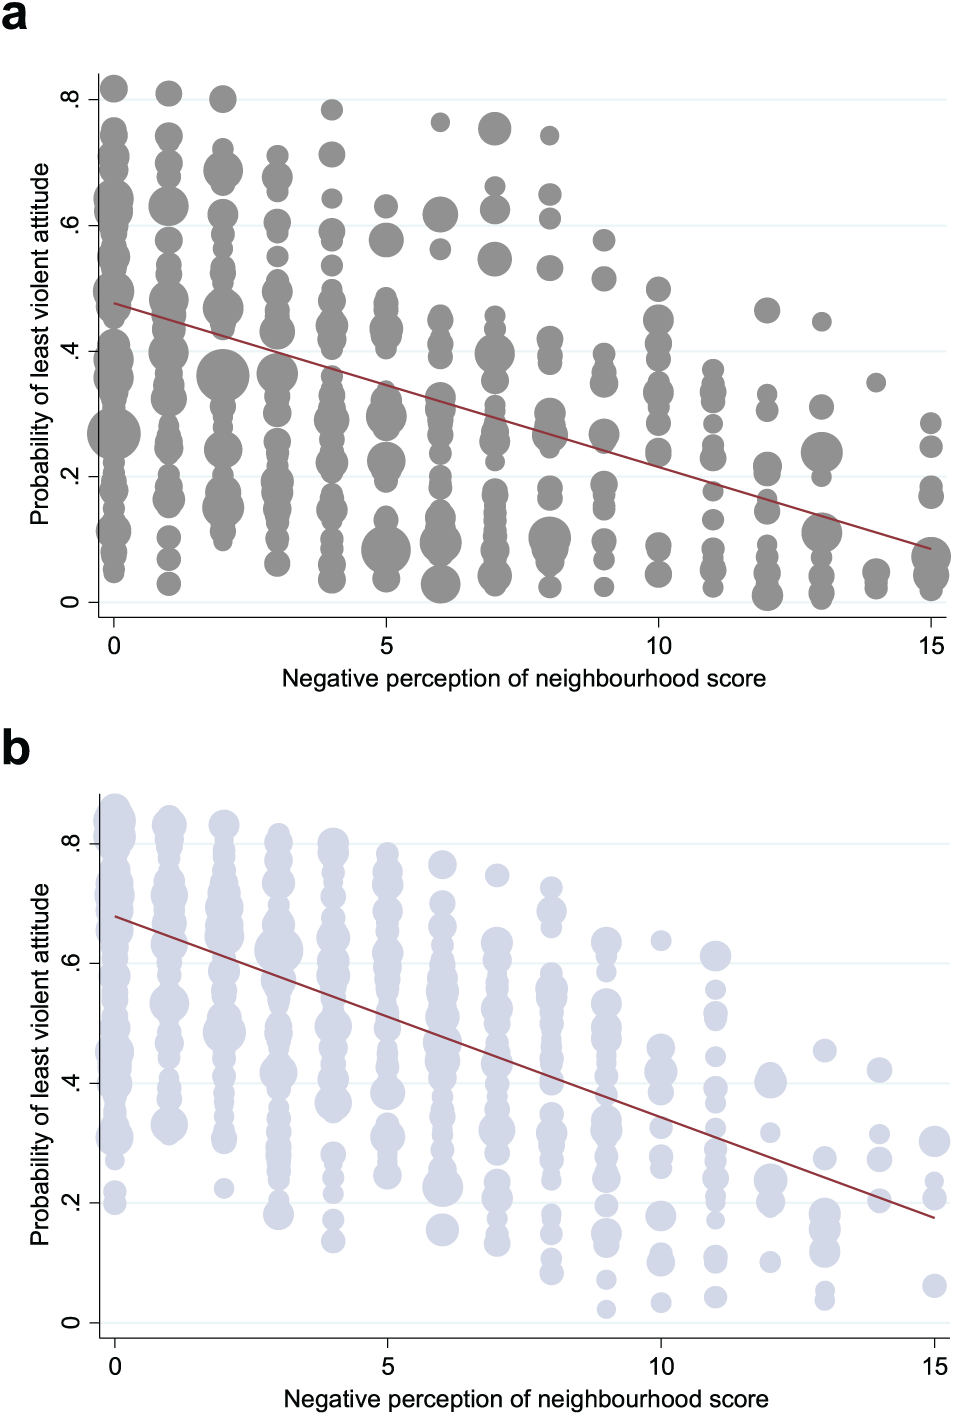
Scatterplots examining the linearity assumption for perception of neighborhood score against the predicted probability of least violent attitude for (a) males and (b) females.
The main effects models were selected using a manual backward elimination strategy. Analysis was limited to those observations with no missing data (n = 1,213 and 1,431 for the male and female models, respectively), and statistical significance was defined as p ≤ .05. Predictors eliminated after univariate screening were reintroduced and assessed for a confounding effect on the remaining predictors (≥20% change in the adjusted estimate); no variables were confounders by this criterion.
Students who reported that they did not have a group of friends were excluded from analysis (13.8% and 11.3% of male and female students, respectively). This provision was made because only students with friends were surveyed for the relevant peer-related factors described above. The impact of excluding from the model students who reported that they did not have a friend group was thus explored in a sensitivity analysis.
Results
Sample Characteristics and Candidate Screening
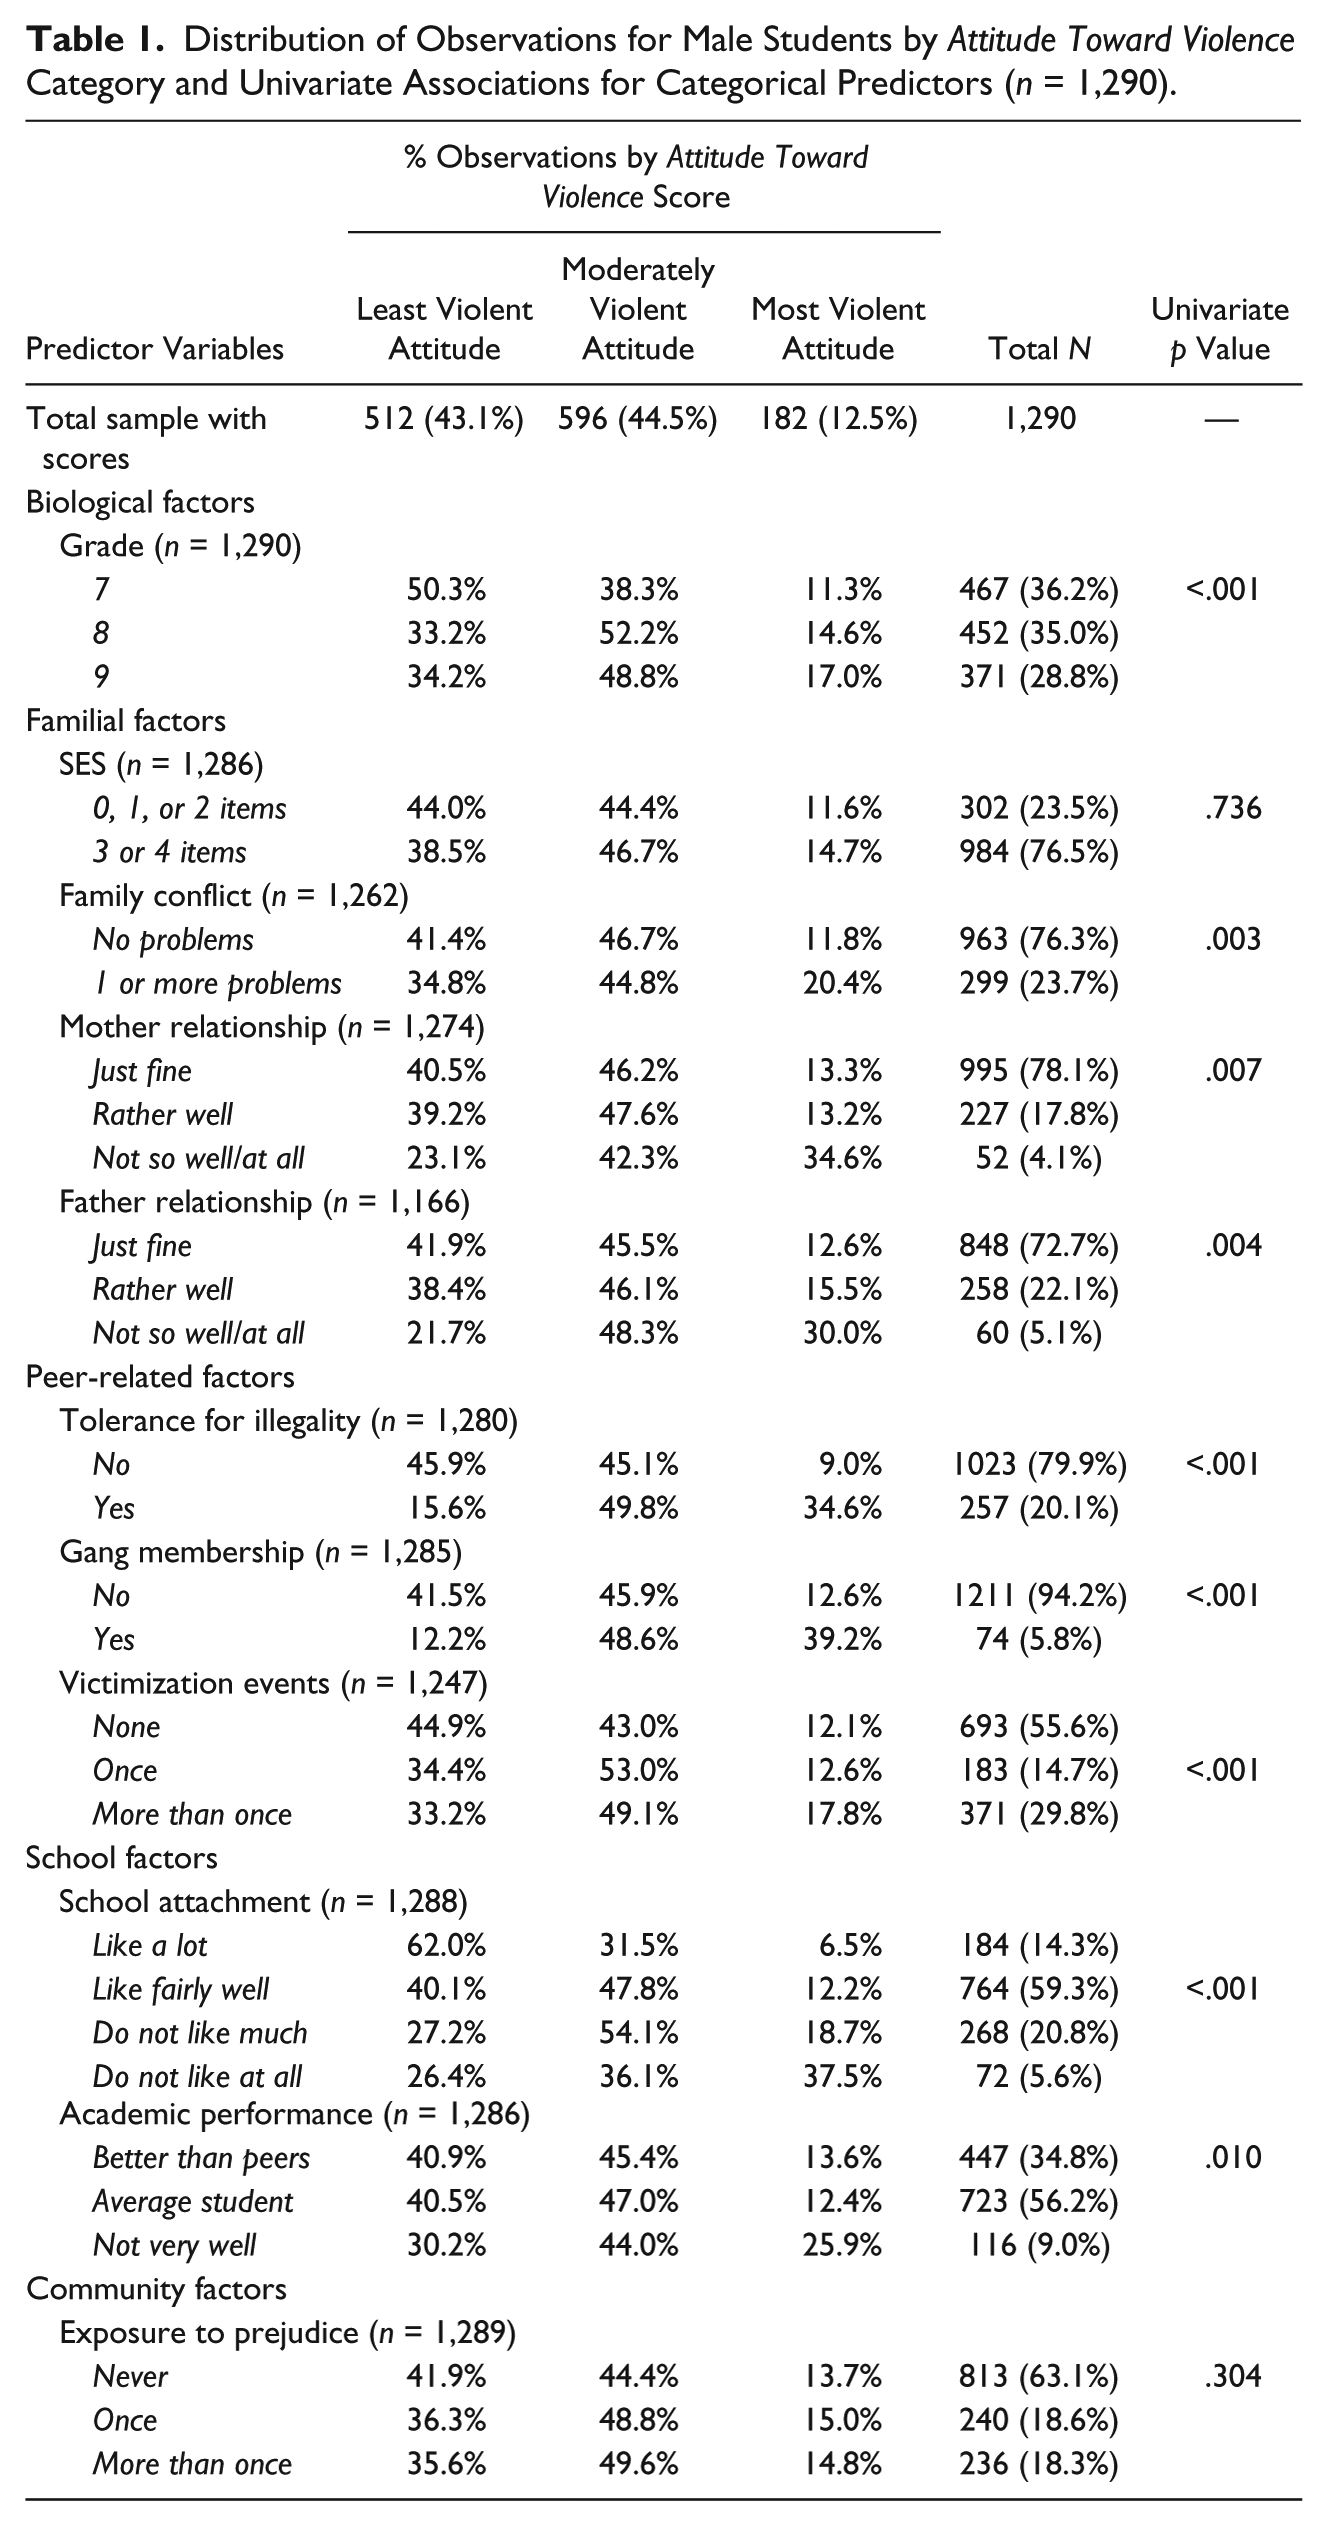
Tables 1 and 2 display the distribution of observations by attitude toward violence category for each level of categorical predictor. Both male and female students who did not like and/or performed poorly in school had the “most violent attitude” more than their respective counterparts. Similarly, youth of both sexes who belonged to a gang and/or whose peers tolerated illegal activity had the “most violent attitude” more than youth who did not. Male students in Grades 8 and 9 reported the “least violent attitude” less often than male students in Grade 7; this same pattern was not observed for female students.
Distribution of Observations for Male Students by Attitude Toward Violence Category and Univariate Associations for Categorical Predictors (n = 1,290).
Distribution of Observations for Female Students by Attitude Toward Violence Category and Univariate Associations for Categorical Predictors (n = 1,480).
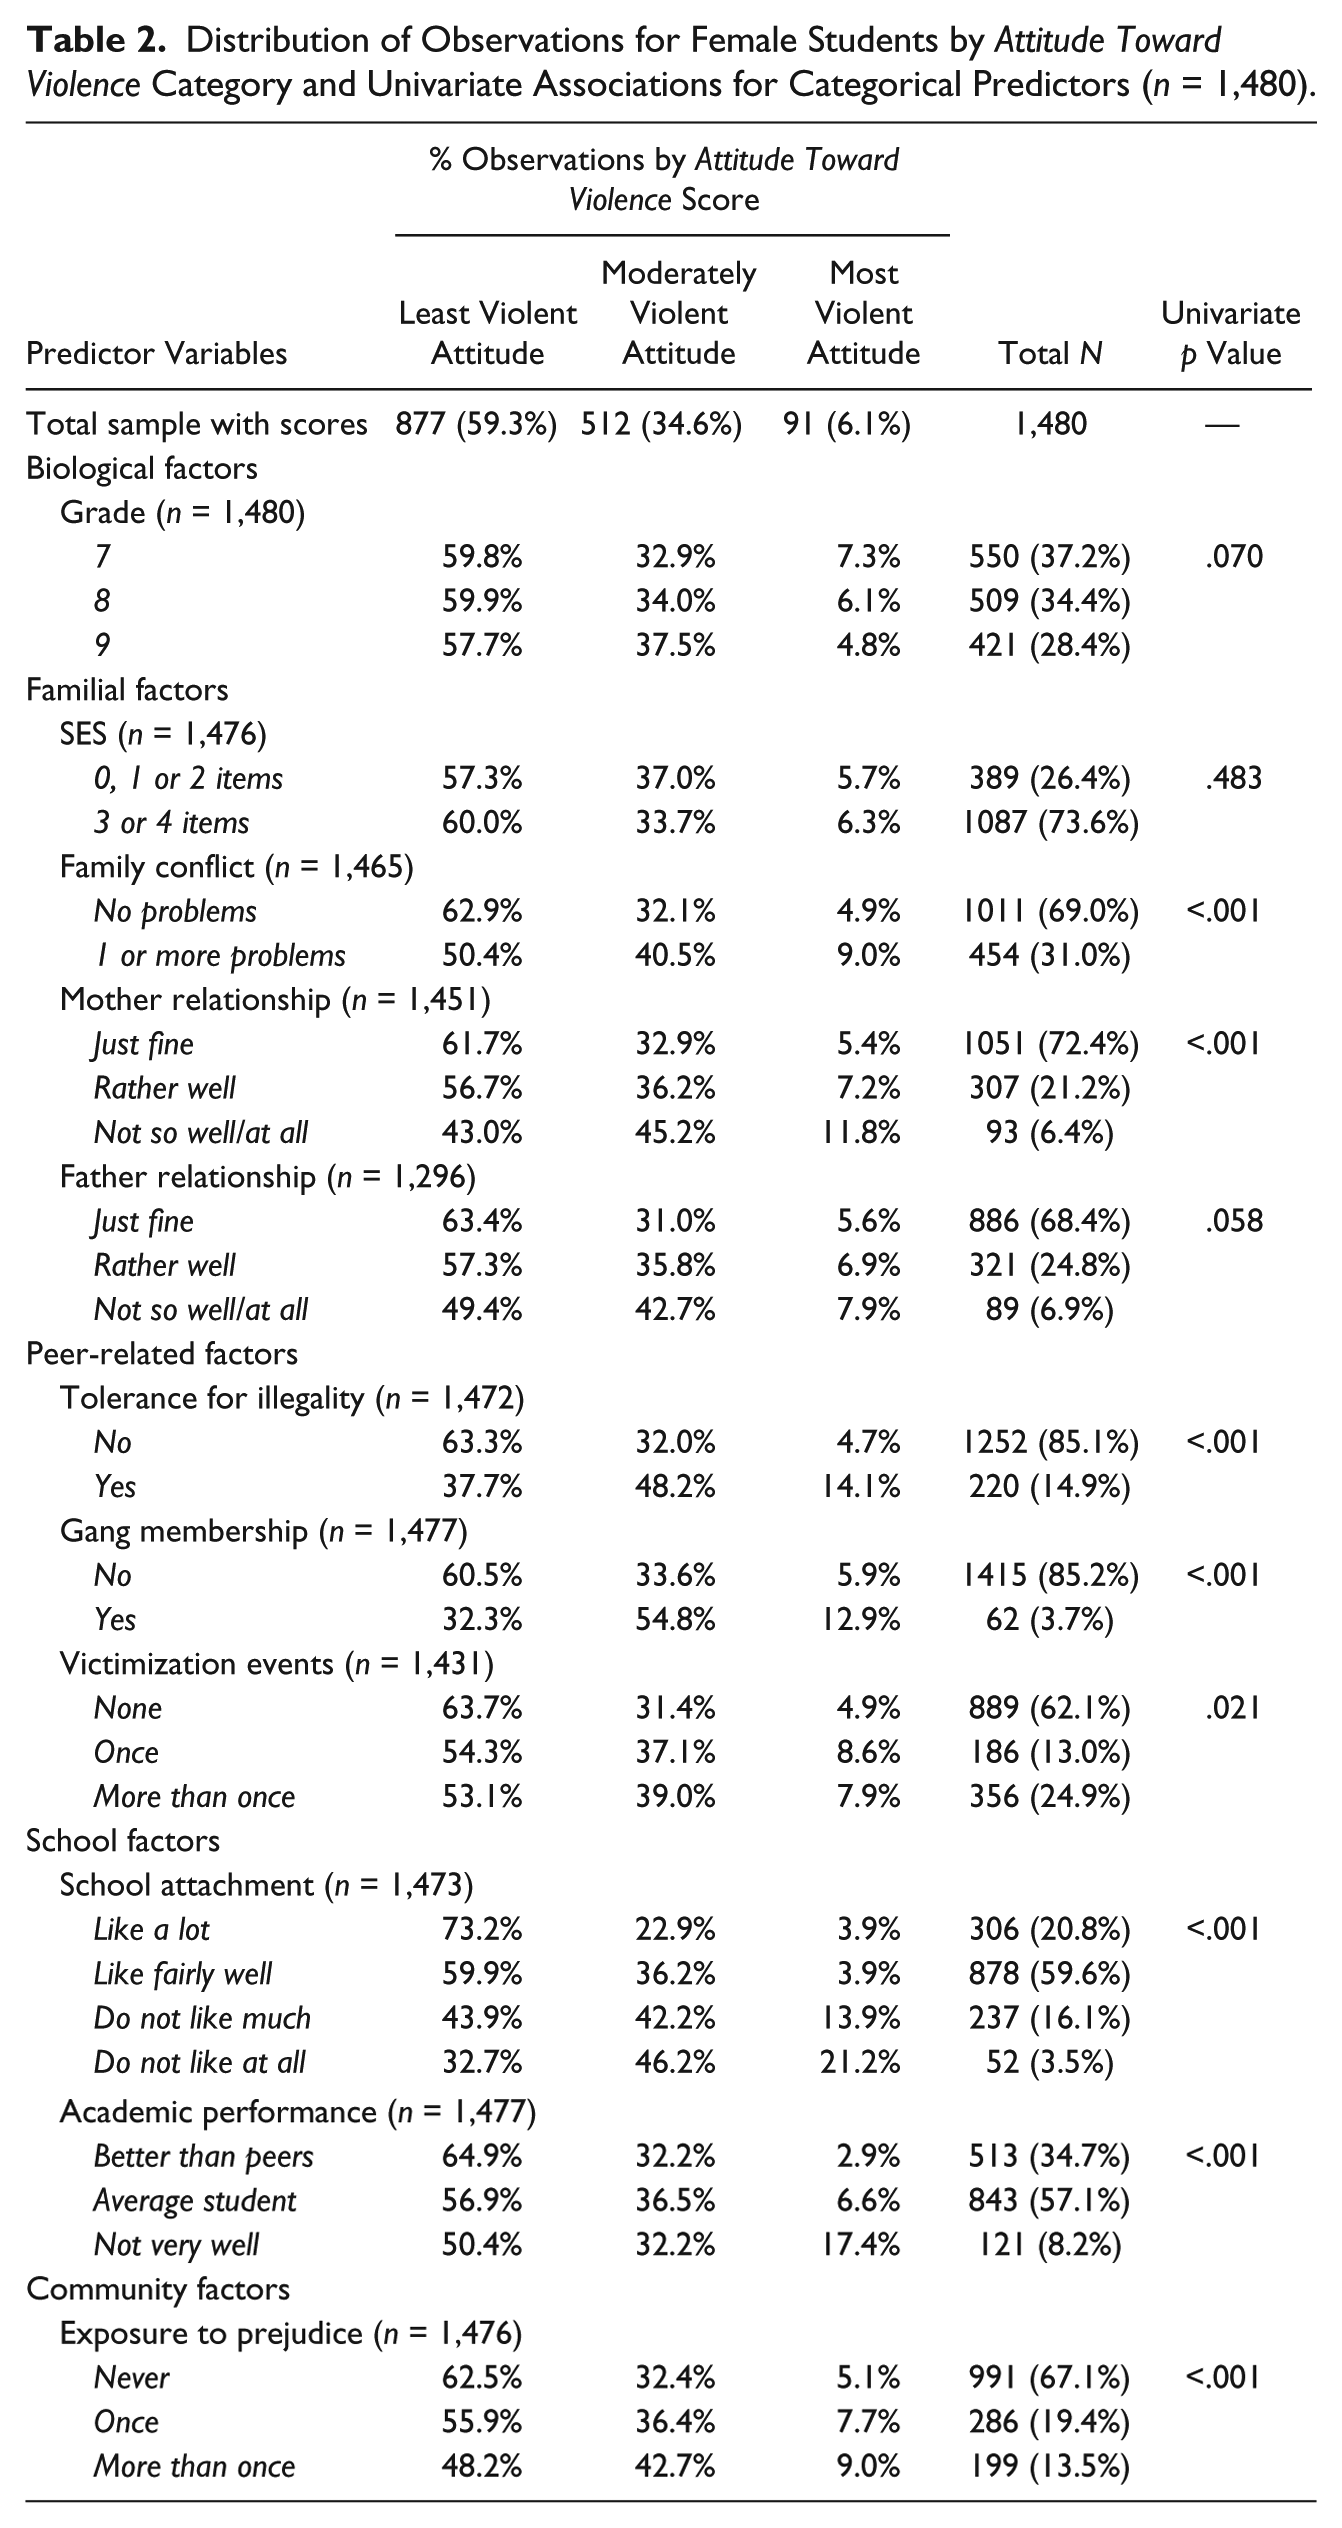
The results of univariate analyses with attitude toward violence are likewise presented in Tables 1 and 2. In the male model (Table 1), SES (p = .736) and exposure to prejudice (p = .403) were eliminated at the screening stage; in the female model, only SES was eliminated at this stage (p = .483). All other candidate predictors were retained for analysis (p ≤ .2).
Effect of Predictors on Proviolence Attitudes
Odds ratio (OR) estimates for the final male and female models are presented in Tables 3 and 4, respectively. Predictors in each of the biological, peer-related, school, and community domains are significantly associated with attitude toward violence in both sexes.
Odds Ratio Estimates With 95% Confidence Intervals for Predictor Variables in Final Male Model (n = 1,213).
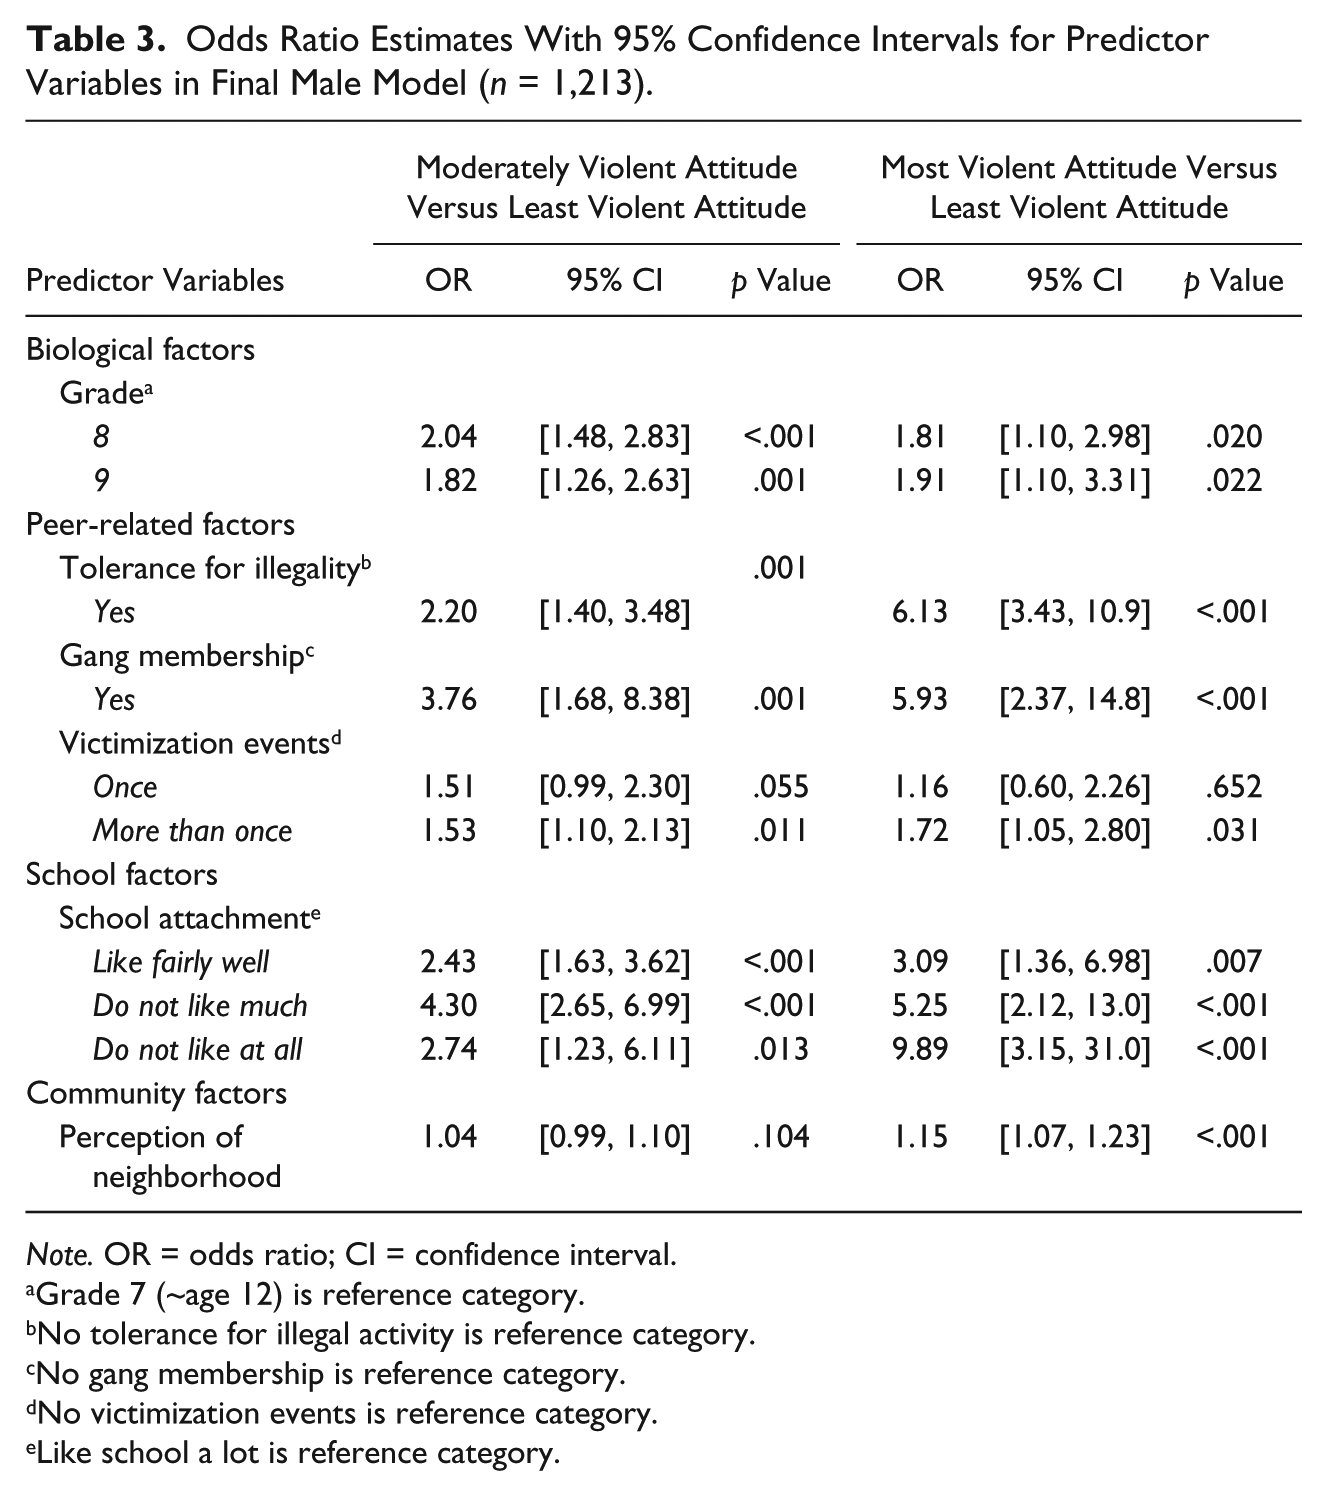
Note. OR = odds ratio; CI = confidence interval.
Grade 7 (~age 12) is reference category.
No tolerance for illegal activity is reference category.
No gang membership is reference category.
No victimization events is reference category.
Like school a lot is reference category.
Odds Ratio Estimates With 95% Confidence Intervals for Predictor Variables in Final Female Model (n = 1,431).
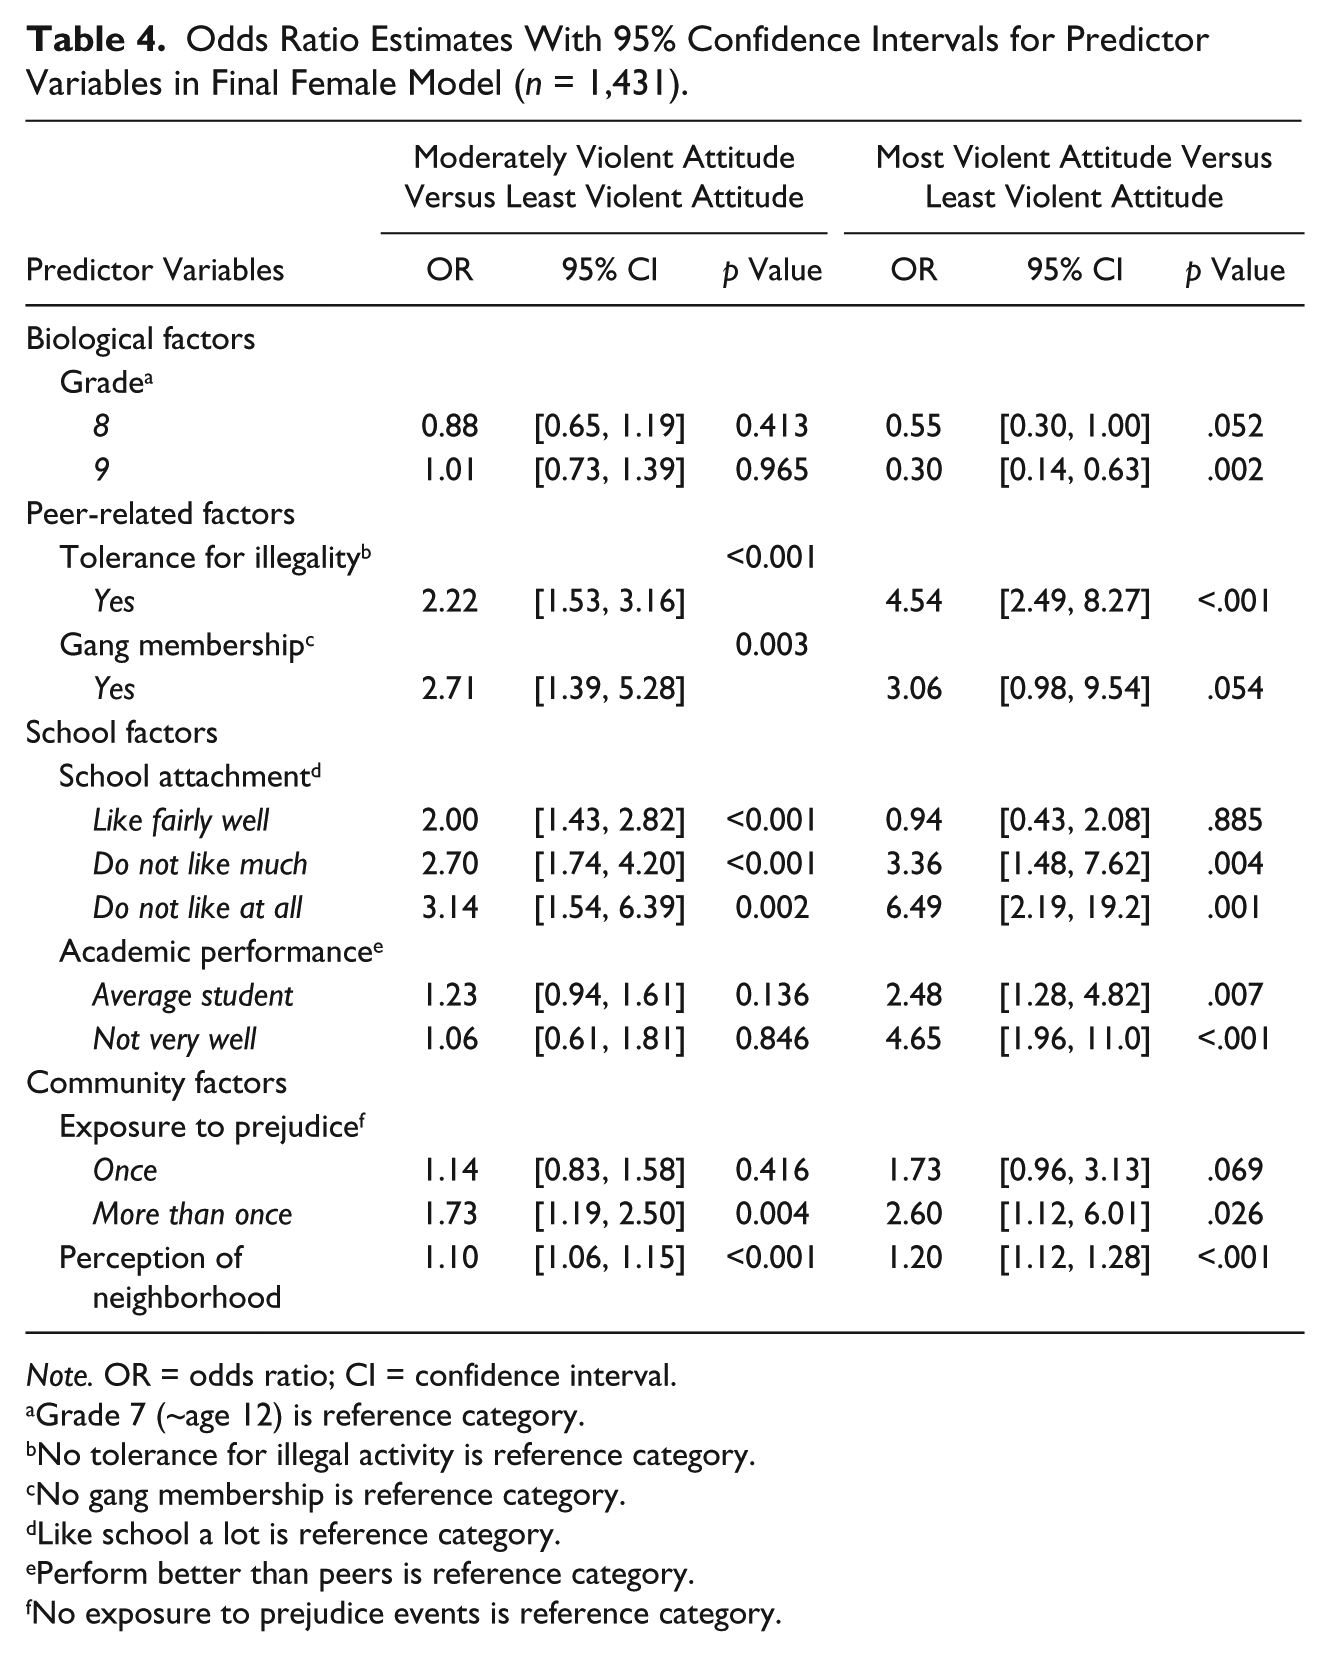
Note. OR = odds ratio; CI = confidence interval.
Grade 7 (~age 12) is reference category.
No tolerance for illegal activity is reference category.
No gang membership is reference category.
Like school a lot is reference category.
Perform better than peers is reference category.
No exposure to prejudice events is reference category.
Male students
Tolerance for illegality and gang membership were strongly significant in the final male model, and the associations are in the expected direction. There was a graded effect of school attachment on attitude toward violence; the odds that a male student who does not like school at all has the “most” versus “least” violent attitude is 9.89 (3.15-31.0) times the odds for a male student who likes school a lot. For every one unit increase in (negative) perception of neighborhood score, male students are 1.15 (1.07-1.23) times as likely to have the “most” versus “least” violent attitude.
Female students
Each of tolerance for illegality, gang membership, and school attachment are similarly significant in the final female model, although the magnitude of these associations is somewhat smaller than those observed for males. The odds that a female student who does not like school at all has the “most” versus “least” violent attitude is 6.49 (2.19-19.2) times the odds for a female student who likes school a lot; there is a similar graded effect of school attachment on the outcome for females. For every one unit increase in (negative) perception of neighborhood score, female students are 1.20 (1.12-1.28) times as likely to have the “most” versus “least” violent attitude.
Notable differences between sexes
The odds that a male student in Grade 9 has the “most” versus “least” violent attitude is 1.91 (1.10-3.31) times the odds for a male student in Grade 7. The effect of grade appeared to be opposite in females, for whom the same comparison yielded an OR of 0.30 (0.14-0.63). The number of victimization events was associated with attitude toward violence in males but not females, while the reverse was true for exposure to prejudice. Finally, academic performance was strongly predictive of attitude toward violence in female students only; the odds that a female student who is not doing very well has the “most” versus “least” violent attitude is 4.65 (1.96-11.0) times the odds for a female student who is doing better than most.
Sensitivity of Results to Excluded Observations
The probability of having the “least violent attitude” was higher for excluded male and female students who reported that they did not have a friend group (Figure 3a and 3b). When students who reported having no friends were retained in the analysis, the impact on the male model was minimal. The observed associations were in the same direction, and none of the OR estimates were changed more than 15%. Of note is that number of victimization events is no longer statistically significant if male students without friends are included in the sample.
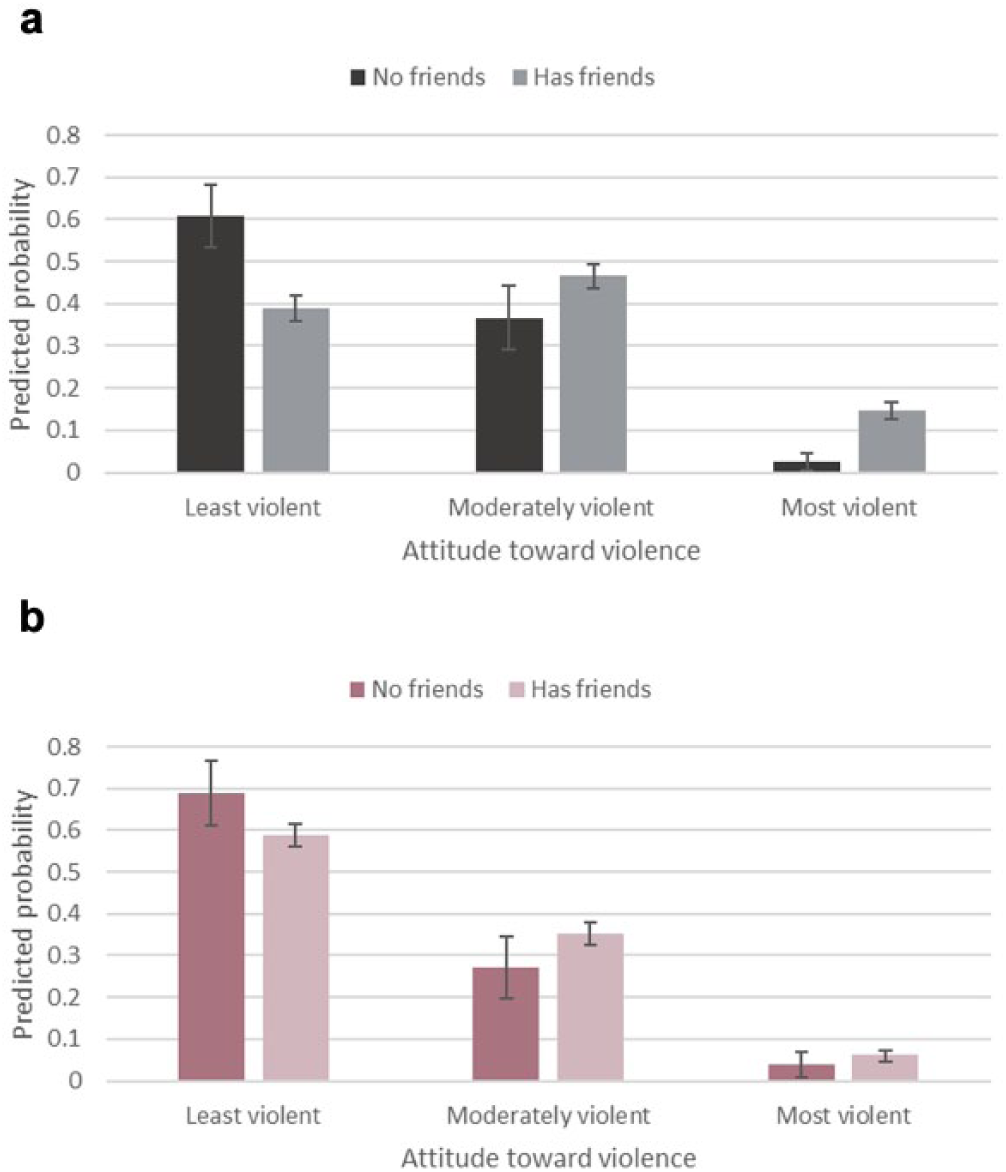
Predicted probability of attitudinal outcome by friend status in (a) males and (b) females.
The impact of retaining students without friends in the female model was more substantial, particularly with respect to comparisons concerning the “most” versus “least” violent attitudes. While the observed associations were in the same direction, OR estimates for the effect of school attachment on attitude toward violence were changed by over 20% in some instances. The female model may be more sensitive to the exclusion of students without friends given that relatively few female students report the most violent attitudinal outcome.
Discussion
The objective of this study was to examine the factors associated with attitudes toward violence in a sample of Canadian youth attending school in an urban center. Cross-sectional data from the only iteration of the IYS were used to explore the study questions, given the richness of available information concerning risk and protective factors for antisocial behavior (Statistics Canada, 2007). Findings from the present study can be contextualized more broadly within theories of behavioral change, which assert that the way an individual acts is influenced by their attitudes toward the behavior in question (Azjen, 1989; Glanz, Rimer, & Lewis, 2002). This means that having a violent attitude might play an important role as a precursor to behaving violently (Bandura, 1977). Measures of attitudes toward violence are increasingly recognized as reliable and valid predictors of violent and aggressive behaviors among adolescents (Slep, Cascardi, Avery-Leaf, & O’Leary, 2001). This study is unique in that it investigates predictors of attitudinal outcomes proximal to related behavioral outcomes.
Previous studies that explored the relationships between school-related factors and violent behavior demonstrated that disliking school and/or performing poorly were risk factors for both male and female students (Henry, Tolan, Gorman-Smith, & Schoeny, 2012; Herrenkohl, Lee, & Hawkins, 2012; Pardini, Loeber, Farrington, & Stouthamer-Loeber, 2012; Wegner, Garcia-Santiago, Nishimura, & Hishinuma, 2010). The similar findings reported here show that the probability of having the “least violent attitude” decreases for both sexes as school attachment becomes less positive (Figure 4). Conversely, the probability of having a “moderately violent attitude” or the “most violent attitude” increases as school attachment becomes less positive. Beyond mirroring established trends, the present study observed differing strengths of association between school attachment level and violent attitude for males and females; in particular, school attachment was more strongly associated with attitudinal outcomes in males than females. Importantly and as confirmed with sensitivity analyses, this result was robust to changes in the number of observations arising from the exclusion of male students without friends. Interestingly, academic performance was strongly predictive of violent attitude in female students only. This finding was somewhat unexpected and requires further inquiry. The relatively small number of female students who report having the “most violent attitude” may be exerting disproportionate influence on the estimates presented here, and is a limitation of this study.
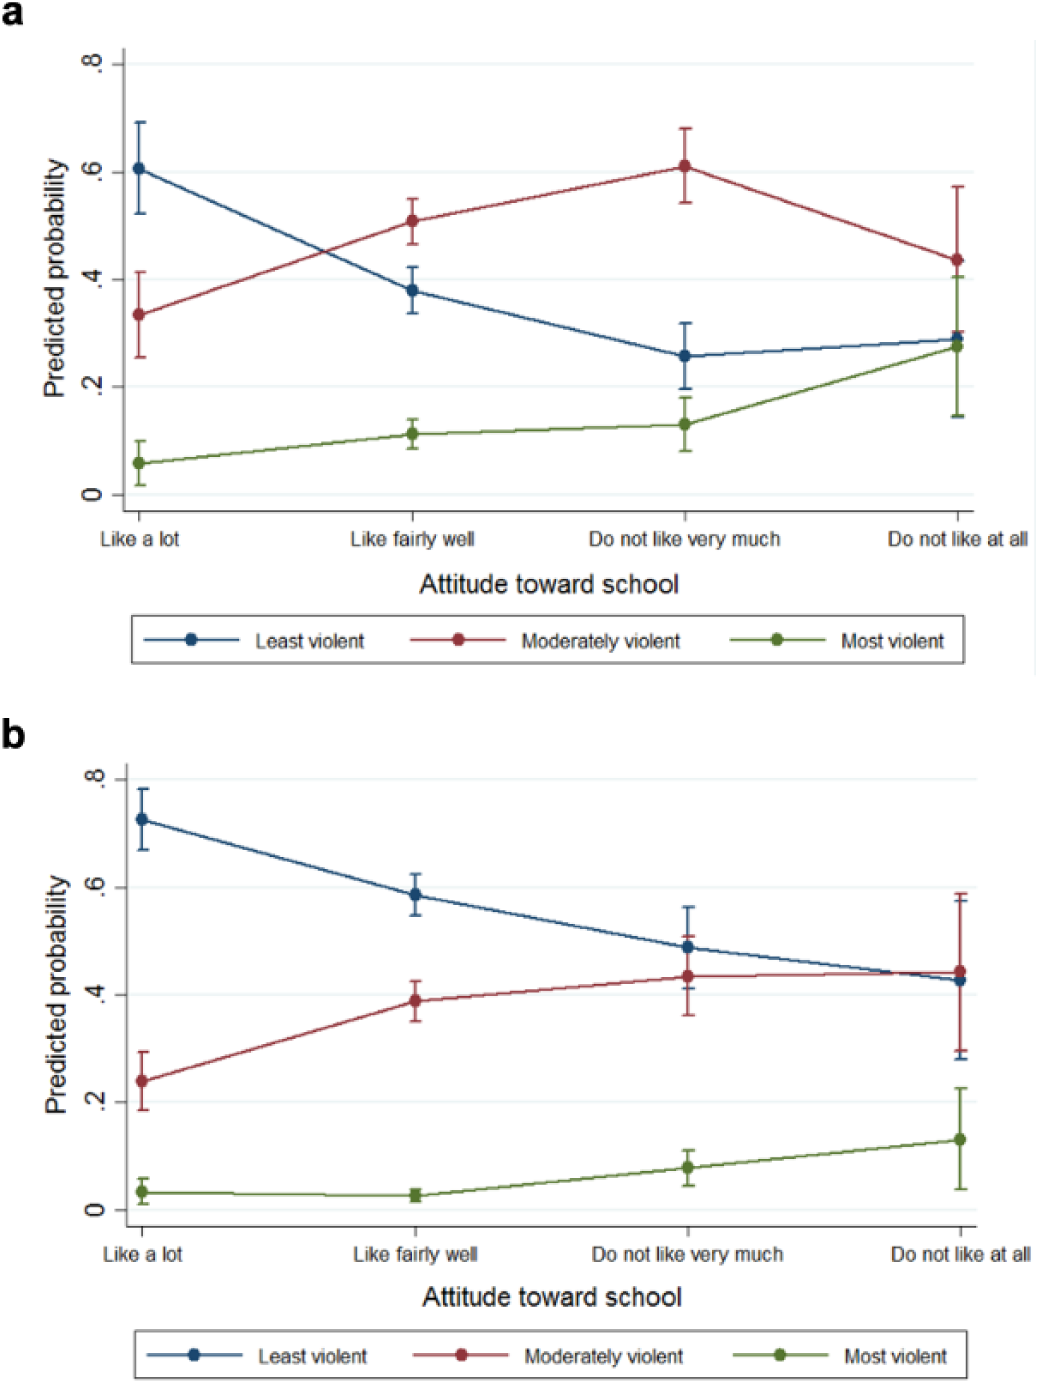
Predicted probabilities of attitudinal outcome by level of school attachment in (a) males and (b) females.
Taken together, these insights suggest that interventions targeting school attachment could be protective against violent youth attitudes. The development of school-based interventions is of particular interest because of their feasibility, inclusion of all students, and potential to bridge gaps with the broader community (Wegner et al., 2010). An intervention which has proven successful in the American context is the Personal Transition Plan/Leadership (PTP/L) program (Chung-Do, Goebert, Hamagani, Chang, & Hishinuma, 2015). This intervention specifically targeted high school students’ attitudes and connectedness toward school as a means to address and mitigate violent attitudes and behaviors (Chung-Do et al., 2015). Adequate consideration for cultural differences across students and school settings is necessary and of primary concern in the development of school-based programming (Arbona, Jackson, McCoy, & Blakely, 1999; Rabold & Baier, 2011; Soriano, Rivera, Williams, Daley, & Reznik, 2004). Due to data suppressions arising from confidentiality rules, the exploration of potentially relevant sociocultural variables including immigrant status, country of birth, language(s) spoken at home, family composition, and/or parents’ employment status was not possible in the present study. Additional investigations addressing the different values and motivations of students across school settings is an important next step, insofar that they have important implications for appropriate youth programming.
The results likewise show that the probability of having the “least violent attitude” decreases for both males and female students as (negative) perception of neighborhood increases; the reverse is true for the probabilities of having a “moderately violent attitude” and/or the “most violent attitude” (Figure 5). The effect of perception of neighborhood score was notably stronger in female than in male students. These analyses both support and extend the work of Herrenkohl et al. (2012), who report that youth are at an increased risk of later violent behavior when they live in neighborhoods where children are in trouble (OR = 1.72). This observation is reflected in the cyclical nature of violence in the community (Voisin, 2007), which is driven by youths’ internalization of exposure to violence (Guttman, Mowder, & Yasik, 2006). Internalization leads children to view violence as an acceptable conflict resolution tool and emotion management practice (Guttman et al., 2006), and adolescents to externalize violent behaviors (Fowler, Tompsett, Braciszewski, Jacques-Tiura, & Baltes, 2009). The relationship between negative perceptions or experiences of neighborhood with violent attitudes and/or behavior may imply a lack of role models, increased stressors, and more opportunities for aggression (Joliffe, Farrington, Loeber, & Pardini, 2016; Kupersmidt, Griesler, DeRosier, Patterson, & Davis, 1995). Feasible interventions that introduce positive role models and present safer opportunities for relieving aggression, such as social and/or athletic programming, may thus help remedy negative perceptions of neighborhood (Jaime et al., 2015).
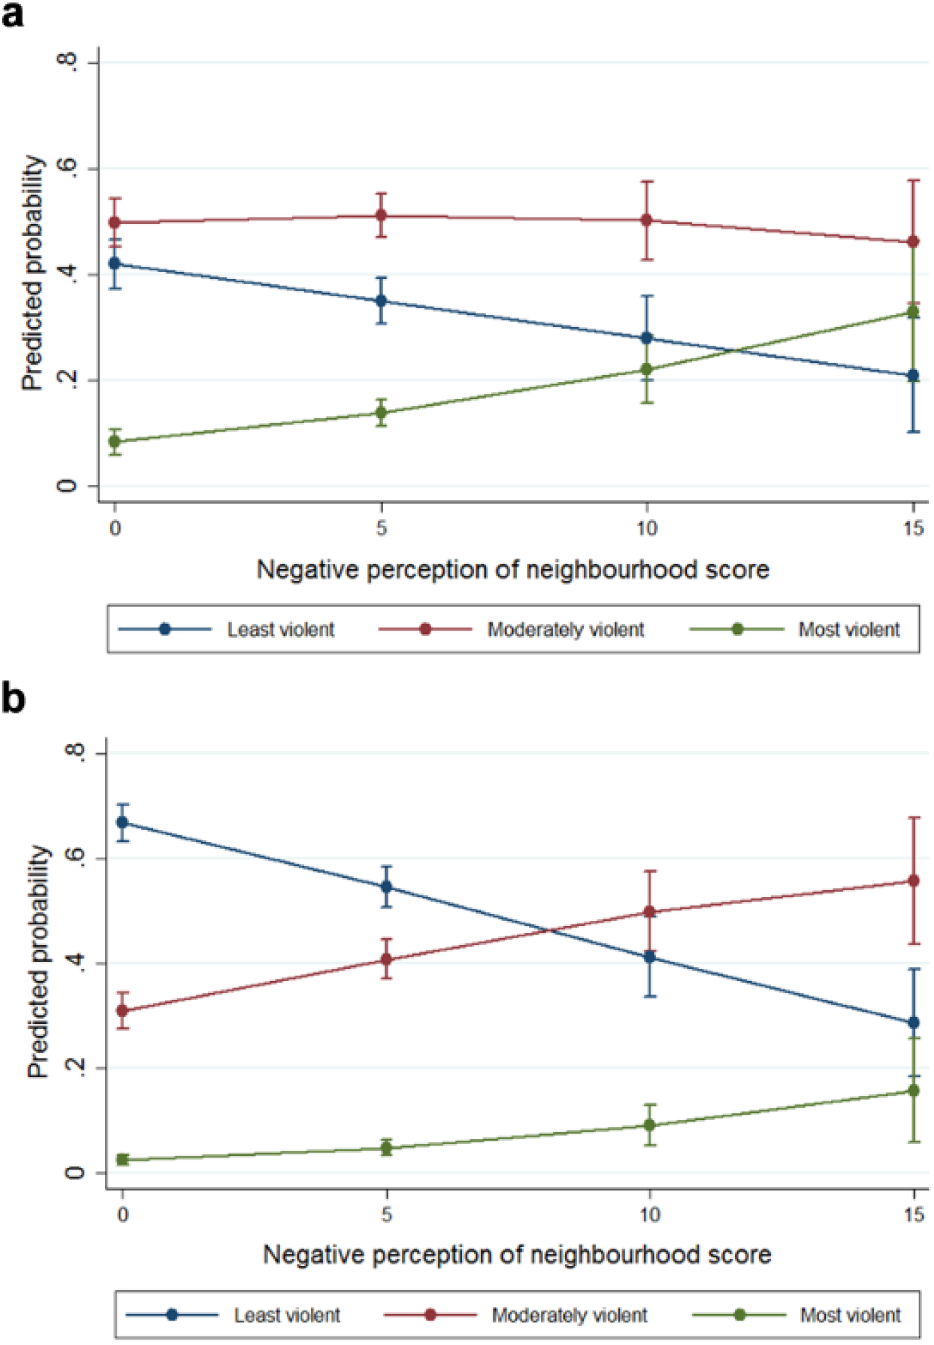
Predicted probabilities of attitudinal outcome by (negative) perception of neighbourhood score in (a) males and (b) females.
Although males are more likely to behave violently (Grunbaum et al., 2004), there is a dearth of literature that examines sex-specific attitudes toward violence and their association with violent behavioral patterns (Ali, Swahn, & Sterling, 2011); this is especially true of settings outside of dating and relationships. In spite of this challenge, it is understood that gender norms and expectations of violence must be addressed as fundamental aspects of effective prevention programming (Finigan-Carr, Gielen, Haynie, & Cheng, 2016; Sundaram, 2016). In addition to the differences described thus far, the present study observed several sex-specific factors associated with attitudes toward violence that deserve consideration. For example, the number of victimization events (i.e., events including violent injury, bullying, or theft) was associated with attitude toward violence in males but not females, while the reverse was true for exposure to prejudice (i.e., events including mistreatment due to religion, language, or skin color). These preliminary insights highlight potentially key factors around which to tailor sex-specific interventions. It is clear that further investigations of the unique factors informing male and female attitudes toward violence are warranted.
Several limitations of this study are worth mentioning. The findings presented here are subject to various sources of bias that relate to both sample selection (given the public school–based and/or voluntary nature of IYS participation) and the reliance on self-report data (given that students might favor “desirable” responses concerning antisocial attitudes and activities). The continuous variable attitude toward violence score was categorized to better compare qualitatively different attitudinal outcomes; categorization necessarily involves the loss of information which might have otherwise revealed interesting trends. While the set of questions informing the student’s attitude score were pretested on male and female adolescents prior to the survey, it is possible that student misinterpretation resulted in the misclassification of outcome. Because analysis was limited to students who reported having a friend group, adolescents with fewer peer interactions may be disproportionately excluded. Follow-up analyses determined that the female model was more sensitive to these exclusions than the male model. Finally, and as with all cross-sectional data, the ability to draw causal inferences from these analyses is limited.
The value of the IYS data is arguably enhanced by its concentrated sample in Toronto, Canada’s largest urban center (Statistics Canada, 2007). The temporal relationship between the much-publicized wave of gun violence in 2005 (Lorinc, 2015) and the IYS in 2006 is an intriguing dynamic not considered here. Future efforts might pair these data with local crime and/or census data to better contextualize the patterns observed in this study, and thereby compliment the novel insights put forth by this work.
Footnotes
Authors’ Note
Cindy Feng and Marwa Farag were co-principal investigators.
Declaration of Conflicting Interests
The author(s) declared no potential conflicts of interest with respect to the research, authorship, and/or publication of this article.
Funding
The author(s) received no financial support for the research, authorship, and/or publication of this article.