
Abstract
There is substantial evidence supporting the association between alcohol license density and violent crime. However, the impact of different types of alcohol licenses on intimate partner and family violence is sparse. We explored the associations between access to alcohol outlets, and family and intimate partner violence using paramedic clinical records, given this service is often the first to respond to acute crises. Coded ambulance attendance data from 694 postcodes in Victoria, Australia, from July 1, 2016 to June 30, 2018 where alcohol or another drug, mental health or self-harm associated with family or intimate partner violence was indicated were examined. A hybrid model of spatial autoregressive and negative binomial zero-inflated Poisson-based count regression models was used to examine associations with alcohol outlet density and socioeconomic factors. We found that access to a liquor license outlet was significantly associated with family violence-related attendances across all types of outlets, including on-premise (late night) licenses (β = 1.73, SE: 0.18), restaurant licenses (β = 0.83, SE: 0.28), and packaged liquor licenses (β = 0.62, SE: 0.06). Our results demonstrate a significant relationship between alcohol-related harms in the context of family violence and provides evidence of the relationship between alcohol-related family violence in both victims and perpetrators. The findings of this study highlight the need for public health interventions such as licensing policy and town planning changes to reduce these harms by restricting alcohol availability.
Keywords
Introduction
The role of alcohol in both violence perpetration and victimization has been demonstrated in multiple studies (Choenni et al., 2017; Katerndahl et al., 2021; Roach et al., 2022). Alcohol has been implicated as a key contributor to violent behaviors, including perpetration of sexual violence (Cowley, 2014) and family violence (Afifi et al., 2012). In addition, studies have found that alcohol consumption by victims of family violence increases the severity of harms experienced (Choenni et al., 2017). Indeed, Australian estimates suggest that up to 50% of family violence incidents involve alcohol (Laslett et al., 2015), while US estimates range from 25% to 50% (Bennett & Bland, 2008). Alcohol has been shown to increase both the incidence and severity of family violence (Graham et al., 2011), increasing both the risk of violence perpetration and victimization (World Health Organization, 2010). Drinking larger quantities of alcohol has also been associated with greater probability of remaining in, or transitioning into, victimized status among women (Bryan et al., 2016). Although alcohol consumption is frequently associated with family violence, approaches to understanding and responding to this issue can be controversial (Yates, 2017) due to concerns of shifting blame from perpetrator behavior and/or the gendered nature of family violence to alcohol or victim blaming. However, rates of family violence have not changed, rather they appear to be increasing including among health professionals (McLindon et al., 2018), and addressing gender and power imbalance in the society is likely to be a generational shift, so applying a public health model whereby risk factors for family violence are identified and addressed may result in reductions in harms until gender power imbalances are addressed in the community.
Alcohol outlet density has been associated with a range of harms across international studies, including increases in risky drinking in urban adolescents (Azar et al., 2016) and risk of injuries, assaults, and family violence (Livingston, 2011). However, a key knowledge gap relates to our understanding of the types of alcohol outlet (e.g., off-premise, restaurant vs club) associated with family violence and is compounded by limitations in using aggregate data at the population level to explore alcohol outlet density (Grubesic et al., 2016). In addition, different measures have been proposed to describe the spatial configuration of liquor license density, including container-based (which consists of counting number of outlets and events in each post code and calculating the rates by population), distance-based (e.g., average distance between an event and an outlet), and spatial-based (e.g., weighted distance between an event and an outlet) methods (Centers for Disease Control and Prevention, 2017).
Although container-based measures are the simplest to calculate, spatial-based methods are more useful as they are not constrained by geographic boundaries, thus allowing for assessment of clustering (Sacks et al., 2019). However, the use of ordinary (ordinary least squares) models with spatial data is problematic due to the presence of spatial autocorrelation within the model residuals (Kelejian & Prucha, 1998). Using spatial autoregressive models can help address this limitation by developing geographic unit estimates that borrow strength from adjacent units, thereby improving assessment of exposure to liquor license typologies. It can also be used to assess clustering of measures, which is particularly important when assessing the relationship between liquor license density and alcohol-related harms. In addition, spatial autocorrelation can serve as a surrogate for unknown and unobserved covariates and reduce model misspecification (Aguero-Valverde & Jovanis, 2008). The spatial model includes a spatial lag of the dependent variable as well as spatial lags of the explanatory variables. The spatial lags are defined by spatial-weighting matrix between individual and every other observations in the data (Anselin, 1988). This analysis assumes that the dependent variable is strongly affected by proximate counties but less affected by distant counties.
Previous studies exploring liquor license density and family violence have typically used family violence data obtained from police records (Livingston, 2011). However, the Australian Personal Safety Survey (Australian Bureau of Statistics [ABS], 2006) found that only 36% of females who experienced physical violence reported the incident to the police, and subsequent studies identify police reports in only 21.6% of family violence incidents (Miller et al., 2016). An alternative to using police data to identify family violence incidents is utilizing records from alternate first responders within the community such as ambulance services (Sawyer et al., 2021; Taylor et al., 2016). In a pilot study conducted by Scott et al. (2020), coded ambulance clinical records were used to identify the presence and detailed characteristics of family violence. The authors were able to classify the type of violence (threat, physical violence, sexual violence), whether the patient was the victim or aggressor (or both), the familial relationship between the victim and the aggressor, and alcohol intoxication (Scott et al., 2020).
Given the paucity of studies examining the relationship between alcohol outlet density, license type and family violence, we utilized coded ambulance data to investigate these associations in a large, diverse sample. Specifically, we aimed to: (a) determine the association between alcohol outlet spatial access and the rate of family violence in Victoria, Australia, by the type of licenses, utilizing postcode level ambulance attendance data; and (b) estimate the effect of access to alcohol on perpetration and victimization of family violence in ambulance attendances.
Methods
This cross-sectional study of the relationship between alcohol outlet accessibility and family violence-related ambulance attendances used spatial autoregressive models to control for neighborhood autocorrelation among observed and unobserved variables. In this article we define family violence as violent or aggressive actions toward adult family members, including intimate partners (current or ex), siblings, and parents. Violence against children has not been included in these analyses.
Family Violence Ambulance Attendance Data
Coded ambulance clinical records associated with alcohol or other drug, mental health or suicide and self-harm between July 1, 2016 and June 30, 2018 were accessed to identify those attendances associated with family violence in the Victorian component of the National Ambulance Surveillance System (NASS). NASS is an ongoing collaboration between Turning Point, Monash University, Eastern Health, and Australian national ambulance services, in this case, Ambulance Victoria (AV).
Methods for data collection and coding from NASS have been previously described (Lubman et al., 2020), but are outlined here briefly. Data were provided to Turning Point from AV as an output of their clinical information system. Ambulance attendances were filtered by AV to identify cases involving alcohol, drugs (licit and illicit) or mental health (including self-harm) presentations. This filtered dataset was provided to Turning Point, case notes were de-identified and transferred into a custom-designed database where coding and classification of cases was performed by a specialist team of research assistants. Each record was individually scrutinized and a systematic, validated coding system was used to capture information held in the clinical notes. Paramedics complete an electronic patient care record for each patient that they attend and record detailed information based upon their clinical acumen, information provided by the patient and others on the scene, and other evidence available at the scene.
Case ascertainment of family violence was defined as a violent incident when the relationship of the parties involved were: a partner or ex-partner, parent, or other family member, regardless of whether violence was the main reason for the ambulance attendance. Case classification further defined the case by: (a) type of violence: threat, physical violence or sexual violence, (b) patient as violence perpetrator (an individual who was the aggressor of violence), victim-survivor (an individual who was the victim of violence) or both (individual who was both an aggressor and victim of violence). For this analysis, all familial relationships (a partner or ex-partner, parent, or other family member) and types of violence (threat, physical violence, sexual violence) were collapsed into one “all family violence” variable. The contribution of alcohol in each attendance was defined as (a) alcohol intoxication: paramedic clinical assessment of intoxication, supported by the reported alcohol quantity consumed, or (b) no alcohol intoxication: alcohol intoxication not identified. As alcohol intoxication is not always clearly identifiable, even to trained observers (Brick & Erickson, 2009), coding of alcohol intoxication was conservative, therefore intoxication is likely to be underestimated, especially as this database does not include any verification of the amount of alcohol consumed.
Socioeconomic Status and Demographic Data
Socioeconomic status and population data for each postcode were obtained from Australian Bureau of Statistics (ABS; 2016). We used the Socio-Economic Indexes For Areas Index of Relative Socio-economic Disadvantage (SEIFA–IRSD) 2016 database, where a low score indicates relatively greater disadvantage, for example, many households with low income, many people with low levels of education, or many people in low skilled occupations. SEIFA scores ranges from 500 (the most disadvantaged) to 1174 (the least disadvantaged). SEIFA scores are standardized against a mean of 1000 with a standard deviation of 100.
Liquor License Data
Liquor license data were sourced from the publicly available Victorian Commission for Gambling and Liquor Regulation (VCGLR), July 2017 database (VCGLR, 2017). We assumed that the change in license numbers and types between financial year 2017 and 2018 to be very minimal. Postcode aggregated data of each type of license were calculated and their density rates per 100,000 residential population were estimated. This study included the six most frequent types of liquor licenses: restaurant, packaged liquor, limited license, on-premises, restricted club, and general license. Of note, for this analysis, an integrated on-premises (late night) license variable composed of on-premises and late night on-premises licenses was used. Similarly, general (late night) licenses was an integrated variable for general license and late night general license. Producer, full-club, and pre-retail were not included in this analysis because of limited accessibility and small number of outlets. Restaurant and café licenses (5,806 in Victoria July 2017) authorize sale of alcohol consumption on the premises of a restaurant or café. Packaged liquor licenses (2,040 in Victoria July, 2017) applied to retail liquor stores (e.g., bottle shop) or supermarkets selling packaged alcohol for consumption off the premises. Limited licenses (4,810 in Victoria July, 2017) authorized the sale of limited amounts of alcohol, and apply to club and community groups. On-premises licenses (1,948 in Victoria July, 2017) and on-premises (late night) licenses (355 in Victoria July, 2017) authorize the sale of alcohol for consumption on the premises and apply to bars and nightclubs, as well as other related businesses that supply alcohol. Restricted club licenses (903 in Victoria July, 2017) authorize the sale of alcohol to members of a club at set times. General licenses (1,571 in Victoria July, 2017) and late night general licenses (484 in Victoria July, 2017) authorize the sale of alcohol consumption on and off premise, and apply to pubs, hotels, and holiday resorts. The liquor outlet densities were calculated for each of these license types as the rate per 100,000 residential populations.
Geographic Unit of Analysis
Postcodes were selected as the smallest geographic unit of analysis possible with the statistical software. Analysis covered 694 postcodes from the state of Victoria and excluded 4 postcodes without a residential population, and 19 postcodes where spatial and socioeconomic information were not available. Data were adapted from the ABS, population survey 2016. This study included a total population of 5,916,313 with the average resident population of 8,524 (SE: 486.20) per postcode. Family violence-related attendances were allocated to a postcode based on the ambulance attendance location, and cases that occurred outside of Victoria were excluded.
Analysis
As a part of exploratory analysis, choropleth maps of distribution of alcohol outlet and family violence-related ambulance attendances were created. The empirical strategy was based on the estimating of spatial regression models, after Moran’s index (Moran’s I) test was used to measure spatial dependence among the observed family violence measures and residual spatial variations. Through this process, the effect of neighboring postcodes in the input data were taken into account to ensure parameter estimation was unbiased (StataCorp, 2019). The general functional form of the spatial lag model is expressed as:

where Y is n × 1 vector of observations on family violence, ρ is a spatial autoregressive coefficient, the
For compatibility of count data with the spatial autoregressive models and controlling overdispersion, rate of alcohol-related attendances, density of outlets, and rate of family violence-related attendances for each postcode were adjusted using zero inflation negative binomial regression estimators. SEIFA, mean age of attendances, and postcode population were used as covariates of both the main regression and inflation models.
All data analyses were conducted in Stata 15.1. Ethics approval was obtained from the Eastern Health Human Research Ethics Committee.
Results
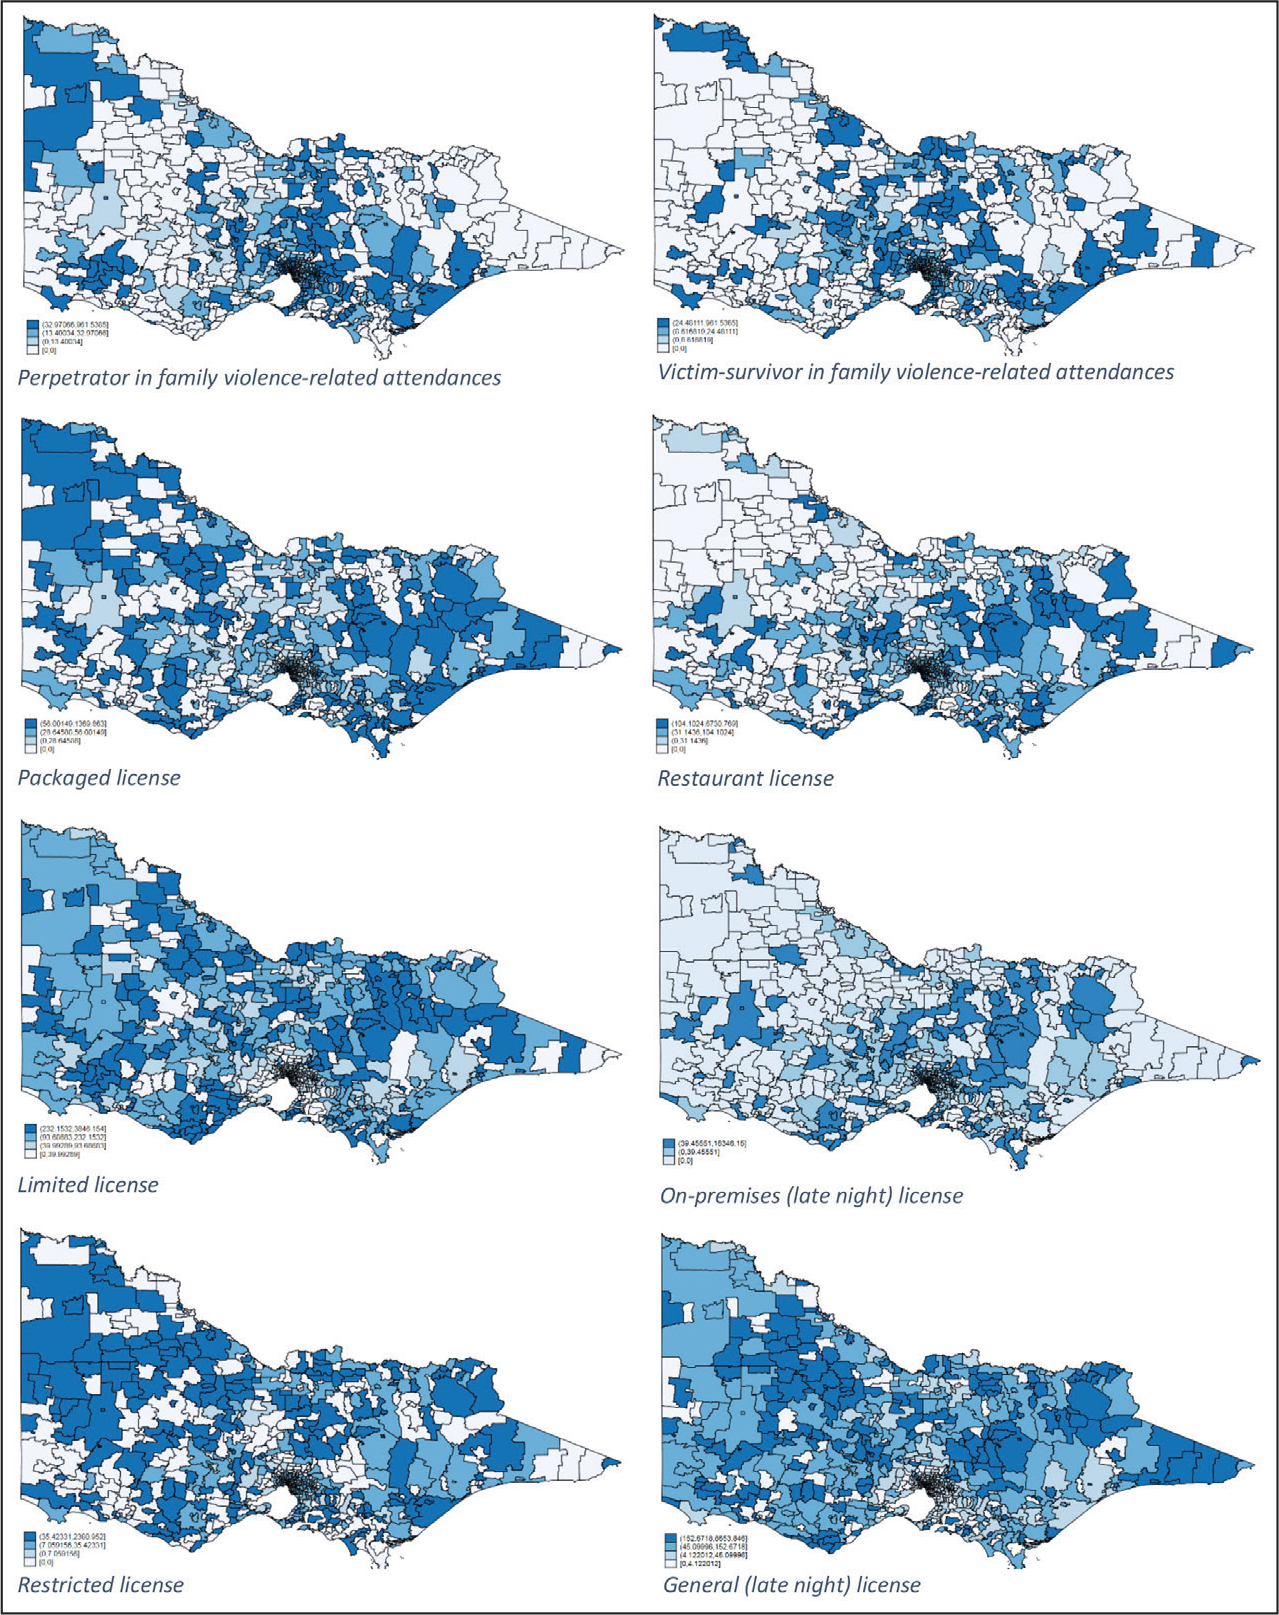
Descriptive statistics of study measures are provided in Table 1. The family violence-related attendances and liquor license rates per 100,000 population are presented in Figure 1, which shows the strong spatial clustering of family violence and outlet densities. Apart from the central regional and metropolitan postcodes which showed similar distributional density for both victim-survivor and perpetrator-related attendances, perpetrator-related attendance rates tended to be more concentrated in western regional postcodes and victim-survivor-related attendances in the eastern regional postcodes. The north and central, including metropolitan, postcodes demonstrated a similar concentration of victim and perpetrator-related attendances.
Rate of alcohol outlets and mean family violence-related attendances per year by 100,000 population and postcode in Victoria, July, 2016 to June, 2018.
Descriptive Statistics of Family Violence and Alcohol-related Attendances, Alcohol Outlet Types, and Population Variables Per Postcode.
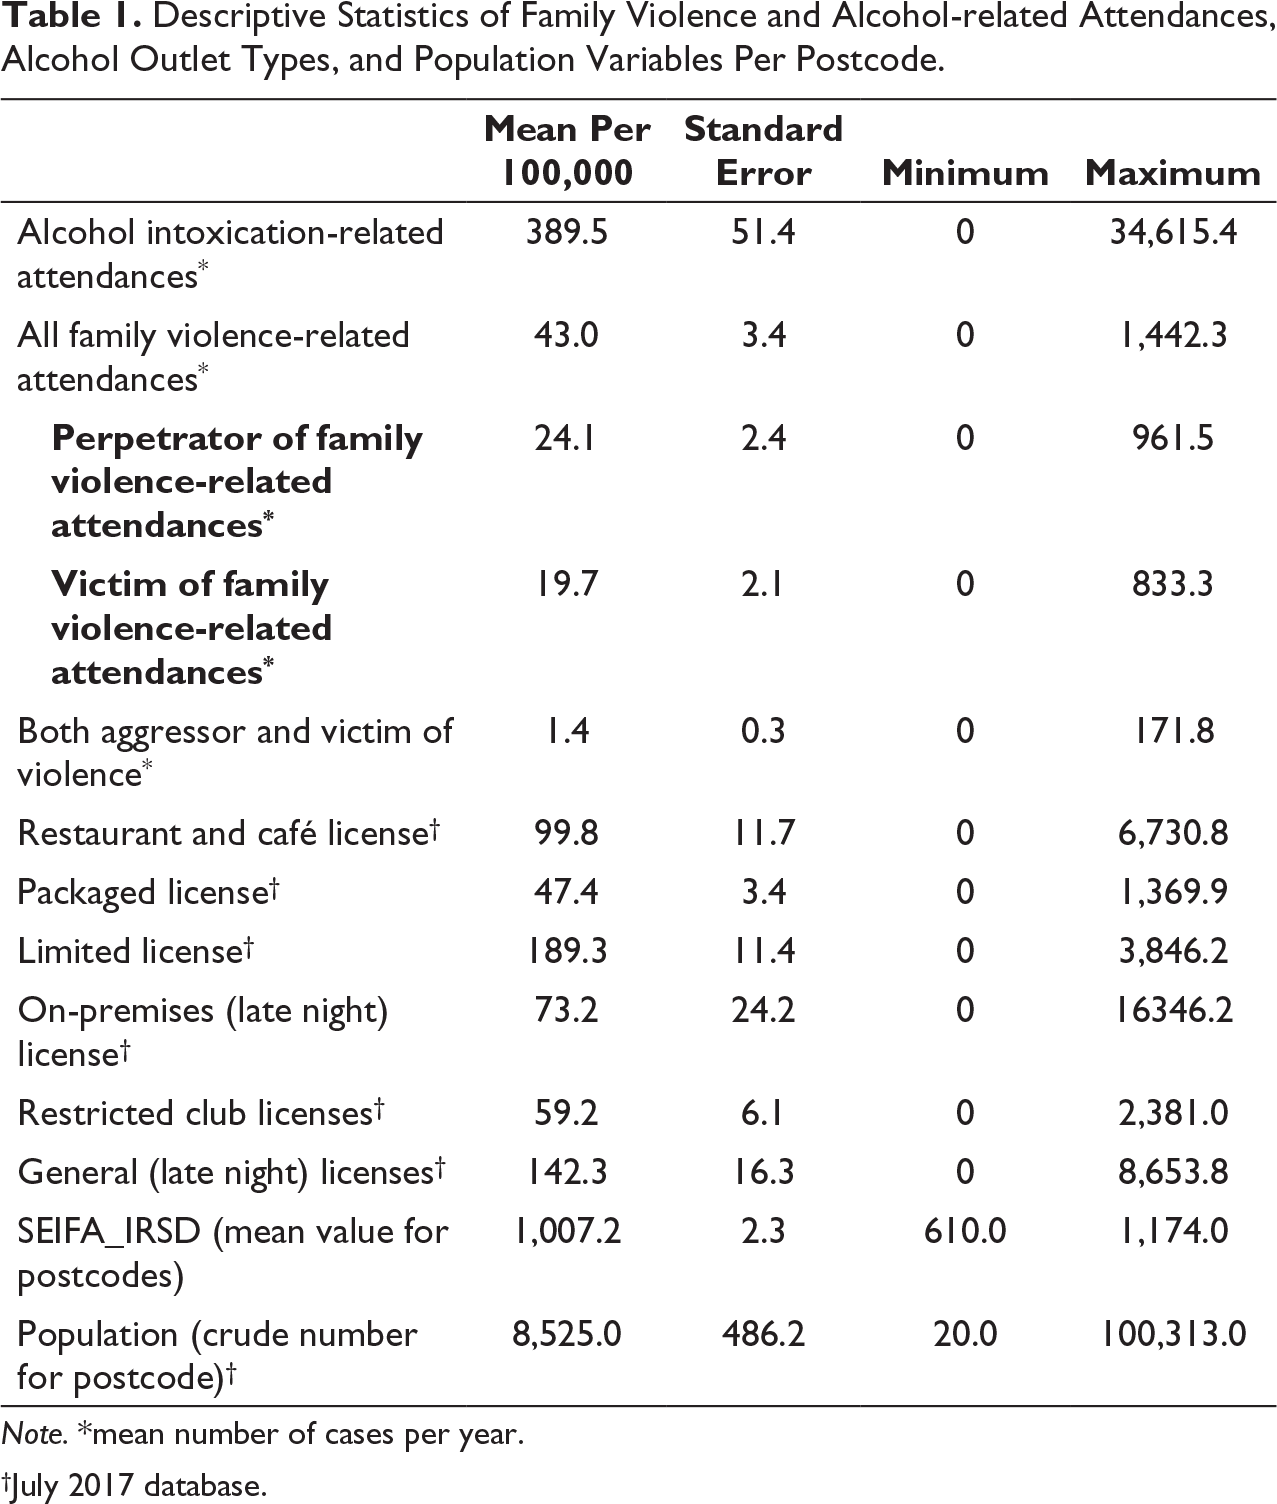
Note.*mean number of cases per year.
†July 2017 database.
Tables 2 to 5 display the estimated direct, indirect (spillover), and total effects from the spatial autoregressive models by type of alcohol outlet and role of perpetrator and victim-survivor. For simplicity, the values of coefficients for the aggregated number of alcohol-related attendances per postcodes were not presented. The overall family violence models found significant positive effects; with the most substantial effect for on-premises (late night) licenses, followed by restaurant and packaged licenses, with an increase of one outlet per 100,000 population related to an increase of 1.73 (SE: 0.18, p value: < .001), 0.83 (SE: 0.28, p value: .003) and 0.62 (SE: 0.06, p value: < .001) of family violence-related attendances per 100,000 population, respectively (Table 2). The test of association between general (late night) licenses and family violence was not significant. Interestingly, the spillover effect for on-premises (late night) license was negative. The effect of total licenses on overall family violence-related attendances was small but significant, with an increase in the overall rate of liquor license density of one outlet per 100,000 population resulting in an increase in the family violence rate of 0.13 (SE: 0.01, p value: < .001; Table 5).
Spatial Regression Models, With Zero Inflation Predicted Values for Total Family Violence (Perpetrator and Victim) and License Density Variables, All Family Violence and Separate Models for Each License Type.
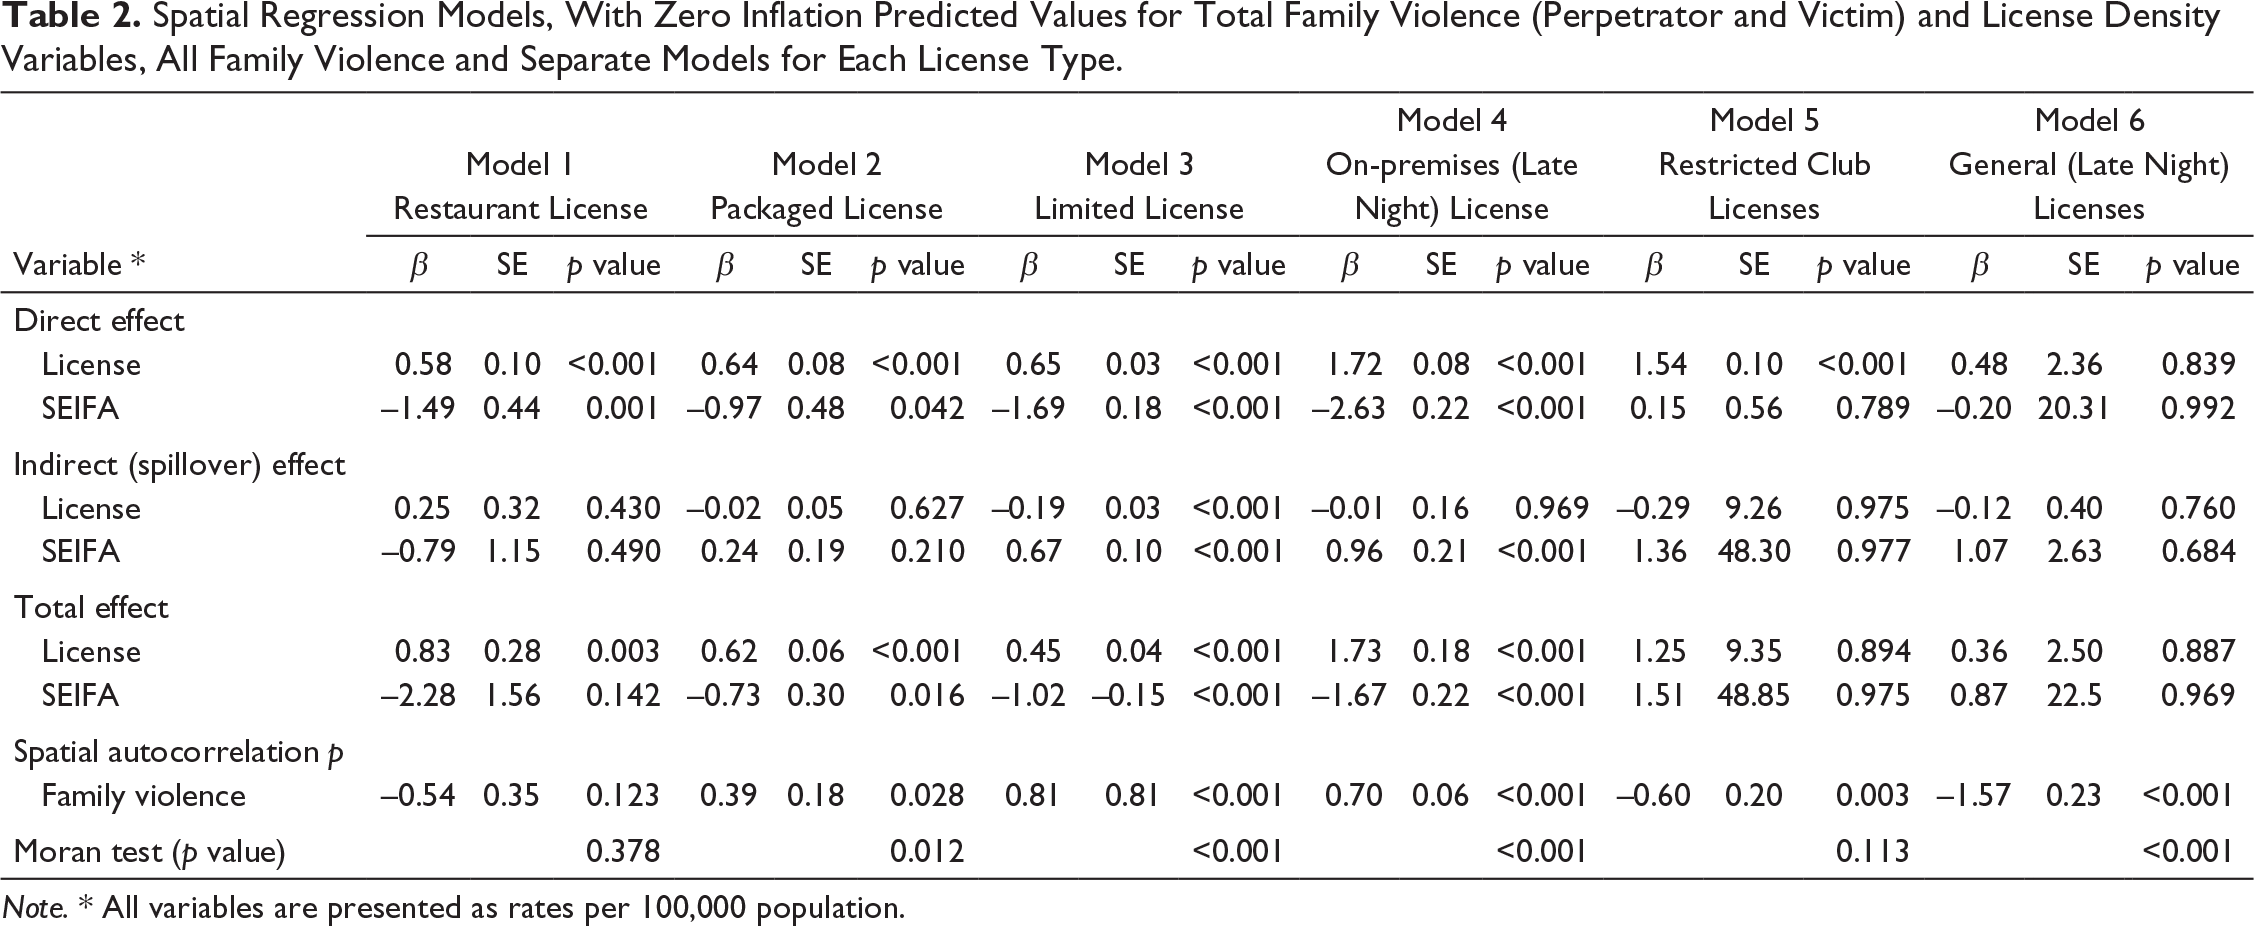
Note. * All variables are presented as rates per 100,000 population.
Spatial Regression Models, With Zero Inflation Predicted Values for Family Violence and All Type License Density Variables.
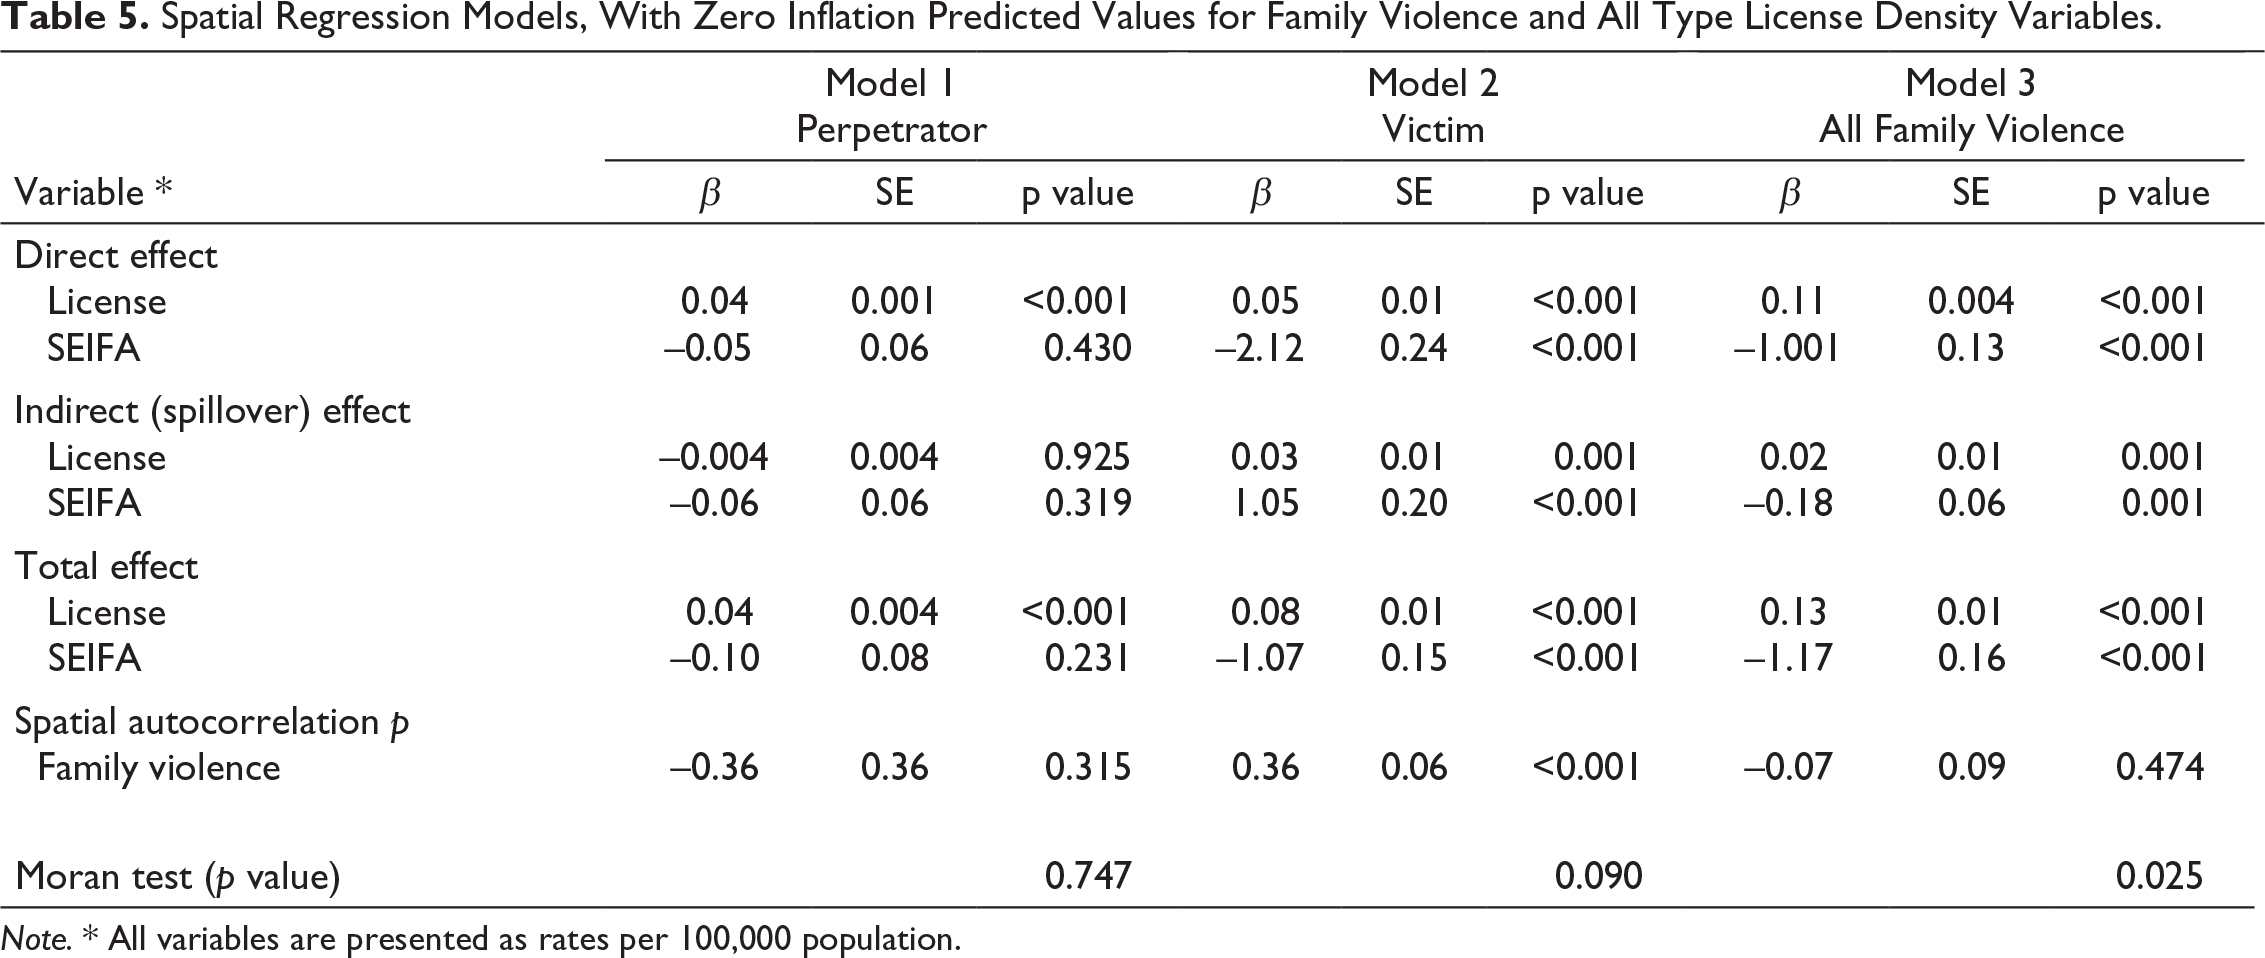
Note. * All variables are presented as rates per 100,000 population.
Breakdown of the family violence incident into perpetrator and victim-survivor related attendances showed notable findings. There were significant associations with perpetrator-related attendances, regardless of the type of license. On-premises (late night) licenses showed the largest effect (0.85 [SE: 0.04, p value: < .001]) followed by restricted club licenses (0.71 [SE: 0.17, p value: < .001]) as seen in Table 3. Table 4 shows victim-survivor related attendance models found a significant positive effect for almost all categories of liquor licenses, with the largest effect per 100,000 population for restricted club licenses 1.18 (SE: 0.20), followed by on-premises (late night) licenses 1.15 (SE: 0.19), restaurants 0.46 (SE: 0.05) and packaged licenses 0.40 (SE: 0.05). The effect of total licenses (grouped) on perpetrator and victim-survivor related attendances were significant, with the coefficient of 0.04 (SE: 0.004) and 0.08 (SE: 0.01), respectively (Table 5).
Spatial Regression Models, With Zero Inflation Predicted Values for Family Violence (Perpetrator) and License Density Variables, All Family Violence and Separate Models for Each License Type.
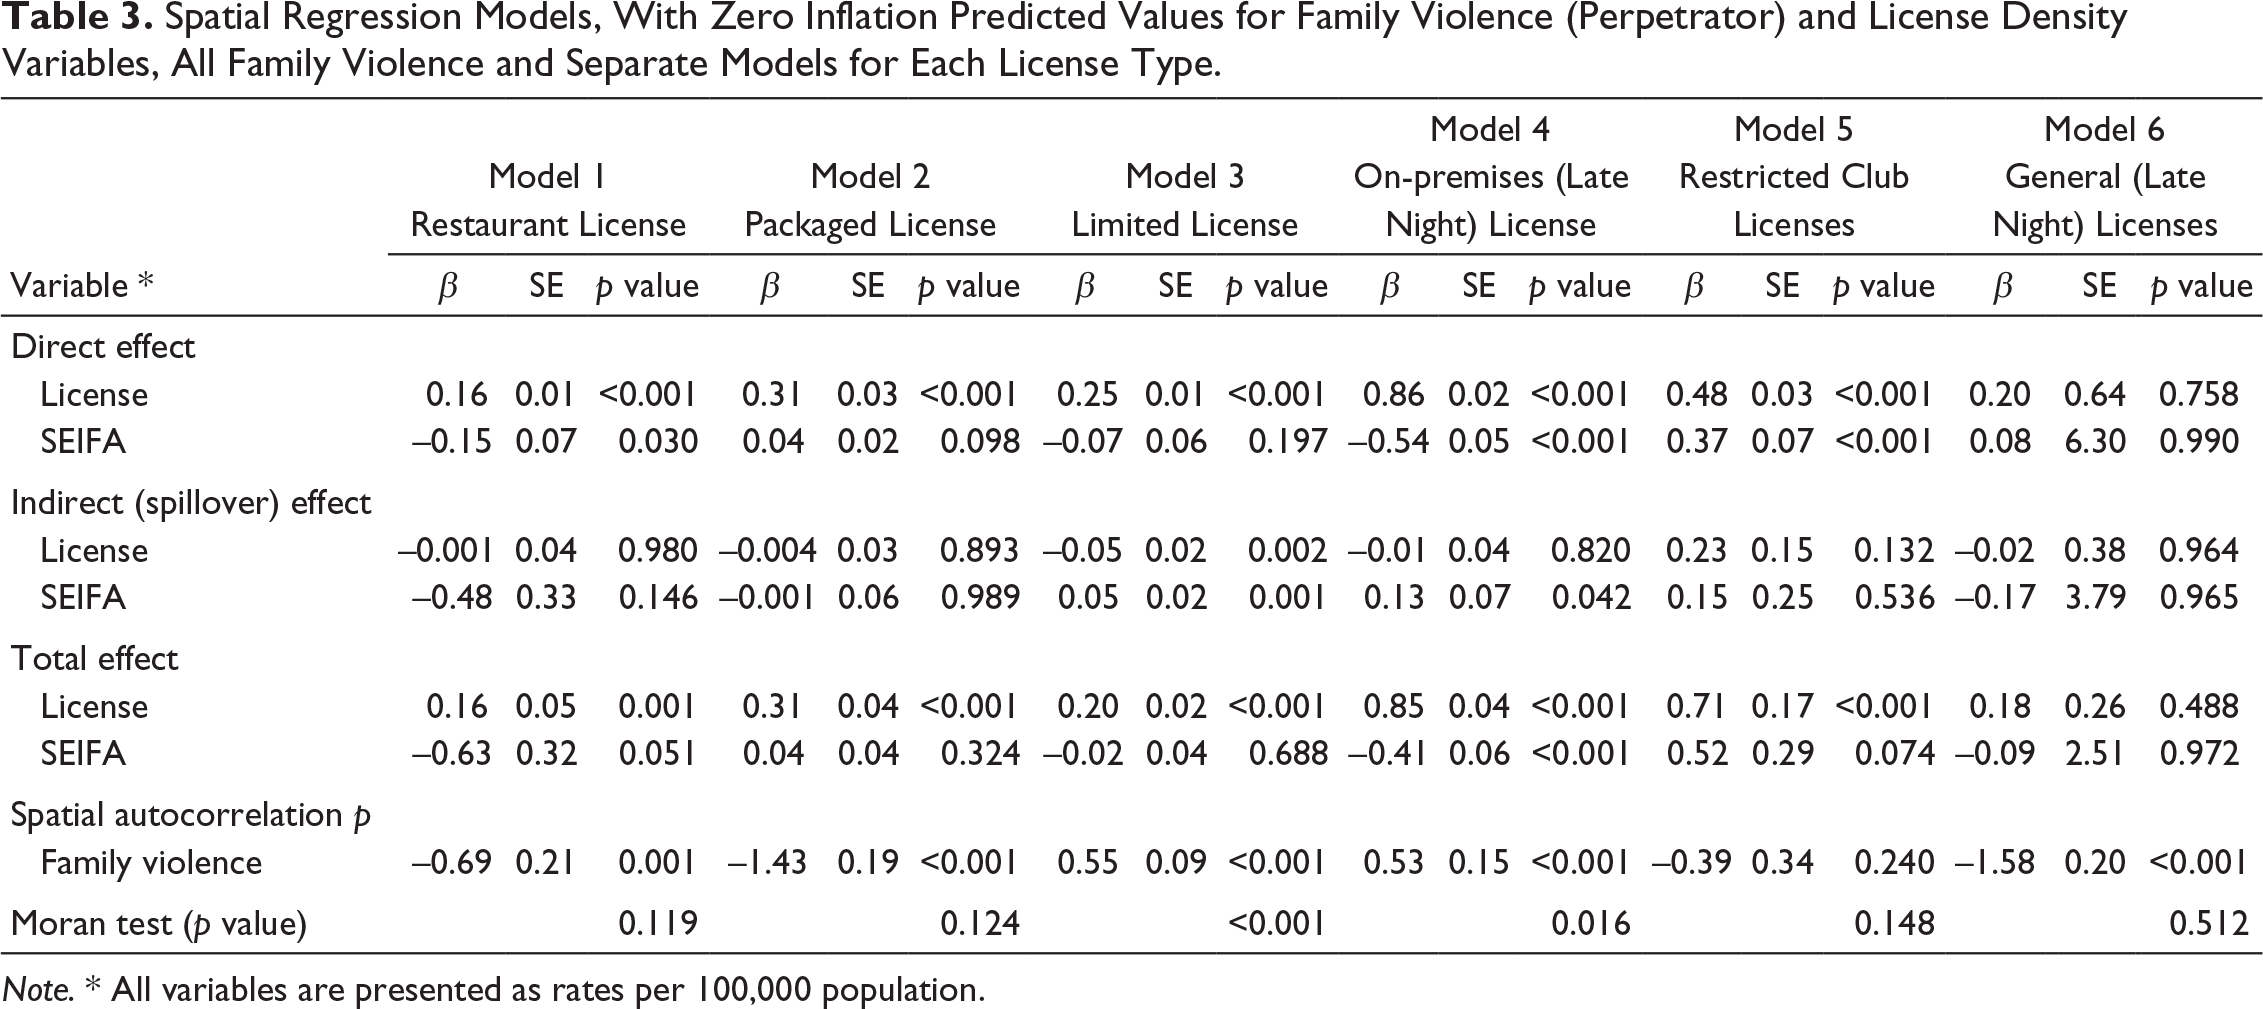
Note. * All variables are presented as rates per 100,000 population.
Spatial Regression Models, With Zero Inflation Predicted Values for Family Violence (Victims) and License Density Variables, All Family Violence and Separate Models for Each License Type.
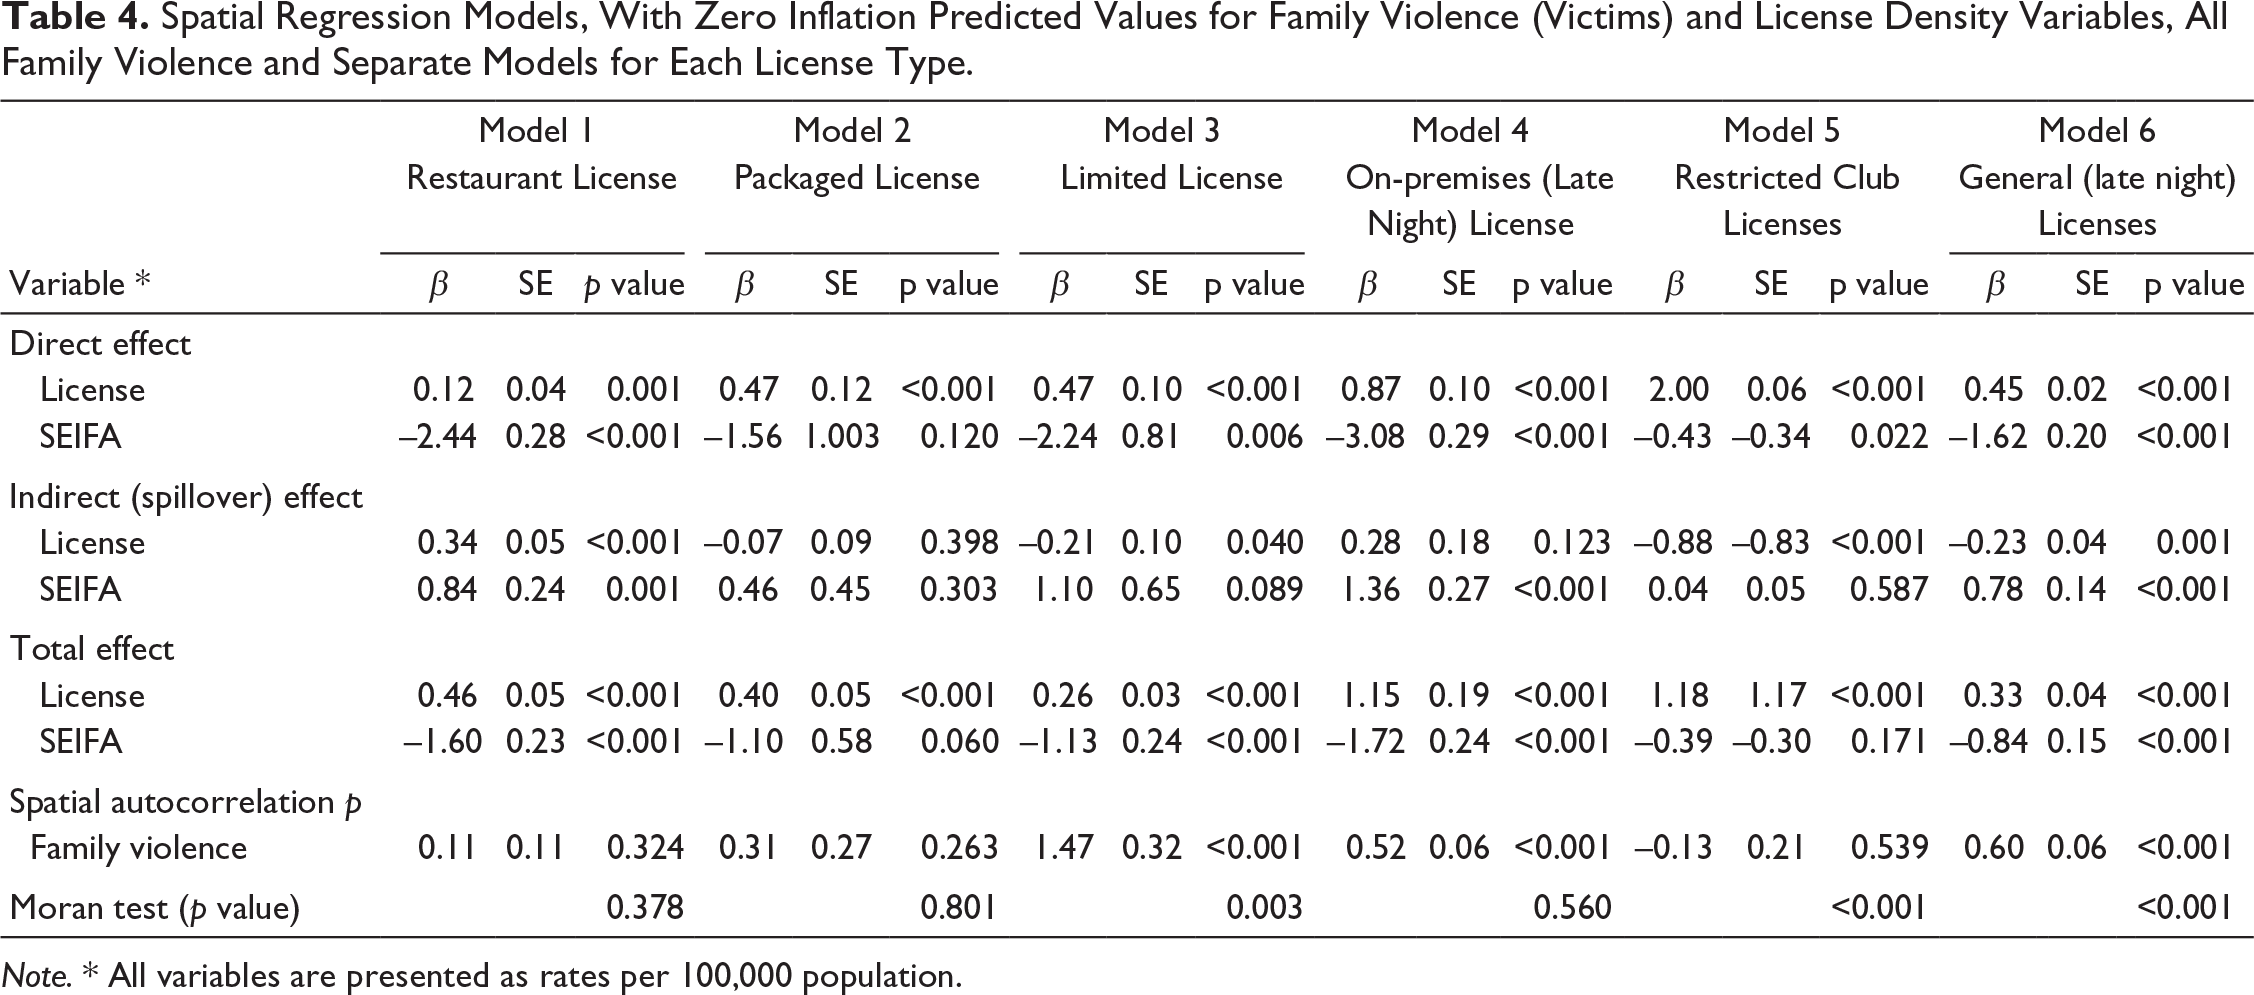
Note. * All variables are presented as rates per 100,000 population.
There was a significant and negative effect of socioeconomic disadvantage index, SEIFA–IRSD, which was consistent across the majority of models. The magnitude of association was higher for victim-survivor related family violence attendances. The Moran I statistics were positive and statistically significant for the majority of the models. The spatial autocorrelation coefficients were positive and significant for total license models (Tables 5) and most of perpetrator-related models.
Discussion
Greater access to alcohol outlets in Victoria was significantly associated with increased family violence-related ambulance attendances, even after controlling for neighborhood contextual autocorrelation. The association between alcohol outlets and family violence depended on the type of license, and the role of the patient as a perpetrator or victim. On-premise (late night) and restaurant outlets showed the strongest associations but other types of license, including off-premise licenses were related to higher family violence attendances. This may be associated with drinking cultures associated with sporting and/or other community clubs given that previous research has reported that harm minimization strategies including sufficient training of serving staff and hosting of alcohol-free functions has been absent in these settings (Snow & Munro, 2000). Additionally, other factors may play a moderating role between the availability of alcohol within a community and the likelihood of interpersonal violence (IPV) being experienced. For example structural factors associated with a perceived neighborhood’s social disorder (e.g., crime, greater levels of social disturbance, drug selling, or the presence of graffiti), have been shown to moderate the relationship between alcohol and IPV (Cunradi, 2007; Gorman et al., 2001). In the context of the present study, increased alcohol outlet density may impact on a community’s social disorder, particularly with respect to on-premise and late-night licenses where more people are drawn to the neighborhood to drink alcohol.
Previous studies in Victoria have reported discordant effects of packaged liquor license outlet density; cross-sectional studies have found no significant association between packaged alcohol outlet density and family violence (Livingston, 2010), however longitudinal studies demonstrate that as packaged liquor license outlet density increases so do family violence incidents recorded by police (Livingston, 2011). Our study not only confirmed the role of off-premises alcohol outlets but also demonstrated the importance of on-premises licenses. This supports recent survey findings indicating that alcohol consumed within a family violence incident is most likely to be purchased between 500m and 10km from a person’s home (Miller et al., 2016), and are consistent with the findings of Victorian Lifestyle and Neighborhood Environment Study (VicLANES; VicHealth, 2017) which reinforces the importance of the proximity of alcohol outlets to home and family violence. This evidence suggests that the role of access to alcohol outlets in family violence is complex and may involve a combination of several factors.
Although the available evidence about the strength of association between type of alcohol outlets and violence is not consistent (Trangenstein et al., 2019), this study revealed that access to on-premises outlets had the strongest association with family violence. The significance of alcohol intoxication in the victim-survivor of family violence-related ambulance attendances, and the substantial relationship with spatial access to alcohol outlets, were the key findings of this analysis. Furthermore, positive association between typical consumption of alcohol and the association with victim-survivor status in family violence has been well documented in the literature (Bryan et al., 2016).
The complexity of this social health issue highlights the need to conceptualize an overarching approach including ecological frameworks and public health strategies across multiple domains and sectors for prevention of family violence and victim-survivor oriented approaches to safety. We used ambulance attendance data to explore the relationship between alcohol outlet density and different roles of family violence (perpetrator and victim-survivor). Overall, rates of family violence were relatively low compared to other studies (Livingston, 2011; Miller et al., 2016), although this is may be expected as ambulance services are normally called for medical reasons, as opposed to police who are more often called to disturbances or threats. Previous Australian studies have used police data (Livingston, 2010), or general population surveys (ABS, 2017) to quantify family violence. Surveys have generally found that only around a third of all violence is reported to police (ABS, 2017; Miller et al., 2016), although we are not aware of any population surveys that quantified the percentage of family violence incidents that were attended by an ambulance. Our data overlap with police family violence data to some extent, with almost three-quarters of cases in our data co-attended by police. However, this does not confirm that all these cases ended up being recorded as a “family incident” in police data. Studies investigating nightlife violence have found that around one-third of cases reported to ambulances were not recorded by police (Andrade et al., 2016).
Limitations and Future Directions
This analysis used spatial access autoregressive and negative binomial zero-inflated Poisson methods which have been found to be much more sensitive, precise, and stable than the commonly used count data of alcohol outlets and crime (Trangenstein et al., 2019); it can detect clustering and provide a gravity-based design that can include dimensions of outlet attractions. The major limitation of this study is that the data represent only cases involving an ambulance attendance for alcohol and other drug use, mental health and self-harm, and are reliant on paramedic clinical documentation. As such, this is not a complete dataset of all family violence cases, and it is currently unknown what proportion of all family violence incidents are reported to ambulance services, suggesting further research is required. However, with many cases of family violence reported to police (Taylor et al., 2016), this study is novel because it reports violence-related incidents that are not necessarily reported, allowing for a detailed analysis of a subset of family violence-related attendances. This supports calls for the use of clinical guidelines and interventions by paramedics to respond to IPV (Sawyer et al., 2021).
Ambulance services in Australia operate at the state/territory level, and provide pre-hospital emergency services and patient transport (Eburn & Bendall, 2010), thus providing access to the health system to Australia’s diverse multicultural community. Indeed, a strength of the present dataset is that NASS captures 82.5% of Australia’s population, with plans to increase its coverage in coming years (Lubman et al., 2020). Future research is required to further investigate these cases, including for potential causal moderators, by which alcohol may influence the severity of family violence, and by testing interventions which moderate alcohol availability and/or use with family violence as a defined outcome of interest. Replicating this analysis in other jurisdictions where ambulance data are available, or on datasets that filtered only for violence, not alcohol and other drugs and mental health, may confirm the generalizability and specificity of the results.
The article highlights the need for additional research into the impact of alcohol related harms associated with family violence—in particular more nuanced analyses to understand the role of alcohol in perpetrator and victim-survivor related violence and in specific types of family violence, for example, sibling to sibling, child to parent and parent to child.
Conclusion
We found a consistent association between family violence-related ambulance attendances and the accessibility of alcohol outlets, controlling for spatial autoregressive effects and socioeconomic status. This was particularly the case for victim-related attendances, and for cases that involved alcohol intoxication. These findings highlight the need for public health interventions and policies aimed at reducing alcohol-related harm. In particular licensing and town planning policies that restrict alcohol availability through a reduction in alcohol outlet density would contribute to reducing family violence-related harms. This is particularly important in more disadvantaged suburbs where the evidence demonstrates a strong association between family violence harms and alcohol availability.
Footnotes
Acknowledgments
We gratefully acknowledge the Research Assistant team at Turning Point, managed by Ms. Sharon Matthews, who code and create this unique dataset. We thank Ambulance Victoria for their partnership in this project, the Victorian Department of Health and Human Services for their funding of the Ambo Project, and the patients upon whom the dataset is based.
Declaration of Conflicting Interests
The author(s) declared the following potential conflicts of interest with respect to the research, authorship and/or publication of this article:
Dr Coomber reports grants from Australian Research Council, Queensland Government, Foundation for Alcohol Research and Education, Lives Lived Well, Australian Rechabites Foundation, and Northern Territory Government, outside the submitted work. Dr Miller reports grants from Australian Research Council, grants from Foundation for Alcohol Research and Education, grants from National Drug Law Enforcement Research Fund, grants from VicHealth, grants from Cancer Council Victoria, during the conduct of the study; personal fees from Greenland Legal Pty Ltd, outside the submitted work. Professor Lubman has provided consultancy advice to Lundbeck and Indivior and has received travel support and speaker honoraria from Astra Zeneca, Bristol Myers Squibb, Indivior, Janssen, Lundbeck, Shire, and Servier. Other authors report no conflicts.
Funding
The author(s) disclosed receipt of the following financial support for the research, authorship and/or publication of this article:
This study was funded by an Australian Institute of Criminology research grant (47 16-17), of which authors PM and DS are chief investigators, and from the Victorian Department of Health and Human Services that provides funding for ambulance data coding. Funding bodies had no involvement in the decision to publish this study.