
Abstract
About one in four U.S. high school students experience peer bullying victimization. Although discrimination based on socially stigmatized identities is increasing, there are few studies examining ethno-racial and religion-identity-based bullying (IBB), or whether school diversity or rural-urban settings modify such bullying experiences. We conducted a cross-sectional analysis of the 2016, 2019 and 2022 Minnesota Student Surveys of eighth and ninth graders. We assessed the associations of bullying victimization due to race/ethnicity/national origin and religion with school ethno-racial diversity, and geographical location by ethno-racial group using multilevel multivariate logistic regression models with random intercepts for schools. Overall, rates of ethno-racial and religious- based bullying were highest in rural (23.7%) and suburban (21.8%) schools. Ethno-racial-based bullying was higher among Black (44.2%), Black Latine (43.8%) and Hmong (40.4%) students in rural areas. Religion-based bullying was most prevalent in rural (10.1%) and urban schools (9.6%) and among Somali students across all locales (21.7% urban, 25.2% suburban and 28.4% town/rural). School ethno-racial diversity was protective against ethno-racial IBB only and for some groups (Black, Asian, multiracial) and not others (e.g., American Indian Alaskan Native, Somali, white). We found differences in the percentage of students reporting IBB by ethno-racial group, school diversity, and school geographic location. Generally, diverse school contexts were associated with a decrease in ethno-racial IBB for most students, especially in suburban schools. It is important to account for subgroup differences in addressing IBB to identify protective contexts. Our findings point to the need for systemic efforts to facilitate positive interpersonal relations in schools, such as policies and training that support teachers as role models and agents of socialization.
Introduction
“Unless our children begin to learn together, there is little hope that our people will ever learn to live together and understand each other.” Justice Thurgood Marshall, dissenting, Milliken v. Bradley (1974).
About 25% of adolescents in U.S. high schools experienced bullying in 2019, a 5% increase from previous years (Basile et al., 2020; Kann et al., 2018) and in 2023, national estimates indicated students who regularly used social media were more likely to experience bullying victimization at school and electronically (Young et al., 2024). Bullying is repetitive aggressive behavior(s) by peers in the context of observed or perceived power imbalances (Gladden et al., 2014). Bullying is a form of interpersonal violence that imposes a burden on adolescents and undermines healthy adolescent development over the life course (CDC, 2024; McDougall & Vaillancourt, 2015). Some adolescents experience interpersonal violence more often: girls and sexual minority youth report more bullying and sexual violence (CDC, 2016), and ethno-racial minoritized youth are disproportionately impacted by racism and gun violence, especially Black boys (Riehm et al., 2021; Vasan et al., 2021).
Evidence of bullying due to race and ethnicity is not conclusive and depends on how bullying is measured and defined (Gladden et al., 2014; Rivara et al., 2016; Spriggs et al., 2007). For example, in the 2017 (Kann et al., 2018), 2020 (Basile et al., 2020), and 2021 (Clayton et al., 2023) national CDC Youth Risk Behavior Surveys (YRBS), Black and Latino youth reported less bullying victimization than white peers. However, YRBS measures bullying in broad, unspecific categories and does not delineate types of bullying. Such global measures typically yield lower prevalence estimates among ethno-racially minoritized youth (i.e., historically marginalized; Flanagin et al., 2021) compared to more specific measures of bullying, for example, specific questions on racist-/sexist-motivated bullying (Sawyer et al., 2008). Furthermore, the prevalence of bullying does not only depend on one’s ethno-racial identity, but also on the ethno-racial composition of the school one attends (Vitoroulis & Vaillancourt, 2015), which many surveys, such as the YRBS, do not capture. Lastly, how ethno-racial identity is defined matters and varies: North American studies typically capture participants’ race, and these studies indicate that school ethnic diversity is protective for bullying. In contrast, European studies focus on immigration status in measuring student identity with mixed results regarding the effects of school diversity (Basilici et al., 2022).
The motivation behind bullying matters: bullying based on students’ social or minoritized identities, for example race, religion, disability, and sexual orientation, is associated with more deleterious health outcomes than bullying that is not aimed at characteristics that are highly defining of one’s identity (Galán et al., 2021; Russell et al., 2012). Identity-based bullying (IBB) is motivated by a victim’s actual or perceived membership in a legally protected class. Consequences of IBB include depression, suicidal behaviors, low academic performance, truancy, substance use (Jones et al., 2018; Russell et al., 2012; Sinclair et al., 2012), delayed medical care and homicide survivorship (Galán et al., 2021). Further, the theory of intersectionality illustrates how multiple individual social identities reflect interlocking systems of privilege and disadvantage at the societal level (Bowleg, 2012; Crenshaw, 1991). Thus, experiences of victimization are unique for each intersection of contexts/individual identities and can be the outcome of prejudice based on multiple, distinct and yet connected identities (Chakraborti, 2012). Bullying because of one’s race/ethnicity is associated with additional victimization for other characteristics: disability, religion and sexual orientation (Galán et al., 2021; Mendez et al., 2016). Studies in the United States and Europe indicate that religious intolerance can also lead to bullying (Durkin et al., 2012), especially toward those identifying with certain minoritized religions such as Sikhism, Islam and Judaism. Forecasted demographic changes in the United States have resulted in aggressive reactions due to colonial tropes, negative media depictions and white supremacy notions (Wilkerson, 2020) among those who perceive decreasing white population shares as a threat. This is evidenced by a rise in hate crimes in the United States (Southern Poverty Law Center, 2019). The FBI (2023) report on hate crimes indicates that race/ethnicity/ancestry (52.5%) and religion (22.5%) were among the leading reasons for bias-motivated offenses and prior reports in 2020 saw the highest increase in these offenses in 13 years. In 2023, the CDC reported that 31.5% of high school students experienced racism in school, most frequently Asian (56.9%), multiracial (48.8%) and Black students (45.9%) (McKinnon et al., 2024).
Student racial composition, contorted by de-facto segregation, and incidents of bullying in schools have led to human rights investigations (Mpofu et al., 2022; Shockman, 2019) and lawsuits (Nero, 2022; Zehn, 2019). For example, in Cruz-Guzman v. Minnesota, the plaintiffs argued that school segregation by race and socioeconomic status contributes to academic achievement gaps (“Cruz-Guzman v. Minnesota,” Ongoing), but an appeals court ruled that an unintentionally racially imbalanced school system is not a violation of the state’s constitution, even if state action contributed to the racial imbalance (Marohn, 2022). The argument that states could not be held responsible for or required to address racial segregation in schools, because segregation was unintentional, had been affirmed by the Supreme Court in 1974 in Milliken v. Bradley (Nadworny & Turner, 2019). Scholars have debated the potential detrimental impacts of school segregation that occur regardless of the intended effect of policies. Diverse schools enable contact between different groups. Intergroup contact theory (Allport, 1954) posits that equal status, common goals, intergroup cooperation, authority support and sustained contact can reduce prejudice (Pettigrew et al., 2011). Conversely, threatening and competitive situations can facilitate negative contact (Pettigrew et al., 2011), and greater diversity may increase negative attitudes toward out-groups of different social status (migration, ethno-racial, religious), while increasing in-group positive attitudes (Benner & Graham, 2013; Vervoort et al., 2011; Yip et al., 2010), especially when out-groups are surrounded by prejudiced peers (Bayram Özdemir et al., 2018).
Group dynamics and contexts matter. Research suggests that an ethnic group’s numerical power is an important factor for peer victimization (Felix & You, 2011; Juvonen et al., 2018; Kuldas et al., 2021). Adolescents may experience less bullying in racially diverse schools (Benner & Graham, 2013; Graham, 2021; Vitoroulis et al., 2016), due to reduced power imbalances if groups are numerically balanced (Olweus, 2013). The National Academy of Sciences, Engineering, and Medicine recommends identifying contextual moderators of individual characteristics on bullying behaviors and experiences among vulnerable subgroups, including exploring how ethno-racial diversity within schools may be protective (Rivara et al., 2016). Thus, in this study, we examined associations of two types of bullying victimization, ethno-racial identity-based bullying (ethno-racial IBB) and religious identity-based bullying (religious IBB), with ethno-racial identity and ethno-racial school diversity. We hypothesized that (a) minoritized youth would report more incidents of ethno-racial and religious victimization compared to their non-Hispanic white peers (henceforth white), especially in rural areas, because in this Midwest study population, rural compared to urban settings are often less ethno-racially diverse; and (b) ethno-racially diverse school student bodies would buffer against ethno-racial IBB and religious IBB for all students.
Methods
Study Population
Data came from the 2016, 2019 and 2022 Minnesota Student Surveys (MSS). The MSS is a triennial statewide survey of 5th, 8th, 9th and 11th grade students in public schools. In this study, we included 8th and 9th graders and excluded 5th and 11th graders to avoid using data of the same students over multiple survey years. The MSS examines health behavior indicators, risk and protective social factors, including family and peer relationships; community connections; school climate and safety; and interpersonal violence and self-harm behaviors. Participation was voluntary, of the 330 public school districts invited, 85%, 81% and 70% participated in the 2016, 2019 and 2022 surveys, respectively. Unless students attended exclusively online, all surveys of students whose parents consented were completed in-person during class, and on average, students took 26 min to complete the survey. MSS data are not weighted; however, our analyses focused on comparisons between geographic locales and by school diversity within ethno-racial groups, and not on comparisons between ethno-racial groups (Korn & Graubard, 2011). The final analytic sample comprised of 98,151 students. Given the anonymous nature of the MSS data, this study was exempted from a full IRB review at the University of Minnesota.
Measures
As the primary outcomes of interest, ethno-racial and religious identity bias-based bullying were assessed through two items (ethno-racial IBB and religious IBB) on how many times in the past 30 days students had been harassed or bullied by other students because of their (a) “race, ethnicity or national origin” or (b) “religion.” Response options ranged from “never” to “every day” and were dichotomized into ever versus never harassed. Each outcome was analyzed separately by ethno-racial group and geographical location based on the National Center for Education Statistics classification (city [labeled urban], suburban, rural, town; National Center for Education Statistics, 2021). To avoid unmasking the anonymity of students in areas with small populations, rural and town were combined, henceforth referred to as rural. Correlation of the two IBB items across groups varied, with a strong correlation (k = 0.63) for Somali students, moderate to low (k = 0.3) for Hmong and American Indian Alaskan Native (AIAN) students and weaker correlations (k ≤ 0.3) for all other groups.
The MSS included questions on race and ethnicity, and provided more granular details with each survey year; and options varied across MSS waves. The MSS allowed us to expand upon the U.S. Census Bureau designations to better reflect the racial and ethnic makeup in Minnesota. These groups account for the multiple intersectional identities that participants selected. Six items on race asked participants to “Mark all that apply” of (American Indian or Alaskan Native; Asian, South Asian or Asian American; Black, African or African American; Hispanic or Latino/Latina, Native Hawaiian or Other Pacific Islander; White and the 2022 addition of Middle Eastern or North African) and granular subgroups (e.g., Lao, Asian Indian, Burmese, Somali, Hmong). These items informed our creation of 10 mutually exclusive ethno-racial groups. We sought to avoid ethno-racial categorizations that often hide unique subgroup vulnerabilities within pan ethnic terms such as Asian and Black. Data disaggregation is a critical step toward accurately identifying where inequities lie and developing effective prevention strategies (Yi, 2024). Therefore, to create mutually exclusive racial and ethnic categories, we prioritized unique and meaningful classifications for students identifying with multiple groups, provided subgroup sample sizes permitted. For example, we included anyone reporting AIAN identity in combination with other races as AIAN because AIAN descendants are rarely AIAN only, and the AIAN population has the highest suicide rates in Minnesota. Similarly, we defined three Black subgroups as well as Hmong as distinct from other Asian populations, given the marginalization of Hmong populations as more recent refugee populations. The goal was to center populations impacted by significant historical injustices and continued intergenerational negative effects of racism, including acts of interpersonal violence. The resulting categorizations included, Hispanic/Latine, henceforth Latine (without race, all others were categorized as non-Hispanic); AIAN (alone or in combination with any other race); Somali; Black Latine (self-reported Hispanic ethnicity and any Black/African American/African race); Black/African American (alone or Black/white or Black other); Asian Hmong; other Asian; Native Hawaiian Pacific Islander (NHPI); white; and multiracial (three or more races).
The Simpson’s Diversity Index (SDI; Simpson, 1949) was used to measure ethnoracial diversity in schools across three survey years, an approach previously adapted for use in bullying scholarship (Graham et al., 2009; Juvonen et al., 2006). The SDI estimates the probability that any two students randomly selected belong to different ethno-racial groups, with scores ranging from 0 to 1, with higher numbers indicating greater diversity. For ease of interpretation, we used a 0 to 100 scale. Further, schools per survey year were classified as high diversity (SDI >0.50, i.e., a >50% chance that two randomly selected students would be from different groups) versus low diversity (SDI ≤0.50; Graham et al., 2009). We refer to our measure as Ethnoracial School Diversity Index (ERSDI). To address specific methodological limitations, we operationalized IBB as a binary rather than a continuous variable. Although dichotomizing continuous variables can reduce statistical power and lead to some information loss (Altman & Royston, 2006), our decision was necessitated by: (a) a high concentration of predominantly white schools in rural areas resulting in significant collinearity between geographical location and our school diversity variable (ERSDI); and (b) the ERSDI was heavily right-skewed with values clustering near 0, particularly among non-diverse schools. Thus, there was insufficient variability that made continuous modeling impractical due to violated linearity assumptions and unstable estimates. Classifying ERSDI as a binary variable resolved both issues. Furthermore, consistent with guidance on meaningful dichotomization thresholds (DeCoster et al., 2009), the cut-point was informed by the natural break in the ERSDI distribution. The index was calculated based on the full sample that included all white students in the dataset.
Sociodemographic Covariates
Multivariate analysis adjusted for grade, sex assigned at birth (male, female) and economic hardship, which was assessed through two items: skipping meals because a family did not have enough money to purchase food in the last 30 days; and staying in a shelter, a non-residential place, or someone else’s home because students had no place to stay in the last year. Responses were dichotomized as any versus no economic hardship. To further describe ethno-racial diversity, we assessed whether adolescents were in schools with at least 25% of the student body composition of similar ethno-racial identity. This variable was solely used as a sample descriptor and was not included in the final multivariate models. Teacher/student relationships were assessed using the teacher student relationships subscale of the School Engagement Inventory (Appleton et al., 2006), students believe teachers and adults in the school treat students fairly, listen to and care about students, and are interested in students as people. We used two 4-point Likert scale items to measure school safety, I feel safe at school, and I feel safe going to and from school.
Statistical Analysis
We compared student characteristics across ethno-racial groups using ANOVA and chi-squared tests as appropriate. We estimated adjusted probabilities of ethno-racial IBB and religious IBB using logistic regression models, adjusted for covariates, and associations between locale (urban, suburban, rural) and school diversity (low vs. high) within each ethno-racial group. We used a 10% simple random sample of white students (approximately the size of the next largest ethno-racial group) to prevent estimated associations in the regression models from being dominated by the much larger white student group. Models were clustered at the school level, that is, random intercepts for schools were used in multilevel regression models. We stratified analyses by locale and estimated predicted probabilities of IBB. Levels of IBB were graphed by ERSDI (SDI >0.50 vs. ≤0.50) and ethno-racial identity. All analyses were performed with SAS software, version 9.4 (SAS Institute Cary, NC) and STATA version 15 (StataCorp LLC, College Station, TX).
Results
The ethno-racial composition of the study population was Latine (22.0%), Somali (5.0%), Black Latine (1.0%), Black (19.0%), Hmong (6.0%), Asian (14.0%), NHPI (1.0%), AIAN (11.0%), white (18.0%) and multiracial (3.0%). Male (49.0%) and female (51.0%) students were evenly distributed across locales and slightly over half (51%) attended suburban schools. Overall, SDI scores ranged from 0 to 100, and scores were above average in urban (mean 61.6 ± 14.6) and suburban (mean 59.0 ± 15.9) schools and below average in rural schools (mean 38.1 ± 15.4).
Overall, students in urban areas attended the most diverse schools, and in rural areas, the least diverse. Hmong, multiracial, Black Latine and Black students attended the most diverse schools in urban areas. Hmong, Somali, Black Latine and Black students attended the most diverse schools in suburban areas, while Somali, Latine, Asian and Black Latine students attended the most diverse rural schools. In contrast, less than 3% of white students attended schools where the student body comprised at least 25% of students who were not white, that is, this group was most likely to attend the least ethno-racially diverse schools (Tables 1–3). Rates of ethno-racial-based bullying victimization were highest in suburban and rural schools, with the highest rates among Black (44.2%), Black Latine (43.8%) and Hmong (40.4%) students in rural areas. Overall, students in suburban M = 3.3 (SD = 0.6) and rural M = 3.3 (SD = 0.6) schools reported a slightly higher sense of safety compared to their peers in urban schools M = 2.9 (SD = 0.6). Religion-based bullying victimization was higher in urban and rural areas, but the highest rates were among Somali students in all three locales, especially in rural (28.4%) and suburban (25.2%) and urban (21.7%) schools. Additionally, Hmong (16.3%) and Black Latine (15.0%) students in rural schools also reported some of the highest rates of religion-based bullying victimization.
Sample Characteristics of Students in City/Urban Areas from the 2016, 2019 and 2022 Minnesota Student Surveys.
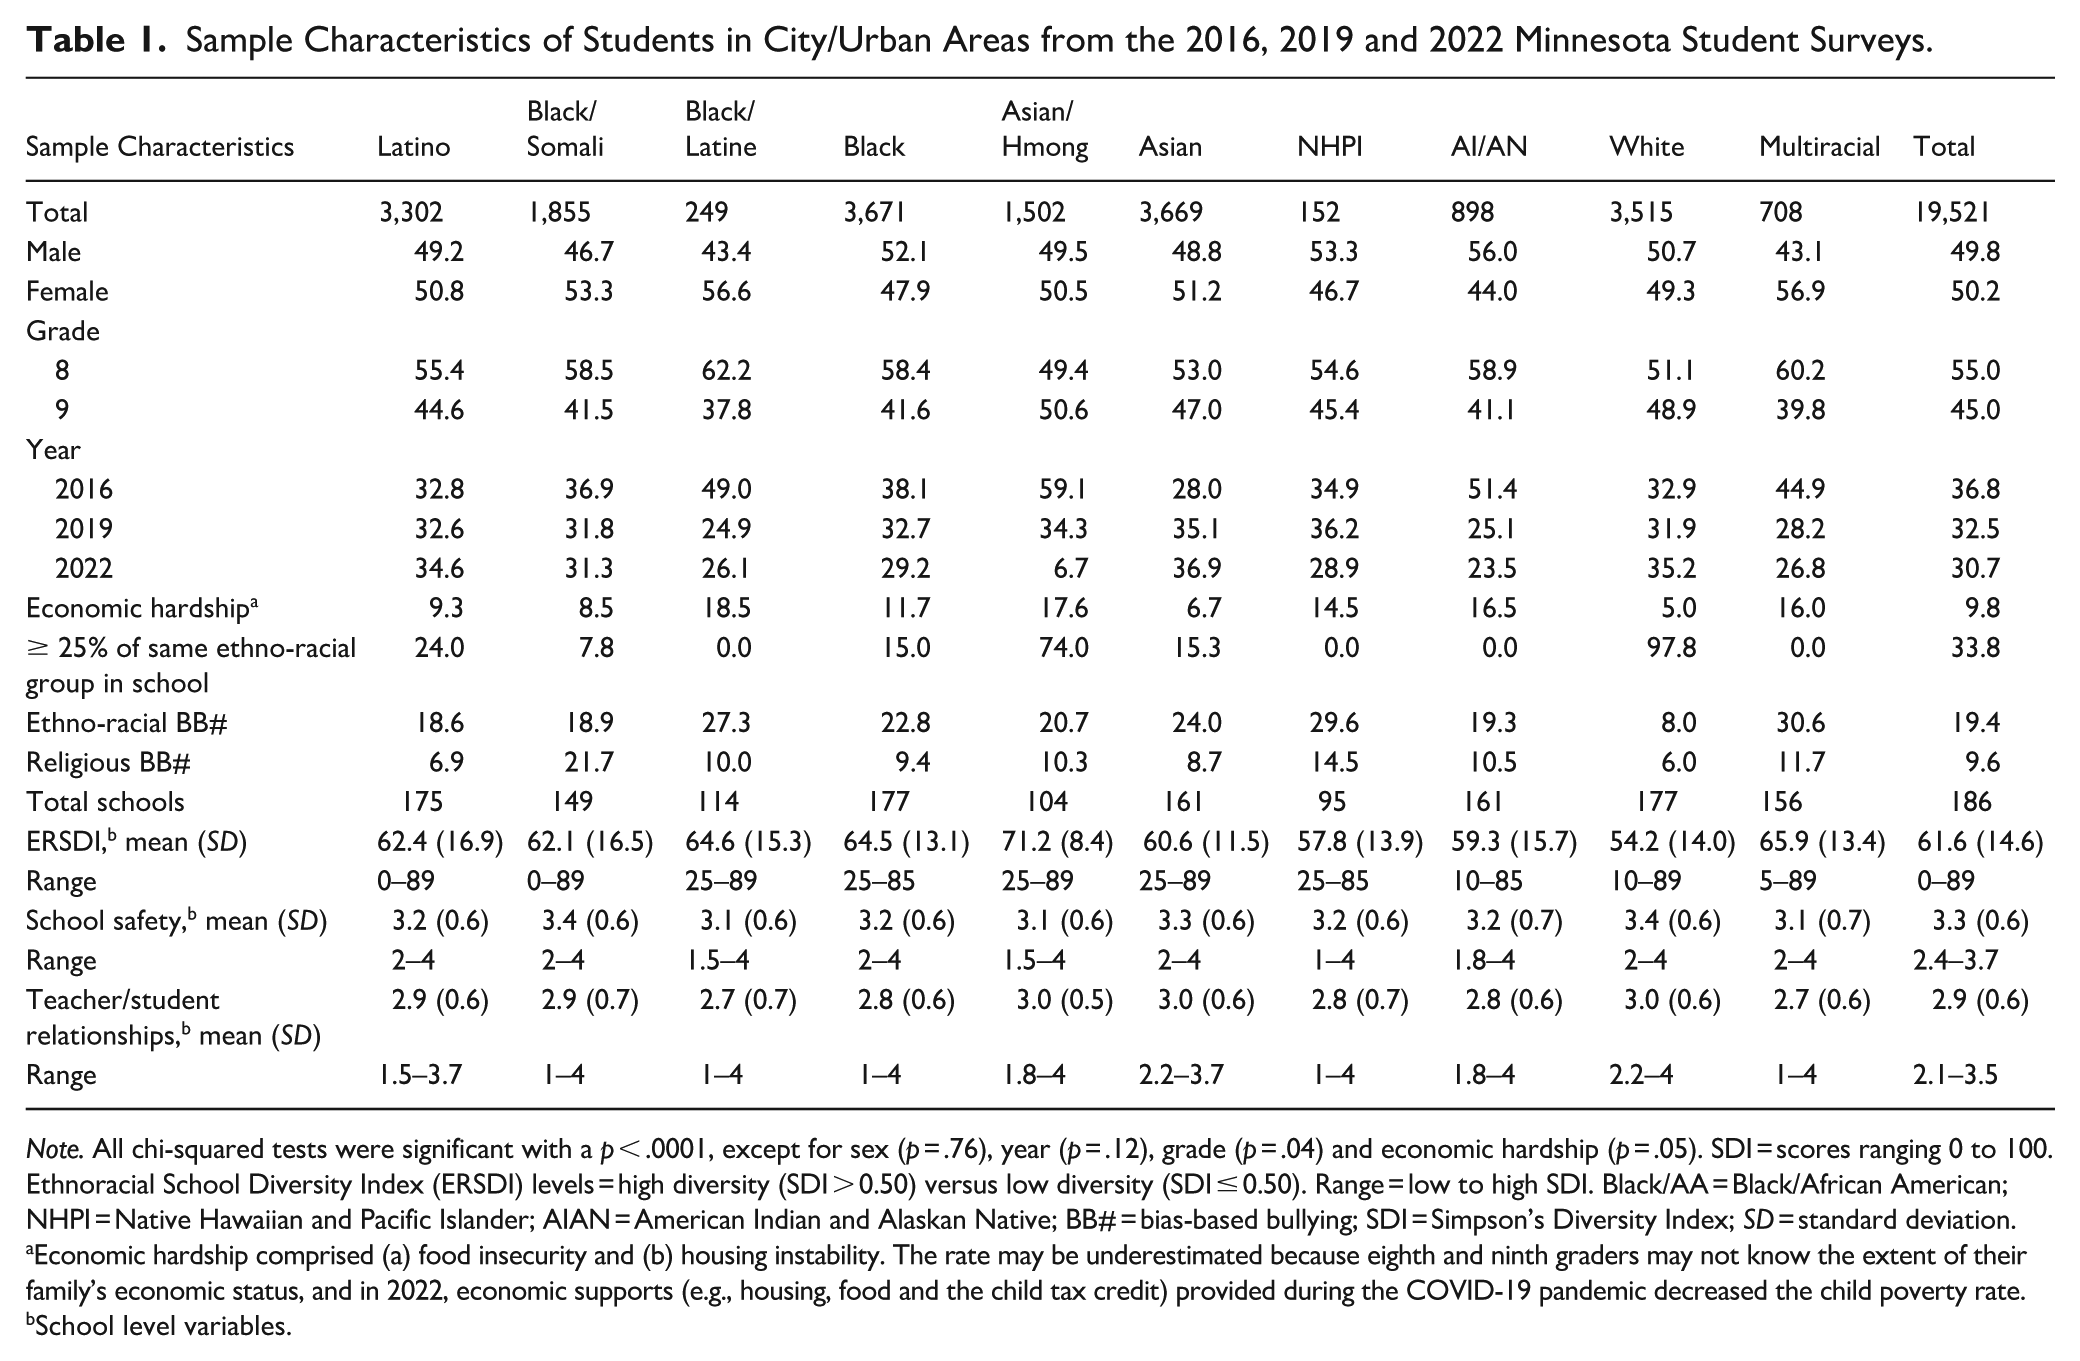
Note. All chi-squared tests were significant with a p < .0001, except for sex (p = .76), year (p = .12), grade (p = .04) and economic hardship (p = .05). SDI = scores ranging 0 to 100. Ethnoracial School Diversity Index (ERSDI) levels = high diversity (SDI > 0.50) versus low diversity (SDI ≤ 0.50). Range = low to high SDI. Black/AA = Black/African American; NHPI = Native Hawaiian and Pacific Islander; AIAN = American Indian and Alaskan Native; BB# = bias-based bullying; SDI = Simpson’s Diversity Index; SD = standard deviation.
Economic hardship comprised (a) food insecurity and (b) housing instability. The rate may be underestimated because eighth and ninth graders may not know the extent of their family’s economic status, and in 2022, economic supports (e.g., housing, food and the child tax credit) provided during the COVID-19 pandemic decreased the child poverty rate.
School level variables.
Sample Characteristics of Students in Suburban Areas from the 2016, 2019 and 2022 Minnesota Student Surveys.
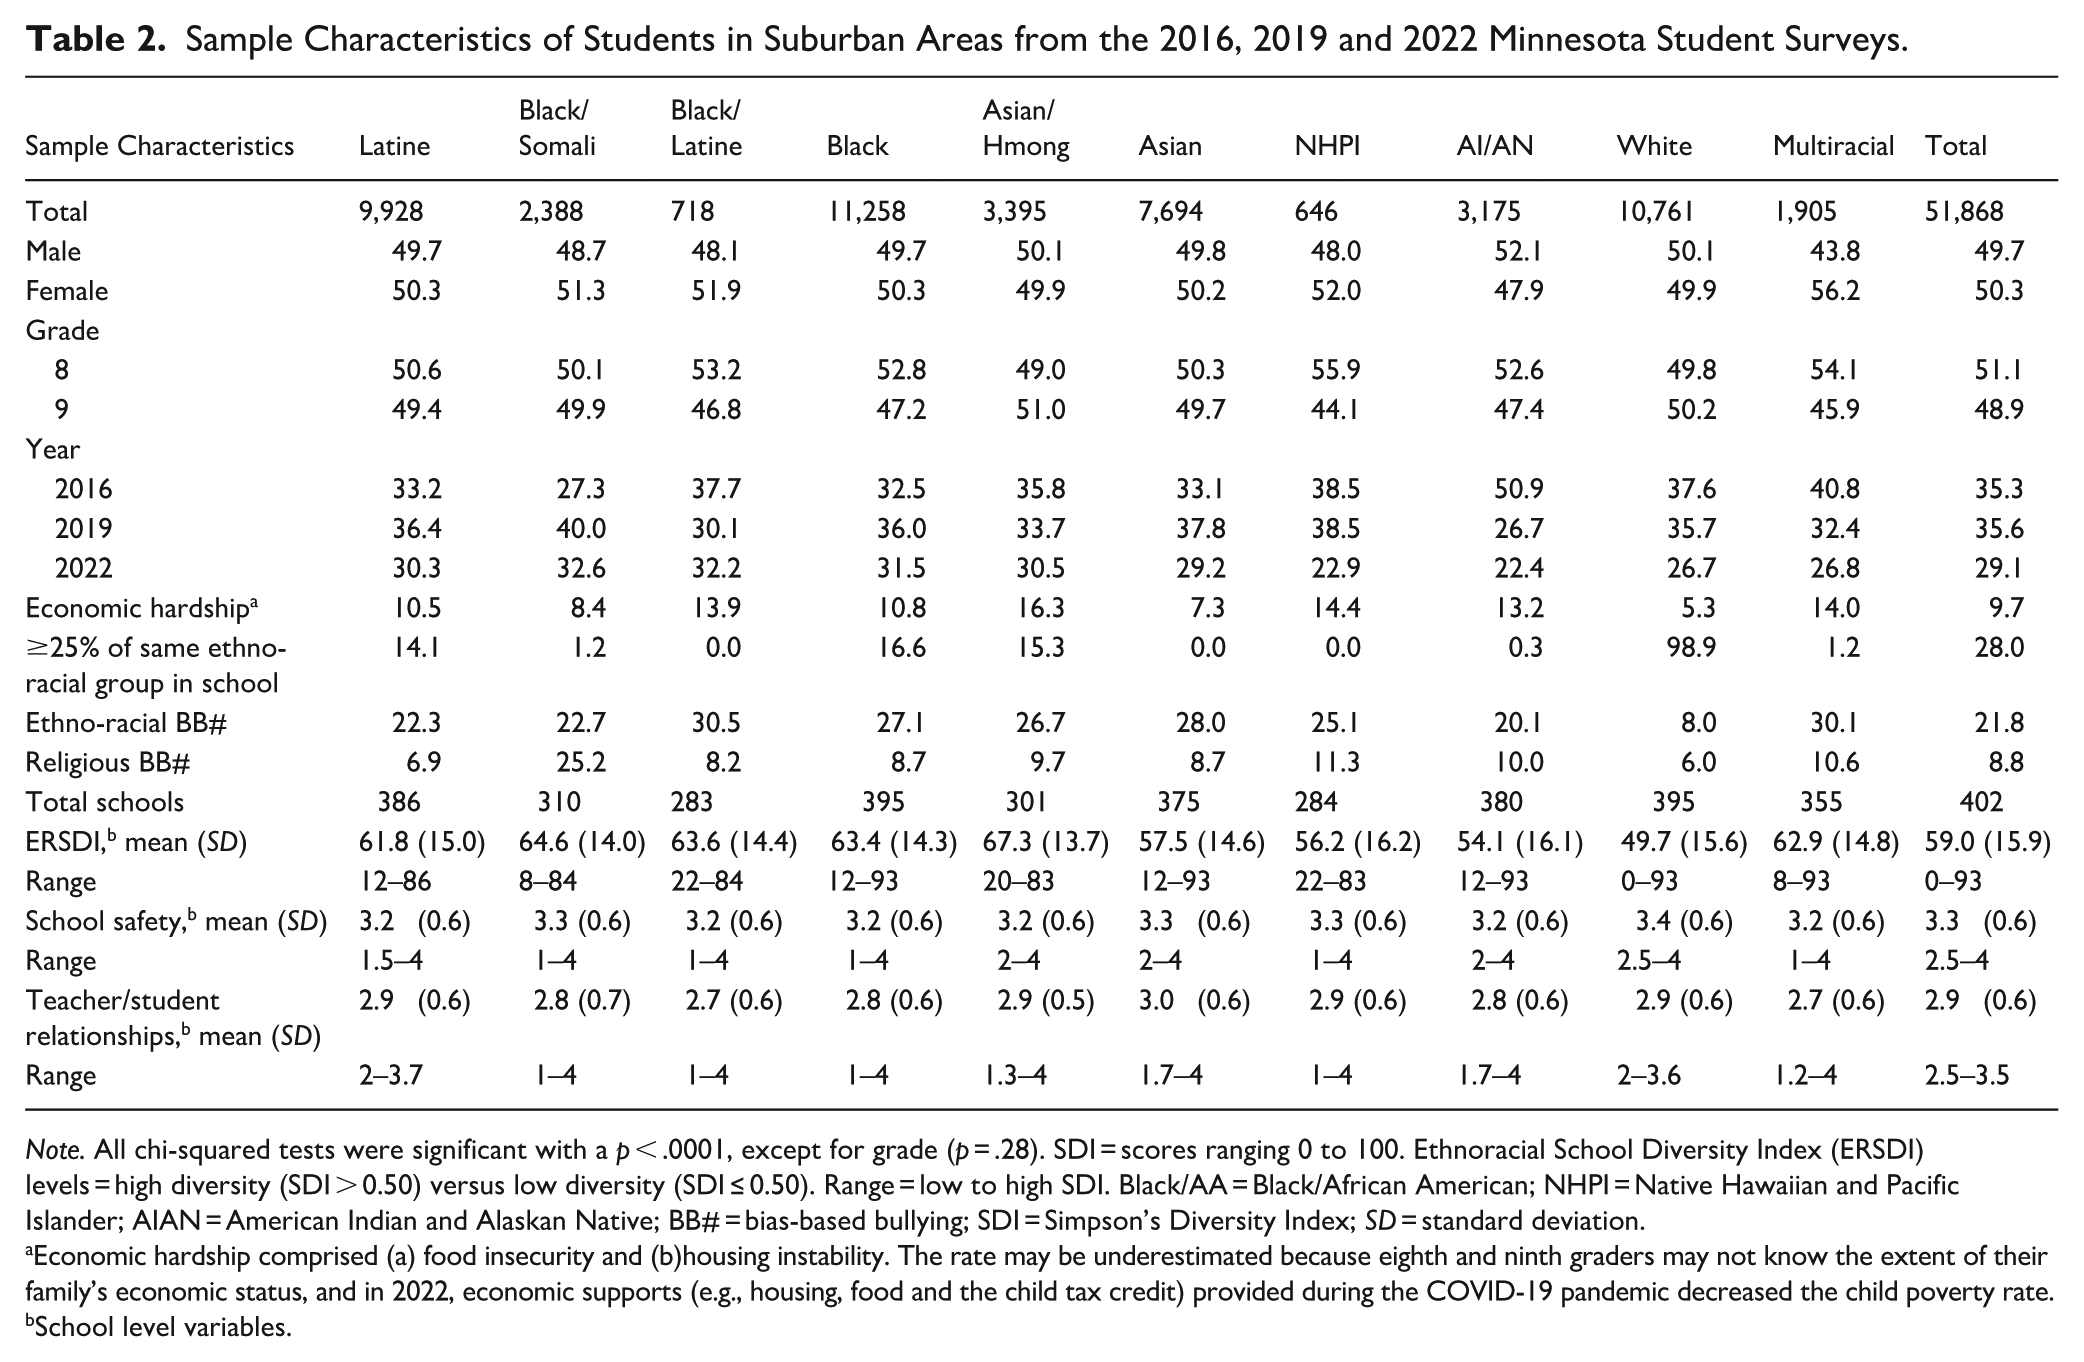
Note. All chi-squared tests were significant with a p < .0001, except for grade (p = .28). SDI = scores ranging 0 to 100. Ethnoracial School Diversity Index (ERSDI) levels = high diversity (SDI > 0.50) versus low diversity (SDI ≤ 0.50). Range = low to high SDI. Black/AA = Black/African American; NHPI = Native Hawaiian and Pacific Islander; AIAN = American Indian and Alaskan Native; BB# = bias-based bullying; SDI = Simpson’s Diversity Index; SD = standard deviation.
Economic hardship comprised (a) food insecurity and (b)housing instability. The rate may be underestimated because eighth and ninth graders may not know the extent of their family’s economic status, and in 2022, economic supports (e.g., housing, food and the child tax credit) provided during the COVID-19 pandemic decreased the child poverty rate.
School level variables.
Sample Characteristics of Students in Rural Areas from the 2016, 2019 and 2022 Minnesota Student Surveys.
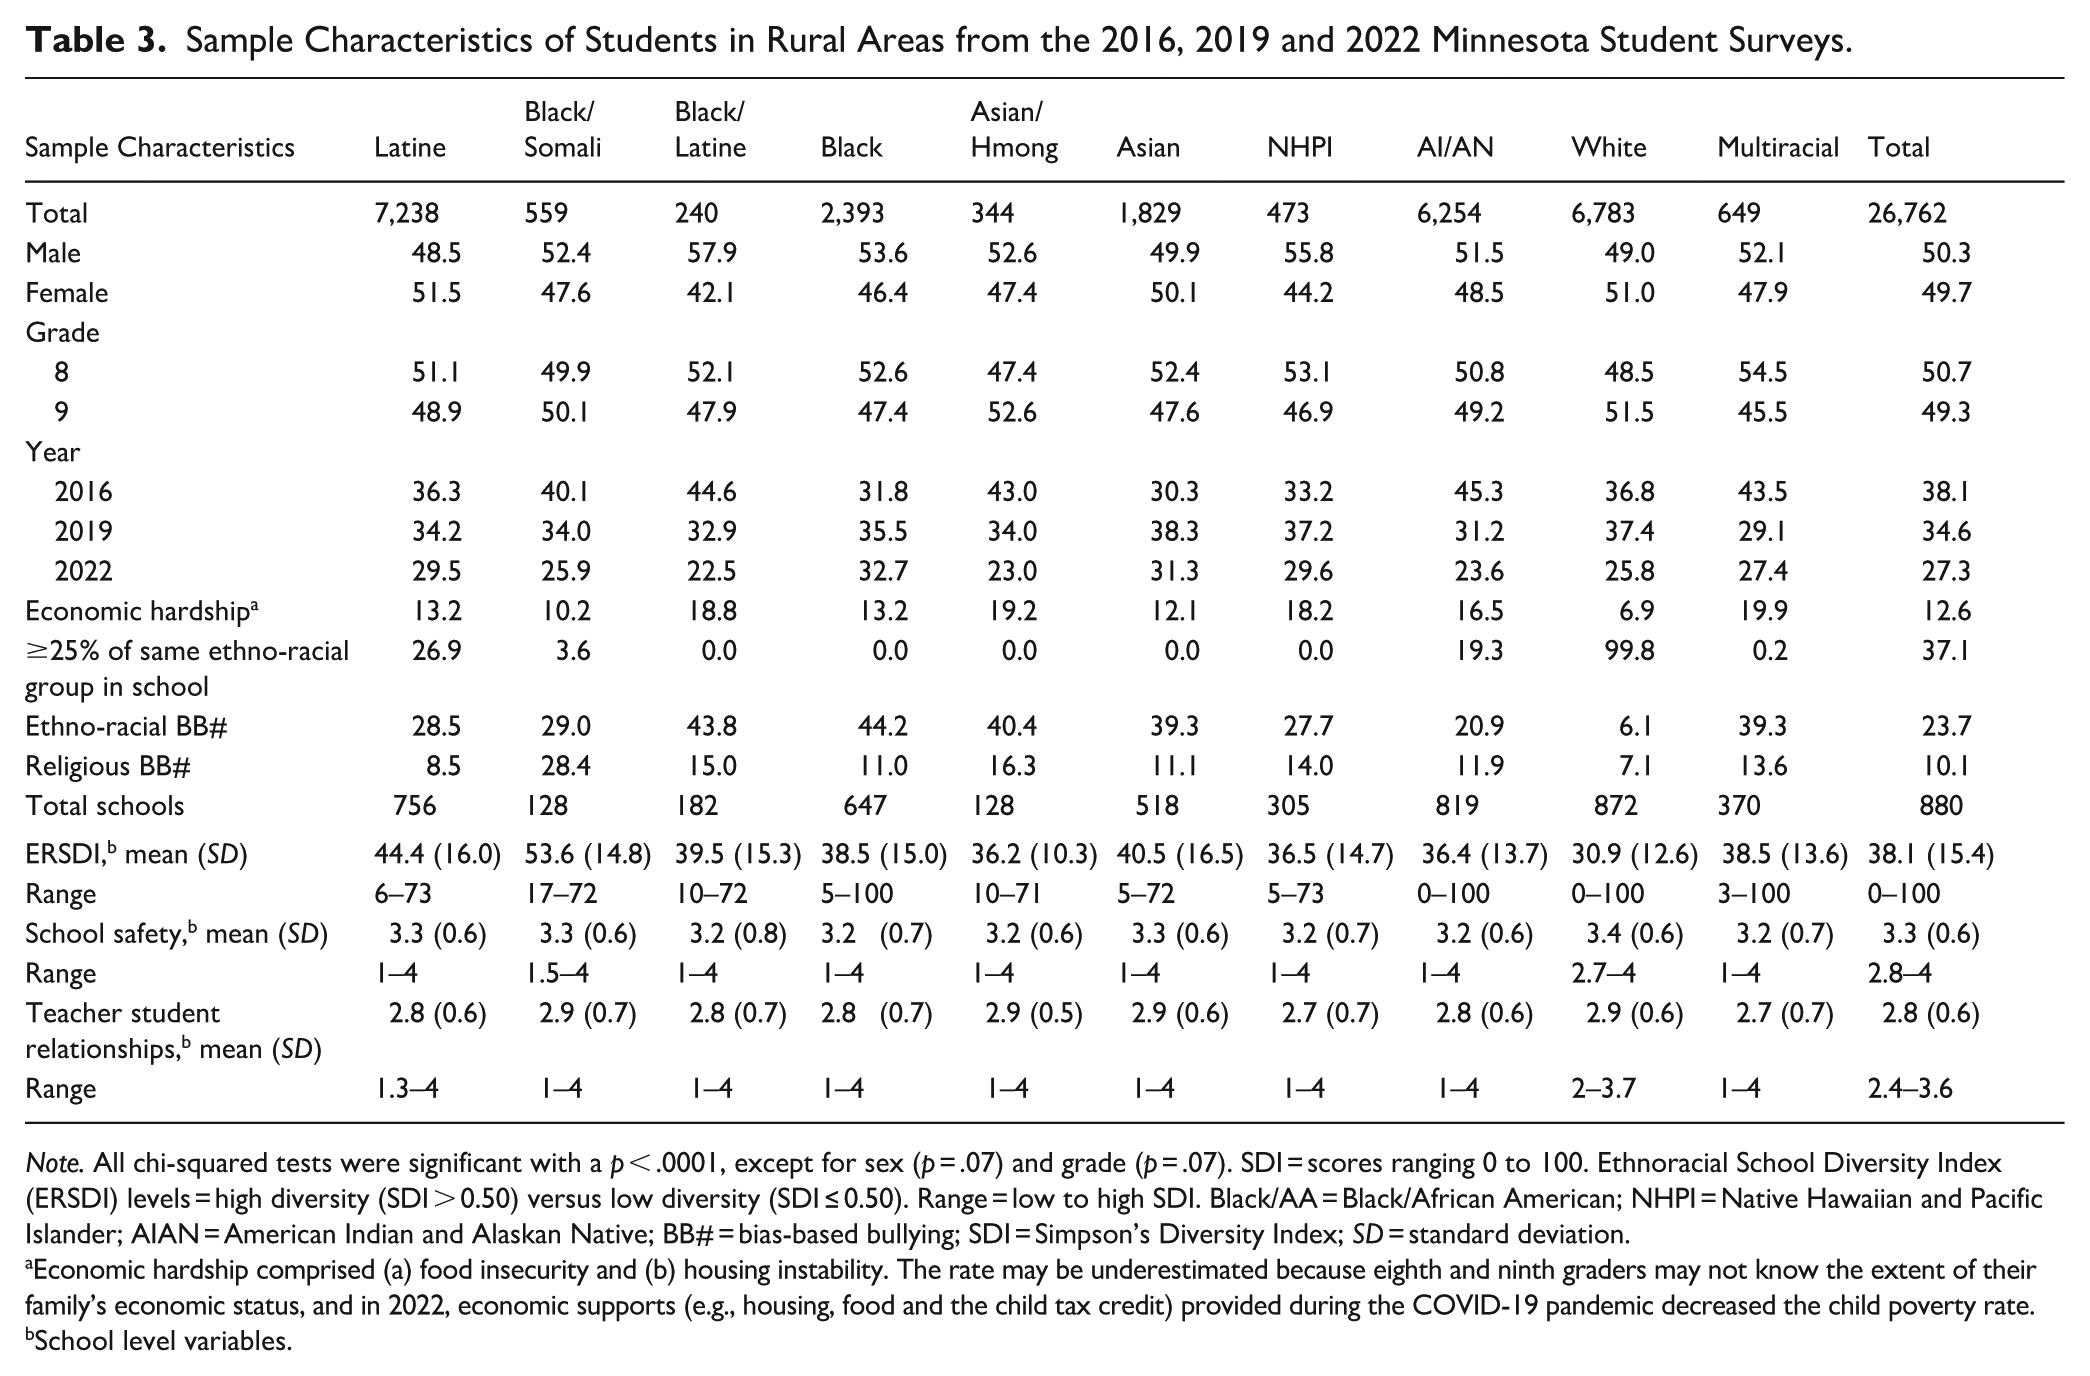
Note. All chi-squared tests were significant with a p < .0001, except for sex (p = .07) and grade (p = .07). SDI = scores ranging 0 to 100. Ethnoracial School Diversity Index (ERSDI) levels = high diversity (SDI > 0.50) versus low diversity (SDI ≤ 0.50). Range = low to high SDI. Black/AA = Black/African American; NHPI = Native Hawaiian and Pacific Islander; AIAN = American Indian and Alaskan Native; BB# = bias-based bullying; SDI = Simpson’s Diversity Index; SD = standard deviation.
Economic hardship comprised (a) food insecurity and (b) housing instability. The rate may be underestimated because eighth and ninth graders may not know the extent of their family’s economic status, and in 2022, economic supports (e.g., housing, food and the child tax credit) provided during the COVID-19 pandemic decreased the child poverty rate.
School level variables.
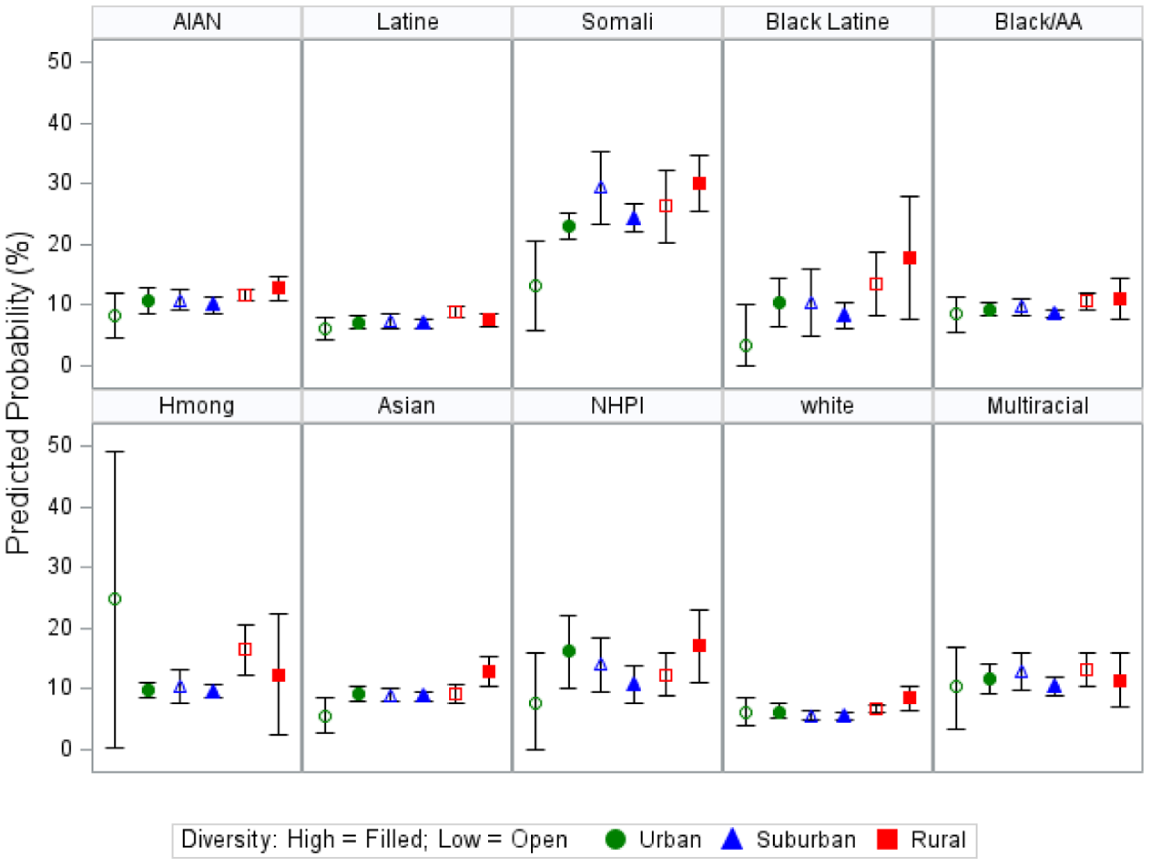
Somali and NHPI students experienced higher rates of ethno-racial bullying in high diversity urban schools versus low diversity schools. Additionally, AIAN students experienced more bullying in high diversity rural schools and white students experienced more bullying in high diversity schools compared with low diversity schools across all locales (see Figure 1). All other groups experienced lower rates of ethno-racial IBB in high diversity schools, for example, Hmong students in urban schools with high diversity 20% (95% CI [16%, 23%]) versus low diversity 70% (95% CI [29%,39%]); Black students in suburban schools with high diversity 25% (95% CI [23%, 26%]) versus low diversity 40% (95% CI [37%, 42%]); and Latine students in rural schools with high diversity 24% (95% CI [22%, 26%]) versus low diversity 31% (95% CI [30%, 32%]; see Figure 1).
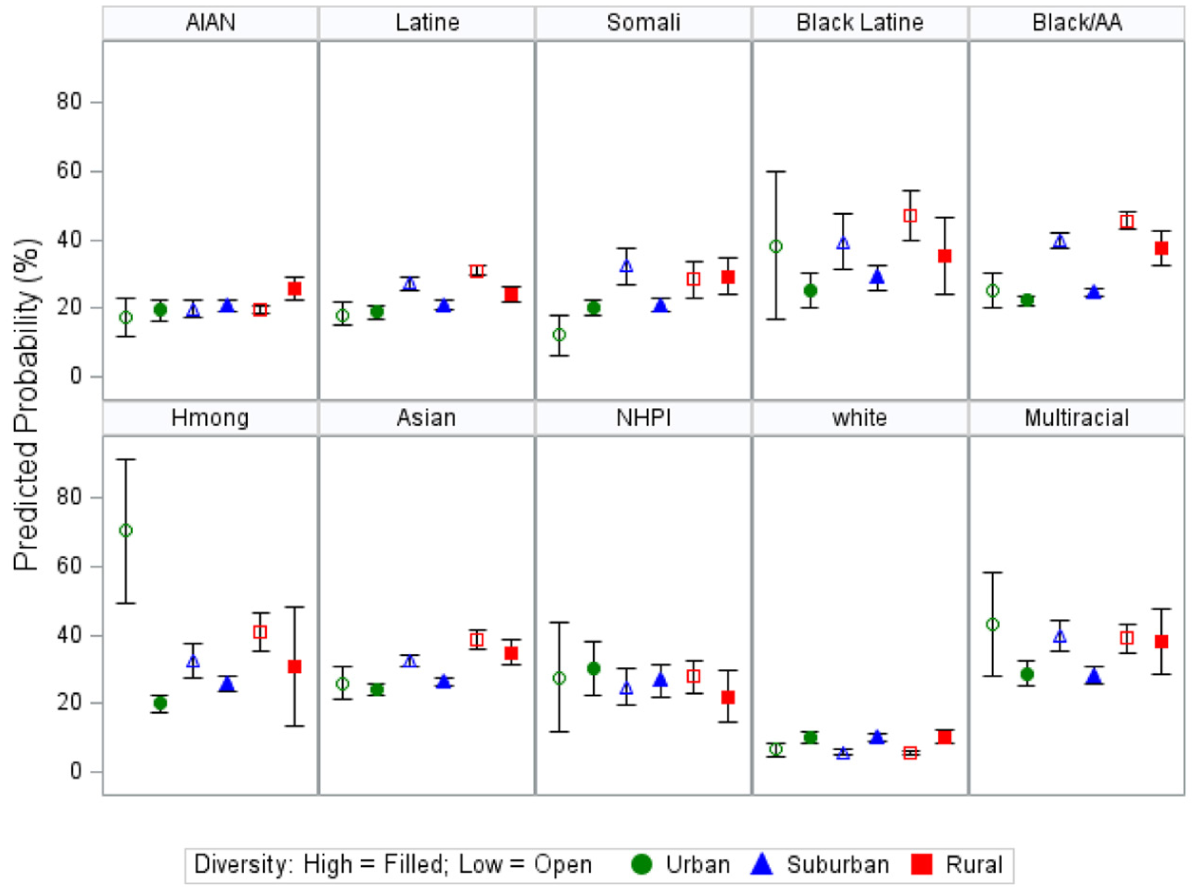
Predicted probability of ethno-racial identity-based bullying victimization by ethno-racial group, school setting, and school diversity.
High ethno-racial school diversity was not associated with less religion-based bullying for adolescents in this sample, and for some students, such as Somali, Black Latine, and Asian students, their experiences of religious IBB increased in high diversity urban schools (see Figure 2). Additionally, for Hmong students in urban high diversity schools 9% (95% CI [9%, 11%]), and Somali 24% (95% CI [22%, 27%]) and NHPI 11% (95% CI [7.6%, 13.8%]) students in suburban high diversity schools, and Latine students 7.6% (95% CI [6.5%, 8.7%]) in rural high diversity schools, although associations between ethno-racial diversity and religious bullying trended downwards, they were not significantly different from other geographical locations (see Figure 2).
Predicted probability of religious identity-based bullying victimization by ethno-racial group, school setting, and school diversity.
Discussion
Ethno-racial IBB and religious IBB rates varied by ethno-racial identity, school diversity, and geographical urban/suburban/rural settings. Our findings support our hypotheses in some groups but not all: ethno-racial-based bullying tended to be higher in non-urban compared to urban areas. High ethno-racial diversity in schools was protective against IBB for some groups (e.g., Black, Asian, Latine, and multiracial students); however, not for others (AIAN, NHPI, Somali and white students).
Examined in the context of key sociodemographic and sociopolitical factors, these findings provide insight into student experiences of ethno-racial and religious identity bullying victimization, highlight inequities, and can guide prevention efforts tailored to subgroups. Like previous studies that reported higher rates of IBB among ethno-racially minoritized youth (Galán et al., 2021; Mendez et al., 2016; Russell et al., 2012), Hmong, Black, and multiracial youth experienced the most IBB, with the highest rates in rural locales. In comparison with other population-based studies (Basile et al., 2020; Kann et al., 2018) in which white students reported the highest rates of bullying victimization, in this study, rates of ethno-racial IBB and religious IBB rates were substantially higher among minoritized students, especially among Black, Black Latine, NHPI, Hmong and multiracial students, and lowest among white students. This finding may be due to the use of more specific measures of bullying type and ethno-racial groups in the MSS, and possibly related to a documented increase in ERIBB nationwide (FBI, 2023; Southern Poverty Law Center, 2019).
Overall, diverse school contexts were associated with less ethno-racial bullying victimization as we had hypothesized. Exceptions included Somali students who experienced more ethno-racial and religious IBB in high-diversity urban and rural schools. In addition to experiencing racist bullying due to their visible minoritized identities as Black youth, Somali youth grapple with Islamophobia and anti-refugee rhetoric. They also must navigate across Somali cultural expectations intertwined with Islamic cultural values that can conflict with U.S. cultural norms in a highly racialized society (Bigelow, 2008). Further, Somali students may experience higher bullying victimization in high diversity schools because of “othering” from other ethno-racially minoritized peers due to societal stereotypes and narratives that pit minoritized groups against each other or against those who are perceived as “foreign” or “different” (Post, 2013). Similarly, Hmong students experienced significantly more religion-based bullying in high-diversity urban schools. It is possible that their intersecting identities of having a refugee background, belonging to a minority, lower socioeconomic status, distinct language, and tensions between Hmong traditions and religion (animist) and Christianity increase the likelihood of victimization.
Ethno-racial school diversity was not associated with reduced IBB for AIAN (especially in rural schools) and NHPI students in urban and rural schools. Usually lumped together with several heterogenous subgroups into the large pan ethnic group of Asian American and Pacific Islanders, NHPI students have vastly different cultural and historical backgrounds that are often overlooked (Sasa & Yellow Horse, 2022). NHPI populations (Yamane et al., 2024), like AIAN tribal nations (Evans-Campbell, 2008), have experienced significant historical trauma due to colonization that led to violence; erasure of their indigeneity; and loss of language, land and cultural practices. Although both communities are distinct, they share a deep spiritual connection to land and/or bodies of water, and these sacred places can support positive health outcomes for Indigenous communities (Native American Rights Fund, 2024). However, this concept does not align with mainstream or dominant religions in the United States and can be a reason students are considered “different” when they identify with their Native culture or religion, which may lead to bullying victimization.
White students experienced the lowest rates of bullying victimization compared with all other ethno-racial groups across all geographic locales, and higher ethno-racial school diversity was associated with higher IBB for white students. Prior work has shown that loss of numerical majority feels threatening to some white populations (Wilkins & Kaiser, 2014). This, in turn, may lead to a heightened need to preserve their historical identity and cultural preeminence (Onishi, 2023), which may seep into interactions among students in schools in the form of IBB harassment. Religion-based bullying was low among white students and other groups that are typically predominantly Christian, suggesting that Christian students may experience fewer incidents of religious IBB. However, ethno-racial diversity was not protective against religious IBB. Findings point to the importance of disaggregating data to identify group-specific amenable factors that buffer against IBB.
Although the Supreme Court (1954) in Brown v. Board of Education of Topeka decision declared racial school segregation unconstitutional, ethno-racial segregation in schools and unequal access to resources are still widely prevalent countrywide. This is evident through harmful policies and reforms that disinvest in public education and communities of color resulting in segregated schools and psychological and cognitive harms along the life course and in late adulthood (Lin et al., 2025; Love, 2023). Given the strong associations between bullying and adverse adolescent health outcomes demonstrated in prior work, prevention strategies should nurture positive interpersonal peer relations that allow students to develop shared interests, mutual compassion, and an appreciation for different cultures and lived experiences, in essence, their common humanity. Creating school climates that prevent bullying requires systemic efforts, and with wide variability in U.S. school diversity, efforts must be specific and targeted. Teachers have an important role in bullying prevention as agents of socialization who set the expectations for acceptable behavior and are perceived as role models. Thus, teachers should be well trained in facilitating belonging and inclusive group dynamics to foster positive and meaningful interactions across groups that normalize diversity and avoid harmful practices that disproportionately harm students of color and those with limited English proficiency, such as low expectations for academic success and disproportionate disciplinary actions (Love, 2023). School policies and curricula should normalize the lived experiences and perspectives of marginalized groups, foster collaboration rather than competition among students in outgroups (Green, 2021), create spaces for critical discussions, and avoid perpetuating biases and stereotypes. Strategies should also involve families, to ensure consistent information at home and in schools. Additionally, higher-level sociopolitical climates contribute to ethno-racial IBB and religious IBB. Data were collected in 2016, 2019 and 2022, when there was a rise in racist political discourse and an increase in hate crimes. These trends were further exacerbated during the COVID-19 pandemic and by recent legislation that discourages schools from discussions on racism, sexual and gender identity, bias, privilege, and inequity, and bans books and content considered presumably “divisive” from curricula (Graham, 2021).
Limitations
Strengths of these analyses included a large population-based sample with sufficient power to examine ethno-racial IBB and religious IBB across diverse groups; and the measurement of school-level diversity. However, while SDI measures the probability of randomly encountering someone from a different racial/ethnic group, it does not capture the probability of encountering someone from one’s own group, which may also be important. The ERSDI in this study is based on survey completion and not school enrollment. To mitigate the empirical constraints of the ERSDI measure in our study, future studies with adequate variability in ethno-racial school diversity should model ERSDI as a continuous variable. Further, the protective effect of ethno-racial diversity may have been underestimated because some of the largest and most diverse school districts did not participate in some of the MSS waves. Some experiences of IBB may have been masked, for example, among Jewish students who are typically white and may be subjected to antisemitism. Additionally, although single items measures have limitations, they are widely used in population-based studies (Eisenberg et al., 2015; Galán et al., 2021), and have high face validity (Allen et al., 2022). Findings cannot be generalized to other contexts in the United States with different ethno-racial make-up. However, marginalization and school segregation are national issues, and our focus in this article was to accurately identify where inequities lie. The economic hardship measures of food insecurity and unstable housing may not capture less severe levels of poverty, and this study examined only two types of IBB without considering other dimensions of identity (e.g., sexual orientation or gender identity). Although MSS has a wealth of measures and a large sample size, the cross-sectional data preclude us from determining causality.
Conclusions
There is a paucity of research on minoritized identities that youth navigate, particularly among ethno-racial subgroups of youth, and how student experiences depend on contexts (e.g., school, geography, peers). School diversity can be protective for many minoritized groups, and the relationship between school diversity and bullying is complex. This study highlights the importance of examining IBB among specific ethnic subgroups, including Hmong, Somali, Black Latine, and NHPI youth. Findings point to the need for systemic efforts that facilitate positive interpersonal relations in schools, screening for IBB as an adverse childhood experience, and addressing racism and religious prejudice, which are detrimental not just for those to whom they are directed, but rather for all of society.
Footnotes
Acknowledgements
We are grateful for comments and suggestions provided by Drs. Marla Eisenberg and Barbara McMorris in earlier drafts of this paper.
Ethical Considerations
The University of Minnesota IRB approved this study. Data were anonymous and the study was exempt from full IRB review.
Informed Consent Statement
Parents were given the opportunity to decline their child’s participation in the survey prior to administration, and students assented to the survey.
Funding
The authors did not receive financial support for the research and/or authorship of this article.
Declaration of Conflicting Interests
The authors declared no potential conflicts of interests with respect to the authorship and/or publication of this article.