
Abstract
The Pension Protection Act of 2006 changed the way in which the value of lump sum distributions is calculated. When the new method was fully implemented in 2012, it triggered a flood of de-risking activity by sponsors of defined benefit pension plans via one-time lump sum distributions, group annuity contracts with insurance companies and liability driven investing. Underlying these developments were a number of economic and demographic factors including a rising equity market, low interest rates, increased Pension Benefit Guaranty Corporation insurance premiums and a declining number of active participants. These forces are still there. Indeed, they have strengthened due to recent legislation (MAP-21 in 2012, BBA in 2013 and HATFA in 2014). In addition, a number of legal questions have been resolved by the Verizon Communications decision of 2014 and new mortality tables have just been published by the Society of Actuaries. The combination of these developments indicate that 2015 will be another big year for pension plan sponsors to transfer pension risk to participants through lump sum distributions and to insurance companies through group annuity contracts.
An earlier article 1 examined the recent phenomenon known as “de-risking” in which sponsors (employers) transfer or manage the investment return, interest rate and longevity risks associated with their defined benefit (DB) pension plans. This is done by offering lump sum distributions to plan participants and/or providing a group annuity to those who decline the lump sum payment. When an employer offers a lump sum distribution of more than $5,000, it must also provide the participants with an annuity option of equivalent value. De-risking is also known as “risk transfer” and “settlement activity.”
In the United States, the vast majority of such group annuities are “buy-outs.” The liability is irrevocably transferred to the insurance company. Another approach known as “buy-ins” keeps the annuity contract as an asset within the ongoing pension plans. Buy-ins are rare in the United States, but common in the United Kingdom. 2 Buy-ins do not remove the pension liability from the sponsor’s balance sheet that thwarts the purpose of most de-risking activity.
Another approach to de-risking is to shift away from equities and toward bonds and duration match invested assets with pension liabilities. This is referred to as Liability Driven Investment or, more recently, Liability Responsive Asset Allocation (LRAA). The sponsor continues to operate the plan, but asset value fluctuations are smoothed as are employer contributions.
This article will focus on a number of recent developments that affect lump sum distributions and group annuity contracts. Liability Driven Investment/Liability Responsive Asset Allocation will not be addressed as it is not materially affected by these recent developments.
Origins
Though not called “de-risking,” risk transfer to participants has been going on for a long time. Since at least the mid-1980s private sector employers have been shifting from DB to defined contribution (DC) pension arrangements, mainly Section 401(k) plans. DC plans are, by definition, always fully funded. The participant has control of asset investment and the retirement benefit is almost always paid as a lump sum distribution. Thus, the participant bears the investment, interest rate and longevity risks. The employer’s obligation is usually limited to making matching contributions.
De-risking in the current sense emerged from a provision in the Pension Protection Act of 2006 (Pub. L. 109-280) that changed the way lump sum distributions are calculated. Before then, they were based on the usually lower 30-year Treasury bond rate. The PPA replaced that with a rate derived from a three-segment index rate based on high-quality corporate bond rates (yield curves). The new arrangement was phased in over 5 years and became fully effective in 2012. That explains the timing of the surge of de-risking in 2012. However, the pressure to de-risk was already there and driven by a number of associated developments:
asset value fluctuations, and consequent fluctuations in employer annual required contributions, due to the recessions beginning 2001 and, especially, 2008;
historically low interest rates engineered by the Federal Reserve to contend with the Great Recession beginning 2008;
increased Pension Benefit Guaranty Corporation (PBGC) insurance premiums;
changes in the rules issued by the Financial Accounting Standards Board including a requirement that pension debt be recognized on corporate balance sheet (rather than in footnotes);
the resulting shift in pension decision making from the employment side of the house to the finance function and specifically to the chief financial officer; and
demographic developments that have reduced the number of active participants relative to retired participants and vested separate participants (former employees).
The combination of these developments and the new fully effective interest rate requirements of the PPA resulted in a huge increase in the number of pension plans that were de-risked and subsequently terminated in 2012.
A Game of Threes
There are three types of pension plan terminations allowed by the PBGC: standard, forced and stressed.
In a “standard termination” the sponsor voluntarily discontinues the plan after discharging its benefit obligations through additional funding contributions, lump sum distributions and/or an annuity contract with an insurance company.
A “forced termination” is initiated by the PBGC to prevent a troubled plan from incurring additional unfunded liabilities that will eventually be acquired (trusteed) by the PBGC.
A stress termination occurs when the plan sponsor is insolvent and the PBGC trustees the assets and benefit obligations of the plan. The PBGC may claim up to 30% of the sponsor’s remaining assets in a bankruptcy proceeding. The plan is terminated and the PBGC pays its vested benefits to the participants.
There are three types of pension plan participants: active, retired and separated vested.
“Active participants” are currently employed by the employer that sponsors the pension plan and are usually continuing to accrue benefits. If they have participated in the plan for 5 years or more they are 100% “cliff” vested. A less-common arrangement is “graded” vesting in which the participant is 20% vested after 3 years, increasing by 20% per year until fully vested after 7 years.
“Retired participants” (and their spousal beneficiaries) are in “pay status” (receiving retirement benefits from the plan).
“Vested terminated participants” are former employees who have met the plans vesting requirements. They are entitled to the accrued pension benefit, usually on reaching the plan’s minimum retirement age. The plan may cash out a vested pension benefit of $5,000 or less.
DB plan sponsors are required to make funding contributions and pay PBGC premiums for all participants of the plan, active, retired and separated vested.
And there are three types of DB pension plans: traditional, hybrid and frozen.
“Traditional DB plans” are what most of us used to think of as a pension plan. The participant and spouse are entitled to the lifetime pension benefit based on years of service, a factor or multiplier (typically 1.0% or 1.5%) and some measure of final salary (typically last three or highest three consecutive years).
“Hybrid DB pension plans” are either cash balance (CB) plans or pension equity plans. Most are CB plans. While classified as DB plans because the participant does not have investment control, they operate more like DC plans. The employer’s liability is limited to the annual contribution and a “credited interest rate” specified by the plan.
“Frozen DB plans” are no longer open to new members and/or benefit accruals have ceased for active participants. “Soft” or partially frozen plans usually evolve into “hard” frozen plans and are eventually terminated. The plan sponsor must continue to fund and pay PBGC premiums for frozen plans. At some point, any advantage to the sponsor of continuing to maintain the plan is offset by its cost.
As depicted in Table 1, most DB plans are now either hybrid or frozen. As of 2011 (the most recent year for which data are available), 56.7% of PBGC insured plans were either hybrid or frozen. That is up from 39.7% in 2008 when the PBGC first published data on frozen plans. No doubt the number and percentage of hybrid and frozen plans are higher today. My rough estimate, based on linear regression suggests that in 2014 a whopping 74.9% of PBGC insured plans were either hybrid or frozen. This implies that traditional DB pension plans open to new members are an endangered species.
Hybrid and Frozen Defined Benefit Pension Plans, 2001-2011.
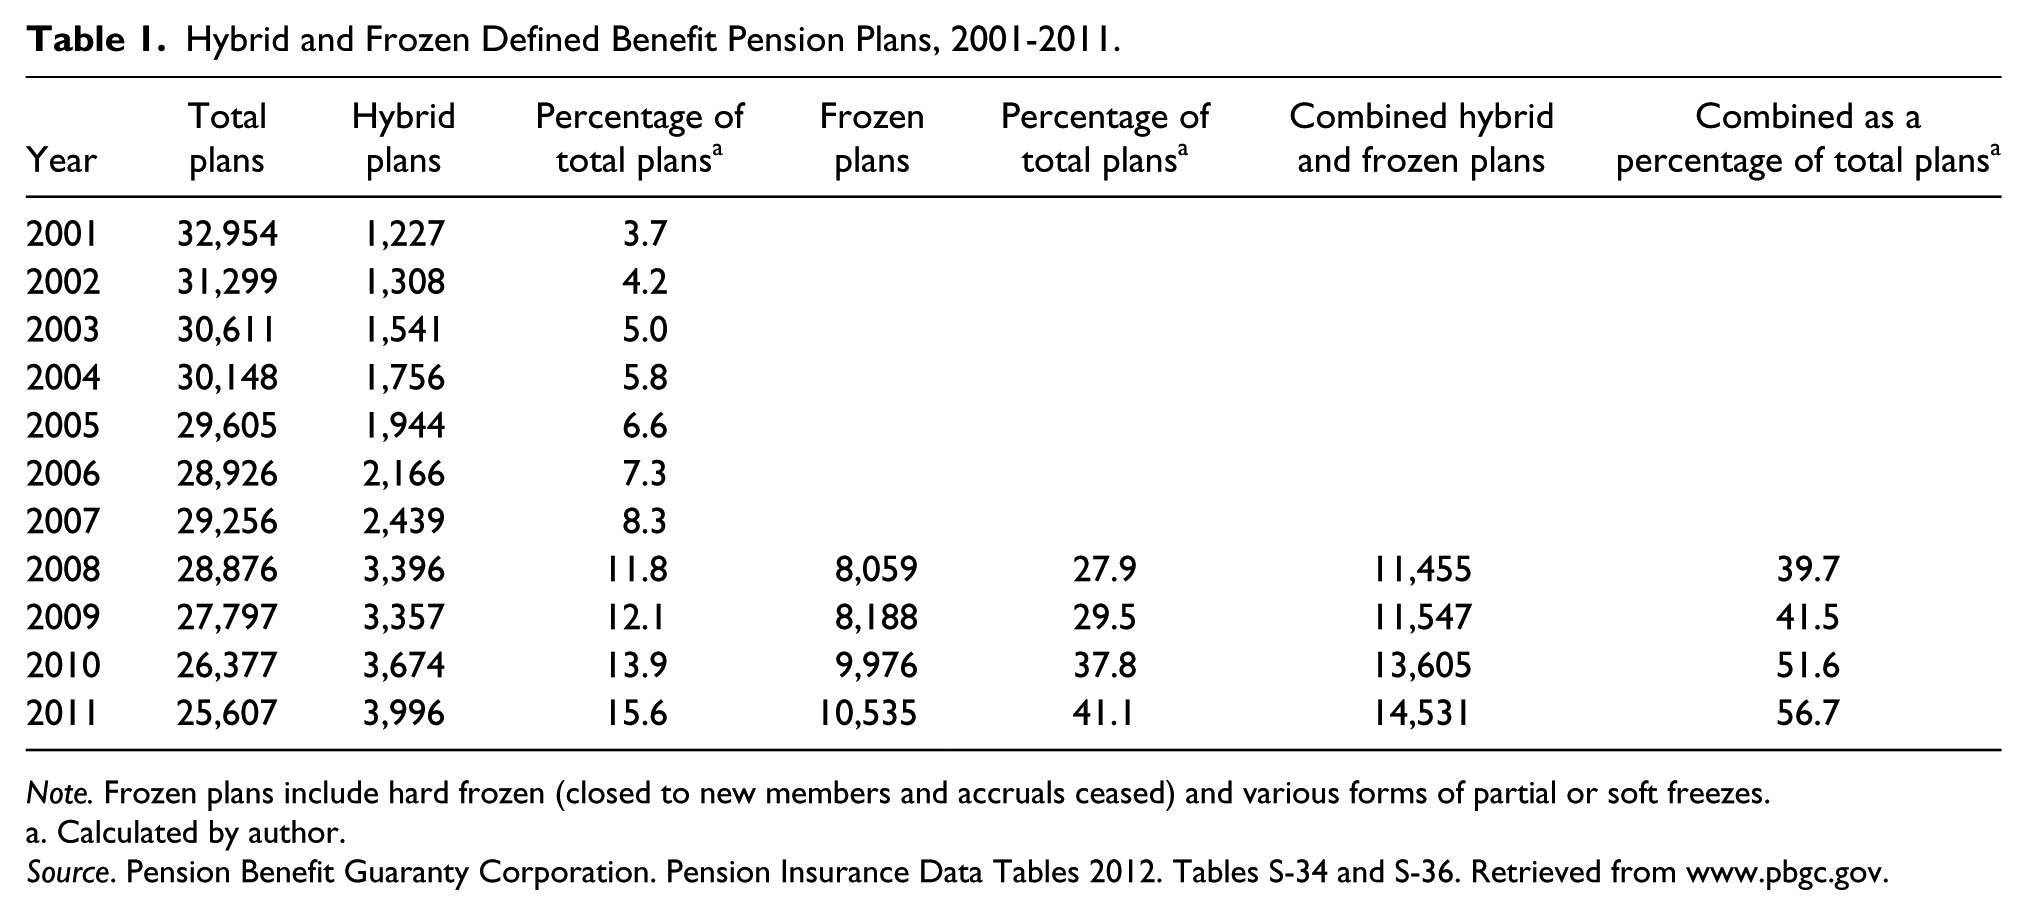
Note. Frozen plans include hard frozen (closed to new members and accruals ceased) and various forms of partial or soft freezes.
Calculated by author.
Source. Pension Benefit Guaranty Corporation. Pension Insurance Data Tables 2012. Tables S-34 and S-36. Retrieved from www.pbgc.gov.
Interest Rates and Funding
Interest rates are important for de-risking in a number of ways. They are used to discount a plan’s projected benefit obligations (PBO) to present value. This is sometimes referred to as “current liability.” 3 Other things being equal, the higher the interest/discount rate used, the lower the present value, the higher the funded ratio and the lower the sponsor’ required contribution (and vice versa). The funded ratio (assets ÷ liabilities) is the “percent funded.” The PPA of 2006 uses the term Adjusted Funding Target Attainment Percentage (AFTAP). 4
Prior to the PPA of 2006, plans could use their expected rate of return to discount their PBO to present value. That rate was based on historical averages over the past 20 or so years and was typically 7.5% to 8.5%. The PPA mandated three-segment index rate based on high-quality corporate bond rates. The segments corresponded to the plan’s liabilities. The effect of the PPA was to lower the interest rate used to discount the PBO to present value and thus increase the sponsor’s funding obligation. The purpose was to increase funded ratios and thus protect the PBGC from having to trustee plans with large unfunded benefit obligations.
The new arrangement took effect for plan years (PY) beginning in 2008. Bad timing! The Great Recession began in the fourth quarter of 2008. Employer sponsors were hit with increased pension funding obligations just as the worst recession since the 1930s hit. Congress enacted a number of measures to aid sponsors of DB pension plans, pay for other programs and/or to protect the PBGC.
PBGC Premiums
The PBGC was created by the Employee Retirement Income Security Act of 1974 (ERISA; Pub. L. 93-406) to insure the vested benefits of DB plan participants. The PBGC does not insure DC plans, which are always fully funded. Nor does it cover church or public sector plans. They are exempted from ERISA.
The PBGC operates a Single-Employer Program and a Multiemployer Program. The latter are collectively bargained plans negotiated between a labor organization and two or more (usually many) employers. Both single-employer and multiemployer plans are funded by insurance premiums paid by plan sponsors. However, multiemployer plans are quite different in terms of their origins, history, insurance premiums, funding, intervention procedures and just about everything else. Most, if not all, of the de-risking activity has been by single-employer plans.
Originally, sponsors of single-employer pension plans paid a premium of $1 per participant per year. As evidenced in Table 2, that soon proved inadequate. Beginning in 1978, the premium was increased a number of times until the flat (per-participant) premium reached $16 in 1988. In that year, a variable-rate premium (VRP) of $6 per $1,000 of unfunded vested benefit liability was added. In 1991, the flat rate was increased to $19 and the VRP to $9 per $1,000 of unfunded vested benefits. The VRP remained at $9 through 2013.
Pension Benefit Guaranty Corporation Premiums.
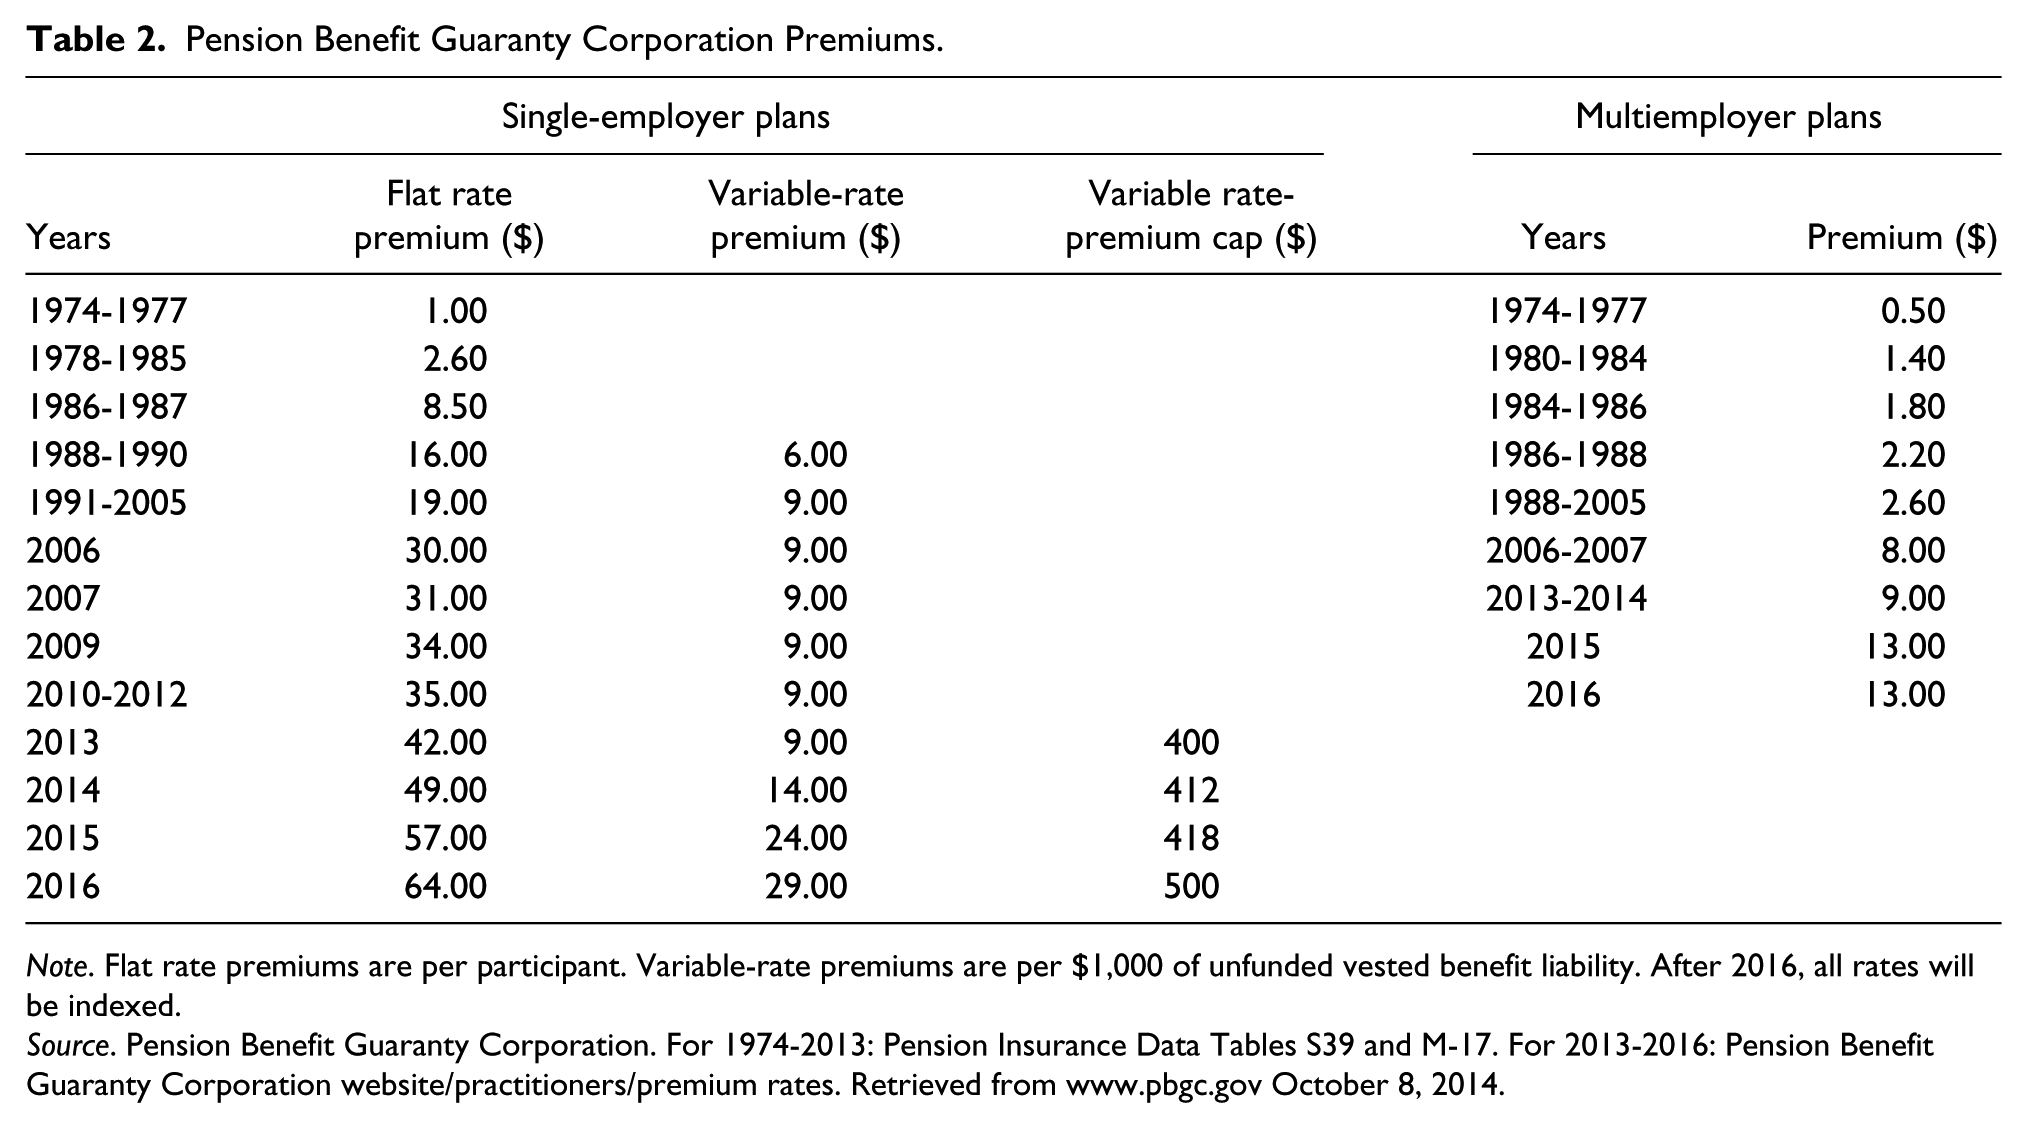
Note. Flat rate premiums are per participant. Variable-rate premiums are per $1,000 of unfunded vested benefit liability. After 2016, all rates will be indexed.
Source. Pension Benefit Guaranty Corporation. For 1974-2013: Pension Insurance Data Tables S39 and M-17. For 2013-2016: Pension Benefit Guaranty Corporation website/practitioners/premium rates. Retrieved from www.pbgc.gov October 8, 2014.
In 2012, Congress enacted the Moving Ahead for Progress in the 21st Century Act (MAP-21; Pub. L. 112-141). Though it was primarily highway funding legislation, it contained language that further increased PBGC premiums. The flat rate went from $35 in 2012 to $42 in 2013 and to $49 in 2014. In 2013, a cap of $400 per participant was added to the VRP. In 2015, the flat rate premium went to $57 and the VRP to $24 with a cap of $418. The Bipartisan Budget Act of 2013 (BBA; Pub. L. 113-67) increased the 2016 flat rate premium to $64 and VRP to $29. Those amounts may be further increased due to indexing. The cap will be $500 in 2016. Premium rates and the VRP cap will be indexed to the National Average Wage Index beginning 2016.
Since 2006, a special premium on certain terminated pension plans went into effect. It is $1,250 per participant for each of the 3 years following a plan’s termination. There are several exemptions to this fee including the airline industry, employers in bankruptcy and plans terminated prior to 2006.
The substantial PBGC insurance premium increases imposed and will continue to impose a growing cost to DB plan sponsors and an ever-increasing motivation to de-risk. They were accompanied by additional legislated changes in 2012, 2013 and 2014.
MAP-21
The Moving Ahead with Progress in the 21st Century Act of 2012 was a massive (584 page) transportation statute. In addition to increasing PBGC insurance premium rates, MAP-21 allowed plans to use a discount rate based on the 25-year average of corporate bond rates within a specified corridor. The 25-year average was significantly higher than the PPA rate because it includes the high rates from the late-1980s and 1990s. This resulted in substantial temporary funding relief to plan sponsors that will gradually wear away over time.
Allowing a higher discount rate makes the pension plan look better in the short term by reducing the present value of the PBO. However, that does not change the fundamental economics of the plan. Reducing required employer contributions in the short run does not make the liability go away. It only postpones it. In the longer run, the sponsor has to fund the benefits promised. Pension funding policy is largely a matter of timing.
The market-based liability measures for nonfunding purposes (plan terminations and lump sum distributions) did not change. Thus, the higher 25-year average rate did little to directly affect de-risking.
Pension funding requirements and corporate funding policy are not the same thing. Recognizing that the interest rate relief of MAP-21 is temporary, sponsors may choose to contribute more than their required minimum contribution. Contribution corridors limit the amount of excess contributions that may be made.
As displayed in Table 3, the corridor for 2012 was 90% to 110% around the 25-year average rate increasing (widening) annually to 70% to 130% in 2016. The wider the corridor, the higher the allowable actual permissible discount rate. The implementation of MAP-21 was complicated by some retroactivity that need not detain us.
Allowable Discount Rate Corridors Under MAP-21 and HAFTA.
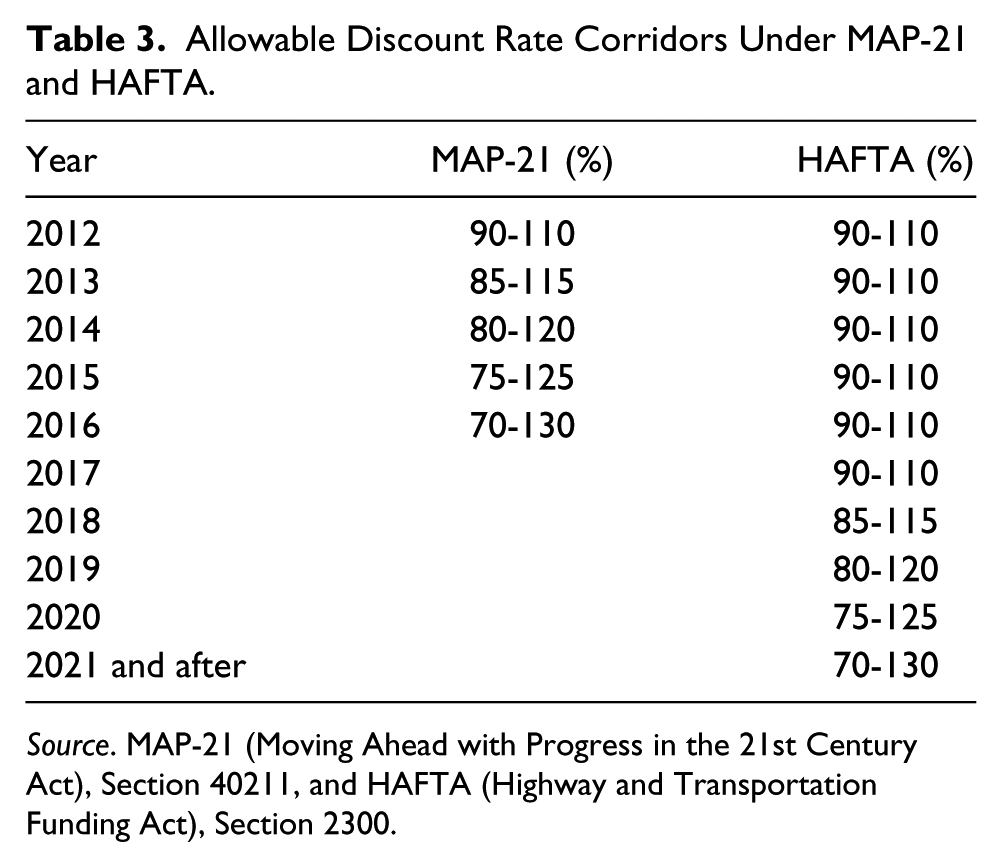
Source. MAP-21 (Moving Ahead with Progress in the 21st Century Act), Section 40211, and HAFTA (Highway and Transportation Funding Act), Section 2300.
Bipartisan Budget Act
Following the federal government shutdown of September 2013, Congress passed the Bipartisan Budget Act of 2013 (Pub. L. 113-67). The BBA reduced automatic across-the-board funding cuts (sequester) and paid for it by increasing fees (not taxes). PBGC premiums are considered fees. The BBA increased the flat rate premium for single-employer plans to $57 in 2015 and to $64 in 2016 with indexing starting in 2016. The VRP which was to have been increased by the prior year’s indexing and then further increased by $10 in 2015 and another $5 in 2016.
HATFA
The Highway and Transportation Funding Act of 2014 (HATFA; Pub. L. 113-159) delayed the expansion of the corridors until after 2017. The 90% to 110% corridor will continue through 2017. HATFA did not further increase PBGC premium rates. The BBA had already done that. Rather, as displayed in Table 3, it delayed the widening of the corridors for 5 years.
The placing of pension funding requirements within two transportation bills was not accidental. The purpose of the narrow corridors (90% to 110%) in MAP-21 and their 5-year extension by HATFA was to limit over contributing by plan sponsors. Sponsors deduct contributions to pension plans from their corporate income tax. By limiting deductible contributions with a narrow corridor, corporations pay more in federal income tax that helps pay for transportation and other programs. 5 Excess pension contributions may also create “credit balances” that can be used to pay for future funding obligations.
The implementation of HATFA was complicated by its retroactivity and by allowing sponsors discretion as to whether to apply its provisions to the 2013 plan year or not. Because of the late date of its adoption, many plans had already made their filings based on MAP-21 requirements. The PBGC did not require that they be recalculated.
There appears to be a redirection of congressional purpose at work here. Over the years, Congress enacted legislation that increased PBGC premiums and strengthened funding requirements to shore up the plans and protect the PBGC. MAP-21 primarily helped sponsors contend with the Great Recession by temporarily easing funding requirements. The BBA increased PBGC premiums to help finance the federal budget to the detriment of plan sponsors. And the HATFA extended the 90% to 110% corridor for 5 years to the further detriment of sponsors.
Life Expectancy and Mortality Tables
On October 27, 2014, the Society of Actuaries published new mortality tables: Mortality Tables and Mortality Improvement Scale 2014 (RP 2014). They are to replace tables RP 2000 and Mortality Projection (MP) Scale AA. Mortality tables are either a “generational” or “static.” The former calculates different life expectancies based on year of birth. The latter makes fixed projections of mortality.
For funding purposes (calculating annual required contributions), sex-based generational tables are used. For lump-sum distributions, in 2014 and 2015, IRS Notice 2013-49 requires the use of unisex static tables based on RP 2000, updated by Scale AA mortality improvements. 6
The Internal Revenue Service (IRS) has not yet adopted RP 2014. When it does, they will probably be applicable for the 2016 plan year (PY). The new mortality tables will significantly increase the value of benefit obligations (liabilities) and, hence, a sponsor’s required contributions. The longer people live, the longer they collect retirement benefits. Table 4 reports the impact of adopting RP 2014 for PY 2016. Clearly, it will add significantly to the cost of sponsoring a DB pension plan. That, in and of itself, will make de-risking pension plans more attractive.
Percent Increase in Funding Cost by Adopting RP 2014 Mortality Tables for Plan Years 2016.
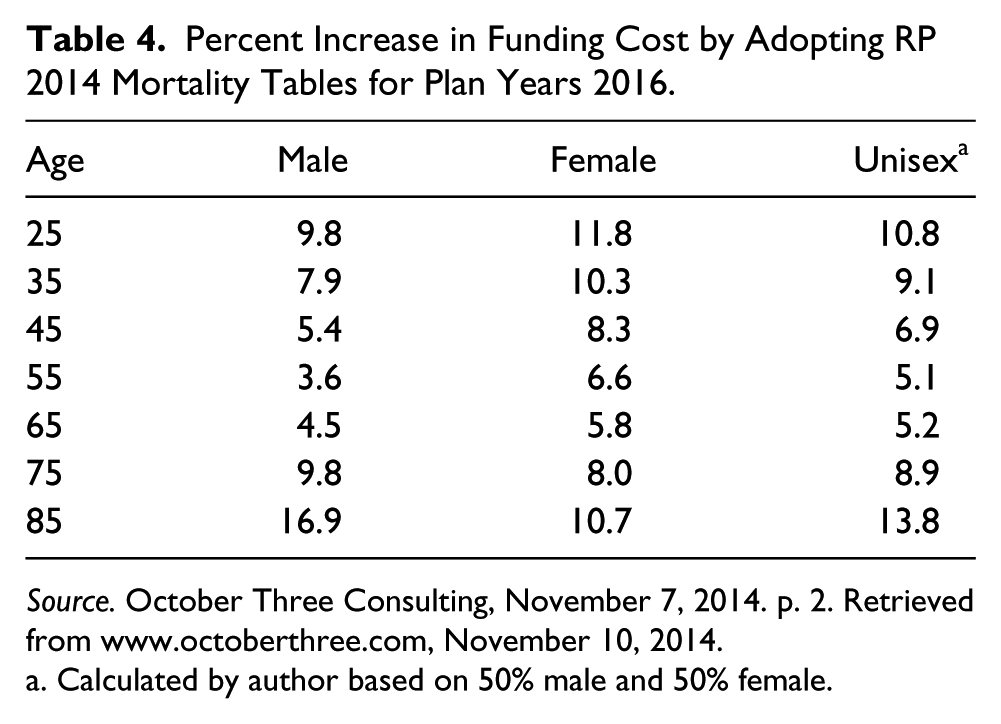
Source. October Three Consulting, November 7, 2014. p. 2. Retrieved from www.octoberthree.com, November 10, 2014.
Calculated by author based on 50% male and 50% female.
RP 2014 will also add to the cost of lump sum distributions. October Three Consulting estimates that, for de-risking purposes, based on the IRS approach of 50% male and 50% female, the value of a lump sum distribution for a 55-year old would increase by 5.1% in PY 2016. Table 4 also reports the unisex rates likely to be used for lump sum calculations. Employers considering de-risking would be well advised to do it in 2015 rather than 2016.
The insurance industry was quick to adopt RP 2014 for their pricing of annuity contracts. 7 Therefore, the new tables will have no effect on the timing of group annuity purchases.
Participants
As indicated in Table 5, in 2013, there were 31.9 million participants in PBGC-insured pension plans. That is down from a peak of over 34.5 million in 2004 (not shown). This is a meaningful decline as it reverses a quarter century of growth in total participation.
Active, Retired and Vested Separated Participants (Participants in Thousands).
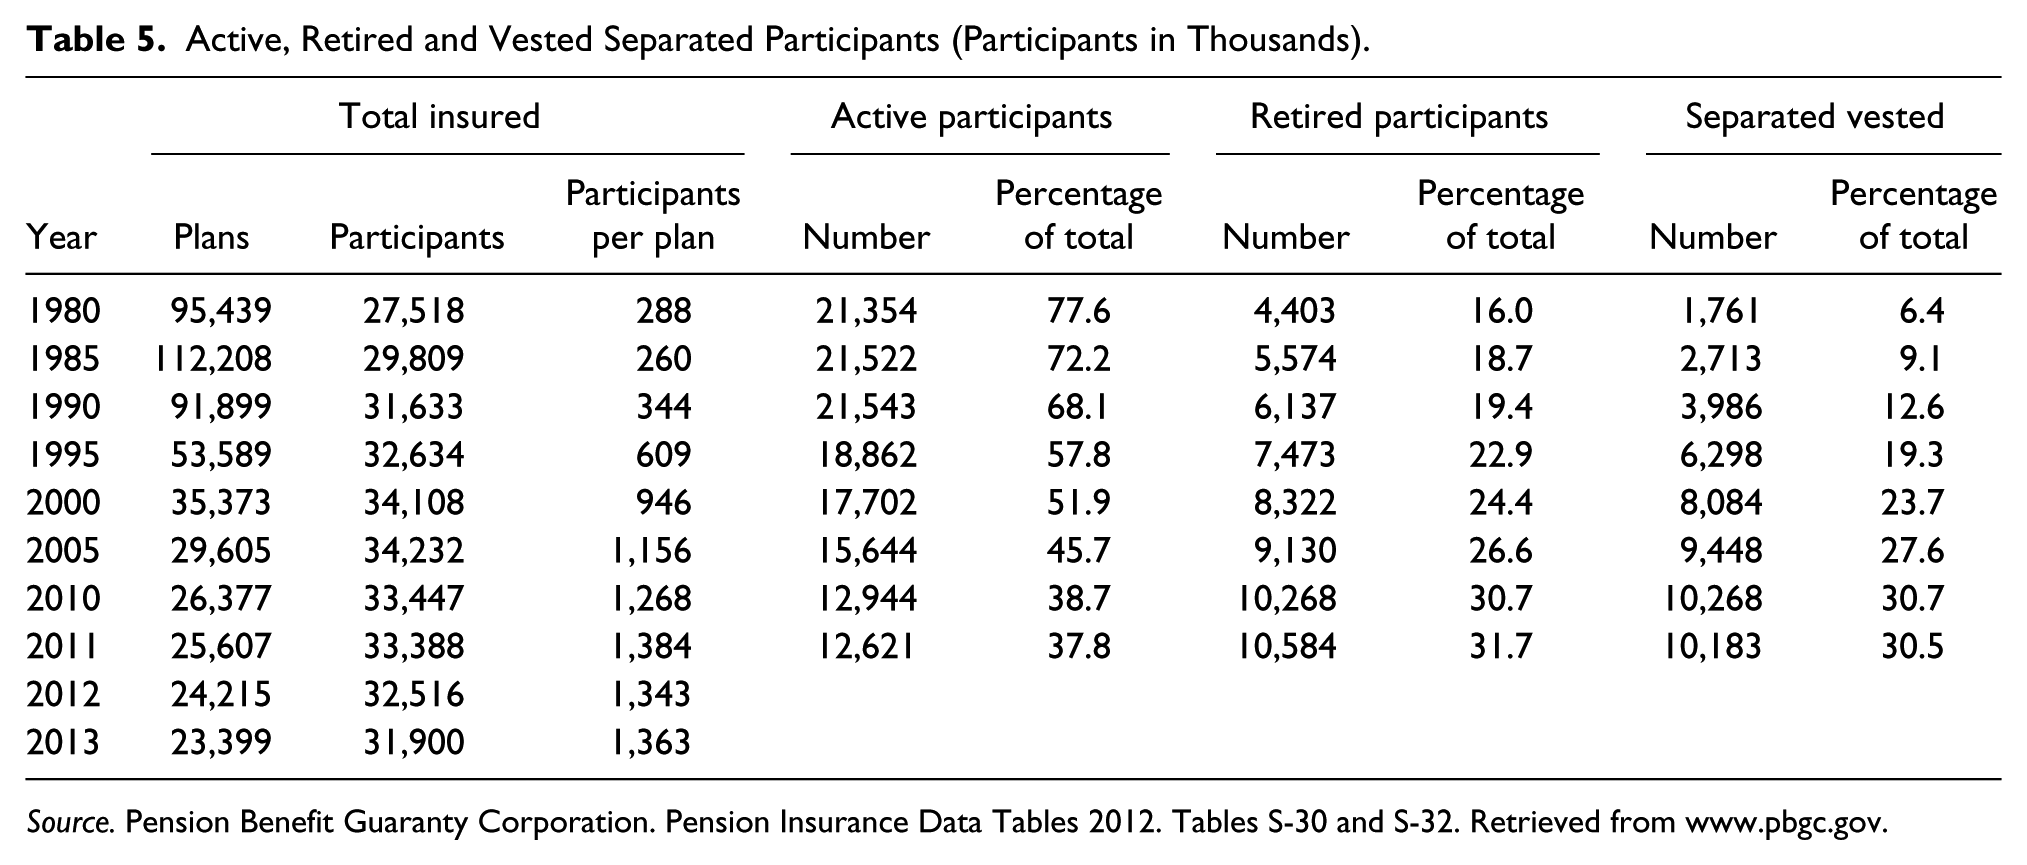
Source. Pension Benefit Guaranty Corporation. Pension Insurance Data Tables 2012. Tables S-30 and S-32. Retrieved from www.pbgc.gov.
As the number of PBGC-insured plans has declined, the average number of participants per plan has grown steadily since 1985. This reflects employment growth of sponsoring employers and consolidation of pension plans due to corporate mergers and acquisitions.
The more interesting revelation in Table 5 is the distribution of individuals among the participant categories. Employers sponsor retirement plans to help attract and retain employees. As of 2011, the last year for which complete data are available, there were 12.6 million active participants (37.8% of total participants). That is down from 21.4 million (77.6%) in 1980. Meanwhile, the number of retired participants (and their survivor beneficiaries) has increased from 4.4 million (16.0%) in 1980 to 10.6 million (31.7%) in 2011. Over the same period, the number of separated vested participants has gone from 1.8 million (6.4%) to 10.2 million (30.5%). Thus, 62.2% of total insured participants were “inactive.” They were either retired or separated vested former employees presumably working for someone else.
A sponsor must continue to fund a pension plan based on total participants: active, retired and separated vested. It must also continue to pay PBGC flat rate premiums for all participants and variable rate premiums on all unfunded vested benefit obligations. Employers do not need to attract and retain retirees and or separated vested former employees. This further adds to the pressure to get out of the retirement income business with its various costs and risks.
Financial Markets
Another set of factors favoring de-risking in 2015 results from the state of the economy. The stock market has more than recovered from the Great Recession. As of this writing (December 2014), the Dow Jones Industrial average is at record highs and flirting with the 18,000 level. Consequently, most pension funds are in pretty good shape.
These conditions are likely to continue through 2015. Eventually, however, another recession will occur. There were recessions in the United States in 1973, 1983, 1991, 2001 and 2008. Business cycle theory is alive and well. There will be another recession, probably about 2018-ish. Corporate CFOs know this. It follows that they will want to get any intended de-funding under way before pension asset values decline again.
The PPA of 2006 established that a plan that is less than 80% funded may not grant lump sum distributions of more than $5,000. The purpose of this provision was to prohibit underfunded plans from becoming even more underfunded by distributing assets. The gains in equity prices have pushed many formerly underfunded plans over the 80% threshold and then some.
While interest rates, and therefore borrowing costs, increased somewhat in 2013, they declined in 2014 and are very low by historical standards. This allows sponsors considering de-risking via lump sum distributions and/or group annuities to borrow funds at a low interest rate to pay for such transactions.
Costs and Risks
The combination of the ever-increasing PBGC premiums, HATFA’s curtailment of the corridor expansions around the 25-year average and the adoption of the RP 2014 mortality tables will add significantly to the cost of continuing to sponsor DB pension plans whether traditional, hybrid or frozen. It looks like 2015 will be the year for these developments to come together.
The big year for de-risking was 2012. General Motors, Ford and Verizon made the headlines. However, other major employers that de-risked pension plans in 2012 included NCR Corp., New York Times, Sears, Archer Daniels Midland, Kimberly Clark, J.C. Penny and AT&T. 8
I could find little information on de-risking activity in 2013. Various comments by consultants suggest that the rate of de-risking had fallen off. An exception was the SPX announcement that it would transfer $625 million in pension liabilities to Massachusetts Mutual.
Nor is there much information available for 2014. An important exception was the September 2014 Motorola Solutions announced that it would transfer $3 billion in pension liabilities to Prudential Insurance Company. The transaction covers 30,000 retirees and beneficiaries. That will make it the third largest de-risking group annuity transaction after General Motors ($25 billion) and Verizon Communications ($7.5 billion) in 2012. Motorola Solutions also announced a onetime lump sum buy-out for separated vested participants limited to $1 billion. 9
The apparent fall off in de-risking activity during 2013 and 2014 may be due in part to some uncertainty about the legal status of de-risking.
The Verizon Decision
One of the largest de-risking transactions of 2012 was Verizon Communications. It transferred $7.5 billion in pension obligations to Prudential Insurance Company via the purchase of a group annuity contract that covered 14,000 retired managers.
A law suit was filed in the district court for north Texas (Dallas) by several participant groups on various grounds. After rejecting a request to enjoin the transaction, the court certified that two groups of claimants could proceed: the annuitized participants and those participants remaining in the plan. The court issued its final ruling in 2014 holding that
No breach of fiduciary responsibility had occurred since the purchase of the annuity was a “settlor” decision rather than a fiduciary decision. Once a settlor decision is made, its implementation becomes subject to fiduciary requirements of ERISA.
The selection of Prudential as the sole provider, rather than a number of annuity providers, was permissible because Verizon had retained the services in advance of an independent fiduciary to represent the interest of the participants and ensure compliance with ERISA.
ERISA did not require Verizon to retain the annuity arrangement as an asset within its pension trust fund (so-called “buy-in”) in order to preserve PBGC insurance and ERISA protections. A “buy-in” annuity contract does not irrevocably transfer the liability to the insurance company and get it off of the sponsor’s balance sheet (as a “buy-out” does).
The $1 billion (about 12%) payment to Prudential for administrative expenses from plan assets was not unreasonable given the $8.4 billion total cost of the transaction. Nor did it violate the “exclusive benefit rule” of ERISA.
The Verizon decision may be appealed to a higher court; however, a different outcome seems unlikely. Other sponsors considering de-risking would be well advised to follow Verizon’s example of retaining an independent fiduciary to represent the interests of the participants whose benefits are being annuitized in advance and to ensure full compliance with ERISA. 10
What Do We Know and How Do We Know It?
To date, what we know about de-risking comes from various consulting organizations, congressional hearings and the media. There is no systematic reporting of de-risking activity by the Department of Labor, the PBGC or anyone else. The 2012 onslaught of de-risking transactions caught many by surprise. That may be about to change.
The 15-member ERISA Advisory Council on Employee Welfare and Pension Benefit Plans (Council) is appointed by the Secretary of Labor to advise him or her on various matters arising under ERISA. The 2013 Council examined Locating Missing and Lost Participants, Successful Retirement Plan Communications for Various Population Segments, and Private Sector Pension De-Risking and Participant Protections.
The Council reported to the Secretary on the last item (de-risking) in November 2013. 11 One of its findings was that plan sponsors, participants and the pension system in general would benefit from the collection of information to track de-risking trends.
In September 2014, the PBGC issued a Notice titled Proposed Submission of Information Collection for OMB Approval. 12 The Notice included information to the effect that the PBGC intends to revise the 2015 filing procedures and instructions (presumably Form 5500 filings) to require reporting of certain undertakings to cash out or annuitize benefits for a specified group of former employees. “Former employees” presumably include retirees and beneficiaries. Comments were to have been submitted by November 24, 2014.
It appears that after the 2015 filings and their tabulation and publication, we will have authoritative data on the extent and nature of de-risking. Some retroactivity would be nice.
Now What?
Anecdotal evidence suggests that de-risking activity dropped off in 2013 and 2014. No doubt many plan sponsors were surprised and impressed by the events of 2012. It takes time and work to transfer risk to the participants through a lump sum distribution and/or to an insurance company through a group annuity.
All indications are that de-risking activity will increase in 2015 and thereafter. In late 2013, Towers Watson, a major consulting firm, published a study based on a survey of 180 respondents (86% of whom were finance executives). 13 It found that 75% of respondent companies had a road map or a “journey plan” to de-risk. Large plans (more than $5 billion in assets) were less likely to have plans to de-risk than smaller plans.
Conclusion
Private sector DB pension plans have been in decline since the mid-1980s. Many of those that remain are fully or partially frozen or are hybrid CB or pension equity plans. The avalanche of de-risking activity that began in 2012 and will likely recur in 2015 and after. De-risking may be the end game for private sector employer funded pension plans as we have known them.
Of course, some DB plans will remain. Large established employers in commanding market positions and regulated monopolies able to pass costs forward to their customers or rate payers will be among them. However, employers in more competitive product markets will not. As more employers de-risk their pension plans, those with continuing DB plans will come under increasing cost pressure to follow suit.
We are at the end of an era. Private sector traditional pension plans emerged in large numbers in the 1950 and continued to grow through the mid-1980s. They then started their long decline in terms of number of plans and active participants due in part to the passage of ERISA and its many strengthening amendments. De-risking may be the beginning of the end. Henceforth, responsibility for retirement income beyond the often-meager social security retirement benefits will rest with the individual rather than the employer. That’s troubling.
Footnotes
Declaration of Conflicting Interests
The author declared no potential conflicts of interest with respect to the research, authorship, and/or publication of this article.
Funding
The author received no financial support for the research, authorship, and/or publication of this article.