
Abstract
Traditional long-term executive incentive plans (LTIPs) too often fail in volatile markets because they rely on fixed, absolute targets that are susceptible to overconfidence bias and unpredictable external economic shifts. These impacts result in erratic payouts, alternating between windfall gains and demotivating zeros, that fail to align executive incentives with genuine performance. This article employs Trane Technologies as an illustrative case, drawing on publicly disclosed financial data from 2015 through 2024, to demonstrate a more resilient alternative: the Indexed LTIP. By adding operating metrics such as revenue growth and EBITDA against industry peers and utilizing a percentile ranking system, the approach offers boards and compensation committees a stress-tested methodology to reduce payout volatility and improve long-term alignment with shareholder interests.
Keywords
The LTIP Target-Setting Challenge
A number of U.S. companies have shifted to performance-based equity compensation, performance share units (PSUs), replacing the once-ubiquitous stock option plan, perhaps due to the inherent payout volatility of options and the ensuing talent retention risk they pose.
PSUs have been a reality in Switzerland for a decade longer than in the United States because stock options never took root in that jurisdiction. That head start has led to a distinctive perspective—an opportunity to grapple with, and ultimately resolve, the challenges of PSU-based LTIPs. This is particularly the case with respect to overly ambitious target levels and oscillating payout results, whereby plans alternate between paying below average—often nothing—and then paying the maximum in close sequence.
The most persistent challenge in LTIP design is target-setting. It constitutes the core of any effective PSU plan, yet it is deceptively misleading.
This paper offers an examination of how indexing may be employed to measure operating performance in LTIPs, thereby navigating an uncertain business environment as recommended by Nobel laureate Bengt Holmström. 1 The illustrative case is Trane Technologies PLC, a global provider of climate-control products and services, and its performance in comparison to its industry peers.
Contextualizing Performance: The Role of Industry Benchmarks
The illustration begins with a foundational exercise. Consider the following question: What constitutes an appropriate revenue growth target for Trane’s LTIP? An examination of the historical data reveals the dilemma. Figure 1 presents Trane’s past revenue growth trajectory. Trane Technologies’ revenue performance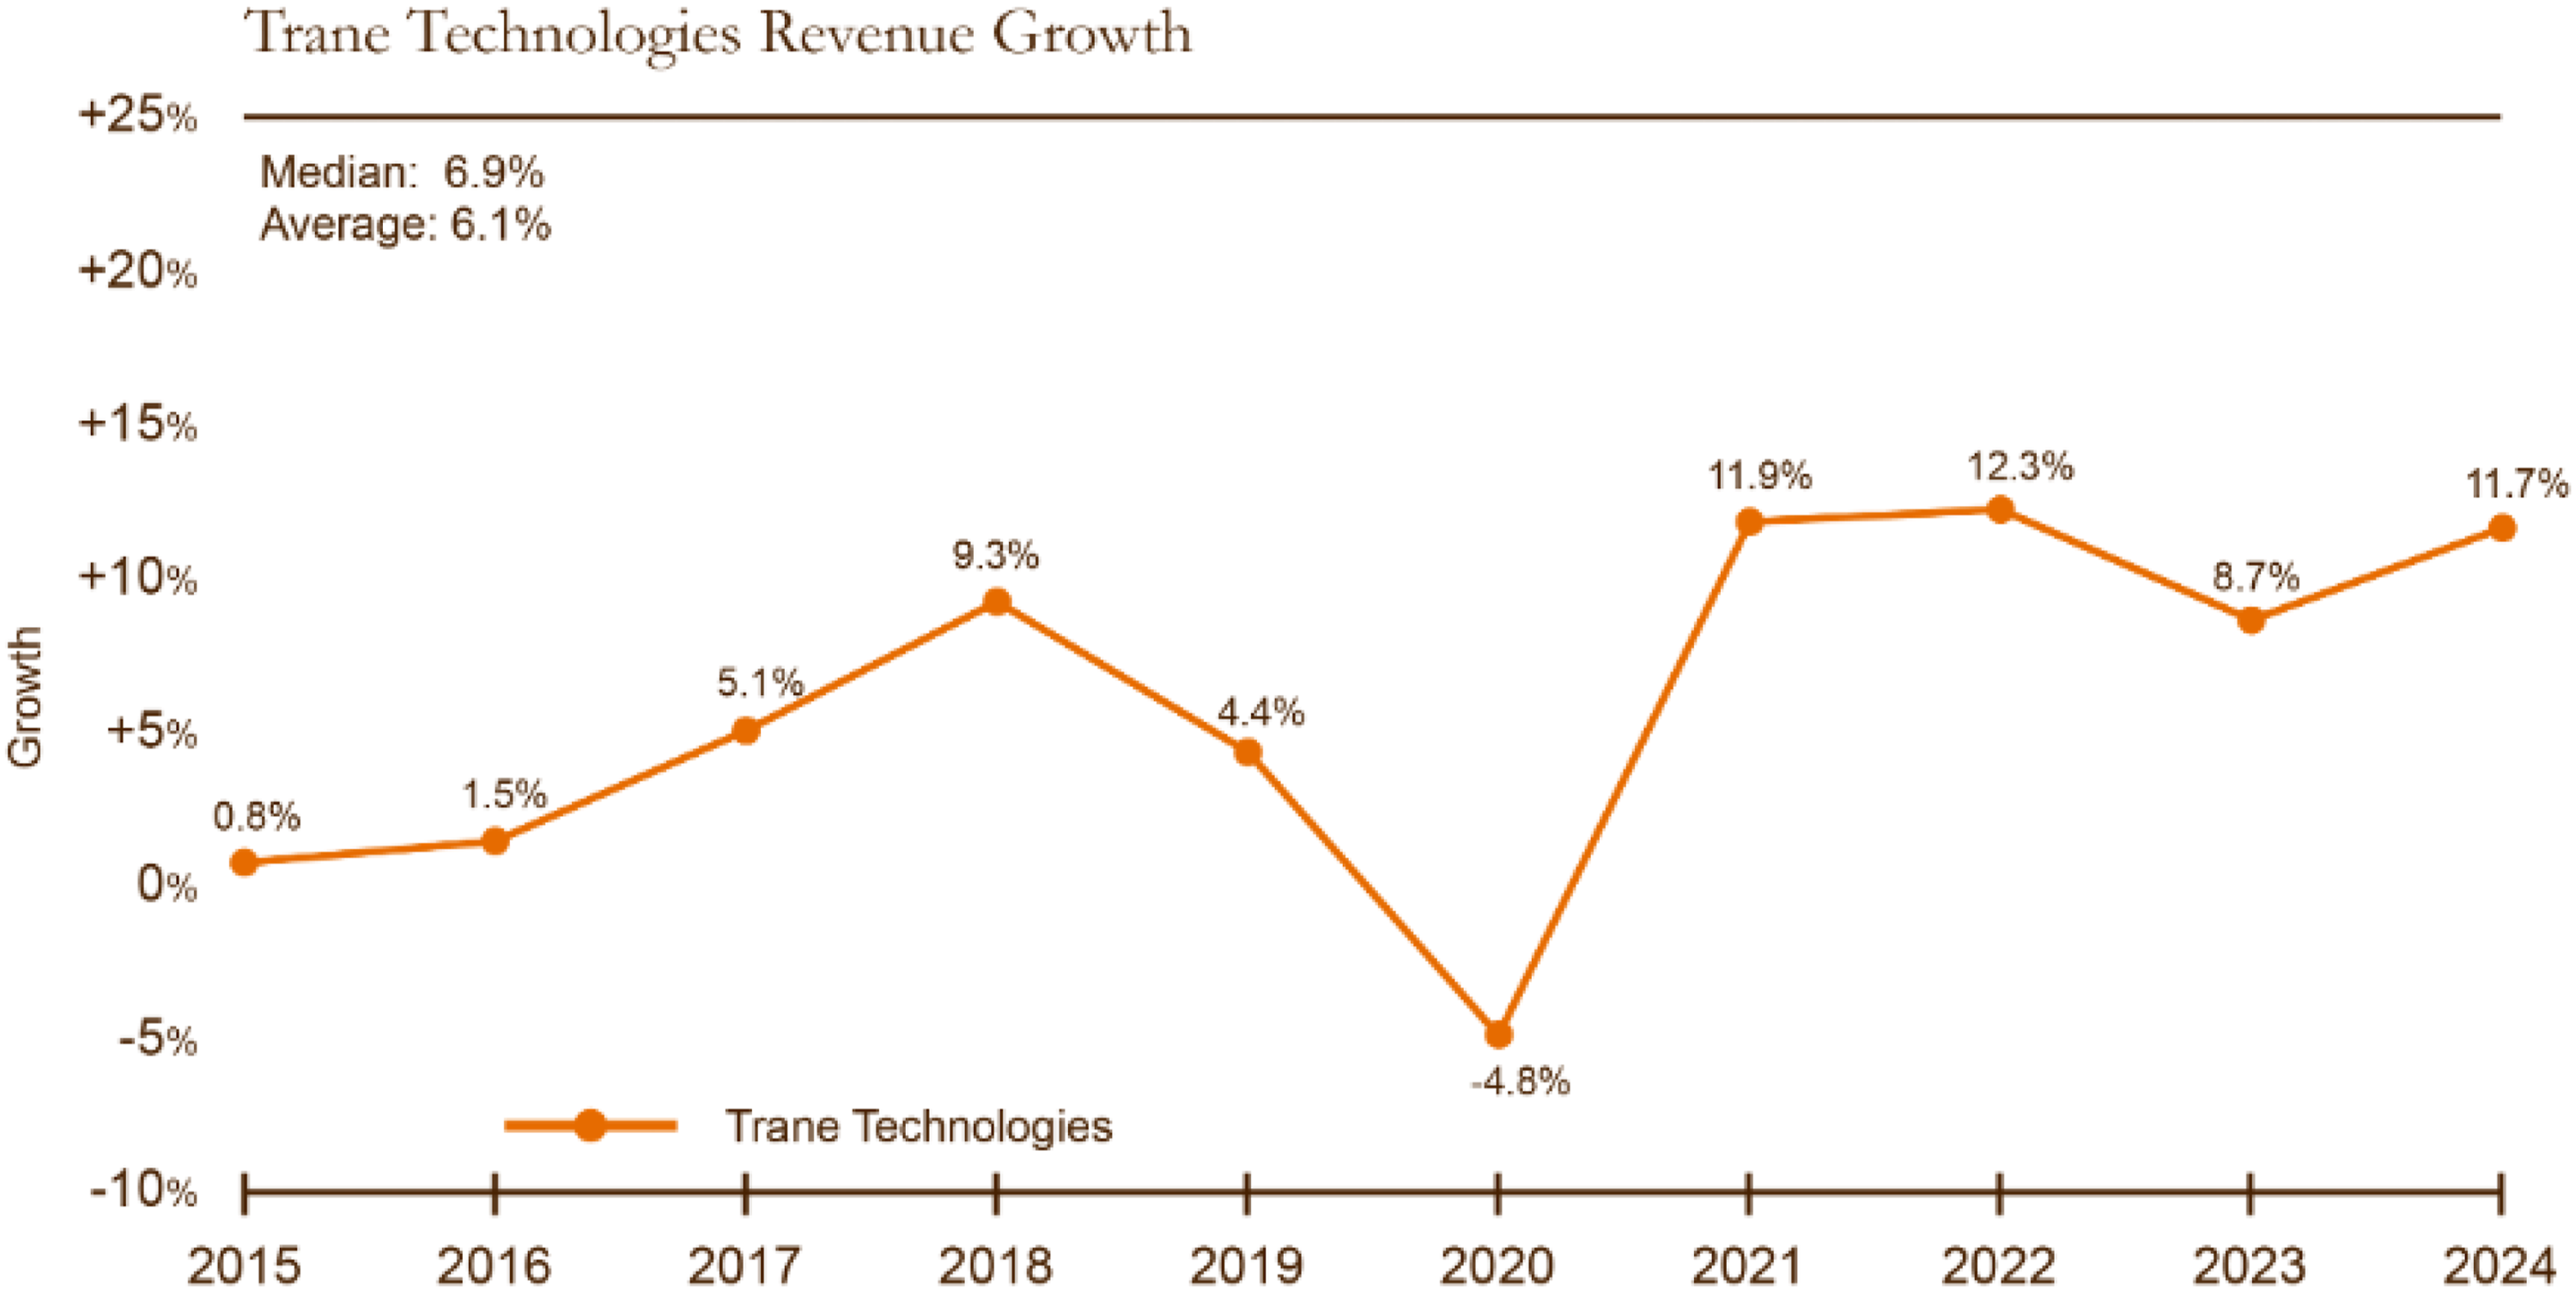
In the two most recent years depicted, the growth rate ranged from 8.7% to 11.7%, whereas prior to the pandemic, it was near or below 9%. The question of where to set a revenue growth target for a three-year LTIP is therefore nontrivial. If the target is set too high, executives may be demotivated; if too low, the plan fails to drive the performance sought by the board.
To fully apprehend Trane’s future growth potential, it is instructive to examine the broader picture—its industry. Figure 2 illustrates the performance of the industry in which Trane operates. The Industry Index represents the median growth performance of Trane’s peers. The fluctuations are notable—from a low of 0.4% in 2015 to a high of 16.4% in 2017, with an Industry Index average of 6.0%. The first and third quartiles, denoted by the blue shaded areas, are even further spread out. Trane Technologies’ peer industry revenue performance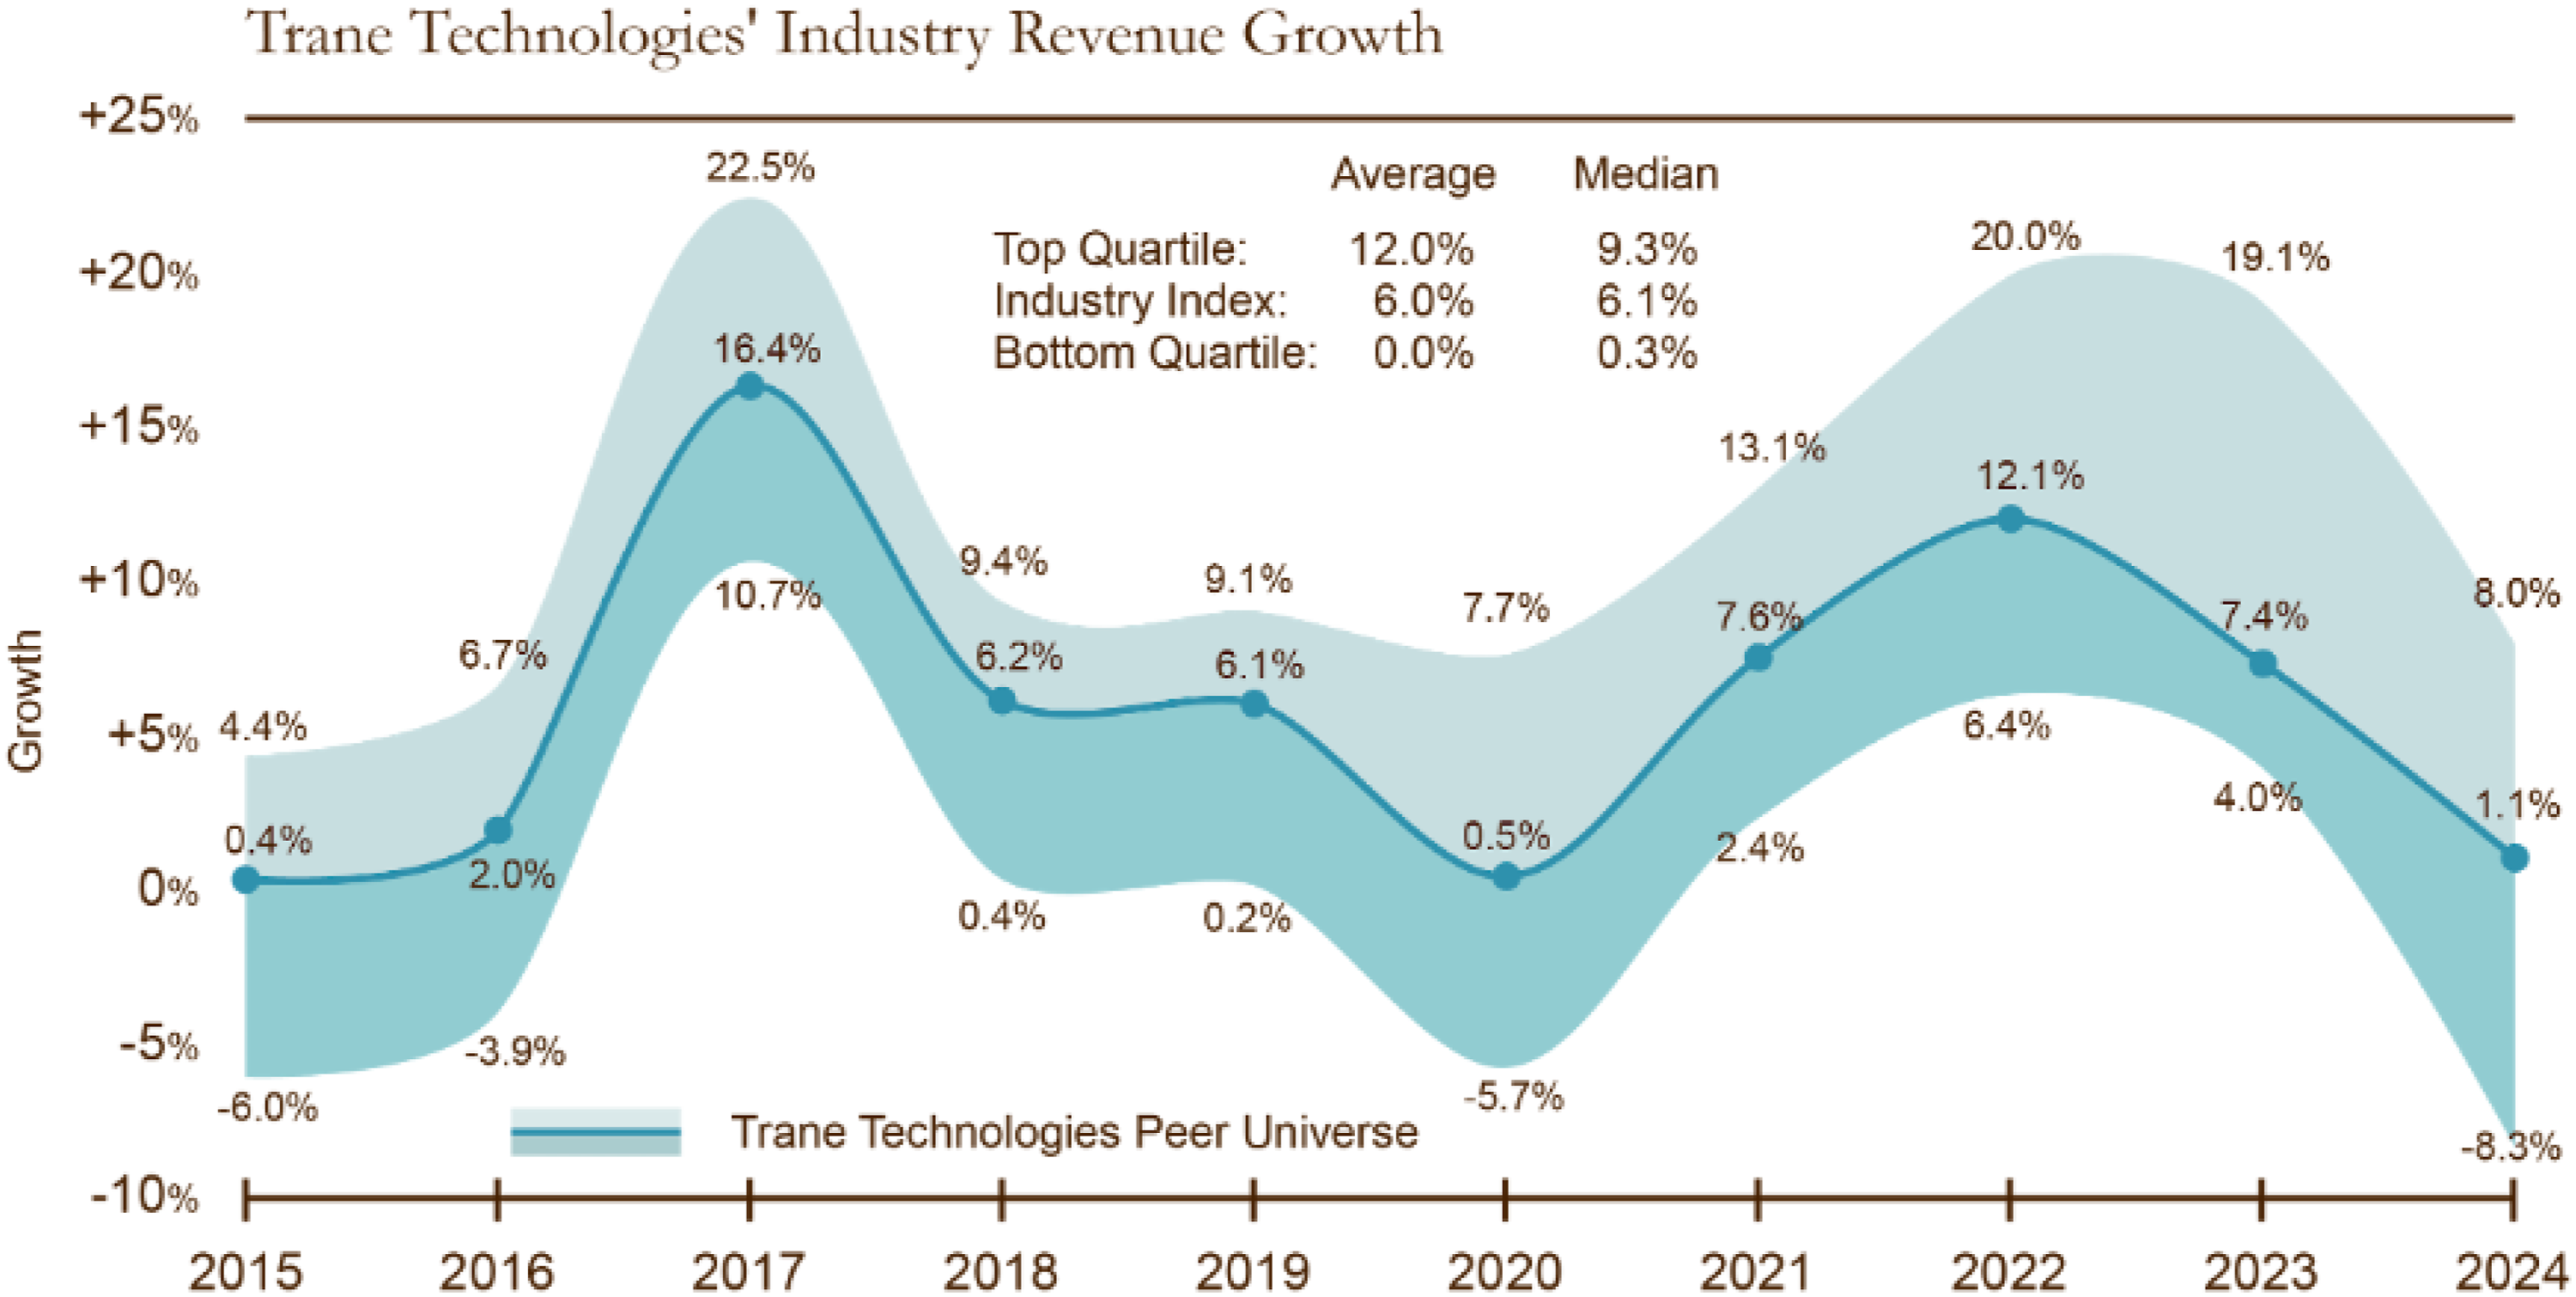
Armed with this broader industry perspective, the target-setting exercise warrants revisitation. Should the target be adjusted upward, downward, or left unchanged? Too many boards overlook this crucial discussion when defining LTIP metrics.
The Ambition Factor: Target Realism and Percentile Distributions
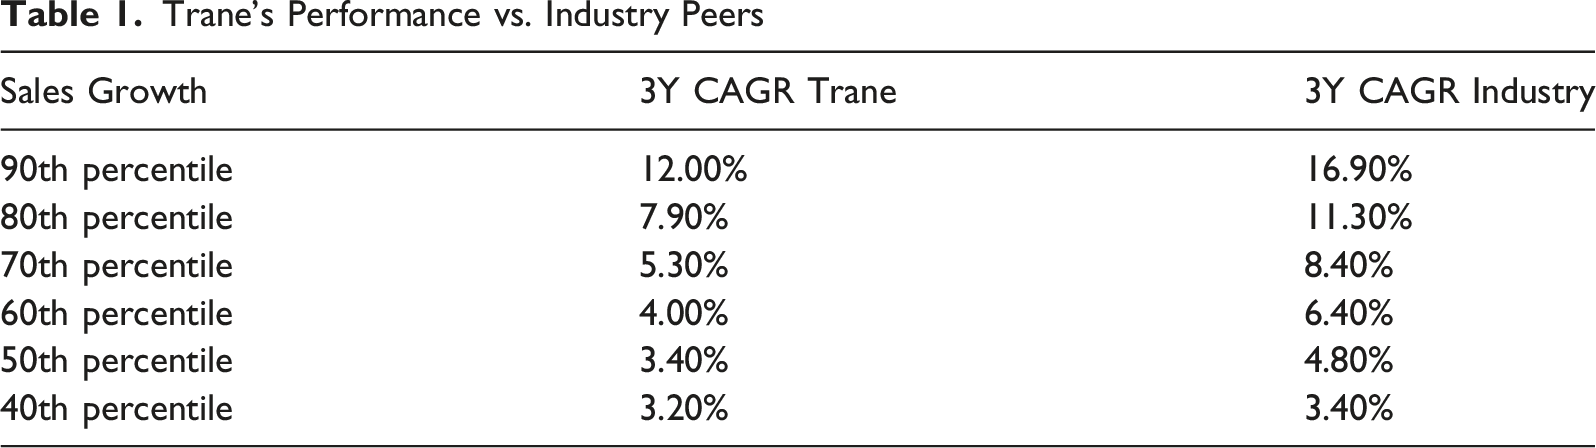
Trane’s Performance vs. Industry Peers
The simulation described herein provides a framework for observing the manifestations of overconfidence bias in executive decision-making. Despite the availability of comprehensive historical data for both the firm and its broader industry, performance targets are rarely established at the median level.
Anecdotal behavioral experiments conducted by the author corroborate this pattern. In controlled exercises in which participants were presented with the same historical data available in this study and asked to set forward-looking growth targets, a pronounced upward bias was consistently observed, with targets clustering in the 60th to 80th percentile range of historical outcomes. Although evidence of overconfidence in facilitated workshop environments is currently limited to anecdotal observations, a substantial body of psychological and economic research identifies the specific conditions under which this bias occurs, as analyzed in the subsequent discussion.
The Overconfidence Trap: When Ambition Backfires
This finding is consistent with the overconfidence literature: participants do not aim for average outcomes; they strive for exceptional ones. While such ambition is appropriate in strategic planning, any target set above the historical median results in LTIP payout probabilities that fall below the median—a structural feature that systematically reduces the actual probability of payout and undermines the retention function of the plan.
The implications for LTIP design are severe: targets that consistently exceed industry benchmarks result in the systematic underpayment of talent, eroding motivation, and increasing the risk of executive attrition to competitors.
The underlying mechanism is what the behavioral finance literature identifies as overconfidence bias—the systematic tendency of individuals to overestimate their own abilities and their organization’s potential. Roll (1986) first documented this phenomenon in the context of corporate decision-making, demonstrating that managerial hubris leads to the overvaluation of expected outcomes. Malmendier and Tate (2005) extended this work with empirical evidence showing that overconfident CEOs systematically overestimate the returns to their investment projects, a finding that maps directly onto the target-setting process in LTIPs. 2 When executives and board members set performance targets, they are subject to the same cognitive distortions: ambitious growth projections are perceived as realistic, even when historical probability distributions suggest otherwise.
While Setting Ambitious Targets is Entirely Rational in the Context of a Strategic Plan, Such Ambition is Counterproductive When Linked to Executive Pay
However, there exists a method to reconcile ambition with empirical reality. Indexing operating performance—combining company performance with industry performance—provides a mechanism to counteract overconfidence bias and eliminate the distortions introduced by overly ambitious long-term targets.
Figure 3 illustrates how this combination works for revenue growth, which is a synthesis of the two preceding charts. Operating index revenue growth – Trane Technologies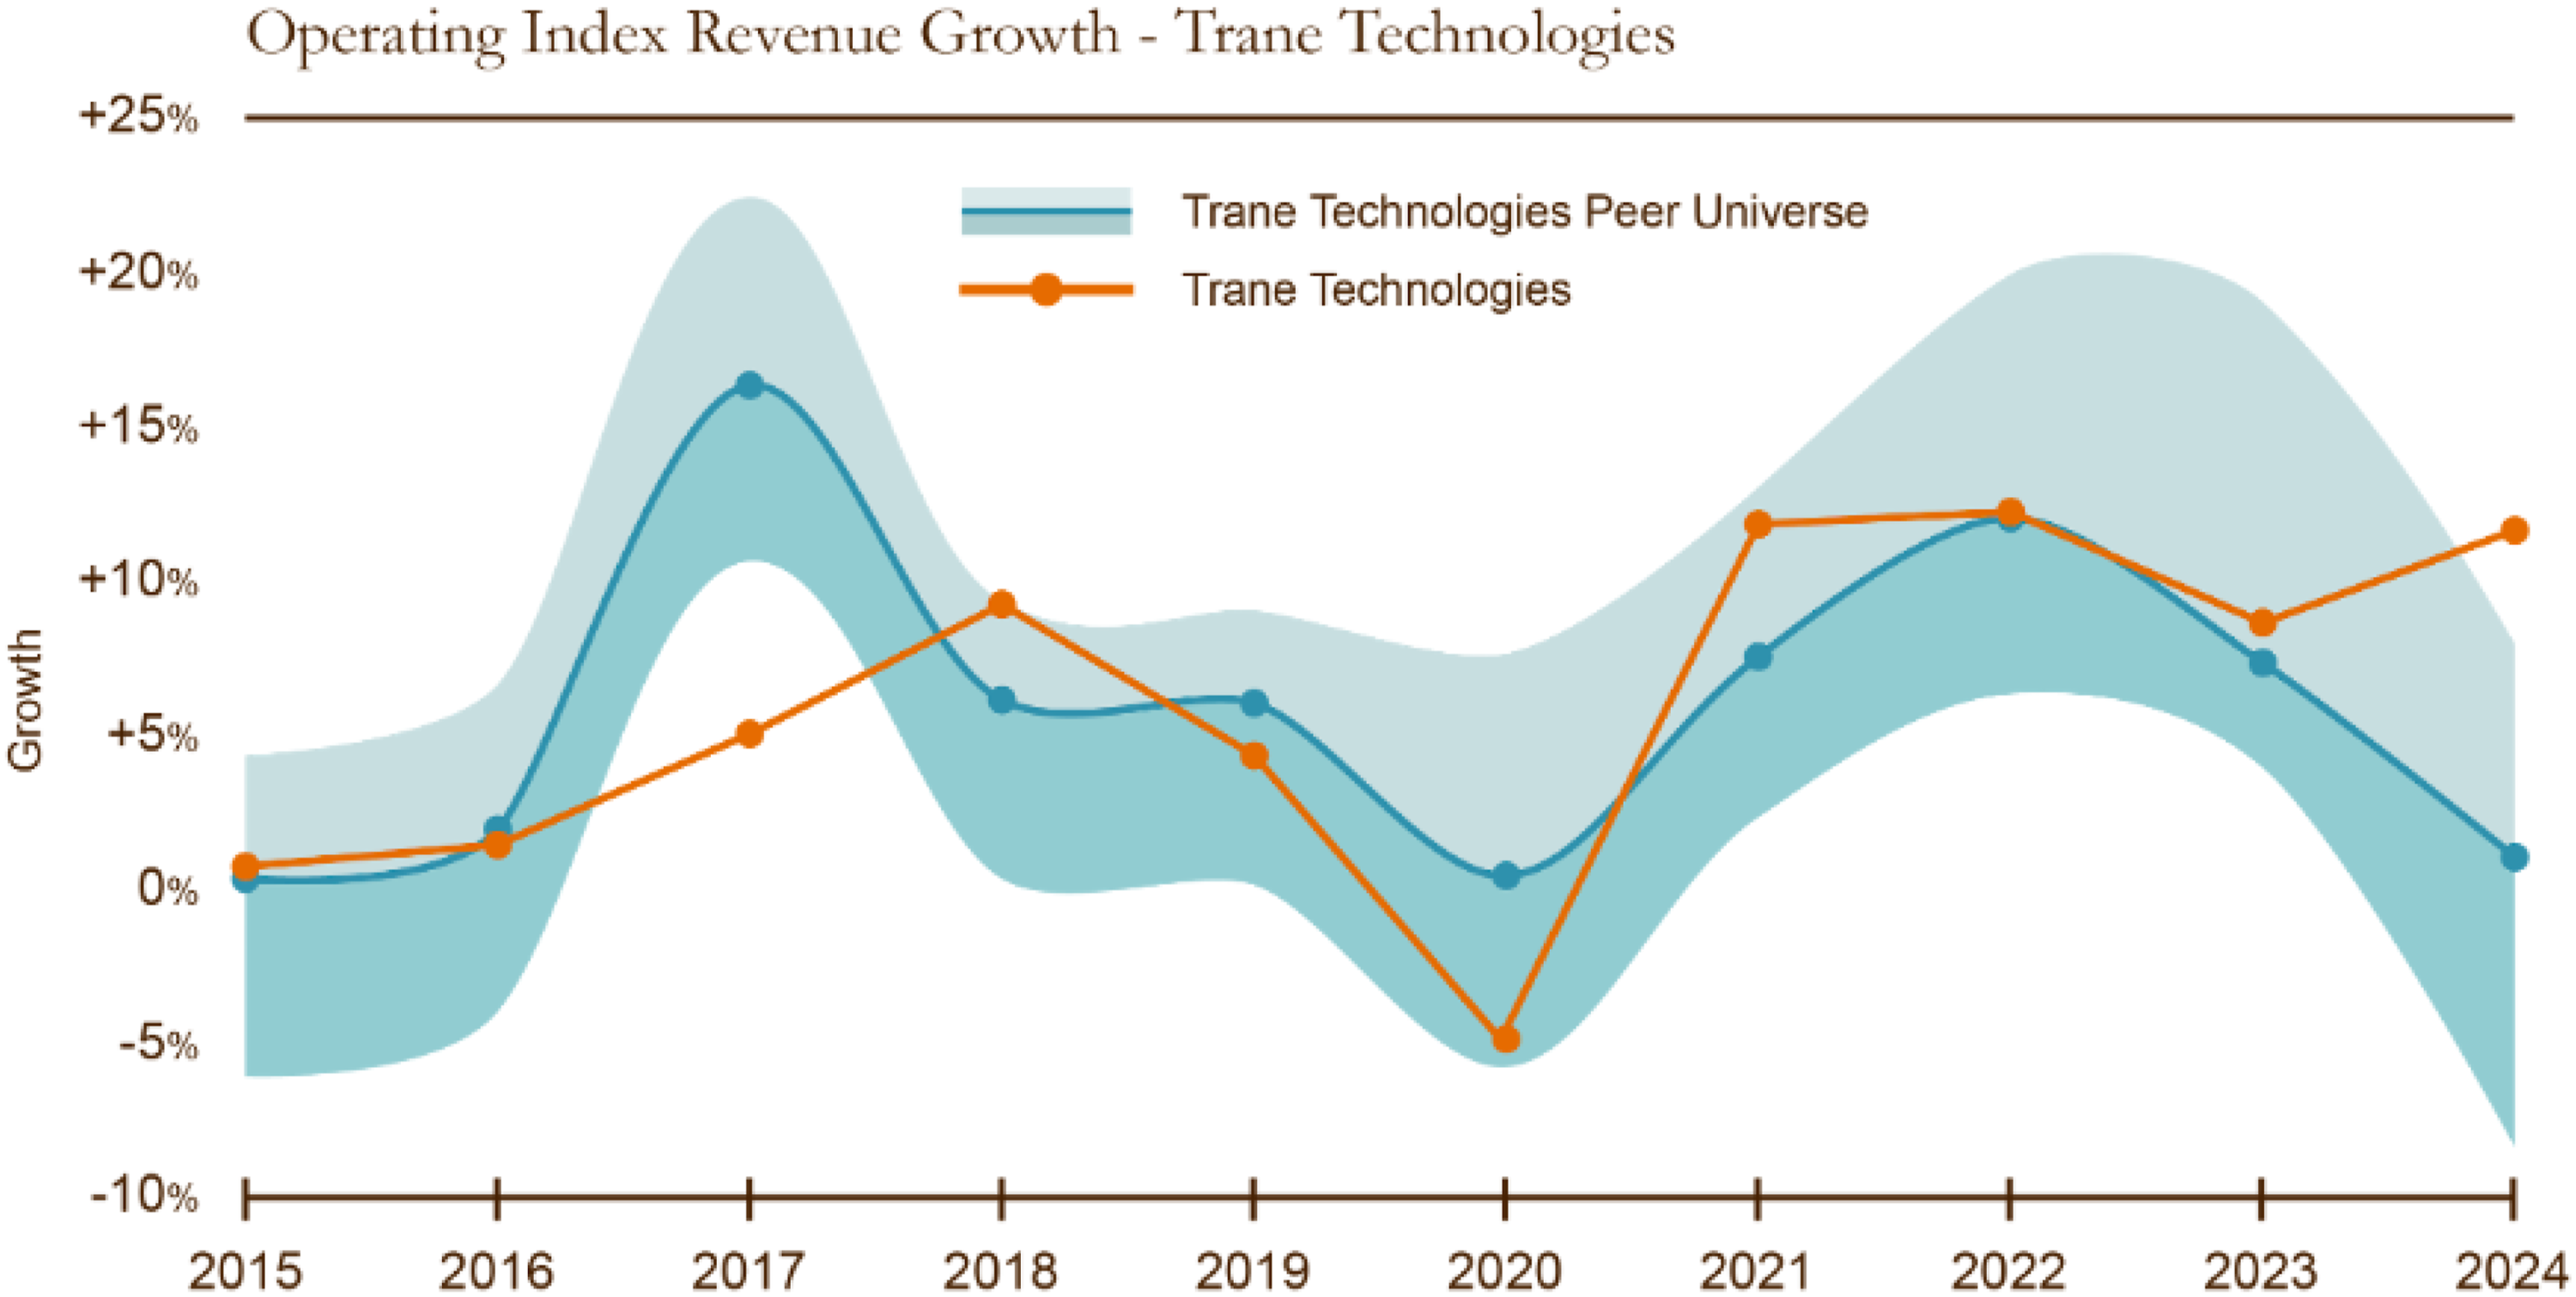
Figure 3 depicts what is termed the
With the Operating Index, it is possible to discern at a glance when a company is genuinely excelling and when it is lagging behind—without displaying the actual underlying numbers, a feature that enhances accessibility for non-financial executives.
Consider 2016. Sales growth increased that year, yet Trane’s orange line dips below the industry first quartile, an underperformance. Conversely, 2023 reveals an outperformance, despite lower absolute sales growth than the previous year.
The Operating Index is versatile. It functions as a universal language for performance, applicable to any metric incorporated into an LTIP: sales growth, earnings before interest, taxes, depreciation, and amortization (EBITDA), earnings per share (EPS), and the ubiquitous total shareholder return (TSR).
Peer Group Construction and Validation
Reviewers in the field of Relative Performance Evaluation (RPE) frequently highlight the risk of “cherry-picking” peers to guarantee payouts. To mitigate this concern, a multi-stage selection process is employed:
Initial Universe Identification
A broad list of approximately 3,000 potential peers is initially identified using GICS (Global Industry Classification Standard) and SIC (Standard Industrial Classification) codes related to Industrials, Electrical Equipment, and Building Products.
Size and Regional Filters
To ensure economic comparability, companies are filtered to include only those with annual revenues exceeding USD 100 million. No regional restrictions is applied initially to account for global business cycles and competition, though the final set is typically weighted toward companies with similar geographic footprints to the focal company.
Categorization of Similarity
Applying the industrial organization framework established by Porter (1980), the peer universe is categorized into three distinct cohorts to reflect multidimensional competitive pressures: (i) product market peers consisting of direct competitors within the climate-control industry; (ii) supply chain peers exhibiting similar vertical dependencies; and (iii) capital market peers competing for investment within the broader industrial sector. By stratifying the peer group according to these structural forces, the resulting Operating Rank provides a normalized measure of performance relative to entities subject to analogous economic conditions.
Operational Validation (Operating Trend)
To ensure the peer group was not merely “industry-similar” but “economically-aligned,” a correlation analysis was performed on historical operating trends. Companies whose financial performance exhibited a negative or negligible correlation with the focal company over a five-year look-back period were excluded, ensuring that the Operating Rank reflects true relative skill rather than divergent market forces.
Other than in pay-level benchmarking, the strategic manipulation of performance benchmarks through biased peer selection, “cherry-picking,” is significantly constrained for growth-based metrics used for performance evaluation. This difficulty stems from the empirical observation that historical growth trajectories exhibit low autocorrelation and are limited predictors of future expansion. Within a competitive landscape, firms currently undergoing structural reorganization or turnaround phases may emerge as high-growth leaders in subsequent periods, complicating attempts to strategically select peers based on anticipated underperformance. A notable exception is platform-based organizations characterized by monopolistic advantages and sustained barriers to entry; however, such entities typically operate under distinct economic architectures and are rarely considered suitable peers for firms in traditional industrial sectors. Consequently, the inherent volatility and nonlinear nature of growth metrics function as a structural safeguard against intentional benchmark distortion.
The Operating Index: Eliminating Targets, Caps, and Floors
The Trane Technologies illustrative case is not a constructed example. The company experienced lower growth in 2023 than in 2022, and yet it outperformed the competition in relative terms. A fixed target, irrespective of the level at which it was set, would have yielded an unfairly lower payout than in the previous year. It would have led to a higher payout in 2022 when performance was actually worse than in 2023 when assessed relative to peers. In other words, the Operating Index is free of external effects that fall outside of management control.
From 25 years of providing clients with relative performance measurement, the experience demonstrates that most companies encounter situations in which they appear unfavorable in absolute numbers but are in fact performing well in relative terms, and vice versa. The context—the industry index—reveals the true story.
This observation is not merely anecdotal; it is grounded in economic theory. Bertrand and Mullainathan (2001) established the concept of “pay-for-luck” or “skimming,” demonstrating that CEO compensation in many firms responds to performance dimensions that are entirely beyond the executive’s control—favorable commodity price movements, exchange rate shifts, and macroeconomic tailwinds. 3 Their findings provide the central theoretical justification for indexing: by benchmarking against peers exposed to the same exogenous shocks, the compensation system filters out luck and rewards only the component of performance attributable to managerial skill. The Operating Index accomplishes precisely this filtering function.
Beyond the target itself, the conventional LTIP design requires the specification of performance hurdles (floors) and caps. In the Trane Technologies illustrative case, consider floors set at approximately 3.0% and caps at approximately 10.0%. In three periods, actual company performance would not have reached the hurdle, and in another three periods, it would have exceeded the cap.
Both outcomes are undesirable in a compensation system. Murphy (2013) characterized this distortion as the “kinked” nature of incentive pay: below the floor, executives have no marginal incentive to improve; above the cap, they are incentivized to defer performance to subsequent periods. 4 Not reaching the hurdle is demotivating, while exceeding the cap motivates executives to postpone performance to the following year—a rational behavioral response to the nonlinear payout structure. In 6 out of 10 years in the illustrative case, the LTIP would have been subject to this distortion, oscillating between paying nothing and paying the maximum. Plan beneficiaries are unlikely to accept that, on average, their compensation may reach target; the perception of unreliability undermines both motivation and retention.
Not Reaching the Hurdle is Demotivating, While Exceeding the Cap Motivates Executives to Postpone Performance to the Following Year
Averaging annual performance over multi-year periods alleviates this problem modestly, but indexing can resolve it entirely, because a company’s percentile rank is bounded: it can never be worse than the lowest-ranked peer or better than the highest-ranked peer. This makes the indexed LTIP payout resilient to any unexpected absolute performance result.
Navigating Uncertainty: The Operating Rank as a Bridge to Compensation Outcomes
The Operating Index itself does not prescribe how much to pay. It provides the intuitive relative performance picture, but it must be translated into actual compensation outcomes. This is accomplished through the
The Operating Rank functions as the bridge between performance and payout, filtering out the noise.
5
Figure 4 illustrates this conversion. In year ‘06 of the illustrative example, an Operating Index value of 1.8% translates into a 70th percentile rank in the Operating Rank. Similarly, an apparently low value of 1.0% in ‘03 actually corresponds to a 75th percentile rank. Operating ranks of financial metrics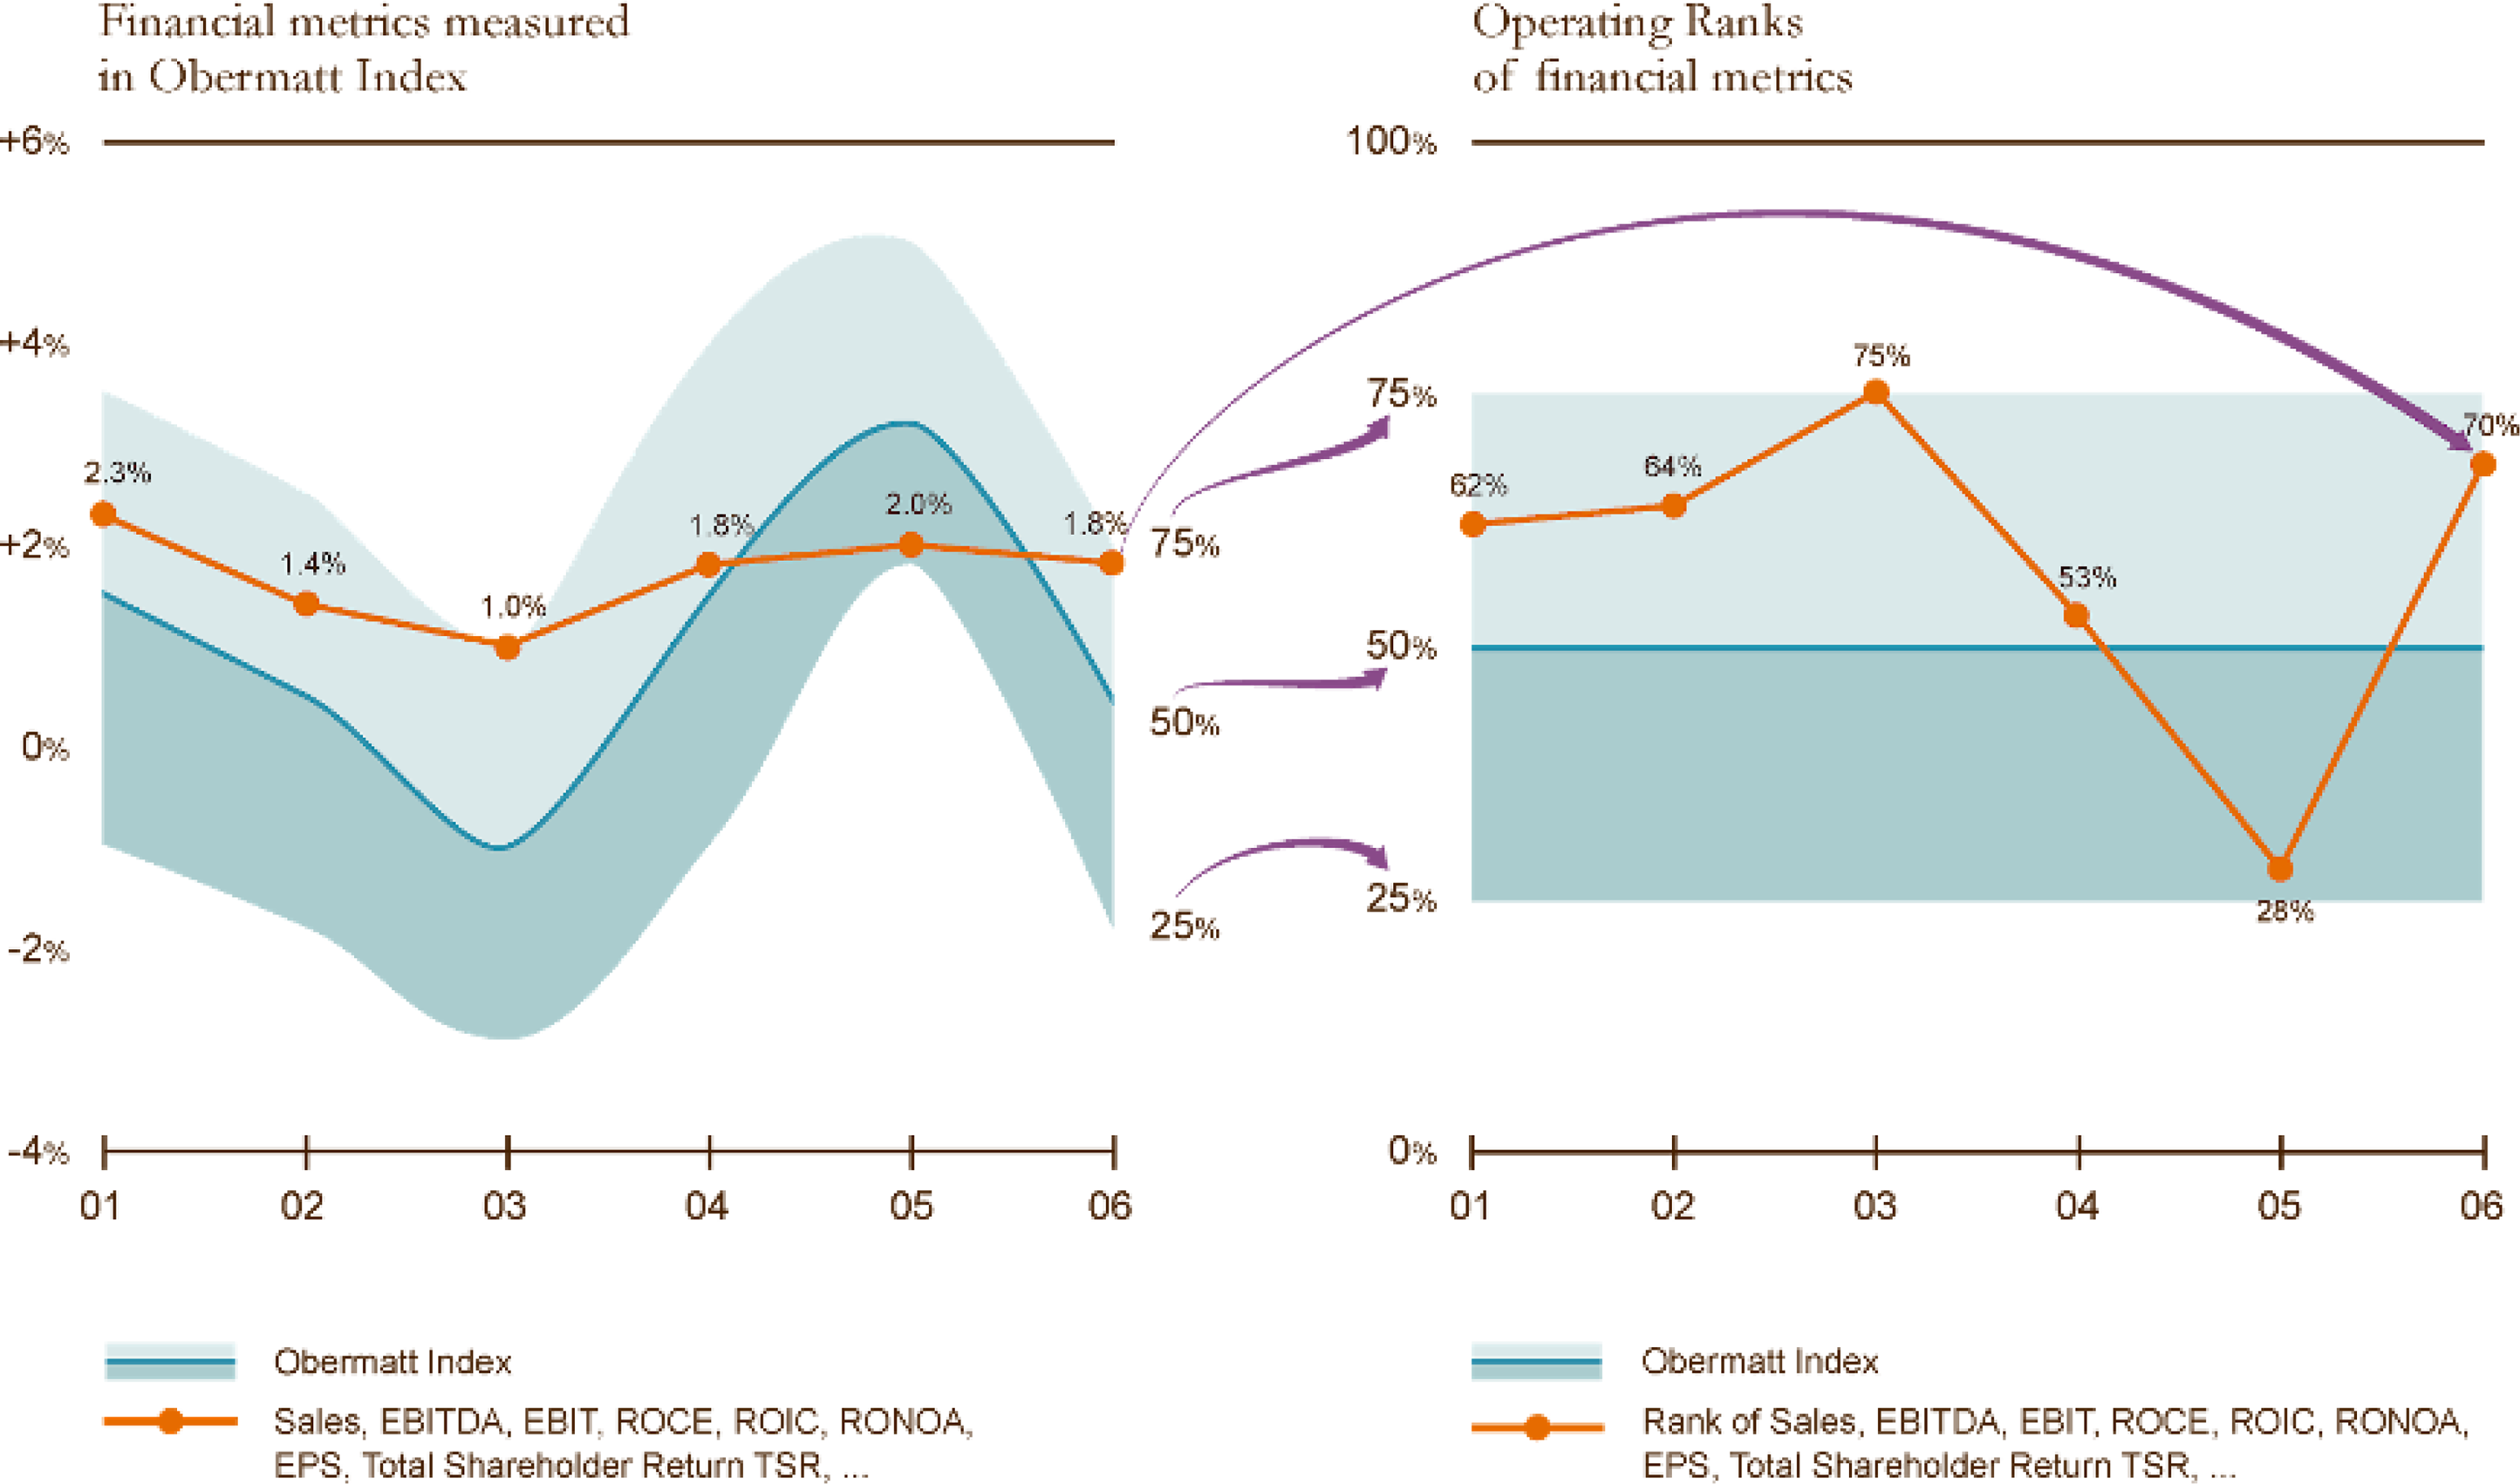
The apparent discrepancy arises because the Operating Rank is concerned exclusively with relative performance, whereas the Operating Index still employs absolute numbers. Executive performance is never meaningfully assessed in absolute terms; what matters is how a company compares to its peers. This is also the lens through which investors evaluate corporate performance.
This percentile ranking system is a language that managers understand. It originates in sports, where it is prevalent, and provides a clear, intuitive mechanism for understanding how performance translates into achievement and compensation. The approach moves beyond abstract metrics to create a direct link between performance and reward.
Leveling the Playing Field: The Power of Combined Ranks
The Operating Rank offers a further advantage. By converting all performance metrics into percentile ranks, their inherent differences are neutralized. Metrics as diverse as revenue growth, EBITDA, EPS, and TSR are placed on a level playing field. This enables all metrics to be combined into a single, unified visualization—a clear, concise representation of overall performance encompassing the key drivers of the business. Figure 5 illustrates this approach. Operating ranks – Trane Technologies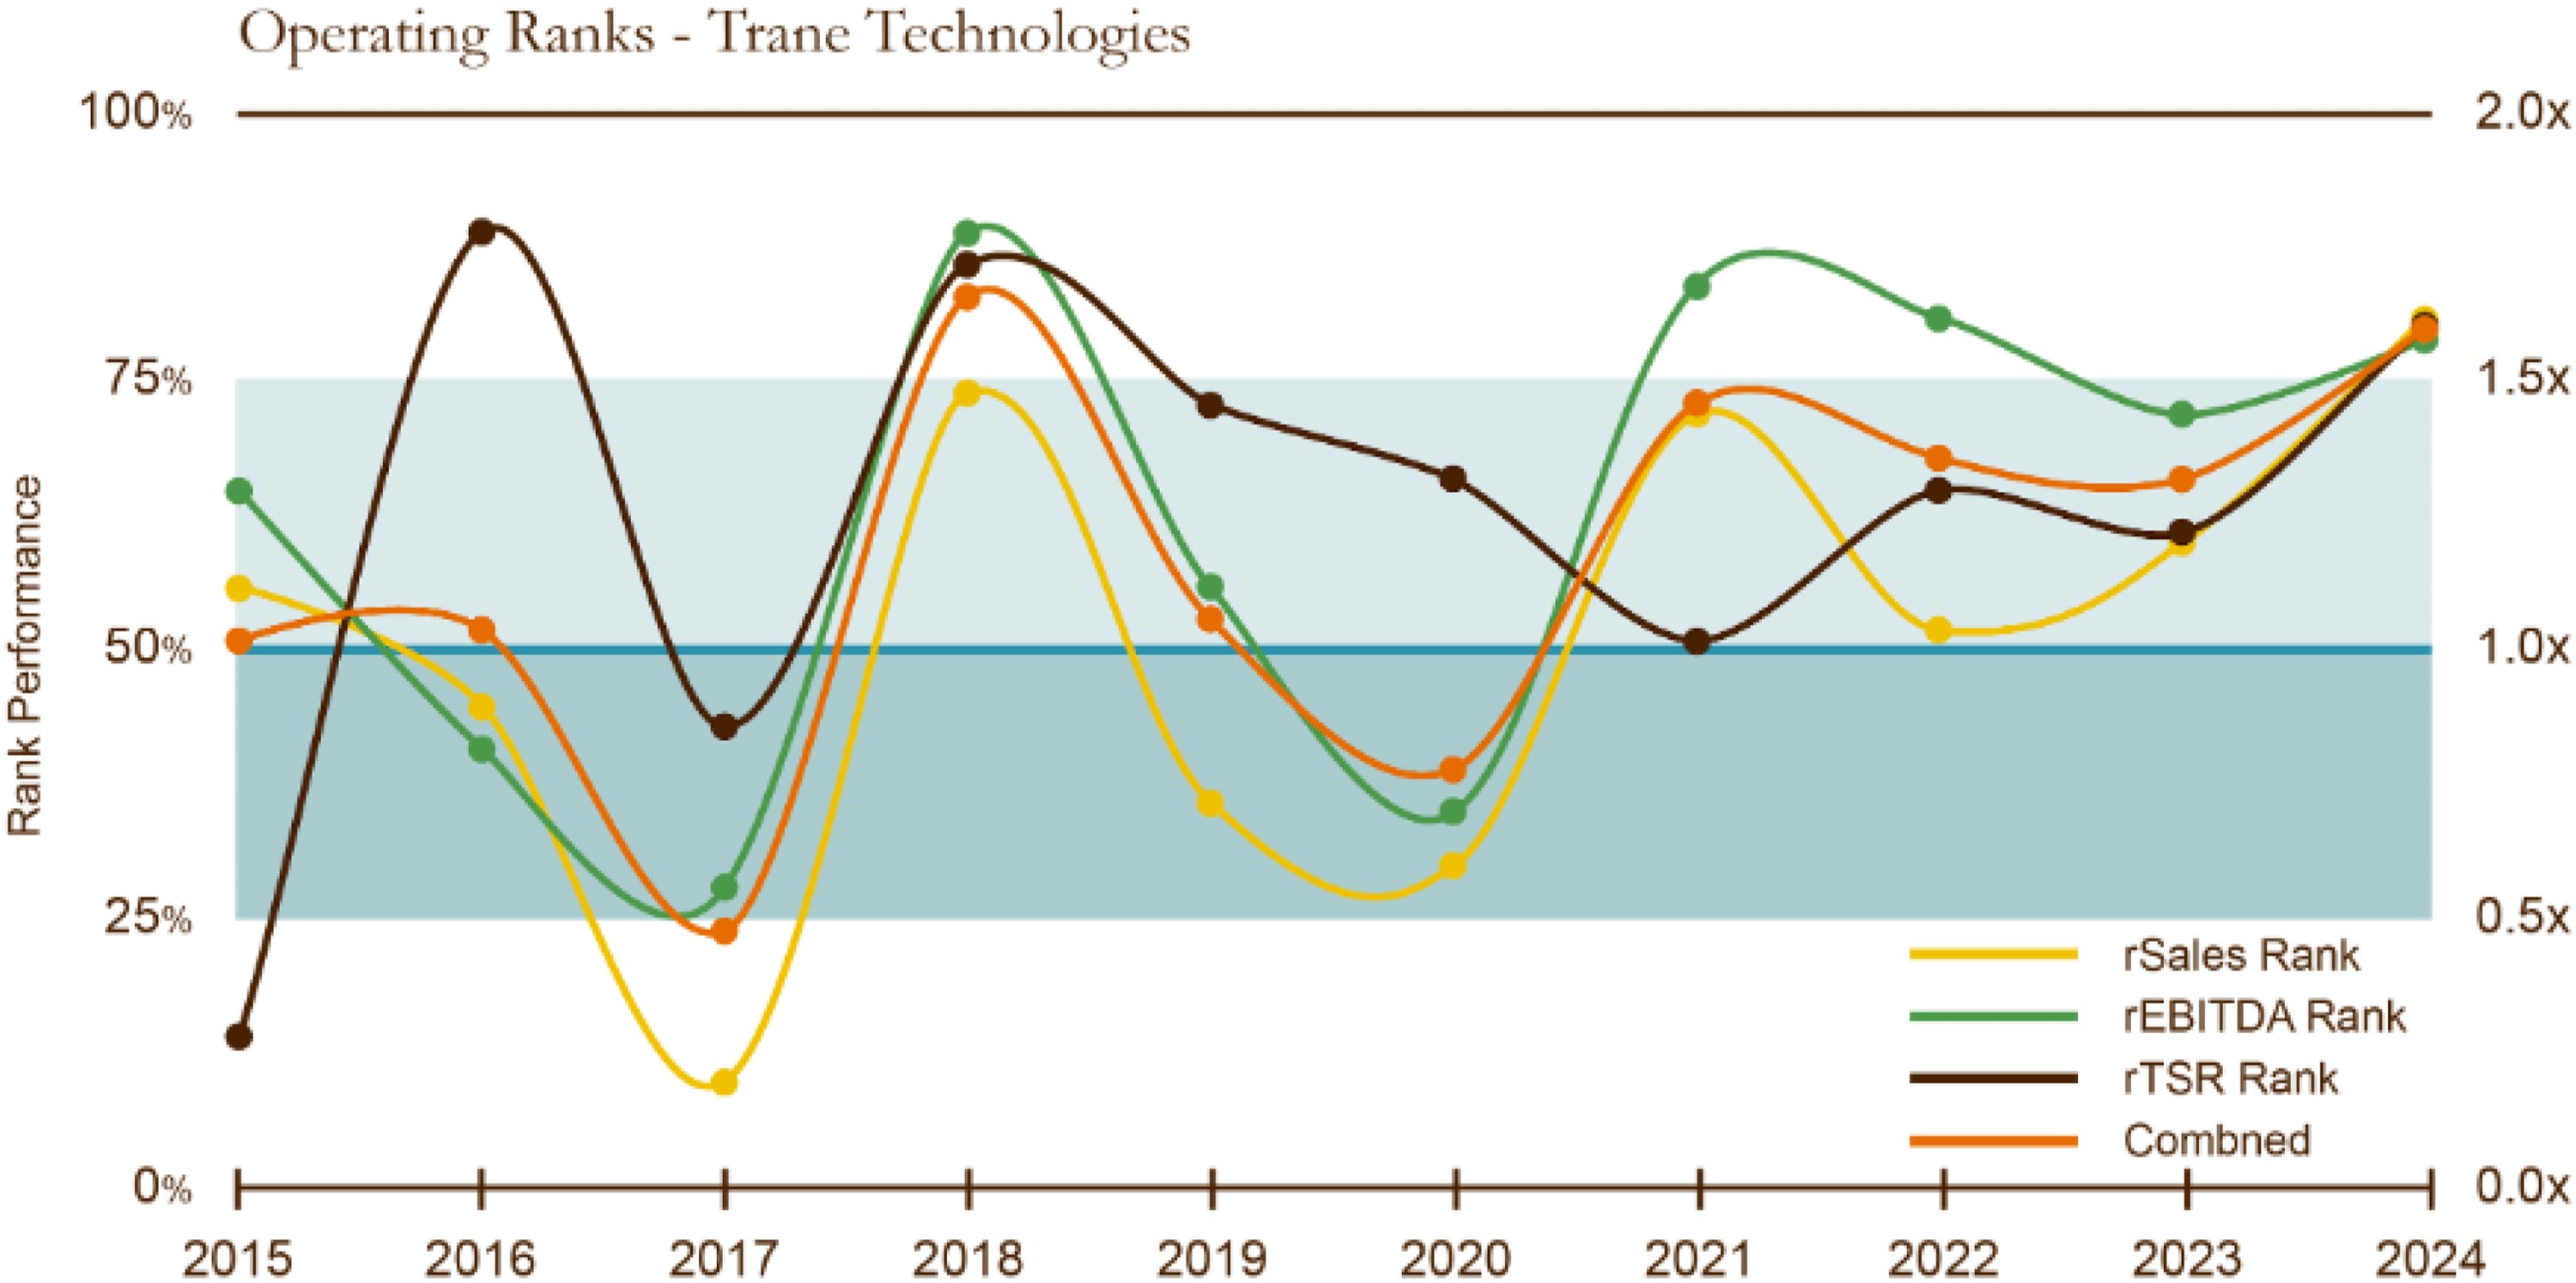
This Operating Rank for Trane Technologies combines three of the most prevalent widely used LTIP metrics: sales growth, profit growth (in this case, EBITDA, though it could also be EPS or ROCE), and TSR.
The orange line represents the combined performance—the average of the three individual metrics. The stability of that combined line is instructive. It is far less volatile than any of the individual metrics. It does not plummet as sales growth does in 2017 or as TSR does in 2015. It does not spike as dramatically as TSR in 2016 or profits in 2018. It provides a balanced, nuanced representation of the company’s overall performance. A formal statistical analysis (see Appendix B) confirms that the combined average rank exhibits significantly lower variance and year-to-year change than any single metric (p < 0.01).
That balance is precisely what is desired in executive compensation. Payouts should not swing wildly between zero and the maximum due to fluctuations in a single metric. What is required is a system that rewards sustained, well-rounded performance. Indexing performance is the key to resilient LTIP payouts that function in any cycle, keeping managers motivated to outperform the competition even in a recession when fixed targets become unachievable.
The LTIP Payout: Smoothing the Ride
In the Operating Rank illustration (Figure 5), the payout multiples for the LTIP are indicated by the right-hand vertical axis. A market median performance provides a market median payout: median performance pays one times target pay, the pay level determined to represent the market median for the compensation plan beneficiary:
Median Pay for Median Performance. The Higher the Rank, the Higher the Payout
A natural cap exists at two times target pay at the 100th percentile rank (2.0x target pay). This means the worst performer in the peer group receives nothing (0.0x target pay), corresponding to the bottom of the distribution.
Figure 6 transforms the annual Operating Rank view into a three-year LTIP payout simulation. The blue line, representing median performance, delivers a payout of one times the grant value (1.0x). The maximum payout is twice the grant amount, while the minimum is zero. LTIP payout history – Trane Technologies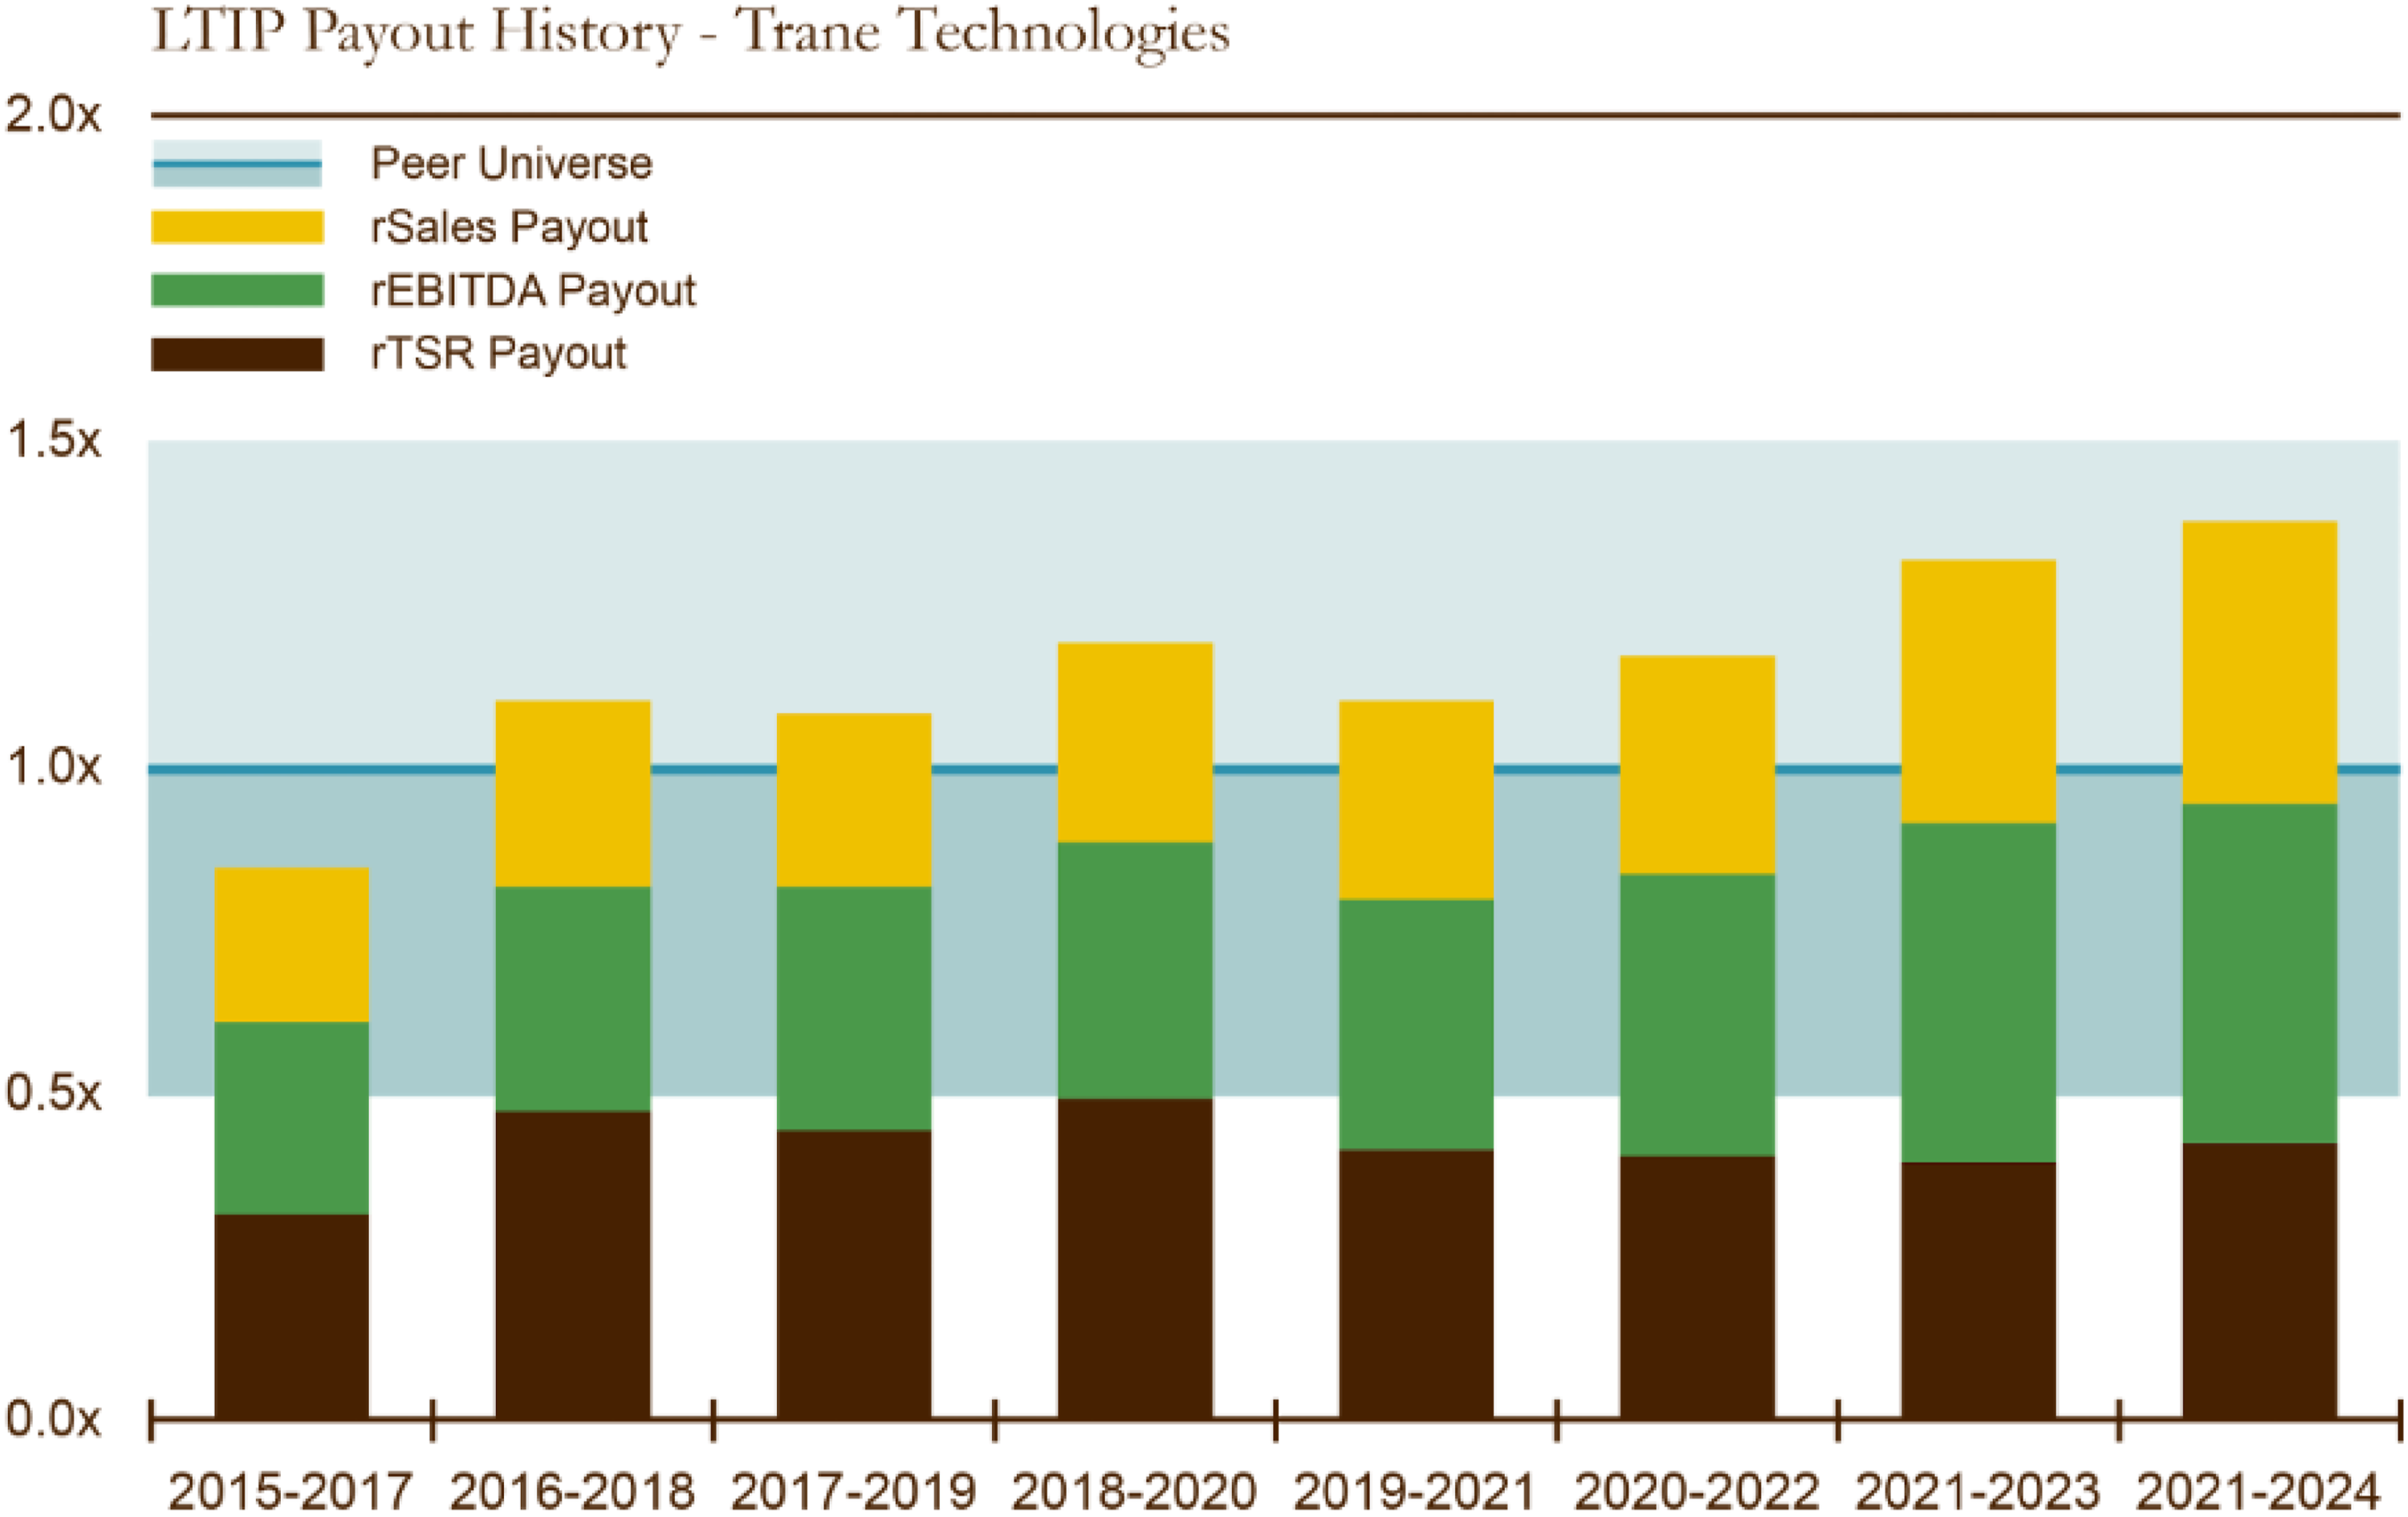
Had Trane Technologies employed this approach, its LTIP payouts would have closely mirrored the company’s actual performance trajectory: lower in the early years (2015–2017) and higher in recent years. The three colors represent the contributions from each performance metric, all based solely on publicly available data from Trane Technologies and its peers.
This is how relative performance is translated into tangible rewards. The design incentivizes executives to deliver across all key metrics, driving sustainable, long-term value creation. The alignment between pay and performance is crucial for building trust and credibility in the compensation system.
Putting It to the Test: Quantifying the LTIP Risk
To quantify the key advantage of indexing LTIPs-resilience, the same LTIP methodology was applied to Trane Technologies’ peers, simulating payouts based on their actual historical performance data.
The “LTIP Payout Probabilities” charted in Figure 7 illustrate the risk profile of the indexed LTIP design for Trane Technologies, stress-tested against the performance of all its peers. This provides a clear picture of the likelihood of various payout outcomes. LTIP payout probabilities – Trane Technologies peers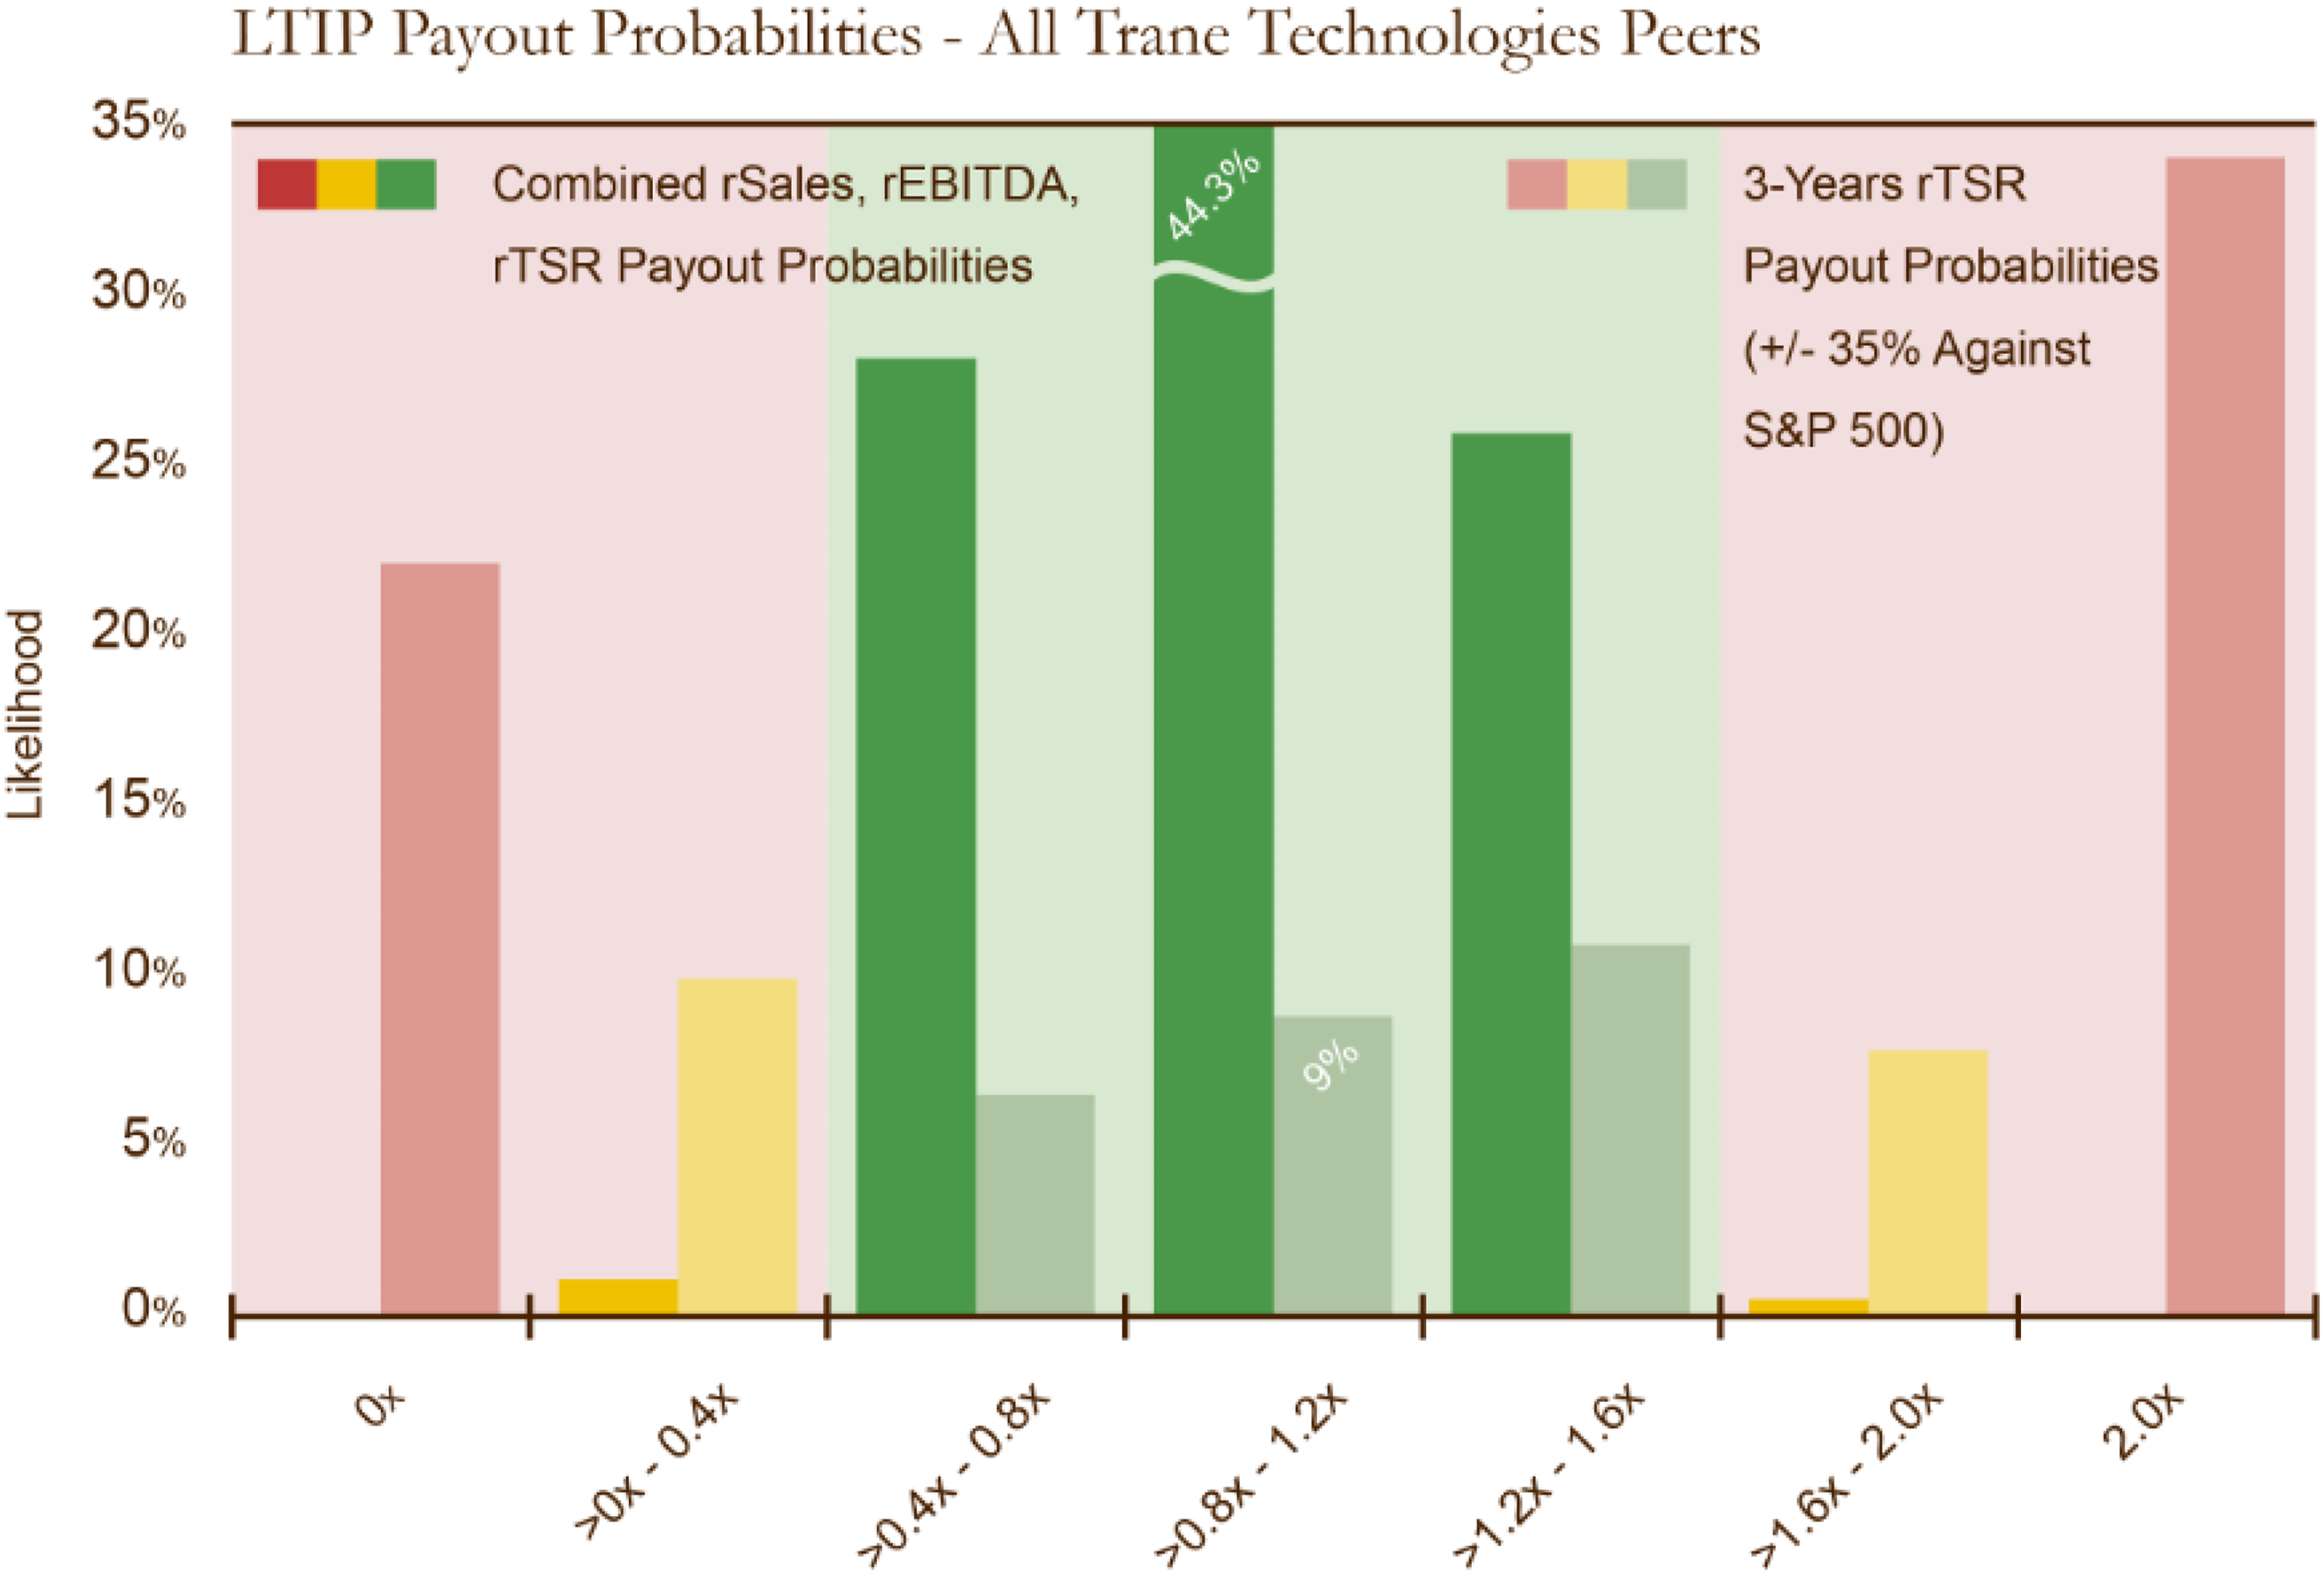
Figure 7 requires careful interpretation. The vertical axis displays the probability of occurrence for each payout range shown on the horizontal axis. Two designs are compared side by side within each payout bucket:
The results are compelling. Under the indexed design (solid bars), there is no bar for zero payout—a significant finding. Most payouts fall within the range of 0.4x to 1.6x the grant amount. The highest probability of vesting is concentrated in the desirable range of 0.8x to 1.2x grant value:
By contrast, the typical US S&P 500 rTSR design (shaded bars) exhibits an alarming risk profile. There is a 22% probability of zero payout and a 34% probability of maximum payout (shaded red bars). Extreme outcomes—either alienating executives or potentially upsetting shareholders—are the norm, occurring in 56% of cases. The probability of landing in the desirable 0.8x to 1.2x range is a meager 9%—less than one-tenth of the indexed design’s concentration.
This is the Stark Reality: Many Current LTIP Designs are Volatile, Unpredictable, and Often Misaligned With Desired Outcomes
All results presented herein are based on actual data from the S&P Capital IQ database.
The Payoff: Predictability, Performance, and Alignment
The analysis presented in this article validates the indexed LTIP design. It demonstrates that this approach delivers payouts that are not only aligned with performance but also more predictable and less prone to extreme fluctuations. The indexed LTIP design rewards sustainable, long-term value creation rather than unwanted short-term spikes or dips in payouts. The indexed LTIP design offers a compelling alternative—a compensation system that is:
Performance-driven
Payouts are closely linked to relative performance, ensuring that rewards are genuinely earned.
Predictable
Payouts are less prone to extreme swings, providing greater certainty for executives and the company.
Balanced
The design avoids overemphasizing any single metric, promoting a holistic approach to value creation.
An indexed LTIP design represents a move beyond fixed-target-setting practices toward a more resilient, data-driven indexing approach. It establishes compensation systems that motivate executives to deliver sustainable, long-term value in any market cycle, building a stronger, more resilient connection between pay and performance—placing the entire team in competition against the market, not against each other.
Supplemental Material
Supplemental Material - From Volatility to Validity: An Indexed Approach to Long-Term Incentive Plan Target-Setting
Supplemental Material for From Volatility to Validity: An Indexed Approach to Long-Term Incentive Plan Target-Setting by Hermann Stern in Compensation & Benefits Review.
Footnotes
Funding
The author received no financial support for the research, authorship, and/or publication of this article.
Declaration of conflicting interests
The author declared no potential conflicts of interest with respect to the research, authorship, and/or publication of this article.
Supplemental Material
Supplemental material for this article is available online.
Notes
Author Biography
References
Supplementary Material
Please find the following supplemental material available below.
For Open Access articles published under a Creative Commons License, all supplemental material carries the same license as the article it is associated with.
For non-Open Access articles published, all supplemental material carries a non-exclusive license, and permission requests for re-use of supplemental material or any part of supplemental material shall be sent directly to the copyright owner as specified in the copyright notice associated with the article.