






Abstract
This prospective cohort study compared the efficacy of bictegravir/emtricitabine/tenofovir alafenamide (BIC/FTC/TAF) and tenofovir/lamivudine/efavirenz (TLE) regimens in 88 treatment-naïve persons living with HIV. The BIC regimen achieved faster HIV-1 RNA suppression at week 12, with comparable suppression thereafter. Regarding HIV-1 DNA, the TLE group exhibited a more rapid decline, largely attributable to its higher baseline levels, while both groups converged to comparable levels at week 48; this difference was no longer significant after adjusting for baseline HIV-1 DNA levels. Notably, the BIC group had significantly lower baseline CD4+ counts, reflecting the real-world inclusion of individuals with more advanced disease. Cluster analysis within the BIC group revealed three distinct DNA decay trajectories. A subset of individuals with the lowest baseline CD4+ counts (Cluster 1, n = 16) showed stable HIV-1 DNA through week 48 followed by significant decline only after 72 weeks, with CD4/CD8 ratio recovery preceding the decline. The early DNA plateau may reflect the interplay between immune reconstitution and viral reservoir dynamics. These findings suggest that baseline immune status influences early viral reservoir dynamics and that the timing of reservoir reduction may be linked to immune restoration, highlighting the heterogeneity of integrase inhibitor responses and the potential value of baseline immune assessment in guiding individualized management.
Introduction
Acquired immunodeficiency syndrome (AIDS), caused by the human immunodeficiency virus (HIV), remains a critical global public health challenge. While highly active antiretroviral therapy can effectively suppress viral replication and enable long-term virological suppression for people living with HIV (PLWH), 1 the persistence of the cellular HIV viral reservoir, which prevents a complete cure, constitutes a major obstacle to achieving a functional cure. 2 Among the various metrics for assessing the viral reservoir, total cellular HIV-1 DNA load is widely recognized as a key biomarker,3,4 closely associated with disease progression, immune recovery capacity, and long-term clinical outcomes.5–10
In recent years, next-generation antiretroviral drugs, particularly integrase strand transfer inhibitors (INSTIs), have become a cornerstone of first-line therapy due to their potent and rapid virological suppression, favorable safety profile, and high genetic barrier to resistance.11,12 Evidence suggests that INSTI-based regimens show potential in reducing HIV-1 DNA reservoir levels.13–15 However, a systematic understanding of the specific dynamics of HIV-1 DNA load in response to INSTI therapy among individuals with different clinical characteristics, particularly varying baseline immune status, and its interplay with the process of immune reconstitution, remains insufficiently explored. This heterogeneity is crucial for evaluating the depth of treatment efficacy and advancing toward personalized clinical management.
Therefore, this prospective cohort study aims to systematically compare the longitudinal dynamics of HIV-1 DNA load in treatment-naïve PLWH who initiated either an INSTI-based or a non-INSTI-based regimen. It further seeks to analyze the association between these dynamics and the recovery of virological and immunological parameters. The findings are intended to provide new insights for optimizing therapeutic strategies and exploring individualized clinical management pathways.
Subjects and Methods
Subjects
Between January 2023 and June 2024, a total of 125 eligible antiretroviral-naïve PLWH were consecutively recruited at the Ninth People’s Hospital of Dongguan. The inclusion criteria were as follows: (1) age ≥18 years; (2) confirmed HIV-1 infection by a confirmatory test or nucleic acid supplemental test; and (3) voluntary participation with signed informed consent. The exclusion criteria were as follows: (1) any prior history of antiretroviral therapy; (2) presence of uncontrolled severe opportunistic infections, active malignancy, or end-stage renal disease at enrollment; or (3) anticipated poor adherence to follow-up or any other condition that could potentially compromise the evaluation of study outcomes. All enrolled participants were assigned to one of two groups based on their initial antiretroviral regimen: the BIC group (bictegravir/emtricitabine/tenofovir alafenamide initiation) or the TLE group (tenofovir disoproxil fumarate/lamivudine/efavirenz initiation). The study protocol was reviewed and approved by the Ninth People’s Hospital of Dongguan. Written informed consent was obtained from all participants.
Methods
Sample collection
Two 5-mL tubes of peripheral venous whole blood were collected from each participant using EDTA-K2 vacuum blood collection tubes. One tube was processed in the clinical laboratory of the Ninth People’s Hospital of Dongguan for the measurement of plasma HIV-1 RNA load and CD4+ and CD8+ T lymphocyte counts. The other tube of anticoagulated whole blood was transported at room temperature to the Dongguan Institute of Microscale and Precision Medical Measurement within 4 h of collection for HIV-1 DNA quantification and HIV-1 genotypic resistance testing.
Quantitative detection of HIV-1 RNA
Plasma HIV-1 RNA levels were quantified at the Guangdong Provincial Center for Quality Control in HIV/AIDS Clinical Care. Viral load testing at baseline and week 24 employed commercial detection kits from Livzon (Zhuhai, China) or DaAn (Guangzhou, China). From week 48 onward, testing was performed using the COBAS AmpliPrep/TaqMan assay (Roche, CA, USA). All results are reported in log10 copies/mL.
CD4+ and CD8+ T lymphocyte counting detection
CD4+ and CD8+ T cells counts were determined by flow cytometry (FACS Caliber; BD Biosciences, New Jersey, USA), and the CD4/CD8 ratio was calculated. The entire procedure was performed in strict accordance with the manufacturer’s instructions and standard operating protocols.
Quantitative detection of HIV-1 DNA
Total cellular DNA was extracted from 200 μL of whole blood using a commercial nucleic acid extraction kit (SUPBIO, Guangzhou, China). HIV-1 DNA was then quantified using a fluorescence-based real-time SUPBIO HIV-1 Quantitative Detection Kit (SUPBIO) on a SLAN-96P real-time PCR system (Tianlong, Shanghai, China). The results are expressed as HIV-1 DNA copies per million cells (copies/106 cells). The assay has a sensitivity of 50 copies/106 cells and a linear quantitative range of 100 to 1 × 10⁶ copies/106 cells. All results are reported in log10 copies/106 cells.
HIV-1 genotypic drug resistance testing and subtype identification
HIV-1 genotypic drug resistance testing and subtype identification were conducted at the Dongguan Institute for Microscale and Precision Medical Measurement. The method was performed as we previously described. 16 The assay targets and covers the reverse transcriptase and protease regions of the HIV-1 pol gene, as well as the integrase region. To identify drug resistance mutations (DRMs) and viral subtype, sequences were analyzed through the Stanford University HIV Drug Resistance Database (https://hivdb.stanford.edu/hivdb/by-patterns). Based on the resistance scoring system, isolates were categorized as having low (L), intermediate (I), or high (H) levels of resistance, with those in the I or H categories being interpreted as phenotypically resistant.
Statistical analyses
Statistical analysis was performed using SPSS (version 24.0), and graphs were generated with GraphPad Prism (version 10.6). Categorical variables are presented as frequency (n) and percentage (%). Continuous numerical variables are expressed as the mean ± SD or median (interquartile range). Between-group comparisons were made using the χ2 test for categorical variables and the Mann–Whitney U test for non-normally distributed continuous variables. Correlation analysis was performed using Spearman’s rank correlation. Longitudinal changes were assessed using linear mixed-effects models (LMM) with random intercepts. Fixed effects included treatment group, time, and their interaction. The Group × Time interaction was the primary focus for comparing trajectories between groups. A two-sided P < 0.05 was considered statistically significant.
Results
General information
This study included 88 treatment-naïve PLWH who completed all planned follow-up visits at weeks 0, 24, and 48. The cohort comprised 52 individuals in the BIC group and 36 in the TLE group. Additional virological data were available for a proportion of participants at weeks 12, 72, and 84. Samples at weeks 72 and 84 were obtained from participants who had reached these time points by the data cutoff; the extended follow-up was not yet completed for the entire cohort. The two groups were comparable at baseline, as shown by no significant differences in demographic and clinical characteristics, such as sex, age, and HIV-1 subtype (Table 1). All individuals were confirmed by baseline genotypic resistance testing to be without clinically relevant resistance to the study drugs.
General Information of Participants
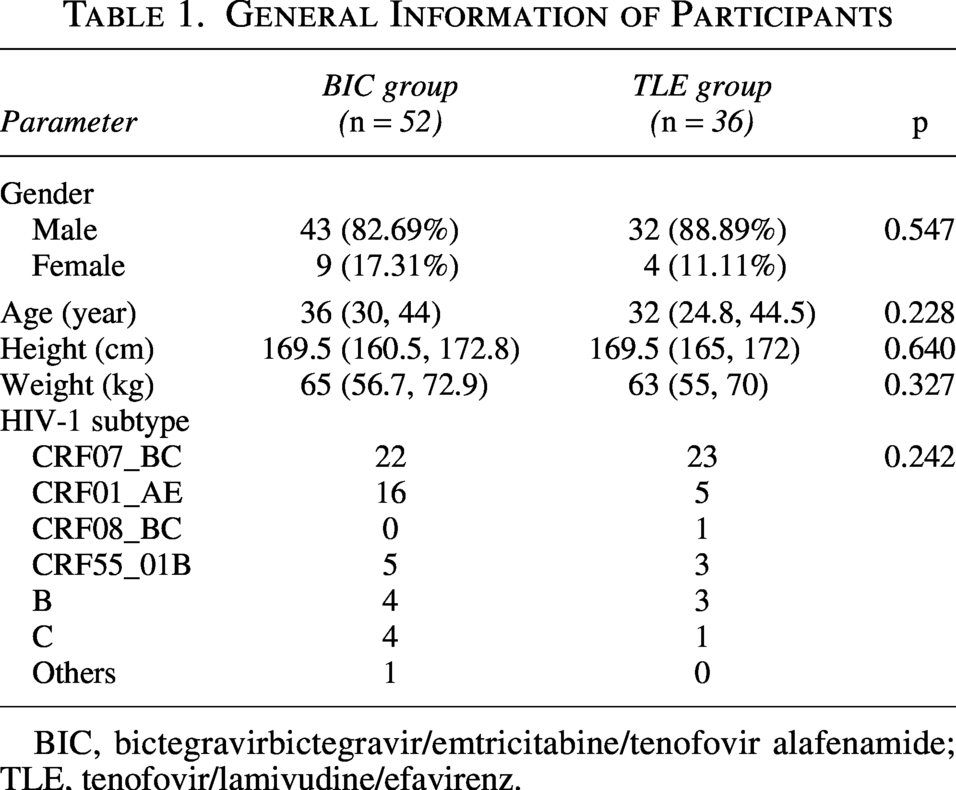
BIC, bictegravirbictegravir/emtricitabine/tenofovir alafenamide; TLE, tenofovir/lamivudine/efavirenz.
Comparisons of virologic and immunologic parameters over time
At baseline, the two groups were comparable in terms of HIV-1 RNA, HIV-1 DNA, and CD4/CD8 ratio. However, both CD4+ and CD8+ T cell counts were significantly higher in the TLE group than in the BIC group (p = 0.032 and 0.003, respectively). At both weeks 24 and 48 of treatment, no statistically significant differences were observed between the groups for any of the measured parameters, including HIV-1 RNA, HIV-1 DNA, CD4+ T cell count, CD8+ T cell count, and CD4/CD8 ratio (Table 2).
Analysis of Differences in Monitoring Indicators at Baseline, 24 Weeks, and 48 Weeks of Treatment
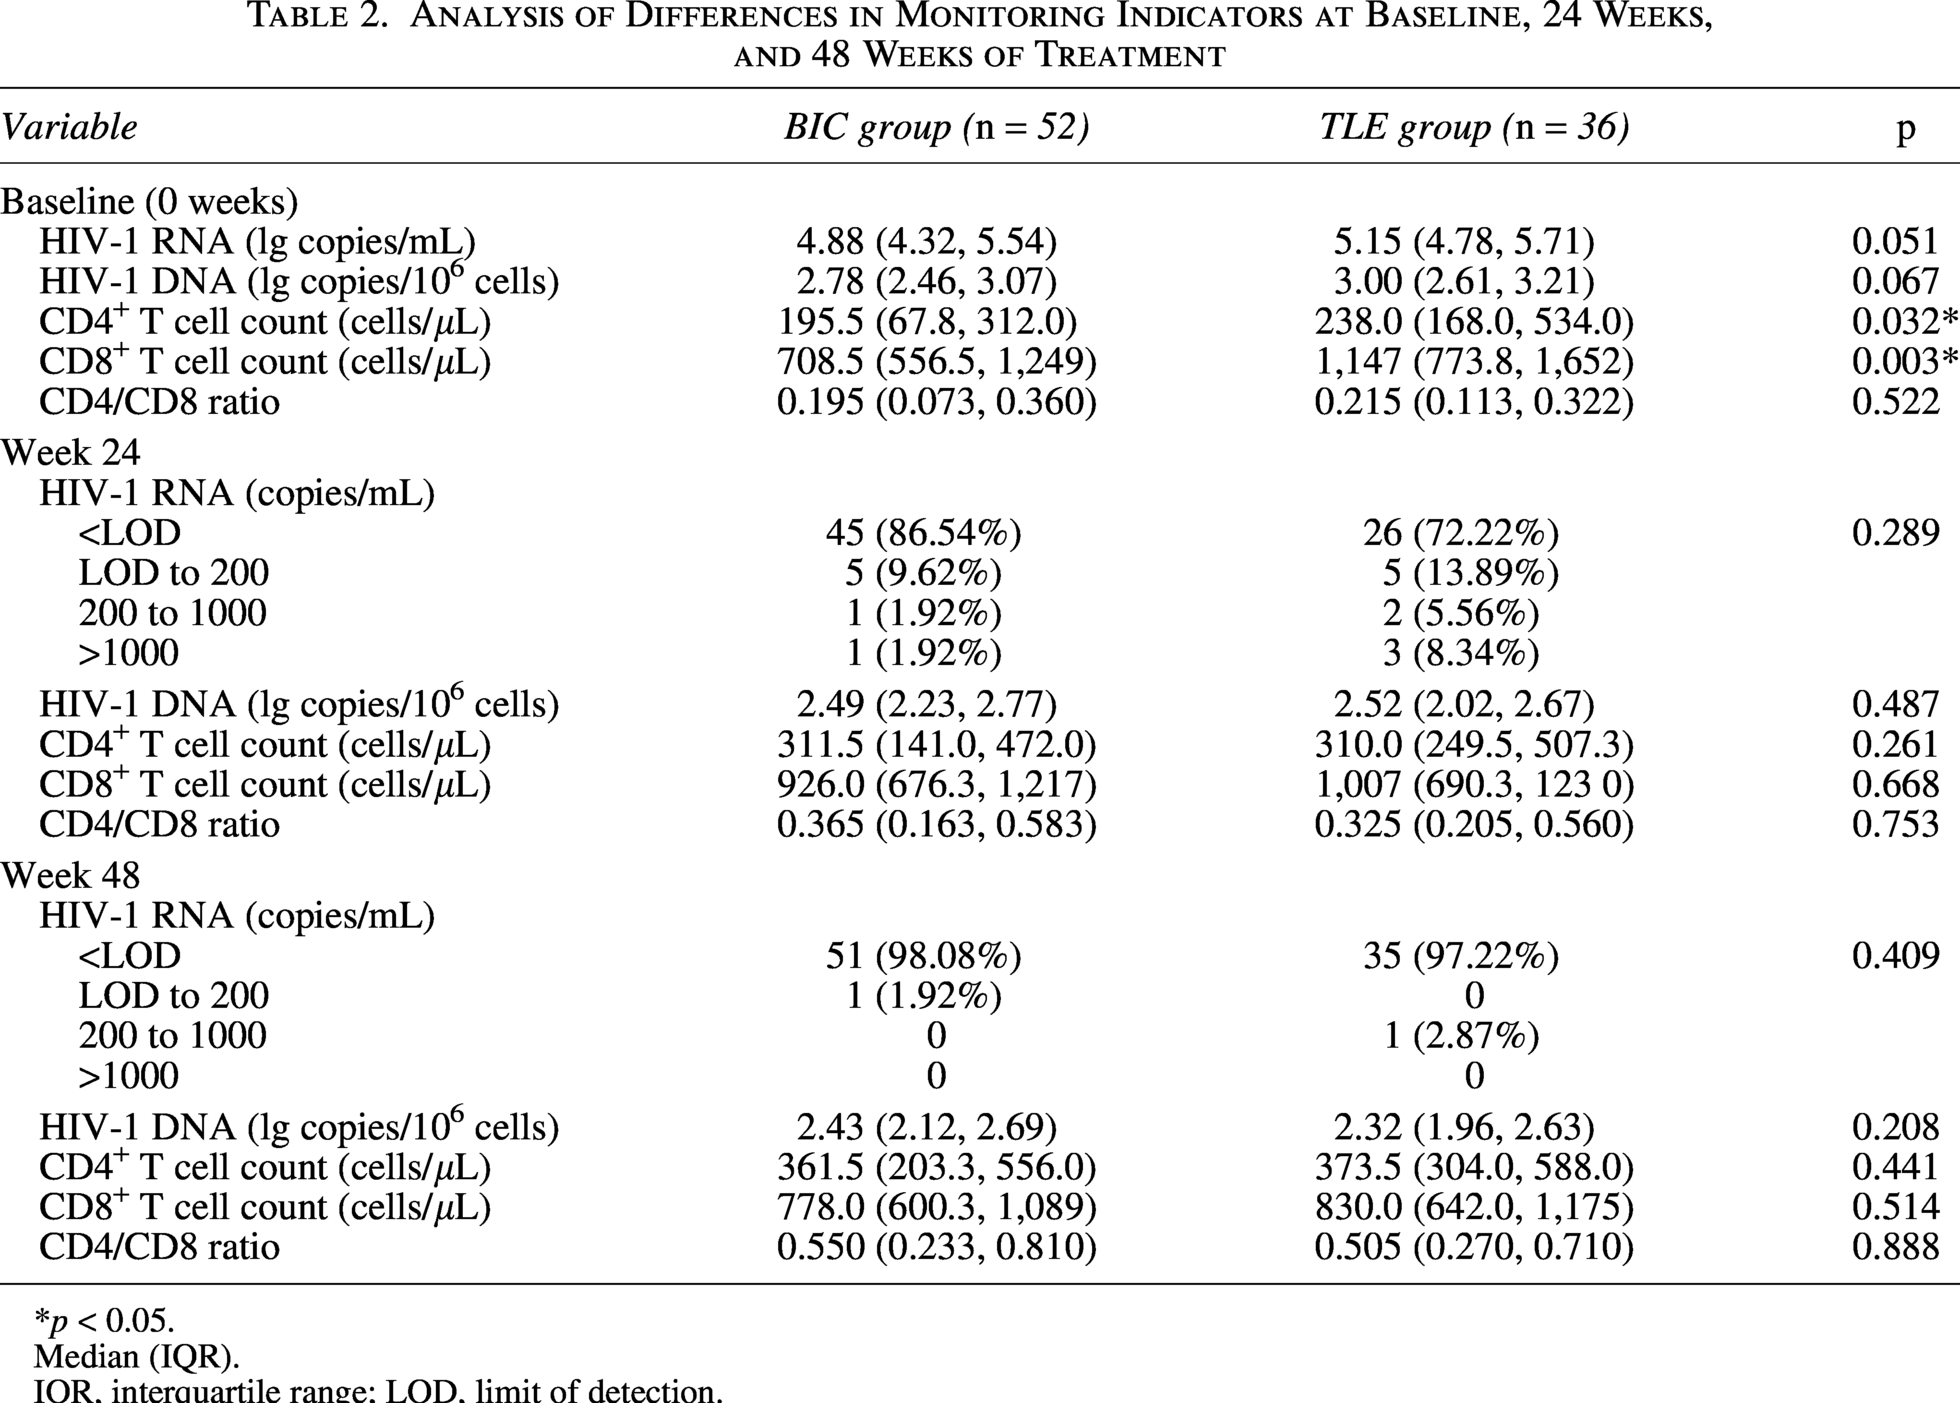
*p < 0.05.
Median (IQR).
IQR, interquartile range; LOD, limit of detection.
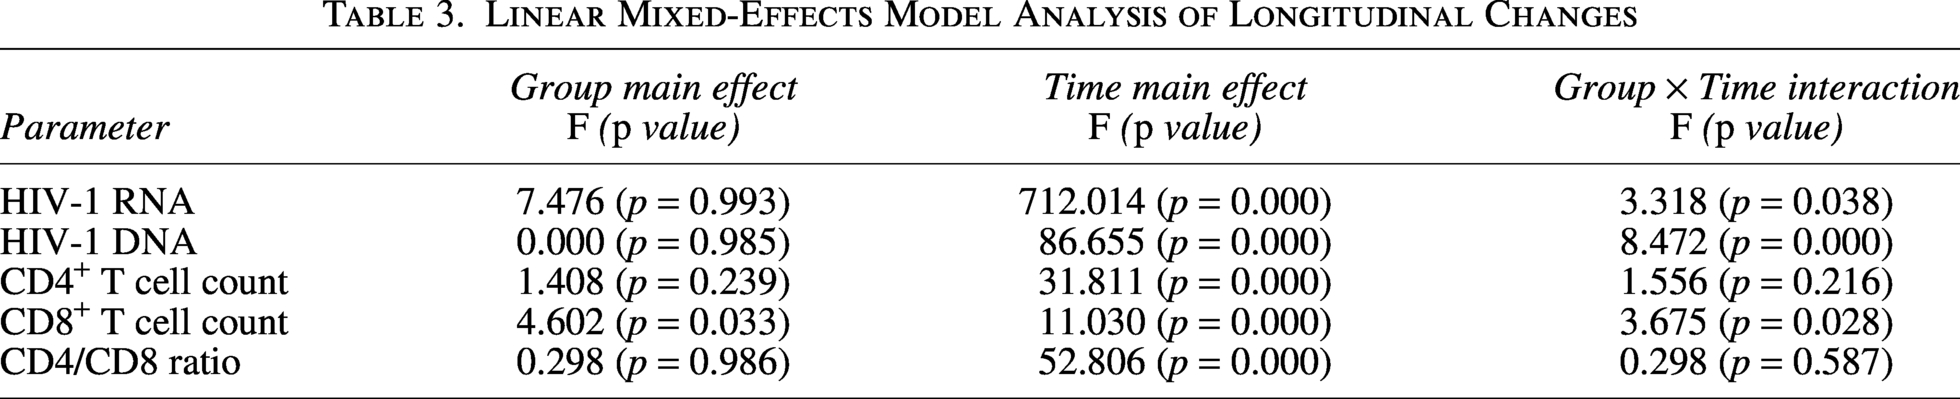
The LMM results are shown in Table 3. Significant Group × Time interactions were observed for HIV-1 RNA (F = 3.318, p = 0.038), HIV-1 DNA (F = 8.472, p < 0.001), and CD8+ T cell counts (F = 3.675, p = 0.028), indicating that the two groups exhibited different trajectories for these parameters over the 48-week follow-up. In contrast, the Group × Time interaction was not significant for CD4+ T cell counts (F = 1.556, p = 0.216) or CD4/CD8 ratio (F = 0.298, p = 0.587).
Linear Mixed-Effects Model Analysis of Longitudinal Changes
Longitudinal dynamics of virologic and immunologic parameters
As shown in Figure 1, the BIC group achieved a significantly lower HIV-1 RNA load than the TLE group at week 12 (p < 0.0001), a difference that was no longer significant at weeks 24 and 48. Both regimens effectively suppressed the HIV-1 DNA load, showing a declining trend at weeks 24 and 48 with no significant intergroup differences. Regarding immune reconstitution, CD4+ T cell counts and the CD4/CD8 ratio increased progressively in both groups over time. Although the BIC group started with a lower baseline CD4+ T cell count, it rapidly reached levels comparable to the TLE group by week 24. For CD8+ T cell counts, a declining trend was observed in the TLE group throughout the follow-up period. In contrast, the BIC group exhibited an initial increase at week 24 followed by a decline at week 48.
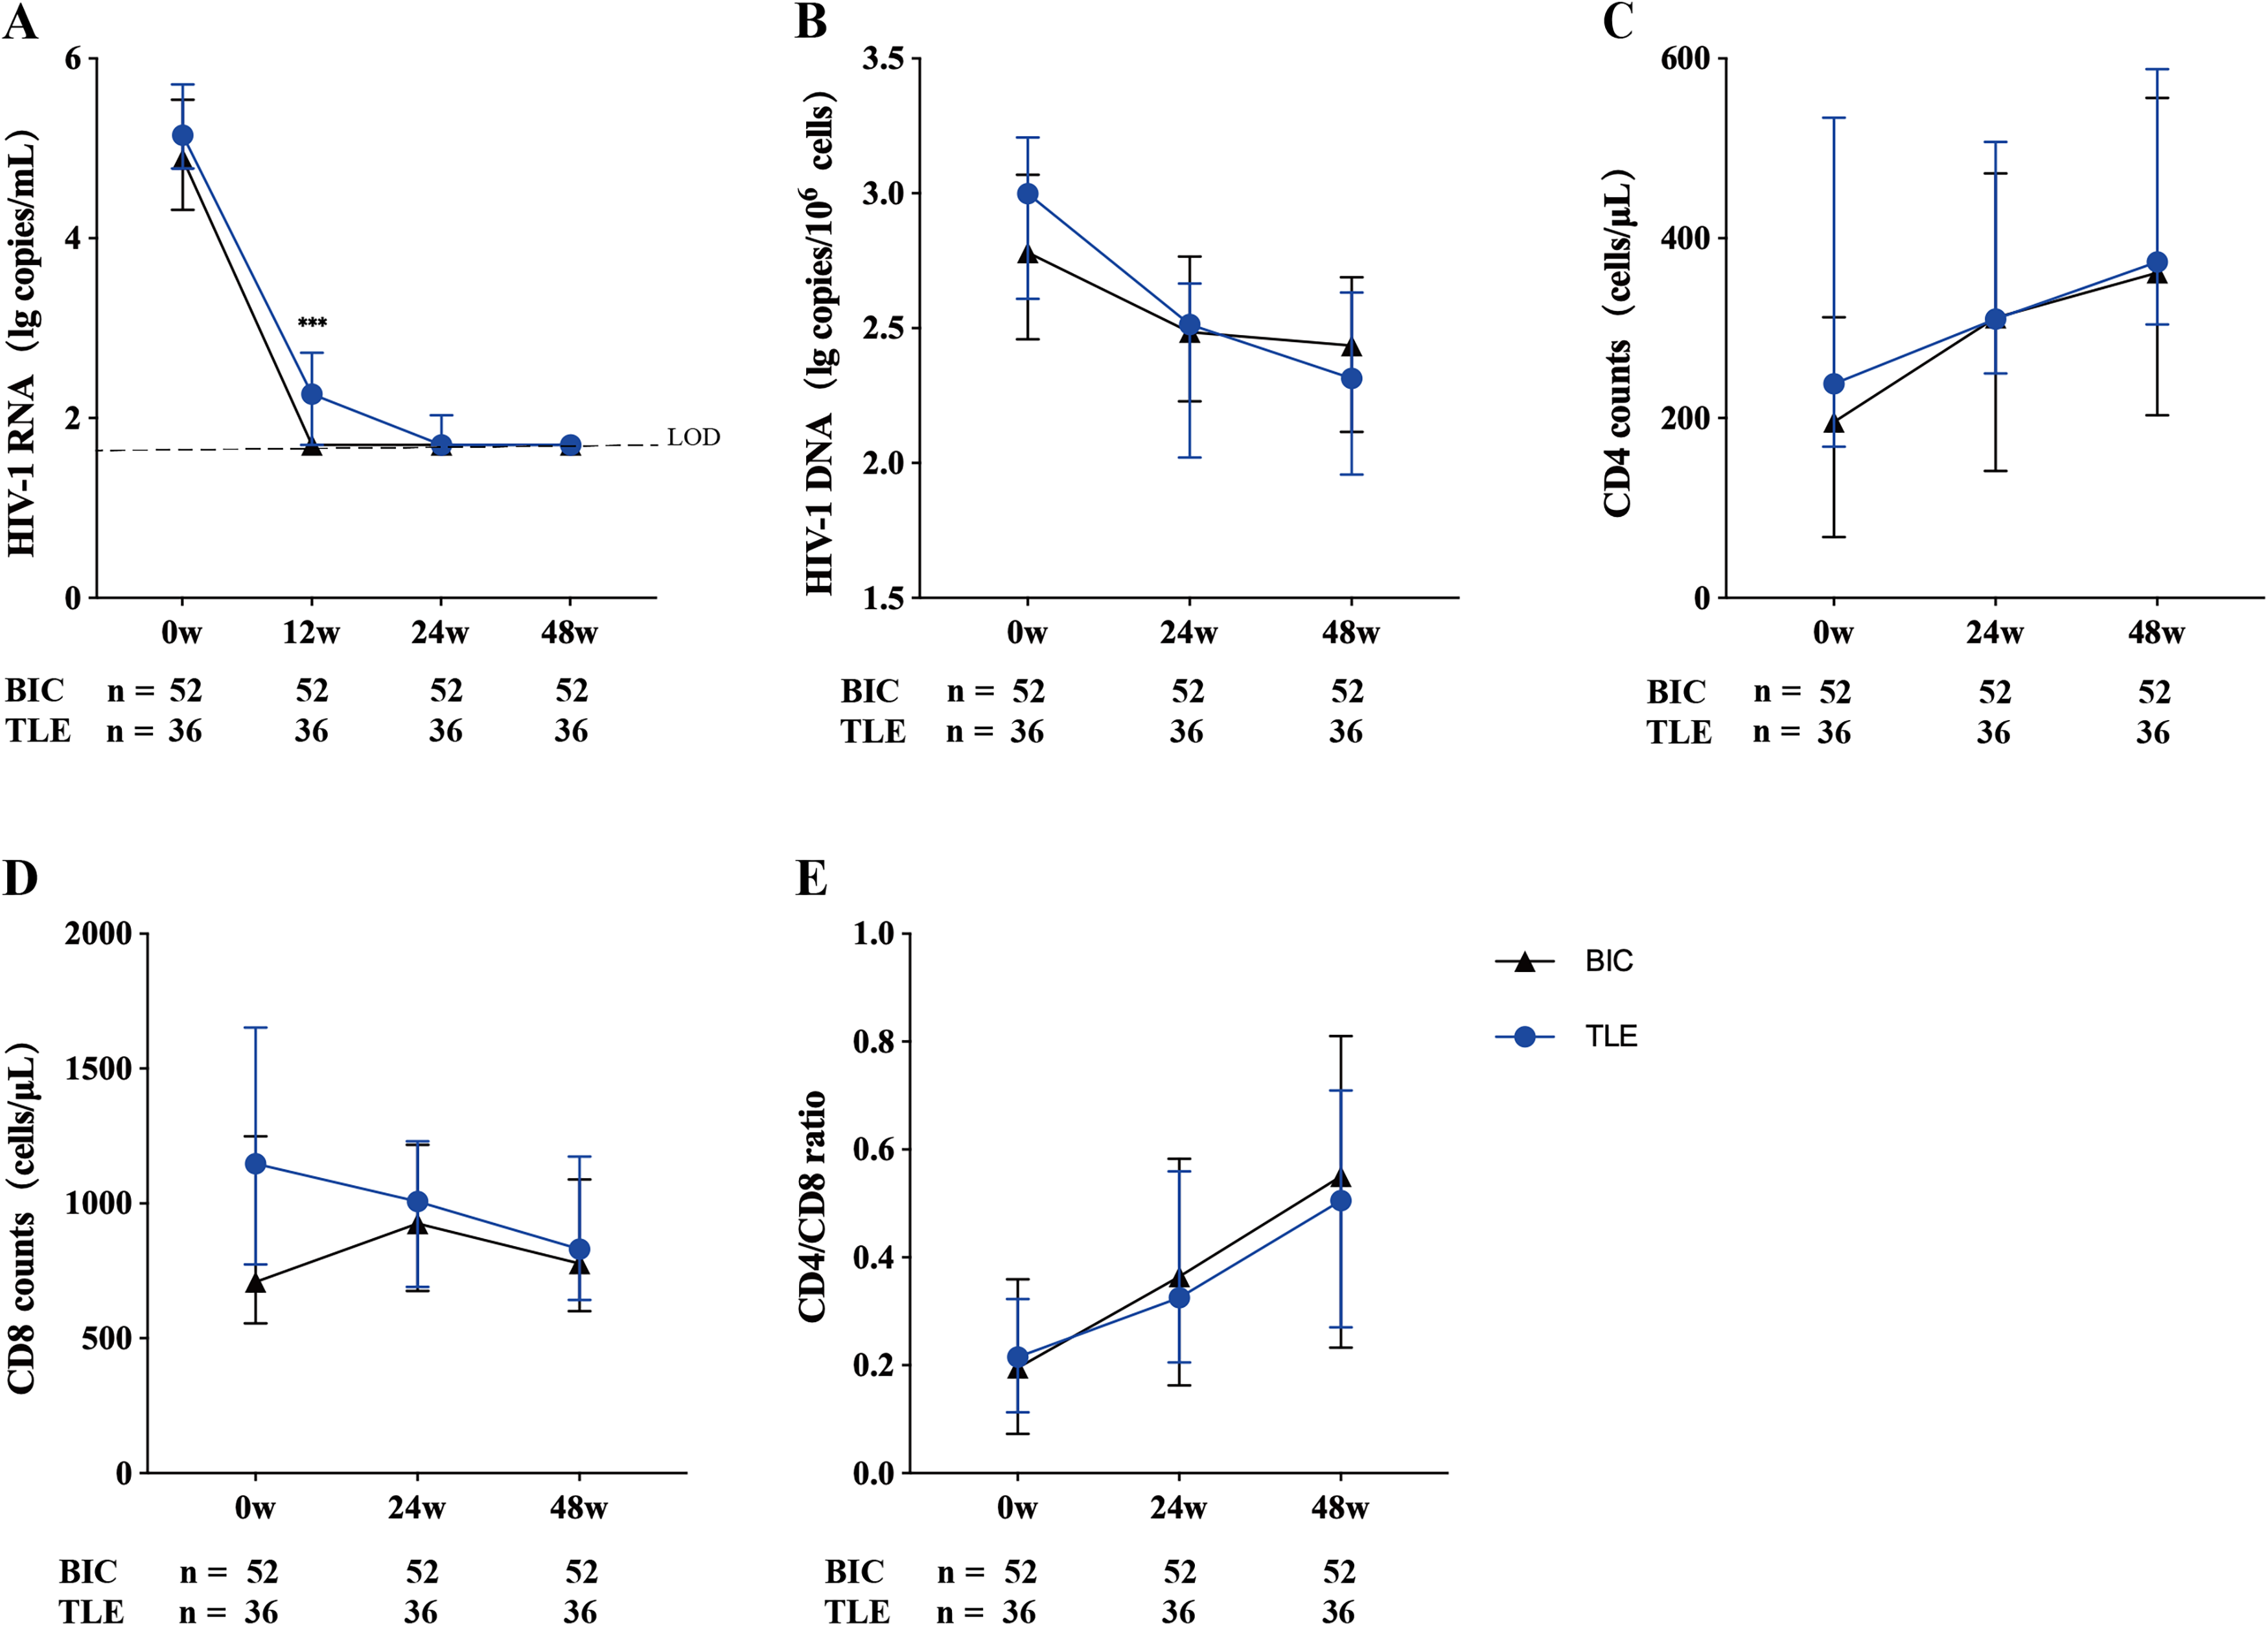
Longitudinal dynamics of virologic and immunologic parameters in the BIC (black line) and TLE (blue line) groups.
Clustering reveals divergent HIV-1 DNA dynamics
Further analysis of the BIC group revealed three distinct HIV-1 DNA decay patterns through K-means clustering (validated by the elbow method and hierarchical clustering) (Fig. 2A). Cluster 1 (n = 16), characterized by the lowest baseline HIV-1 DNA, showed no declining trend at weeks 24 or 48. In contrast, Clusters 2 (n = 18) and 3 (n = 18), which began with moderate-to-high baseline DNA levels, exhibited clear decreasing trends at both follow-up time points. Analysis of CD4+ T cell counts across these clusters revealed a consistent increase over time in all three. Notably, the median CD4+ T cell count in Cluster 1 remained lower than those in Clusters 2 and 3 at baseline, week 24, and week 48 (Fig. 2B).
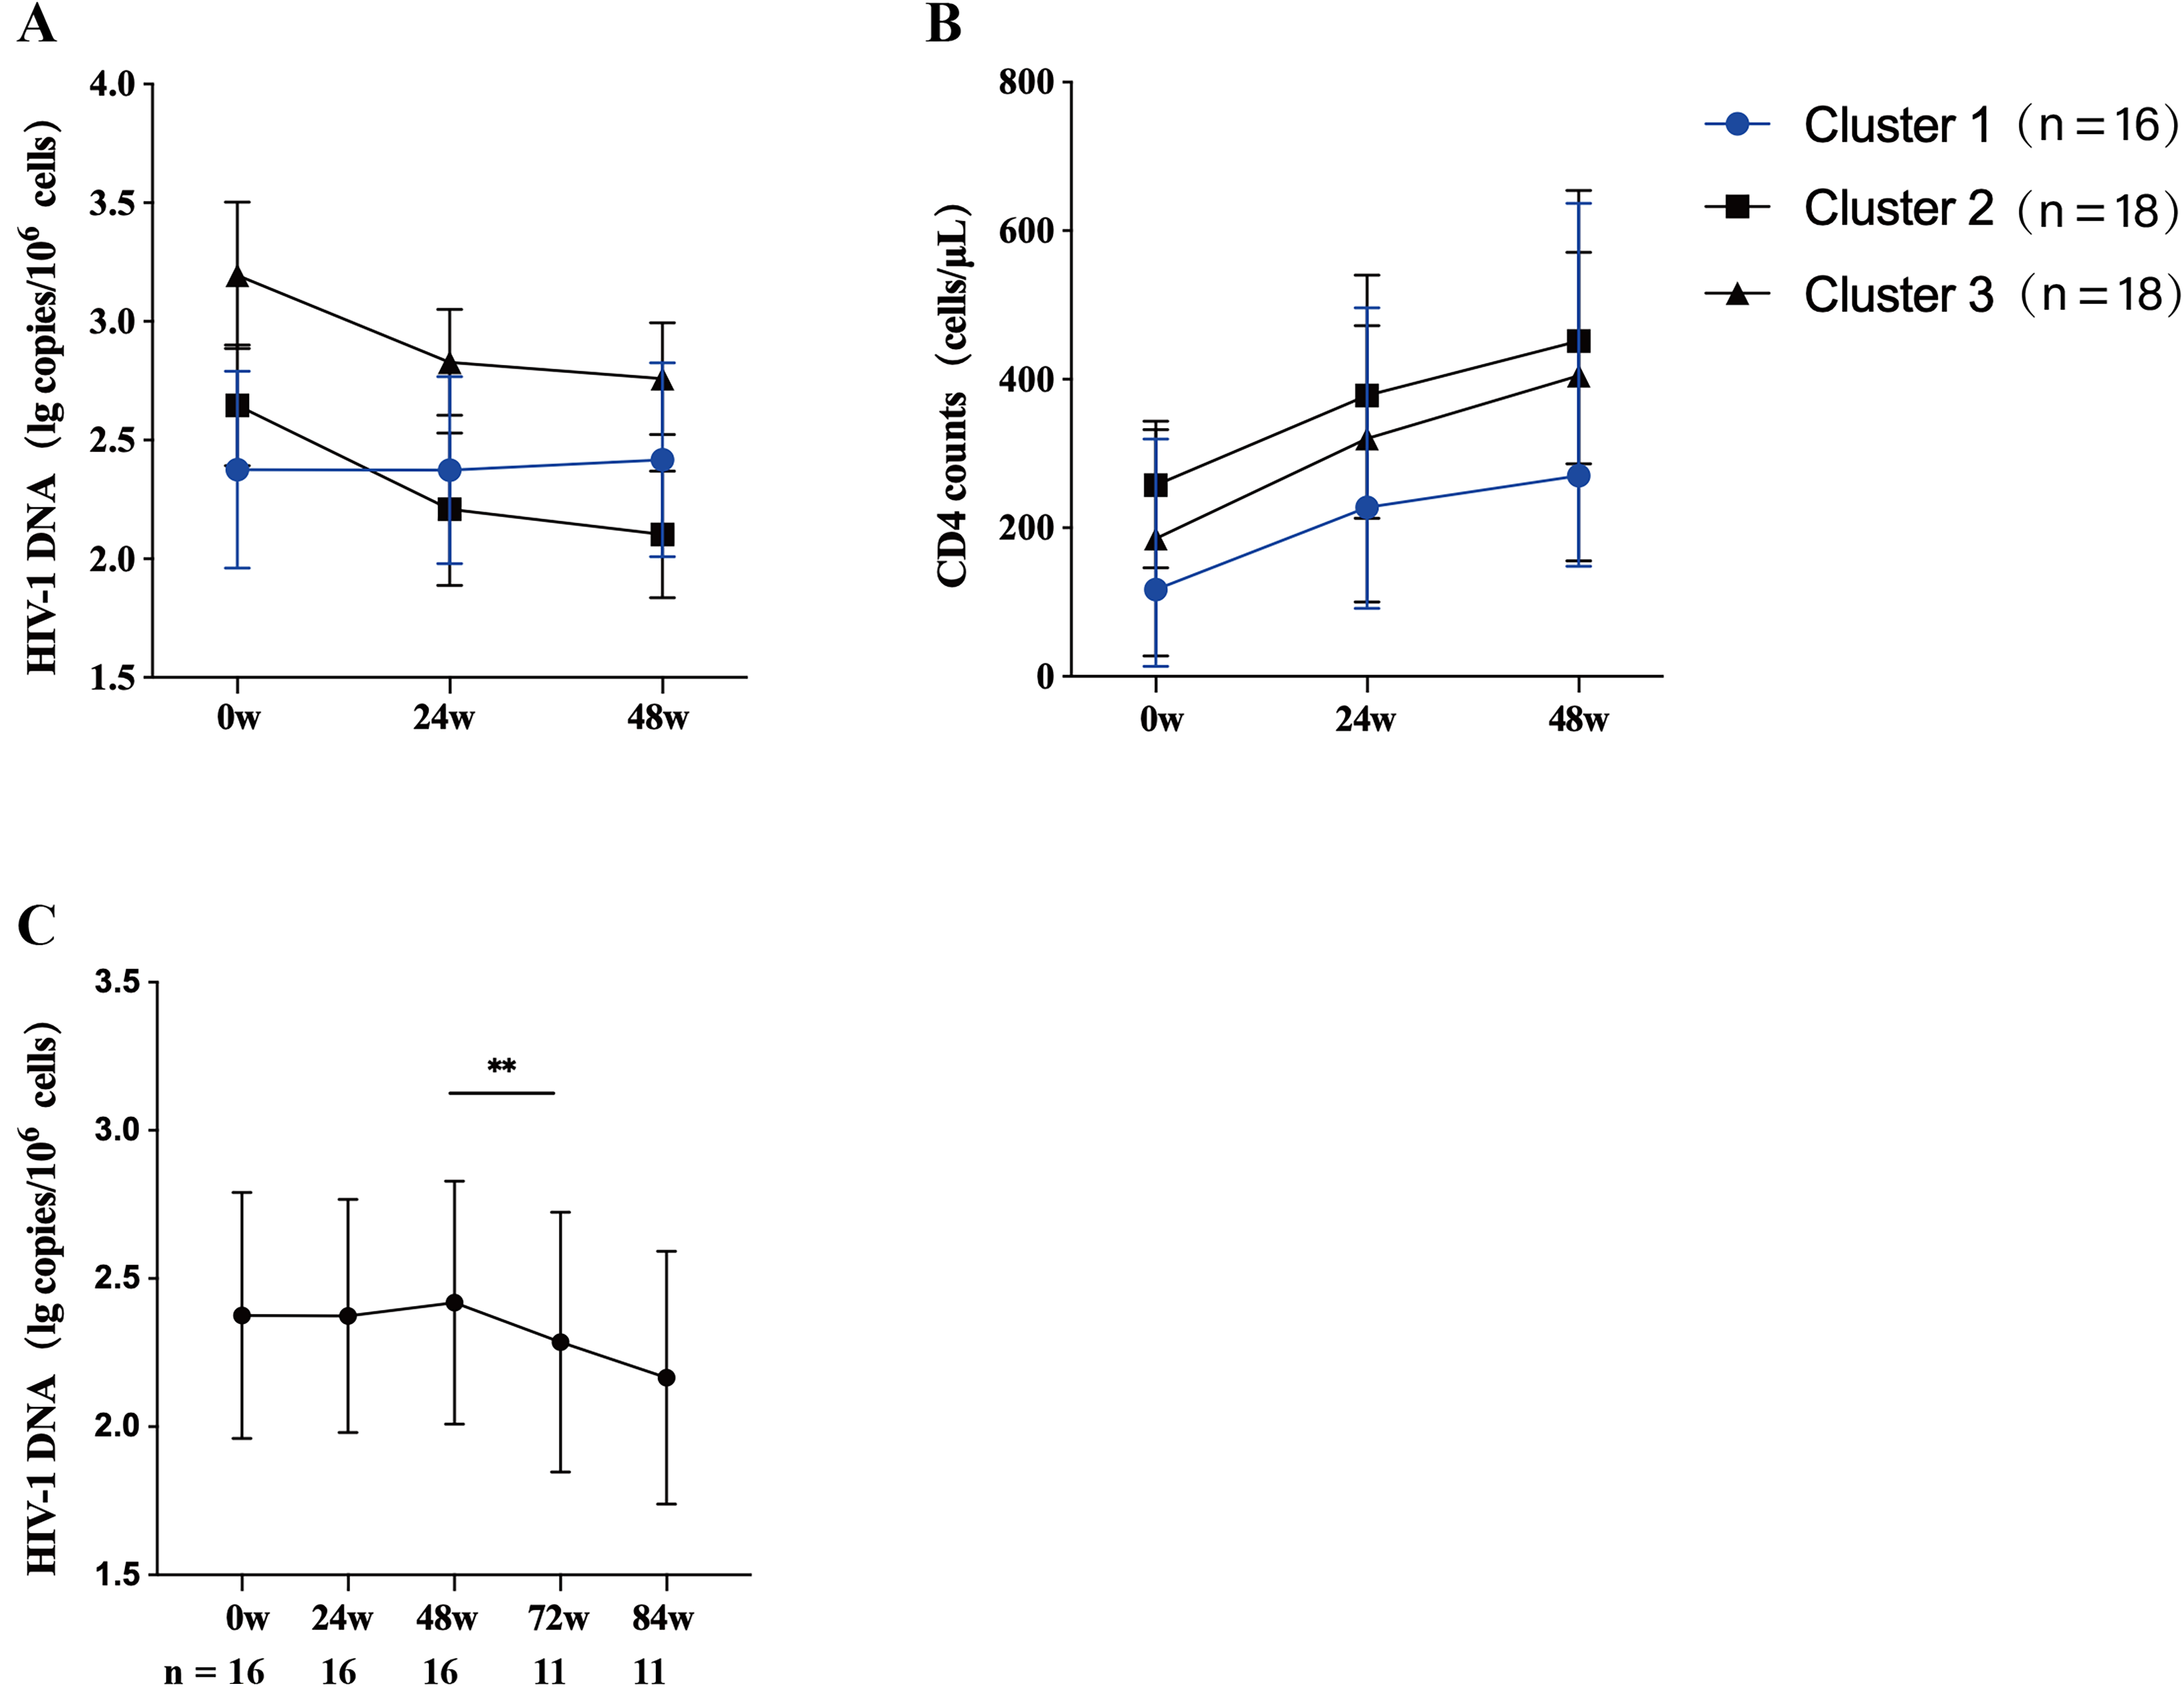
Clustering reveals divergent HIV-1 DNA decay trajectories and their immunologic correlates.
Building on the finding of no early decay, HIV-1 DNA load in Cluster 1 was monitored through weeks 72 and 84 (Fig. 2C). The longitudinal data revealed a distinct biphasic pattern: levels remained stable through week 48 but commenced a significant decline thereafter. This delayed reduction was statistically significant by week 72 compared with week 48 (p = 0.0058), indicating a significant decline in the viral reservoir with extended treatment.
Discussion
In this real-world study, BIC/FTC/TAF achieves faster early virological suppression than TLE at week 12 (Fig. 1A), which aligns with our previous finding, 17 and both regimens converging at weeks 24 and 48 (Table 2). For HIV-1 DNA, however, the LMM results (Table 3) showed that the TLE group exhibited a significantly faster decline (Group × Time, p < .001), which appears inconsistent with the notion that integrase inhibitors are more potent than other drug classes in reducing the viral reservoir. This difference, however, was no longer significant after adjusting for baseline HIV-1 DNA levels (p = 0.323), suggesting that the more rapid decline observed in the TLE group was largely driven by its higher baseline levels (3.00 vs. 2.78 log10 copies/106 cells, Table 2), with both groups ultimately converging by week 48. Notably, in this real-world clinical setting, the BIC group inherently included a higher proportion of individuals with more advanced disease, as reflected by their significantly lower baseline CD4+ counts (p = 0.032). This prompted us to look beyond the overall comparison and investigate the low-CD4 subgroup through cluster analysis (Fig. 2). However, the more critical finding emerged: within the BIC group, a specific individual subset (>30%) with lower baseline CD4+ T cell counts exhibited a significantly delayed decline in cellular HIV-1 DNA, which only became apparent after 72 weeks of therapy (Fig. 2C). This phenomenon suggests that under potent drug suppression, the dynamics of the viral reservoir may be substantially influenced by the host’s own immune reconstitution process.
This unique delayed response pattern may be related to the interplay between immune reconstitution and viral reservoir dynamics. One possibility is that in individuals with low baseline CD4+ counts, the extensive proliferation of CD4+ T cells during early immune recovery may inadvertently include latently infected cells, thereby contributing to the maintenance of stable HIV-1 DNA levels.18–21 Simonetti et al. demonstrated that clonally expanded CD4+ T cells can harbor replication-competent HIV-1. 22 Puertas et al. further observed that individuals with lower baseline HIV-1 DNA showed an increase in intact provirus proportion after 48 weeks of ART. 23 The Cluster 1 subgroup—who had the lowest baseline HIV-1 DNA and CD4+ counts and exhibited no early DNA decline—shows a pattern consistent with those observations. The early increase in CD8+ T cell counts in the BIC group is consistent with heightened immune activation, which may create an environment conducive to T cell proliferation, including latently infected cells. 24 However, our study did not directly measure clonal expansion, integration sites, or intact proviruses; whether this mechanism explains our clustering findings remains to be determined.
It is important to note the limitations of this study. First, the primary analysis was based on a 48-week follow-up. Although follow-up for the key subgroup was extended to 84 weeks, revealing a trend toward delayed decline, longer-term viral reservoir outcomes require further confirmation. Second, the sample size of the study was limited, particularly after subgroup cluster analysis, resulting in relatively small numbers in each cluster, which may affect statistical power and the generalizability of the findings. Last, the proposed mechanism of clonal expansion is primarily conjectured based on inferences from clinical data. Future studies are needed to directly validate this hypothesis using molecular biology techniques, such as integration site analysis, in larger samples.
We also acknowledge that total HIV-1 DNA has inherent limitations as a biomarker. It encompasses both intact and defective proviruses, as well as unintegrated linear and circular forms, and does not distinguish replication-competent from defective proviruses. However, total HIV-1 DNA is widely recognized as a key biomarker for evaluating viral reservoir size 25 and disease progression, given that both intact and defective proviruses contribute to reservoir maintenance 26 and chronic inflammation, and that unintegrated forms also participate in disease pathogenesis.27–30 Regarding sample type, whole-blood measurements correlate strongly with PBMC-based assays (r = 0.89, P < 0.001) 31 and offer practical advantages for routine clinical application. 25 Future studies incorporating intact proviral DNA assays would provide a more definitive assessment of the replication-competent reservoir.
Nonetheless, the findings of this study emphasize the importance of considering baseline immune characteristics when evaluating the deep therapeutic efficacy of novel antiretroviral regimens. They suggest that even when using similarly potent integrase inhibitors, individuals starting from different immunological baselines may experience distinct paths to viral reservoir clearance. Future research should aim to validate this phenomenon in larger cohorts with longer follow-up and to explore its underlying immunological and virological determinants in greater depth, thereby providing a basis for more individualized treatment strategies.
Conclusions
This study concludes that BIC/FTC/TAF demonstrates a rapid early virological suppression advantage in treatment-naïve individuals. However, its efficacy in reducing the cellular HIV-1 DNA reservoir is significantly modulated by the baseline immune status. The identification of a distinct “delayed responder” subgroup through cluster analysis enriches our understanding of the intrinsic heterogeneity in responses to integrase inhibitor-based therapy. This finding shifts the focus of clinical evaluation from mere regimen comparison to the interaction between host factors and treatment outcomes, thereby illuminating a novel direction for future mechanistic exploration of reservoir clearance and the development of truly personalized therapeutic strategies.
Authors’ Contributions
J.L. drafted the initial draft of this article. All authors reviewed the article for intellectual content and approved the final version of the article.
Footnotes
Acknowledgment
The authors are sincerely grateful to all the participants who volunteered for this study; their commitment and cooperation made this work possible. The authors also extend their appreciation to the staff of the Clinical Laboratory at The Ninth People’s Hospital of Dongguan and to the team at the Dongguan Institute of Microscale and Precision Medical Measurement for their technical support and assistance throughout the study.
Funding Information
This work was supported by the