
Abstract
Purpose:
The goal of this research is to examine the extent to which facets of neighborhood sociodemographic contexts influence individual-level physical activity (PA) among youth.
Design:
Using National Health and Nutrition Examination Survey (NHANES), geographic information systems (GIS), and census data sources, we explicitly test whether built environment factors have differential associations depending on the age and gender of the youth living in urban census tracts.
Setting:
Participants are from the NHANES 2003 to 2006 waves.
Participants:
The study sample for this article was 2706 youth aged 6 to 17 years with valid PA accelerometer measures.
Measures:
A measure of park accessibility was constructed from the 2006 park GIS layer in Environmental System Research Institute ArcGIS 9.3 data. Average daily minutes of moderate to vigorous PA in bouts equal to or longer than 1 minute were recorded using accelerometers over 4 to 7 days.
Analysis:
Analysis was conducted with SAS 9.2, including descriptive analyses and linear regression for PA.
Results:
Findings suggest that built environment features are especially salient for adolescents and youth living in urban areas. Vigorous activity varied by the age and gender of the youth. For example, greater distance to parks is associated with a decrease in PA among girls and boys aged 6 to 11 years. Among teens, distance to parks is significantly associated with decreases in PA among the total sample and among male teens. However, an increase in population density is associated with less time spent in PA among youth aged 6 to 11 years but more PA among teens.
Conclusion:
These analyses represent an important step to considering the implications of modifiable environmental features for youth and contrast with existing literature for adults. Results speak to the efficacy of built environment measures in urban communities and the importance of considering the possibility of differing patterns of associations in childhood and adolescence and by gender. Results from this research inform policy efforts to interdict in the growing trend of youth inactivity in the United States.
Keywords
Introduction
Physical activity (PA) can confer important health benefits for obesity prevention among youth. 1 Recommendations tend to emphasize daily PA and encourage youth to accumulate at least 60 min/d. 2 Physical activity declines dramatically across age-groups between childhood and adolescence. For example, 42% of children aged 6 to 11 years obtain the recommended 60 minutes of PA, whereas only 8% of adolescents achieve this goal. 3
A growing body of research provides evidence of the potential importance of the built environment for energy balance decisions. 4 -8 People who live in sprawled communities, with low walkability, are less likely to walk in their leisure time, have higher body mass index (BMI), and are more likely to have high blood pressure and be obese. 9 Other research suggests that the majority of people in low-walkability neighborhoods are more likely to be overweight compared to those who live in high-walkability neighborhoods. 10
Walkable neighborhoods are often designed with 3 important dimensions in mind, often called the “3-Ds,” which include population density, pedestrian-friendly design, and a diversity of destinations. 11 -13 A substantial body of empirical support is emerging that finds evidence of associations between these features and energy balance behaviors among adults and children. 4,7,14,15
Population density provides a critical number of residents who may encourage the development of walkable destinations that would facilitate more PA. In areas with higher population density, families may be more motivated to take children outdoors and walk to destinations, thus promoting more PA. Pedestrian-friendly design often involves a greater street connectivity. This design feature may support walkability and PA by making the activity convenient to youth homes. Neighborhoods with these types of design features are also more likely to have slower car traffic because of the multiple stopping points at street connection points. This feature may promote more PA for youth in part because streets are more attractive places to congregate but also because parents likely perceive the neighborhood as safer and may thus relax rules for unstructured leisure activities.
Other community design features present live might also matter for youth PA. Access to places to recreate is an important resource for youth. Evidence from Chicago data has suggested significant associations between activity levels of urban youth and limited access to safe recreation areas in their neighborhoods of residence. 16 The availability of parks and recreational resources is necessary to decrease the levels of childhood obesity and increase PA. 17 Children with better accessibility to parks may be more likely to engage in PA regularly. Available research suggests that park use by children increased when parks were closer to the child’s residence, suggesting that proximity is an important consideration. 18
Diversity is often characterized by land use diversity. This can be operationalized as a broad mix of land uses. Such areas have been associated with lower BMI among adults. 4 Measures of land use diversity are sometimes challenging to obtain. Important proxies can include percentage of workers in a neighborhood walking to work or using public transportation as these measures indicate that the neighborhood has a sufficient mix of destinations that make active transportation feasible and attractive. The age of neighborhood housing stock can also be a proxy for land use diversity. Older neighborhoods were often designed with pedestrians in mind, whereas newer neighborhoods are likely to be designed to support car use. Streets in older neighborhoods often offer more tree shade and sidewalks. Older neighborhoods are also more apt to feature narrow streets that act as a traffic-slowing device. Older neighborhoods often have zoning that supports a wider range of land use, which provides a more varied mix of potential destinations. In urban samples in New York City, a link has been established between land use mix and increased PA among low-income preschool children. 19
Much of the prior work has focused on the implications of the built environment for adults, but exploring how this relationship might differ for children and adolescents is an important issue. Handy hypothesized that suburban community design such as cul-de-sacs may promote young children’s activity but not older youth. 20 More suburbanized communities have many attributes such as low street connectivity and low density and land use mix that decrease walkability. But if the perceived safety of suburbs and suburban design promotes outside play, children in these areas are likely to be more active. Other research has suggested that as road safety decreases, knowledge of neighbors and sense of community safety increase. 21 Indeed, parents may constrain the physical activities of their children given concerns about road safety. 22 Older children in communities with higher street connectivity, mixed land use, and density are more likely to walk at least half a mile a day for transportation. 23 Such walking might be most responsive to community design features among young adolescents, possibly because they have more opportunities to walk than younger children who are not yet walking independently than older adolescents who can drive.
Parents might place fewer restrictions on boys’ activities outside the home based on the perceived safety risks of the neighborhood environment. This dynamic might lead to a differing pattern of the importance of neighborhood amenities across gender. Prior research has found that having a greater number of parks was associated with a greater nonschool PA among girls but not among boys, suggesting that gender is an important consideration in assessing the associations between the neighborhood design features and PA. 18,24 Thus, it is conceptually important to estimate separate models by gender and to consider the developmental distinction of middle childhood and adolescence.
The current analysis adds to the literature in a number of ways. We use nationally representative data with measures of youth PA based on the clinical measurement. We link a variety of data sources to the main data at the census tract level, an improvement in other research that relies on county or larger levels of aggregate data. With these data, we explore age and gender differences in the relationship between built environment and PA. Results from this research help to refine and extend the knowledge base on the potential role of the larger social environment on children’s PA and inform policy efforts to interdict in the growing trend of youth inactivity in the United States.
Methods
Data were drawn from the 2003 to 2006 National Health and Nutrition Examination Surveys (NHANES). The NHANES is an ongoing survey of the general US population conducted by the National Center for Health Statistics within the Centers for Disease Control and Prevention. The NHANES participants undergo a survey and a medical examination that includes blood work and measured height and weight. Responses to questions were obtained from the parent or guardian. In 2003 to 2006, the NHANES participants 6 years of age and over received accelerometers (Actigraph 7164; LLC, Fort Walton Beach, Florida) to wear at home for 7 consecutive days. Those who used wheelchairs and those with other impairments that prevented them from walking or wearing the accelerometers were not given a device. 25 For this study, 5607 youth aged 6 to 17 years were selected. We excluded youth living in rural areas (n = 496), as measures of walkability are likely to have very different associations with PA in rural samples. Also excluded were those youth who did not meet accelerometer data standards (n = 2405), as described below. The final sample size was 2706 youth aged 6 to 17 years who had valid PA measures. This study has been approved by the institutional review board at the University of Utah. In addition, NHANES was approved by the ethics committee of National Center for Health Statistics.
Measures
The outcome is an accelerometer measure, collected in the 2003 to 2006 NHANES. For those youth who could walk, an accelerometer (Actigraph 7164;, LLC) was given to wear for a week, following standard protocols. 26 Nonwear time is defined by ≥60 consecutive minutes of 0 activity intensity counts, allowing for 1 to 2 minutes of counts between 0 and 100. Wear time is defined by 24 hours minus nonwear time. A valid wear day is defined as having ≥10 hours of monitor wear. Some accelerometer data are discarded if units were out of calibration when returned or measured unlikely levels of activity. 27,28 We utilize a moderate to vigorous physical activity (MVPA) measure bouts of at least 1 minute in duration, which is the equivalent of what Troiano et al 3 called a modified 1-minute MVPA bout. Use of 1-minute bouts is based on the child activity patterns that might be better captured by shorter bouts. In this study, bouts are defined using the Freedson age-specific cut points. Mean daily time in bouts is calculated across all valid days (Note 1).
Measured at the census tract, the modifiable environment was measured by 6 variables that represent the dimensions of density, design, and diversity. Four of which were from the 2000 census, including population density (ie, number of residents per square mile), the median age of neighborhood buildings, the percentage of residents walking to work, and the percentage of residents biking to work. These variables have been used as indicators of neighborhood design particularly as to walkability. 29 In addition, 2 geographic information systems (GIS)-based measures were constructed: street connectivity and distance to parks.
Density
Using census data, population density is measured at the census tract level by number of residents per square mile.
Design
Street connectivity was defined as the number of intersections per square kilometer in a census tract. 30 Spatial data including census tracts and road networks were constructed from ArcGIS 9.3 data from the Environmental System Research Institute (ESRI). The 2000 census tract boundary file containing the area size in square kilometer of each tract is ready for use. The road network data are based on the StreetMap USA file. Based on these data, an index of street connectivity was constructed for each census tract in the United States. Distance to parks was the measure of park accessibility used in these analyses. Distance to parks was constructed from the 2006 park GIS layer in ESRI ArcGIS 9.3 data. It was created in 2008 with 35 436 public park or forest units in the 50 states and Washington, DC. The park data set includes national, state, and local parks and forests. Park size and within-park geometric centroids were generated in ArcGIS. Both large national parks and local parks were included. To calculate census tract park accessibility, we identified 7 parks closest to a census block centroid and calculated average distances from the census block centroid to each of these 7 parks weighted on population and park sizes. This method of measuring park access takes into account the uneven population distributions across areas and different park sizes. It allows the comparison of park spatial accessibility across various geographic scales. We chose 7 parks based on evidence that 7 is a key threshold number of pieces of information to process beyond which additional information cannot be handled effectively. 31
Diversity
Walkability and land use patterns were tapped by percentage walking and percentage biking to work among the residents who work outside home in the neighborhood. These 2 variables were constructed from the 2000 Census data. Tract median housing age is computed from tract median housing build year from the 2007 to 2011 American Community Survey (ACS) and is used as a proxy measure of neighborhood walkability because older neighborhoods were built before people began to rely on cars and are typically more walkable than newer neighborhoods with better land use diversity, narrower streets, and more extensive sidewalks. 32 -34
There were a number of control variables in this analysis. Race–ethnicity was self-reported, including non-Hispanic whites (referred to as “whites” hereafter), non-Hispanic blacks (referred to as “blacks” hereafter), Hispanics, and others. Other control variables include age, gender (male vs female), immigrant status (US born vs foreign born), income to poverty ratio (which is a ratio of a family’s total income to the appropriate poverty threshold given the family’s size and composition). Missing data on the income to poverty ratio were imputed using mean value with a random component added. Three neighborhood socioeconomic status (SES) variables were derived from the 2000 census including percentage households with annual income at US$75 000 or more, percentage residents living in poverty, and percentage college-educated residents. A composite scale of neighborhood SES was constructed based on the 3 SES indicators (α = .85). These variables were selected given that they are potential confounders of the relationship between walkability and PA.
Statistical Analyses
Analyses were conducted with SAS 9.2, including descriptive analyses and linear regression for PA. Results with all control variables are presented in Tables 1 and 2. Diagnostic tests revealed no problematic levels of multicollinearity. For models testing the associations between all of the independent and control variables and PA among youth aged 6 to 11 years and among youth aged 12 to 17 years, variance inflation factors ranged from 1.01 to 2.75, which are in the acceptable range for this diagnostic test. Eigen values produced by multicollinearity tests ranged from 3.4 to 0.21, lending further evidence to a lack of multicollinearity among the predictor variables. Analyses corrected for the complex sampling design of NHANES as recommended. 35 Sample weights were adjusted for combining 2003 to 2004 and 2005 to 2006 and for 4 days of valid accelerometer wear. We distinguish urban communities based on the census 2000 data. There is considerable variation in the definition of “rural” America across empirical studies. Here, we define rural areas based on the census variables that identify tract-level percentage of rural residents. We exclude those respondents who live in census tracts with a 100% rural residents from our analyses. Our focus on urban communities is based on prior analyses that suggested features of the built environment are most salient for urban communities. 36
Relationship of Walkability and Sociodemographic Measures to Minutes Spent in MVPA Bouts of At Least 1 Minute in Duration: Regression Coefficients Among Youth Aged 6 to 11 Years in NHANES 2003 to 2006.
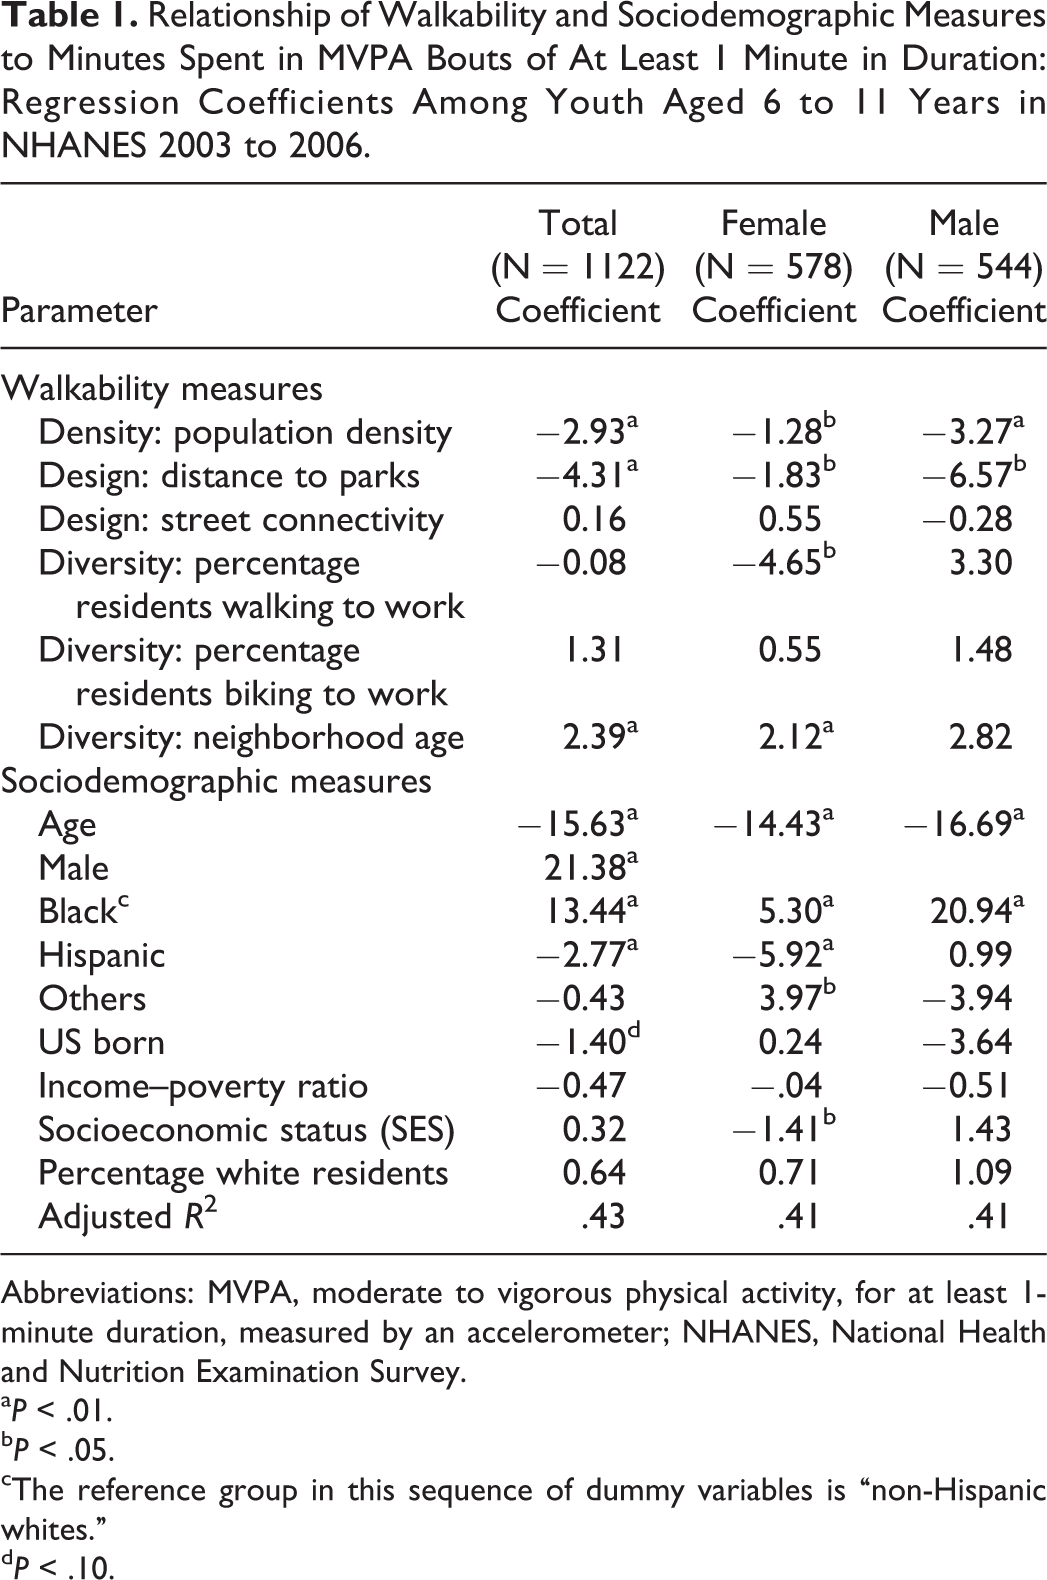
Abbreviations: MVPA, moderate to vigorous physical activity, for at least 1-minute duration, measured by an accelerometer; NHANES, National Health and Nutrition Examination Survey.
a P < .01.
b P < .05.
cThe reference group in this sequence of dummy variables is “non-Hispanic whites.”
d P < .10.
Relationship of Walkability and Sociodemographic Measures to Minutes Spent in MVPA Bouts of At Least 1 Minute in Duration Among Youth Aged 12 to 17 Years in NHANES 2003 to 2006.
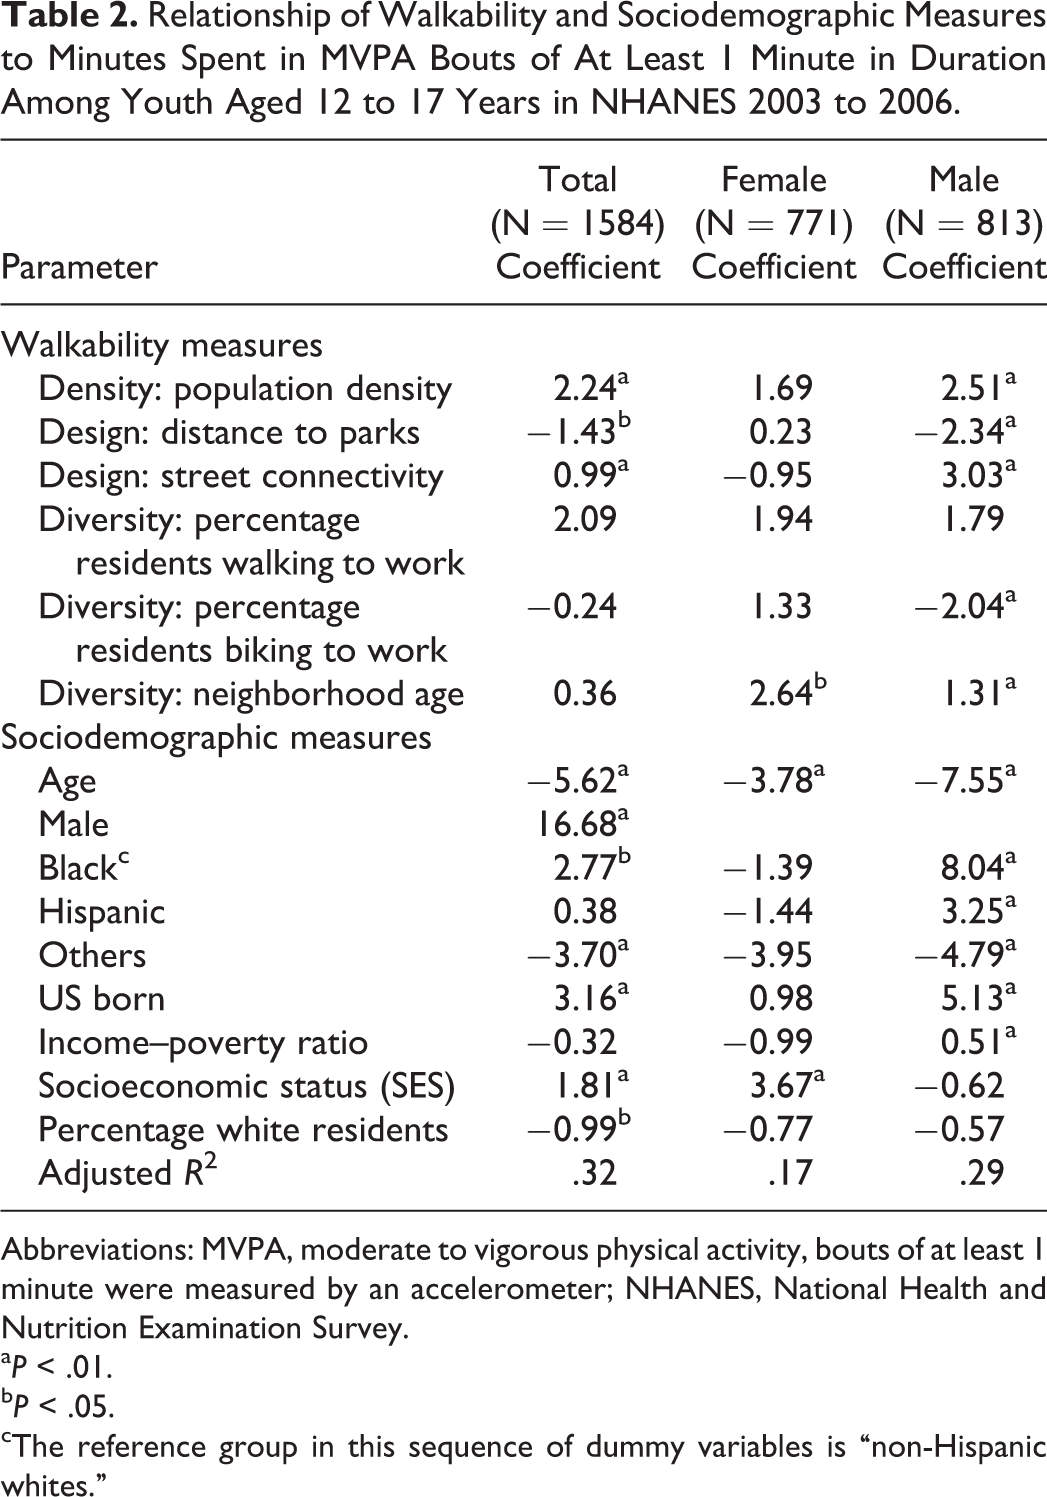
Abbreviations: MVPA, moderate to vigorous physical activity, bouts of at least 1 minute were measured by an accelerometer; NHANES, National Health and Nutrition Examination Survey.
a P < .01.
b P < .05.
cThe reference group in this sequence of dummy variables is “non-Hispanic whites.”
Results
Descriptive Results
Table 3 presents descriptive characteristics for the total sample of youth aged 6 to 17 years from the NHANES 2003 to 2004 and 2005 to 2006 waves. Additionally, Table 3 presents separate means by gender. The sample is equally split between boys and girls. On average, youth spend approximately 60 minutes MVPA per day. This mean is higher for boys than for girls. Approximately 16% of the sample is African American and 20% is Hispanic. The majority of youth in this sample are US born. On average, youth in this sample live in census tracts where the distance to the nearest park is 3.64 miles. Few residents walk or bike to work in the census tracts in which these youth reside. Youth live in urban census tracts where on average there are 5744 residents per square mile and about 90 intersections per square mile. Average housing age is approximately 30 to 37 years old at the time of the ACS.
Weighted Survey Mean Descriptive Characteristics for Youth Aged 6 to 17 Years in 2003 to 2006 NHANES Waves.
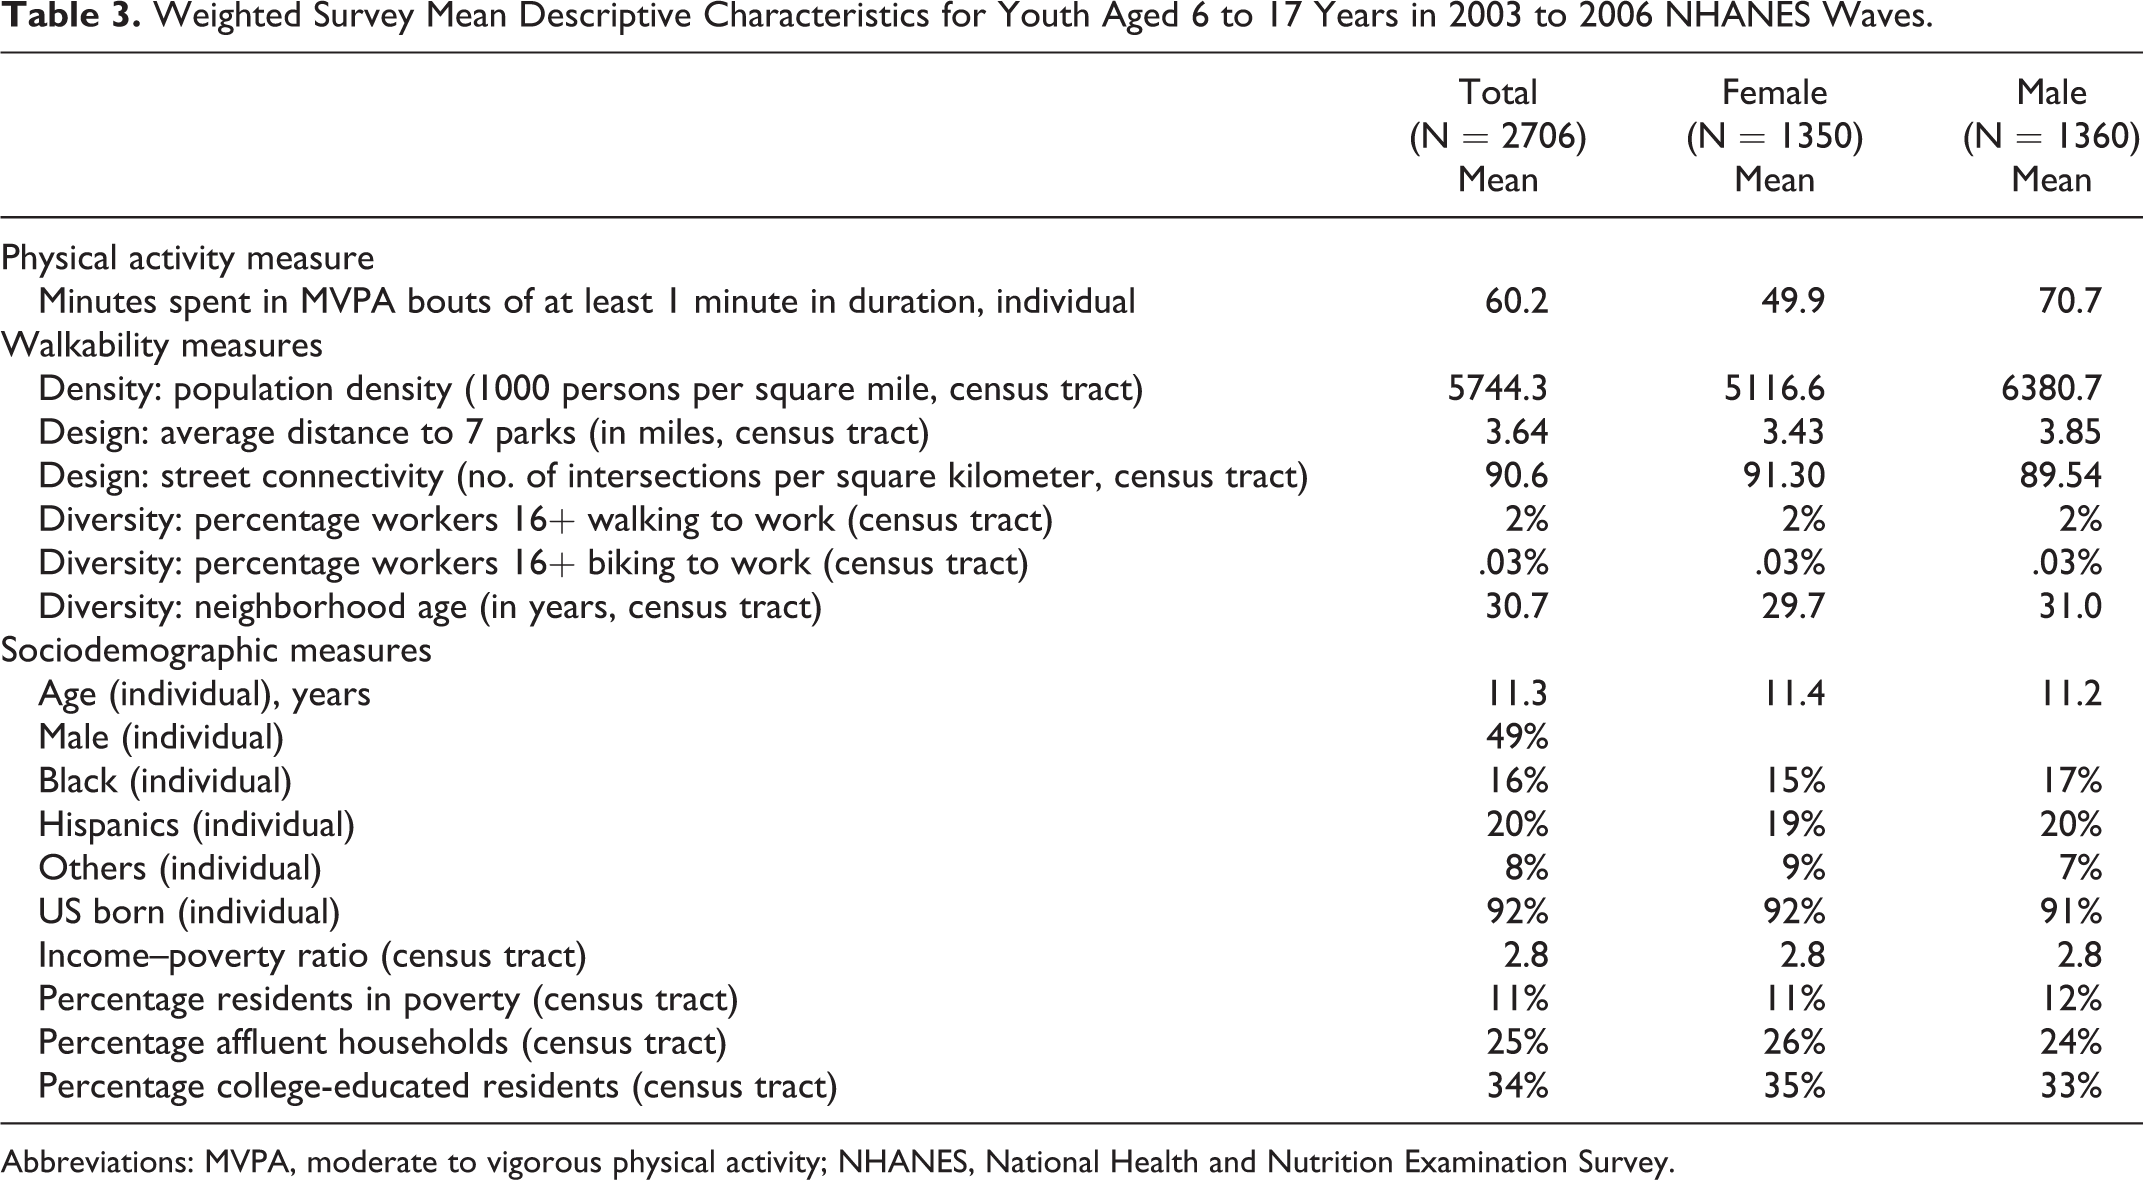
Abbreviations: MVPA, moderate to vigorous physical activity; NHANES, National Health and Nutrition Examination Survey.
Multivariate Results
Table 1 presents the coefficients of the weighted survey regression models for accelerometer-based measurements of MVPA for the total sample of children aged 6 to 11 years as well as for boys and girls separately. Table 2 presents the regression coefficients for weighted models for youth aged 12 to 17 years, also presenting separate estimates for boys and girls. Regarding the measures capturing dimensions of the 3-Ds (density, design, and diversity), there is evidence for associations between density and PA. However, the direction of association varies across age-groups. Results indicate that population density has a negative association with bouts of MVPA among children aged 6 to 11 years, such that increased population density is associated with less PA. This association is also observed when estimating the models separately by gender. Results from Table 2 reveal that among the total sample aged 12 to 17 years, population density is positively associated with MVPA. An increase in population density is associated with increased daily time spent in MVPA. Greater population density is associated with increased PA among males but not among females. Results for population density among younger youth run counter to expectations, whereas results for teens are more consistent with other research linking population density and PA among adult populations. 4
Considering design features, distance to parks is associated with decreased PA among children aged 6 to 11 years, and this association is significant for both boys and girls. Among teens, greater distance to parks is associated with a decrement in time spent in PA in the total sample. Table 1 also reveals that increased distance to parks is associated with a decrease in PA for boys but not among girls. Street connectivity is another indicator of neighborhood design. In our analyses, we did not find evidence of significant associations between street connectivity and PA among the total sample of younger youth, nor in the subsamples. However, greater street connectivity is significantly linked to increased time spent in PA among teens in the total sample and among male teens. For example, for each additional intersection per square kilometer, male youth aged 12 to 17 years spend an additional 3 minutes in MVPA in bouts lasting at least 1 minute.
Finally, we tested for associations between measures of neighborhood land use diversity and PA among youth. Percentage walking to work, which is an indicator of diversity of destinations, is associated with less PA among girls aged 6 to 11 years. We do not observe significant associations between percentage walking to work and PA among youth aged 12 to 17 years. Percentage of residents biking to work is another indicator of neighborhood diversity. Across models, there is not a consistent pattern of association with this variable and PA. However, we do observe a significantly negative association between percentage biking to work and reduced PA among girls aged 12 to 17 years. Our final measure of neighborhood diversity is the age of structures in the youth’s census tract. Neighborhood age is associated with a protective association among the total sample and among girls aged 6 to 11 years. Specifically, living in census tracts where the housing stock is older is associated with higher PA, but only among girls. Additionally, living in neighborhoods with older housing stock is associated with greater PA among male and female teens.
Regarding individual characteristics, boys are more likely to engage in MVPA than girls, across the 2 age-groups considered here. African American children have higher levels of PA in the total sample, and this association is significant for boys but not girls aged 6 to 11 years. This positive association is present across gender among youth aged 12 to 17 years. Hispanic origin is associated with decreased PA among females aged 6 to 11 years. Among the older youth, we observe that Hispanic origin is associated with increased PA among males. These results are generally consistent with other research using these data. 37,38 US born children have lower levels of PA in the total sample and in the female sample aged 12 to 17 years.
In the overall sample, greater economic resources are associated with more time spent in MVPA among female teens. Older teens are less likely to engage in MVPA. Boys are more likely to participate in MVPA. African American teens are more likely to have higher levels of PA, and this holds for male but not for female samples. Hispanic male teens are more likely to report higher MVPA. Time spent in bouts of MVPA is higher among US born teens, and this association holds for male but not for female teens. Unlike what was observed for youth aged 6 to 11 years, greater economic resources are associated with higher levels of PA among boys but not among girls.
Discussion
Physical activity is an important piece of the puzzle of high obesity trends in the United States. Many health agencies and private organizations have emphasized the importance of PA to public health. 39 Among youth, higher levels of PA are associated with reduced risk of obesity and enhanced psychological well-being. Despite its benefits, many American children and adolescents are not sufficiently active. Increasingly, however, there is recognition of the need to expand the scope of interventions to social contexts in which PA may occur. This study explores the associations between important dimensions of neighborhood built environment (density, design, and diversity) and PA among youth. In doing so, this study uncovers associations that have implications for improving the walkability of youth environments and subsequently could promote increased PA.
The present study confirms past research findings that design dimensions such as park access have implications for PA among youth. 18 Prior research has provided evidence that population density is associated with more PA in the form of biking and walking to school 40 and among teens for general levels of PA. 8 Our results for teen youth are consistent with this prior literature, finding positive associations between density and PA. However, we also find conflicting evidence as we observe a negative association between population density and PA among younger youth but a positive association with PA among adolescents. Prior research has suggested that decreased population density in urban areas may be a marker of lower walkability among adults but a marker for the perception of safer communities for children to play. As adolescents might have more unstructured leisure opportunities in neighborhoods, this might be an explanation for these results. Neighborhood design features such as park access have consistent associations with PA such that greater distance to parks is associated with reduced PA among children and teens. This finding is in line with research connecting perceived park availability and greater PA among children 41 and among urban teens. 42 Street connectivity is associated with increased PA among male teens in our study. Prior research on street connectivity and PA among adults finds consistent evidence for a positive association. 3,43,44 However, the evidence for youth is more mixed, with some research finding positive associations between street connectivity and PA 45,46 and other research finding negative associations. 47,48 Our results are consistent with others that find among preschool children (2-5 years), land use mix, lower pedestrian auto injury, and street density were associated with more PA. 19 Some explanations from prior studies include the possibility that vehicle traffic may have influenced the lower levels of PA exhibited by youth living in the most highly connected neighborhoods. Increased traffic in highly populated and connected neighborhoods could lead to parent and youth concerns of outdoor safety and subsequently to a decrease in youth PA participation. Another potential explanation could be a lack of outdoor play space in neighborhoods with highly connected streets. Homes in neighborhoods with the highest connectivity are placed in close proximity, leaving little room for yards and driveways for young people to use, which may lead to a decrease in PA. Also, the short blocks and lack of cul-de-sacs may make it difficult to play on the street. These explanations might explain why we find no association among children aged 6 to 11 years and significant positive associations among older youth, where their PA patterns might more closely approximate adult PA patterns.
We find inconsistent pattern of findings regarding measures of neighborhood diversity and youth PA. In particular, we observe negative associations between the percentage of residents walking to work with PA among females aged 6 to 11 years and negative associations between the percentage of residents biking to work with PA among males aged 12 to 17 years. Our prior research has linked methods of active transportation with obesity among adults in Salt Lake County, 4 arguing that percentage of workers taking active transportation to work is a valuable proxy for denoting residential environments where there are likely other walkability features that might promote PA. The census measure of percentage of residents who walked or biked to work in census tract is low. This low percentage of individuals who walk or bike to work may have limited the utility of this predictor in this sample. We find more robust connections between our other measure of neighborhood diversity, neighborhood median housing age, and PA. Housing age has been argued by Berrigan and Troiano 10 as being associated with neighborhoods that mix business with residential land uses and are likely to have more sidewalks. We find positive associations between neighborhood age and increased PA for female youth aged 6 to 11 years and among both male and female youth aged 12 to 17 years.
Two additional general conclusions emerge from this research that merit attention. First, children and adolescents differ in their response to features of their community environment. Adolescents may be more responsive to built environment features as it relates to their PA behaviors. We observe significant associations between distance to parks and population density with children’s engagement in MVPA. Significant associations are also observed for adolescents between these features and PA. Further, our results suggest that living in urban census tracts with older housing stock and greater street connectivity are factors that appear to promote PA among adolescents. These results suggest that children and youth may differ in their behavioral responses to modifiable environmental features. Future research should be careful to appreciate developmental differences in environmental influences on PA.
Second, these results suggest that it is important to evaluate the associations between modifiable community features and PA among male and female children and youth separately. For example, the age of the housing stock in a census tract is associated with higher MVPA among female children and teens, but age of housing stock is associated with increased PA among both female and male teens. Community-based interventions designed to spur and support PA among youth in general might place additional focus on identifying additional built environment features that are especially salient to teens.
Several limitations of the present study need to be acknowledged. First, this study is cross-sectional, and no causality should be assumed from the results. With few exceptions, 49 longitudinal studies using methods that address selection bias are rare in sociological and epidemiological studies of PA. Second, the temporal sequencing from neighborhood variables to PA measures was not established. For example, although census data were from the year 2000, prior to the 2003 to 2004 NHANES where PA measures were obtained, park data were constructed based on a GIS database of parks in 2006. It can be argued however that neighborhood characteristics are not likely to change dramatically within a few years. Thus, the varied timing of neighborhood data collection should not shake the cross-sectional nature of the present study. Third, there are missing data on the accelerometer variable we use as our key dependent variable. Recent research has questioned the implications of nonresponse bias stemming from missing data and asserts that overweight children may be more likely to have missing accelerometer data than normal-weight children. 50 Fourth, there is nonrandom selection of individuals into residential settings. It might well be that families select themselves into residential opportunities that reflect preexisting motivations and personal characteristics that might also influence the risk of decreased PA. Finally, the neighborhood was defined by census tract. Although this approach is often used in the literature, the drawback of using administratively defined spatial boundaries to circumscribe socioculturally meaningful neighborhoods is the consequent exposure misspecification.
Conclusion
The current analysis strengthens our understanding of the efficacy of built environment measures in urban communities and the importance of considering the possibility of differing patterns of associations in childhood and adolescence and by gender. Future modifications to built environment with the aim of increasing PA among youth might benefit from considering the role of population density and how it might differ by age of the youth. Park accessibility has consistent positive associations with PA among differently aged youth, suggesting that it is a feature that will benefit a wide range of residents. We do observe a gender discrepancy in the association between park distance and PA among teens. This perhaps could be a result of differential PA-related parenting (ie, giving permission to have unsupervised time at a park) based on their child’s gender. There is some evidence to support this gender-specific parenting. 51 New construction for residential communities that include built environment features such as greater street connectivity might have limited impact among youth aged 6 to 11 years. Given the importance of promoting PA among youth, this research provides some guidance on what features of the built environment should be important to consider when developing new residential communities.
SO WHAT?
What is already known on this topic?
People who live in low-walkability neighborhoods have lower rates of PA and are more likely to be at risk of being overweight. Researchers have used a variety of constructs to capture the effects of walkability and opportunities for exercise.
What does this article add?
Using NHANES 2003 to 2006 accelerometer data, we find that built environment features are especially salient for adolescents and youth living in urban areas. Vigorous activity varied by the age and gender of the youth. For example, greater distance to parks is associated with a decrease in PA among girls and boys aged 6 to 11 years. Among teens, distance to parks is significantly associated with decreases in PA among the total sample and among male teens. However, a unit increase in population density is associated with less time spent in physical activity among youth aged 6 to 11 years but more PA among teens.
What are the implications for health promotion practice or research?
This evidence supports health promotions that use tailored approaches to modifying residential health environments. Optimal built environments for youth should feature park access for both younger youth and teens. Male teens will especially benefit from park access. Built environment features that are similar to those found in older neighborhoods could be especially important for female teens.
Footnotes
Authors’ Note
Dr Lori Kowaleski-Jones conceptualized and designed the study, conducted the statistical analyses, and drafted and revised the initial manuscript. Dr Jessie Fan and Dr Ming Wen aided the conceptualizing and statistical analysis of the study and reviewed and revised the manuscript. Dr Heidi Hanson created the physical activity measures from raw accelerometer data and reviewed and revised the manuscript. The funding agency had no involvement in study design, data analysis, interpretation of the results, and decision to submit this article for publication.
Acknowledgments
The authors also thank Xingyou Zhang and Fahui Wang for constructing the park and intersection density measures.
Declaration of Conflicting Interests
The author(s) declared no potential conflicts of interest with respect to the research, authorship, and/or publication of this article.
Funding
The author(s) disclosed receipt of the following financial support for the research, authorship, and/or publication of this article: Supported by the National Cancer Institute of the National Institutes of Health under award number R01CA140319-01A1.