
Abstract
Purpose:
To determine the impact that a high-fiber, low-fat diet, derived from mostly plant-based sources, when coupled with support has upon self-management of type 2 diabetes mellitus in Latinos from medically underserved areas (MUAs).
Design:
Experimental randomized controlled community pilot study.
Setting:
Three community clinics in MUAs located within San Bernardino County, California.
Participants:
Thirty-two randomly assigned Latinos with A1C greater than 6.4: 15 control and 17 experimental.
Intervention:
Participants completed a 5-week education program. Researchers provided follow-up support for 17 randomly assigned experimental group participants through focus groups held at participating clinics—1, 3, and 6 months posteducation.
Measures:
Changes in fat and fiber consumption were measured using a modified Dietary Screener for Mexican Americans. Self-management was measured through the Self-Efficacy for Exercise Scale and Diabetes Quality of Life Measure.
Analysis:
Baseline characteristics for both groups were analyzed using independent t tests and χ2 tests. A 2-way repeated-measures analysis of variance was used to analyze biometric data between baseline and 6 months for both groups.
Results:
Mean A1C levels decreased from baseline to 6 months for both groups: control, μ1 = 9.57, μ2 = 9.49; experimental, μ1 = 8.53, μ2 = 7.31.
Conclusion:
The experimental group demonstrated a statistically significant reduction in mean A1C levels (P = .002) when compared to the control group.
Keywords
Purpose
The purpose of this pilot study was to determine the impact a high-fiber, low-fat diet, derived from mostly plant-based sources, has upon controlling type 2 diabetes mellitus (T2DM) in Latinos in medically underserved areas (MUAs) as evidenced by biomarkers pre- and poststudy. Researchers also sought to assess whether facilitated follow-up focus group sessions as an intervention strategy improved participants’ outcomes. Although the use of focus groups in research is not innovative, their primary use is program development and evaluation. 1,2 Researchers used a novel approach by pairing the Diabetes Self-Management Education Program (DSMEP) with focus group intervention as a follow-up strategy to address the concerns of participants, identify achievable self-care behaviors, and promote and maintain lifestyle change, rather than merely for data collection.
Self-care behaviors such as consuming a healthy diet and engaging in physical activity that lead to weight loss can increase insulin sensitivity and prevent T2DM and related complications. 3 There is an increasing body of evidence linking the benefits of a high-fiber, low-fat diet, primarily from plant-based sources, to the prevention and management of diabetes. 4 -12 Nonetheless, the application of these research-validated interventions for Latinos with T2DM living within MUAs is limited. In addition to dietary and exercise recommendations, current American Diabetes Association (ADA) clinical practice recommendations specify that diabetes care should include self-management education that addresses psychosocial issues and provides ongoing support. 13
“There is a social gradient to health; health is correlated with education, income and the place in which one lives” (p. 10). “Californians who live in neighborhoods where educational achievement is low, unemployment is high and poverty is widespread die at a younger age and are often racial/ethnic minorities” (p. 8). 14 According to the San Bernardino Community Indicators Report, these circumstances characterize conditions for many living in San Bernardino County, which has the second lowest proportion of high school graduates (79%) when compared to other regions in the state and falls below both the state (82%) and national averages (87%). Fewer residents in the county have college degrees (19%) when compared to the state (31%) and nation (30%). Unfortunately, a larger gap in educational attainment is noted for ethnic minorities like African Americans (17%) and Latinos (14%). Latinos are the predominant ethnicity (51%) in the county where many inhabitants are foreign born (21%) and speak a language other than English at home (41%). San Bernardino County also has a higher percentage of residents living in poverty than the state, and the poverty level increased from 13.7% in 2007 to 19.7% in 2013. The unemployment rate in the county has been consistently higher than the state and the nation since 2007 and was 6.3% in May 2015, which ranks the county 23rd of all 58 counties in California. 15
Given the economic disadvantages faced by many of the county’s residents, it is not surprising that the county is ranked second to last in the state for diabetes-related mortalities. 16 The California Department of Public Health Chronic Diseases Branch also gave the county the fourth highest ranking for diabetes prevalence in 2012. 16 Further compounding these issues is the shortage of primary care physicians. The ratio of primary care physicians to people in San Bernardino County is 1:1736. This patient to provider ratio is higher than the national target (1:1067), the state ratio (1:1294), and all neighboring counties except Riverside, which along with San Bernardino comprises the Inland Empire. 15 The regions’ primary care workforce shortage is compounded by the rapidly growing population, some of the lowest provider reimbursement rates in the nation for Medi-Cal, 17 and lack of English language proficiency among residents. The county’s population has increased by 8% in the last year alone to 2 091 618, which makes it the fifth largest population in the state, the majority of whom live in the Central Valley region. 15 The Health Resources and Services Administration has given much of this region the designations of health professional shortage area and MUA. 18 When considering the county’s demographic profile, it is not surprising that diabetes is increasing in San Bernardino, especially for Latinos in the Central Valley region, where the 3 cooperating clinics in this study are located. Therefore, it is essential to identify achievable self-care behaviors that lead to weight loss and can increase insulin sensitivity, such as consuming a healthy diet and engaging in physical activity, to manage T2DM and its related complications among the medically underserved members of this population.
Methods
Design
The university’s institutional review board approved the study design prior to the start of the project. This pilot study used a mixed-method, experimental, randomized controlled community trial design to test the effect of diet and support upon outcomes; however, for the purpose of this article, reporting is limited to the quantitative outcomes. Diet functioned as the within-group factor, while support constituted the between-group factor: those who did not receive follow-up focus group support (control group) versus those who did (experimental group). A priori power analysis using PASS revealed that a minimum of 40 participants were needed to achieve a small Cohen d effect size of .23 for repeated-measures analysis of variance (ANOVA) with 1 within-subject factor and 1 between-subject factor to achieve 80% power at an α of .05. An effect size of at least .23 was deemed necessary to demonstrate a level of improvement in outcomes that is large enough to justify the additional effort and expenditures required to conduct the follow-up focus group intervention. Data collected prestudy and 6 months poststudy consisted of A1C, a lipid panel, blood pressure, and anthropometric measurements (body mass index, hip and waist circumference) for both the control and experimental groups. Clinical personnel from participating clinics, who were blinded to participants’ status (control vs experimental), collected A1C and lipid panel profiles on all participants prior to randomization and at the 6-month follow-up.
Directors of 3 community clinics and a pastor of a local Spanish church promoted the DSMEP through posting fliers in their waiting areas and church narthex. Providers from the 3 participating clinics assisted with recruitment by referring Latinos with T2DM to the classes. At the first session of the DSMEP, the nurse educator explained the study to attendees and invited them to participate. Attendees who did not choose to participate or who did not meet inclusion criteria could continue to attend the classes along with the individuals who chose to participate in the study. The criteria for participating in the study included (1) self-identified Latino, (2) Spanish speaking, (3) living within the County of San Bernardino, (4) attending at least 3 of the 5 DSMEP classes, and (5) having an A1C of 6.5% (48 mmol/mol) 19 or more at the beginning of the DSMEP.
Sample
Sixty-eight Latinos with diabetes signed the informed consent and initiated the DSMEP. Of the original 68, only 60 completed 3 or more of the DSMEP classes. Forty-two participants completed their baseline laboratory tests, after which 2 with prediabetes, 1 with type 1 diabetes, and 1 who refused to be randomized were dropped from the study. The remaining 38 were randomly assigned to either the control or experimental group. Of these, only 32 successfully completed the study. The 6 who did not complete the study lacked complete follow-up laboratory tests and paperwork (Figure 1). The sample’s characteristics at baseline reflected those delineated in the literature for this population in that most were unemployed, lacked health insurance, and experienced worse health than the general population (Table 1). Tables 1 and 2 demonstrate a nonstatistically significant difference at baseline between the demographic composition of the control and experimental groups for qualitative and quantitative measures, respectively.
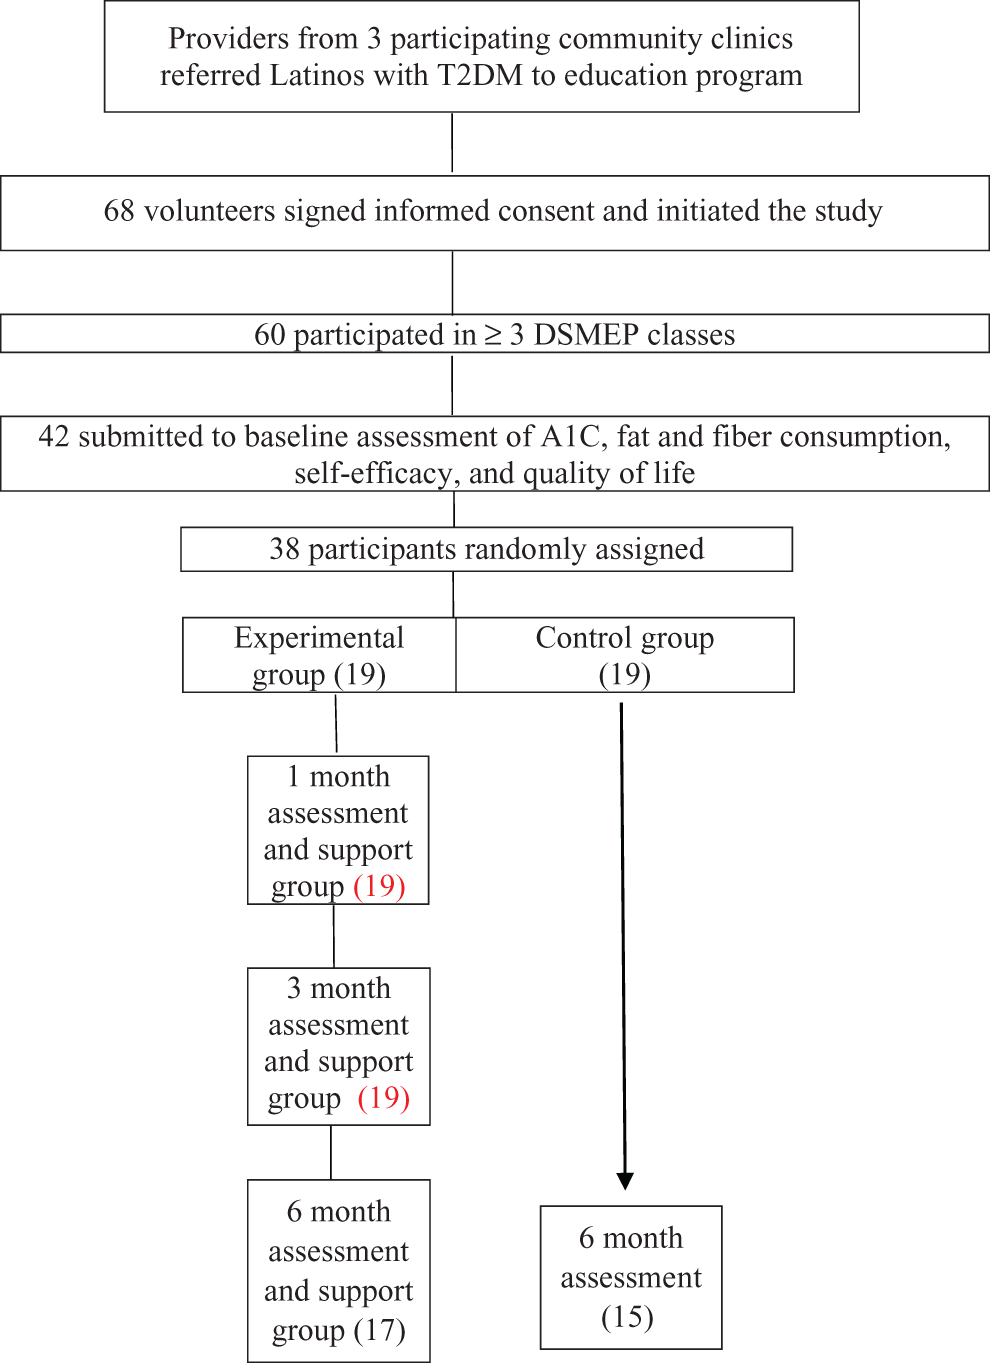
Flowchart of the study.
Contingency Table: Characteristics at Baseline for Control Versus Experimental Group.
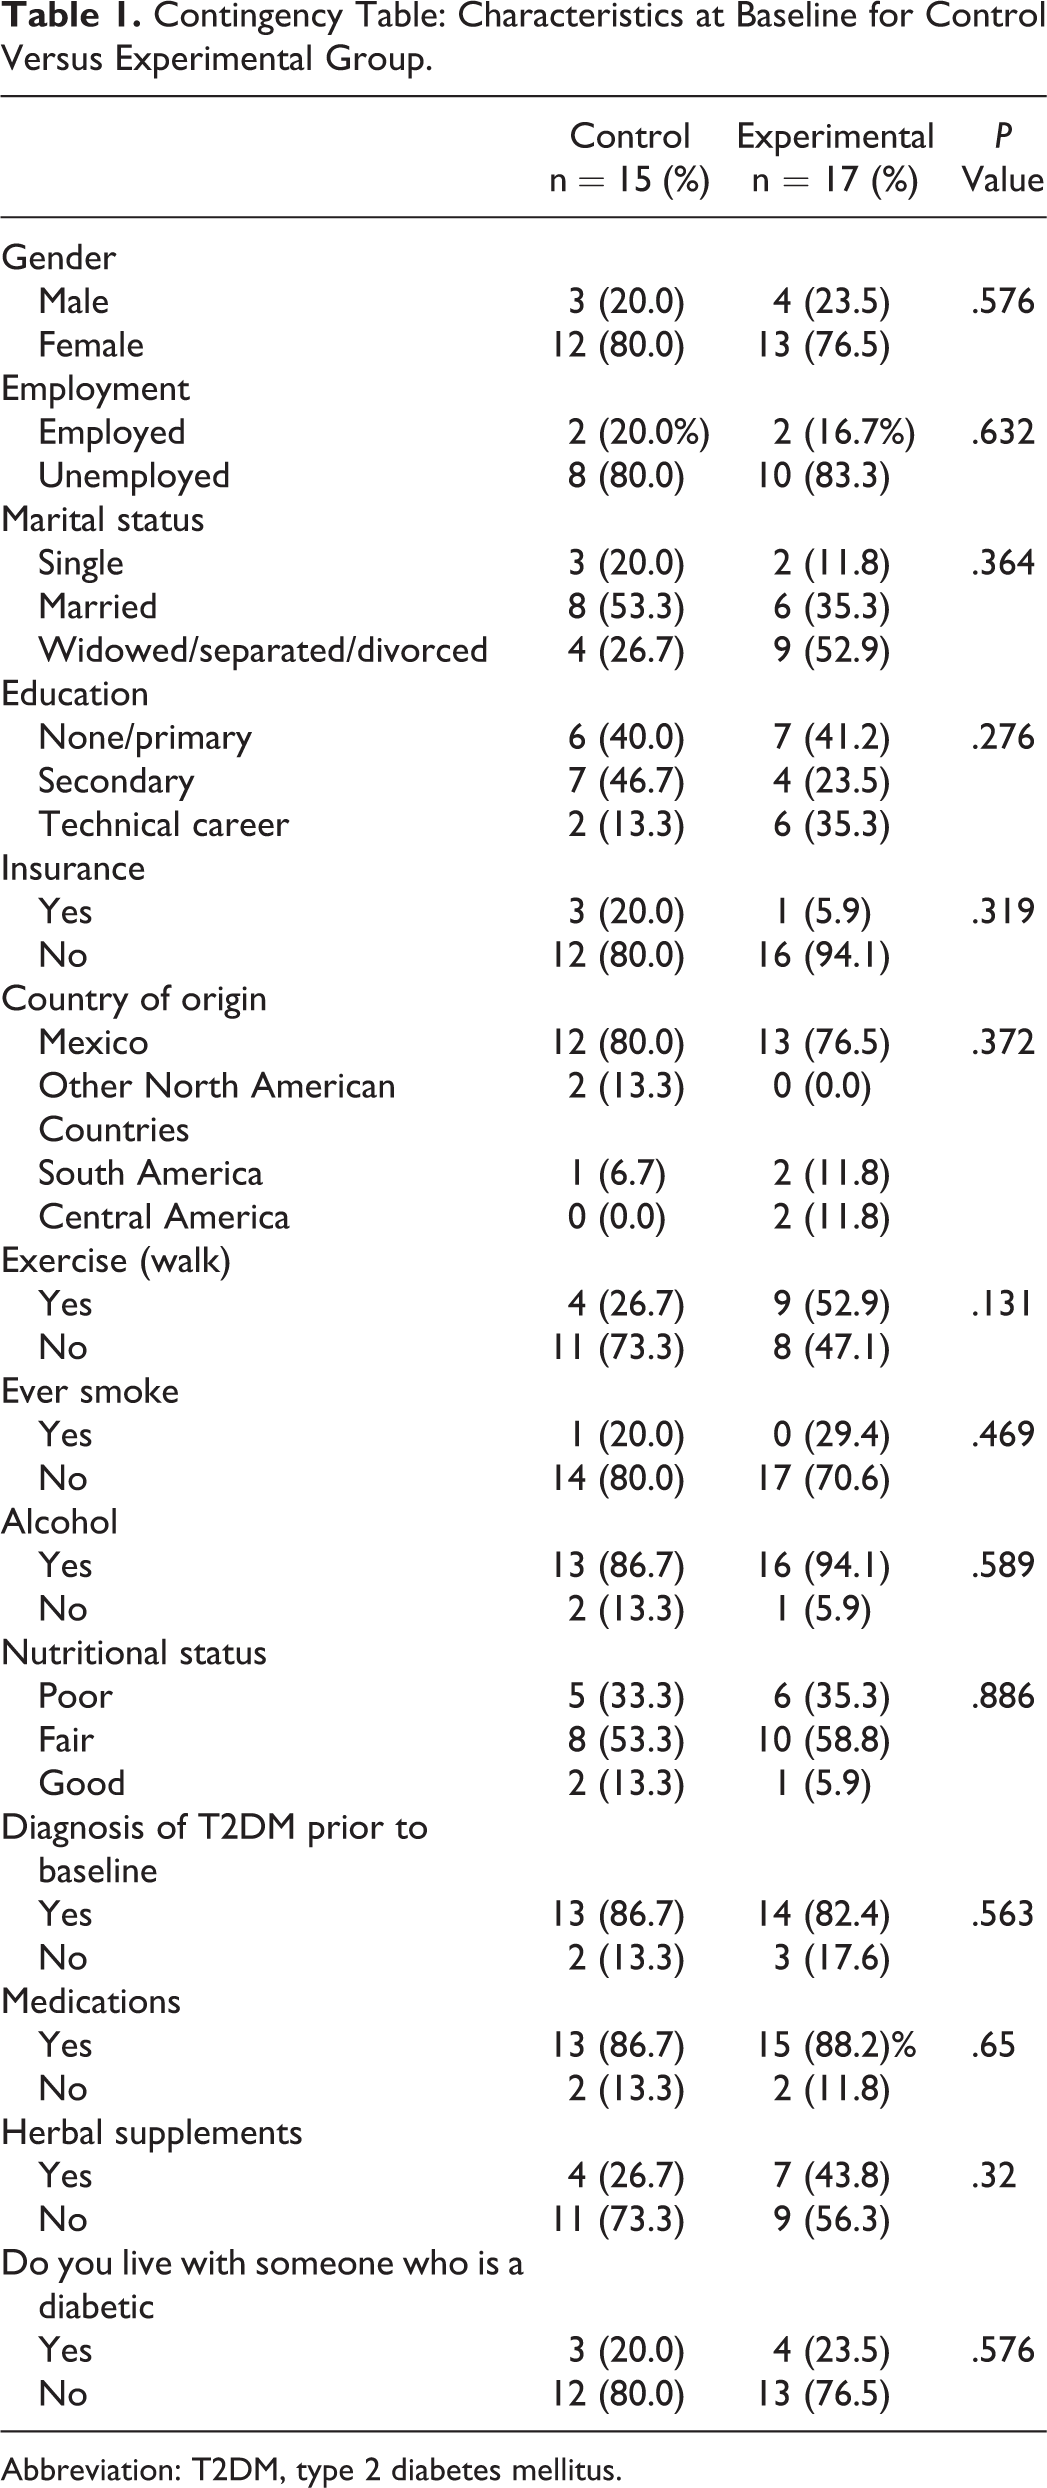
Abbreviation: T2DM, type 2 diabetes mellitus.
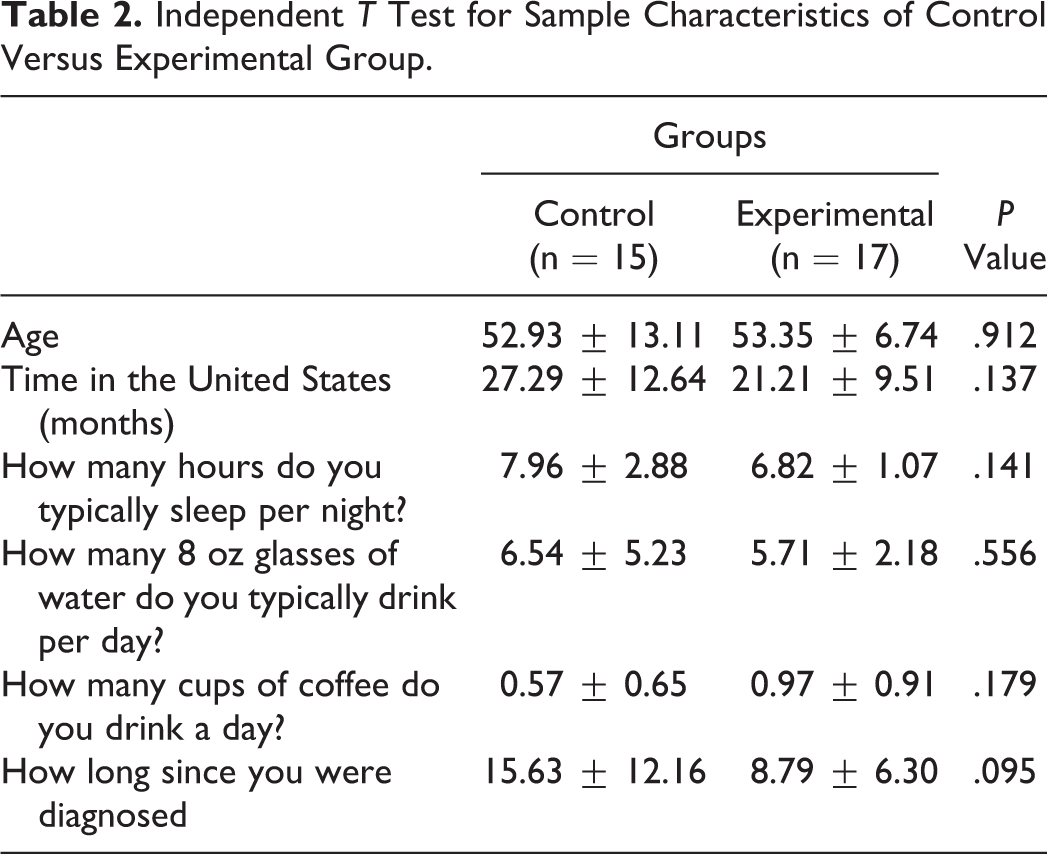
Independent T Test for Sample Characteristics of Control Versus Experimental Group.
Measures
Forty-two participants completed a demographic information form and submitted to testing for A1C, triglycerides, total cholesterol, blood pressure, and anthropometric measurements prior to randomization, of which 32 remained at the 6-month follow-up. To ascertain changes in their perceived quality of life, every participant completed the Satisfaction with Treatment scale of the Diabetes Quality of Life (DQOL) questionnaire prior to randomization and upon completion of the study. This area of the DQOL contains 15 items and has an internal consistency (Cronbach α) of .88. 20 This study used the modified Self-Efficacy for Exercise (SEE) scale, a 9-item self-report scale with an α coefficient of .92, to measure perceived self-efficacy for exercise. 21 However, in that many people living with diabetes experience diabetic neuropathy in their extremities as the disease progresses, 22 the researchers eliminated the question regarding avoiding exercise while in pain due to the intervention’s emphasis on exercising at a level deemed safe by their health-care provider. Experimental group participants kept a nutritional history and physical activity record for 1 week during the DSMEP and at 1, 3, and 6 months post-DSMEP to coincide with the focus group support sessions. One week before each focus group intervention, research assistants called participants to remind them to record their nutritional history and physical activity log during that week. This enabled them to track their progress and report more accurately at the ensuing focus group discussions. A modified Dietary Screener for Mexican Americans assessed participants’ fat and fiber intake. 23 Modifications to the dietary assessment tool consisted of the conversion of the month measurement categories to a category entitled “never” and the further disaggregation of the “5 or more times per week” category into 2 separate measurements of “5 to 6 times per week” and “7 or more times per week.” Researchers standardized the measurement scales for both the fat and fiber intake portions of the scale. The rationale for these modifications included the need to correlate the participants’ weekly dietary recall with the measurement tools, the desire to further facilitate participants’ completion of the scales, and the need to enhance readability for low-literacy individuals by omitting the disparate measurement between the fat and fiber scales.
Intervention
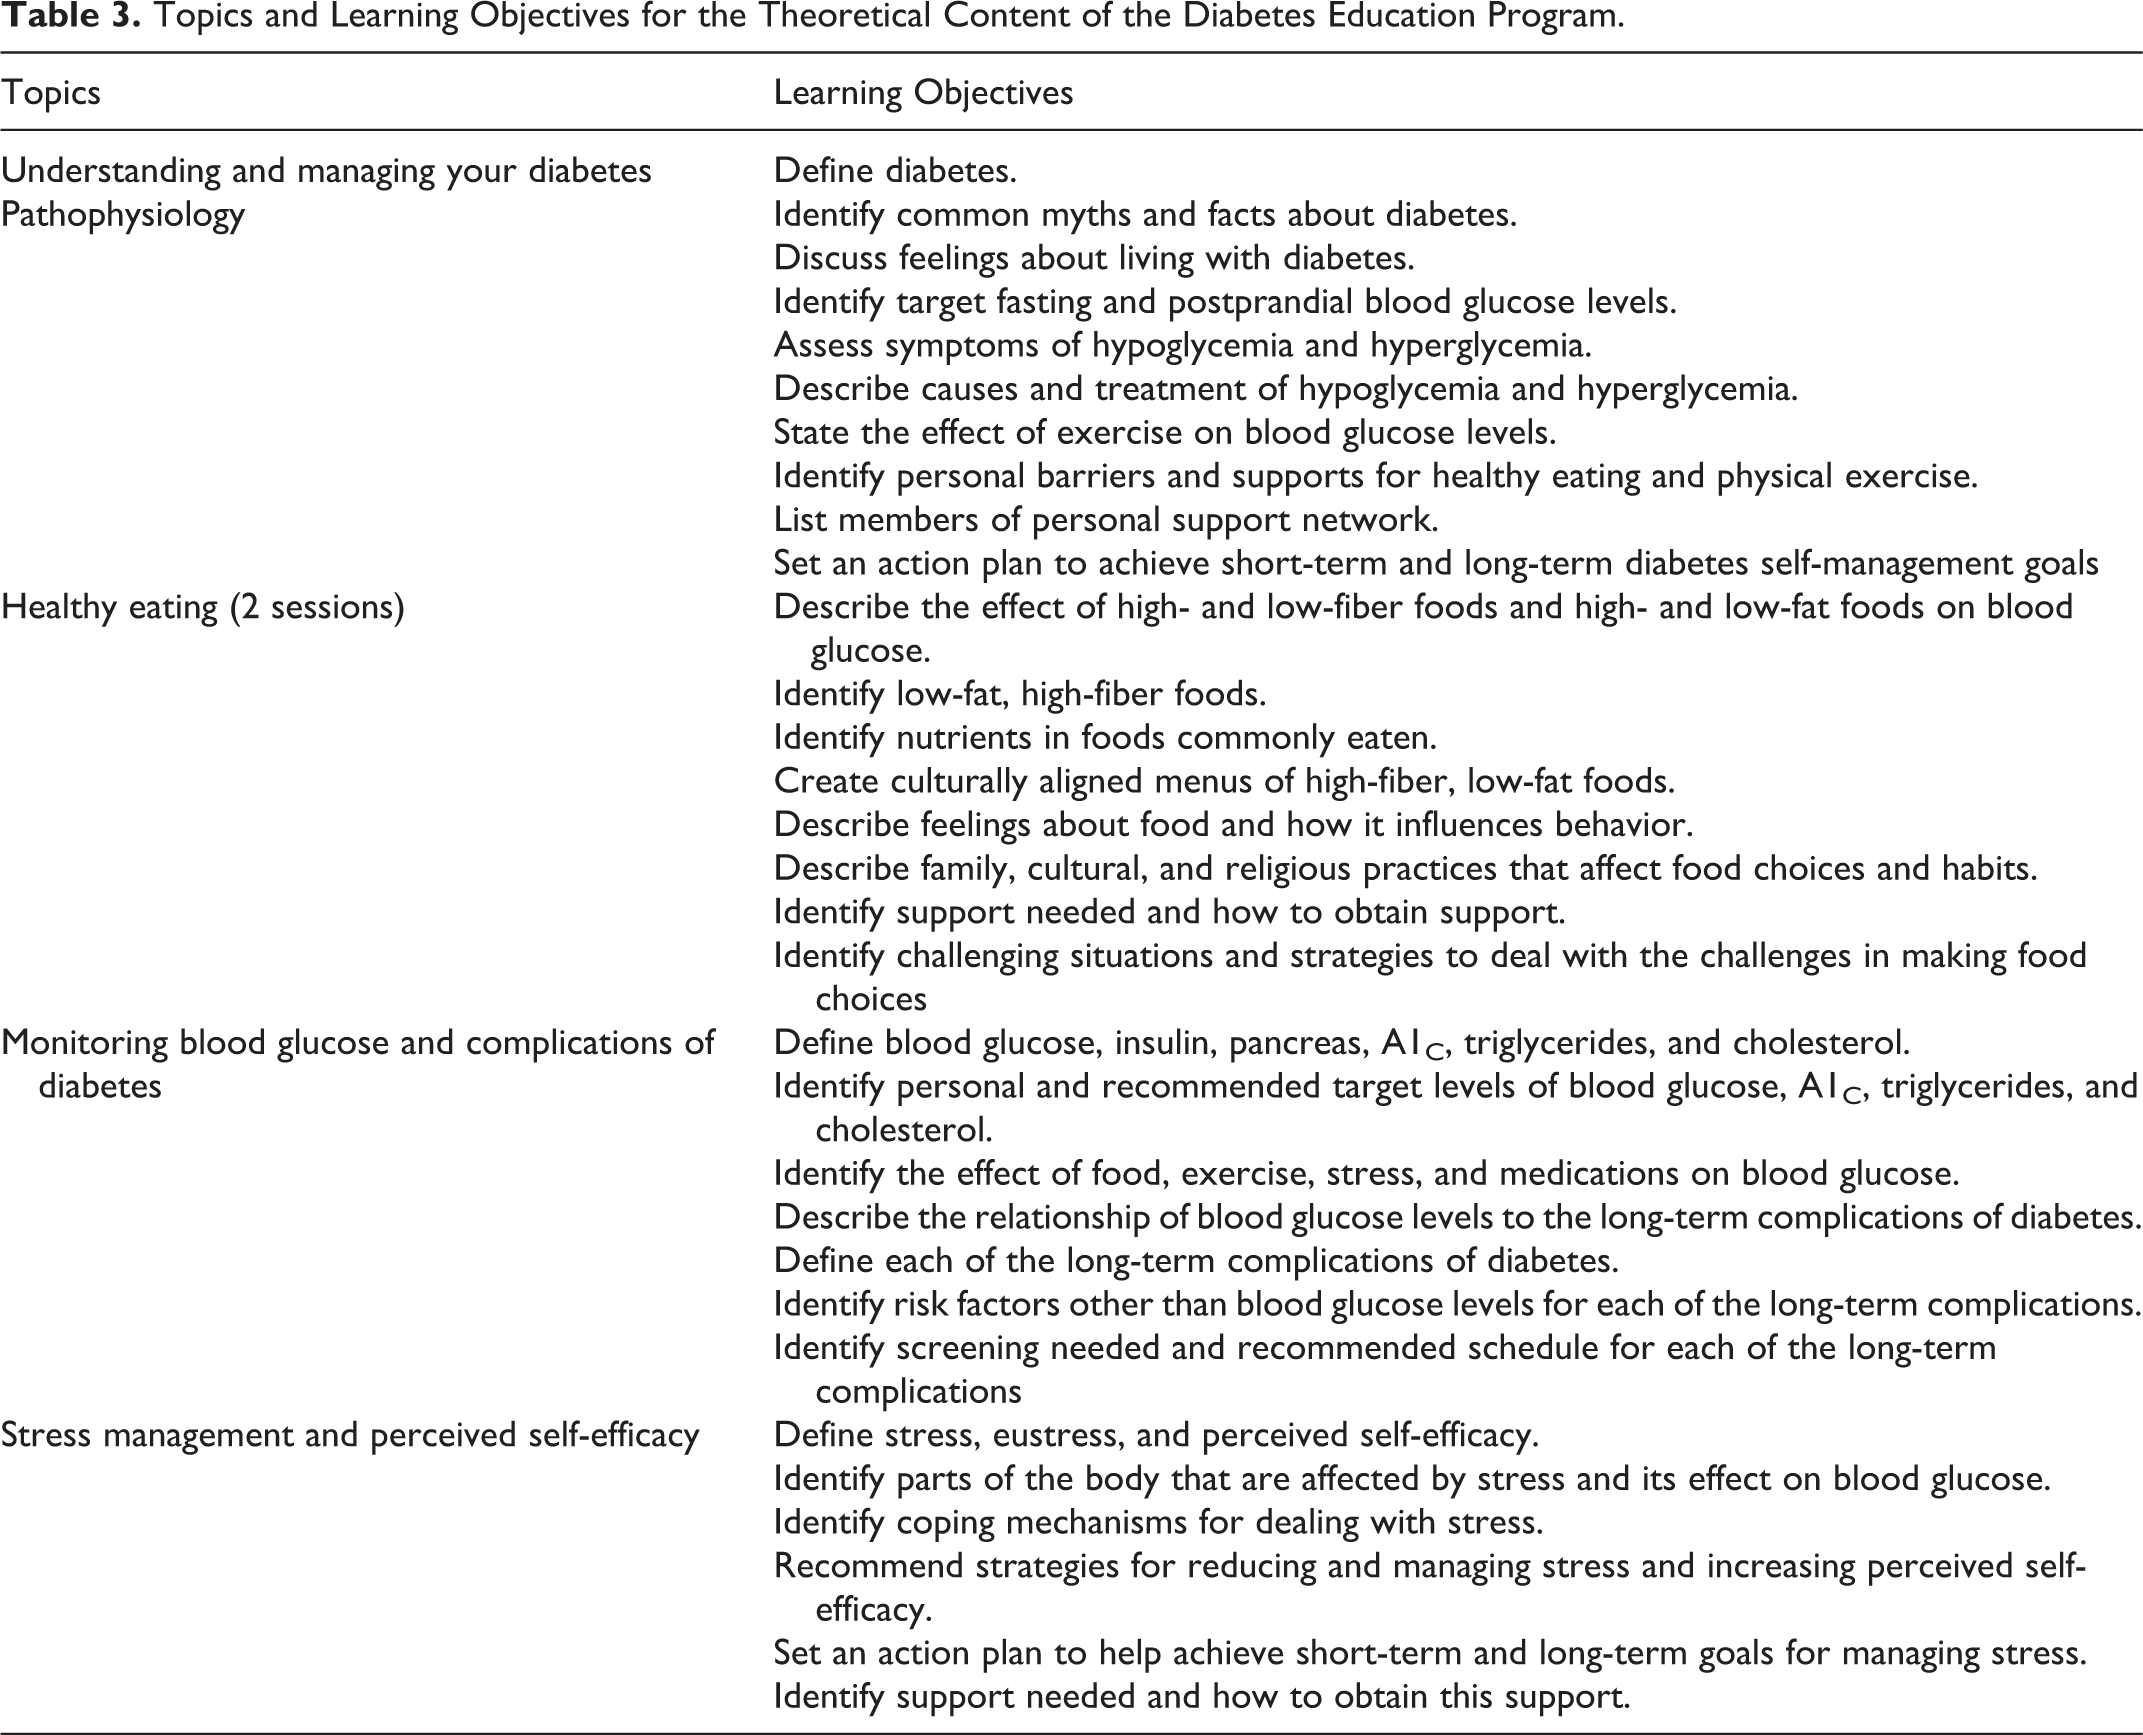
Both the control and experimental groups participated in the DSMEP. Participants who completed baseline assessment were randomly assigned to the control or the experimental group. The DSMEP consisted of a series of five 150-minute sessions held weekly for 5 weeks taught entirely in Spanish. The first half of each session covered theoretical content including pathophysiology of diabetes; complications; treatment; diet, focusing on the benefits of consuming mainly plant-based foods; and exercise, stress management, diabetes self-management strategies, and methods to increase self-efficacy (Table 3). The researchers used the content of the US Diabetes Conversation Map Tools in Spanish, created by Healthy Interactions Inc in collaboration with the ADA, 24 for portions of the theoretical content. PowerPoint presentations supplemented aspects not fully addressed in the Conversation Map Tools, such as the benefits of a plant-based diet, stress management, and self-efficacy. Participants shared their experiences and actively engaged in acquiring or reinforcing knowledge about diabetes management. With the assistance of a Latino nutritional instructor, participants engaged in the preparation and sampling of low-fat, high-fiber, plant-based foods during the second hour of each session of the DSMEP. Educators provided participants with recipes and menus adapted from The 30-Day Diabetes Miracle Cookbook, 25 with the needed modification of ethnic foods to a plant-based diet. Seven cohorts completed the DSMEP conducted at 3 different community clinics and 1 Spanish church.
Topics and Learning Objectives for the Theoretical Content of the Diabetes Education Program.
Literature supports better outcomes for participants who receive not only education but also follow-up support for implementing lifestyle change.
26
The researchers conducted a series of follow-up support focus groups by cohort at 1, 3, and 6 months after the DSMEP for those assigned to the experimental group. One facilitator met with 3 to 6 participants per session, each lasting between 30 and 60 minutes depending upon focus group size. The purpose of these focus groups was to determine whether facilitated follow-up support as an intervention strategy improved experimental participant outcomes. A Spanish-speaking researcher used a semistructured interview guide to facilitate the first focus group discussion, the results of which informed the content of subsequent discussions. The semistructured interview guide used to facilitate the initial focus group addressed the following: What has been the greatest benefit of participating in the diabetes education classes? What changes have you made as a result of participating in the DSMEP? What have been some of the results of these changes? What do you consider are your strengths that have helped you make these changes? What difficulties have you encountered in trying to make the changes? What have you done to overcome these difficulties? What else do you think you can do to face these difficulties? What can we do to help you face these difficulties you have mentioned? What else would facilitate and prepare you to implement the changes necessary to manage or prevent diabetes? In what ways would you like to become involved in helping your community decrease the incidence of diabetes in the present and future generations?
Analysis
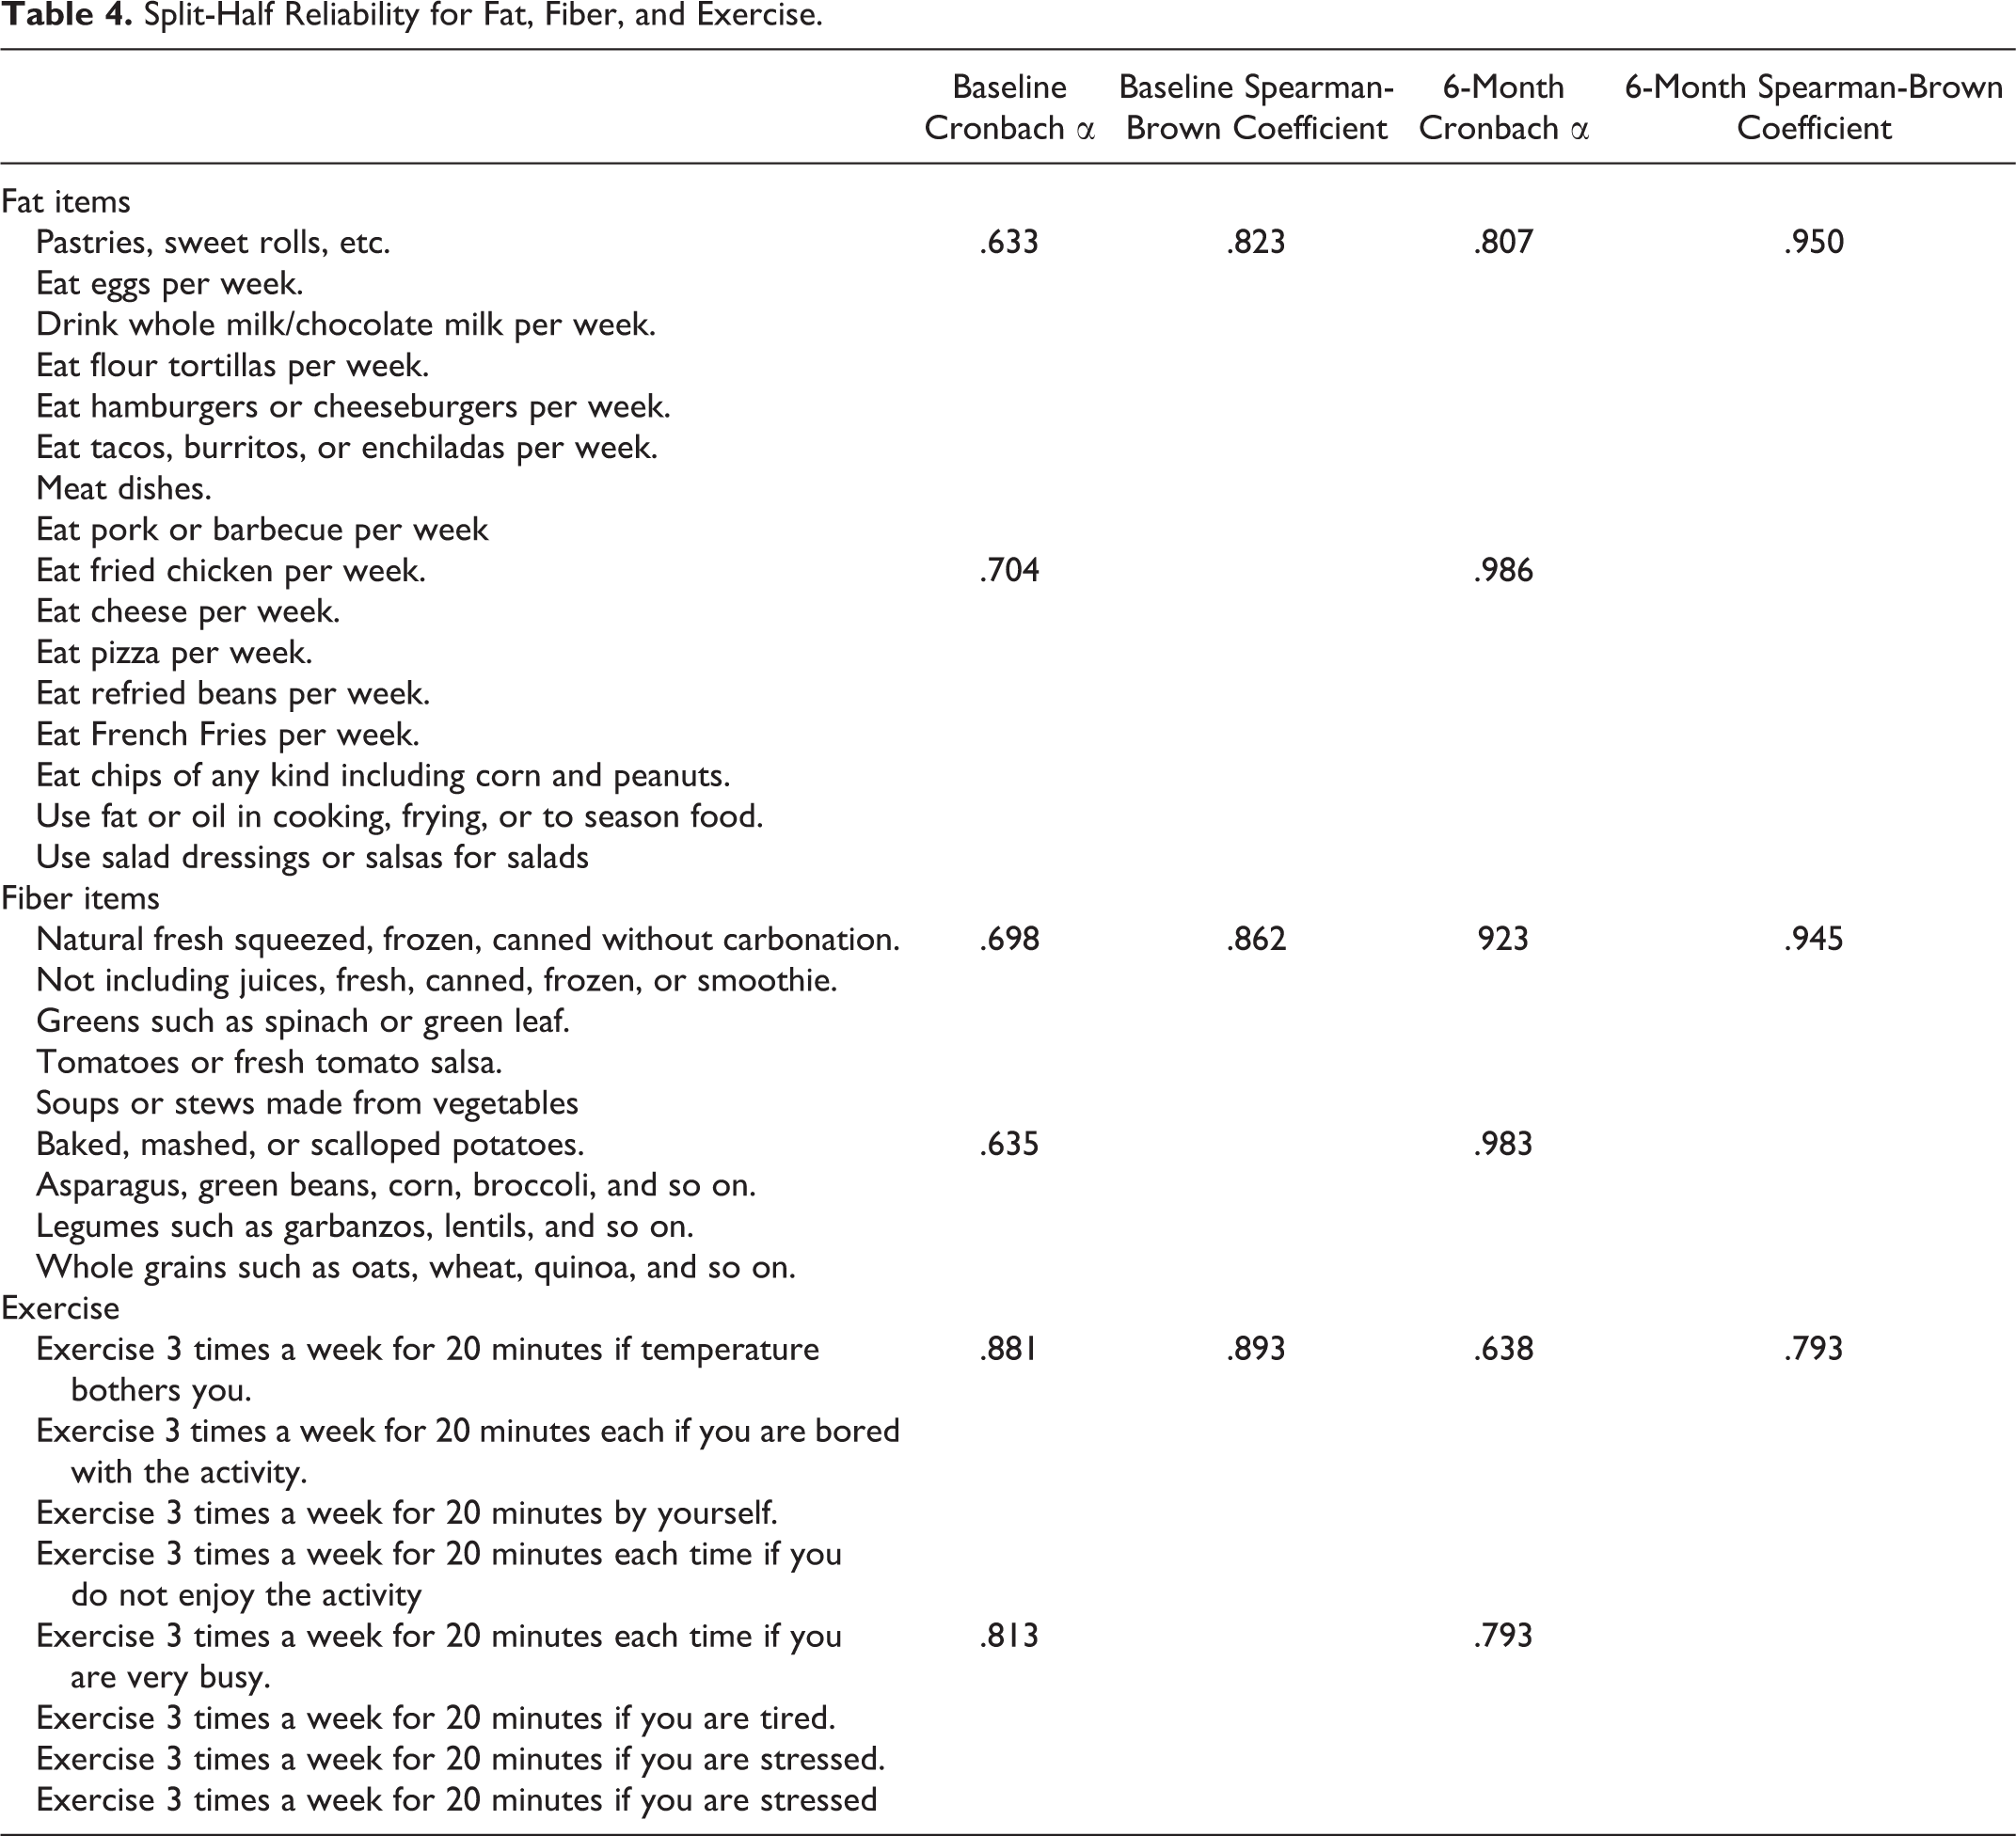
Researchers analyzed the quantitative data using the Statistical Package for Social Sciences version 24 (SPSS. 24). They assessed differences in sample characteristics at baseline (control vs. experimental) using independent t tests for quantitative variables and contingency tables and their associated χ2 P values to test for homogeneity of qualitative variables (Tables 1 and 2). The authors conducted reliability analysis of the modified SEE and dietary assessment tools to assess the consistency of the items at baseline and 6 months using split-half reliability, which splits the items in half and assesses the Cronbach α for each half. Additionally, researchers calculated Spearman-Brown coefficients to measure correlations between the 2 groups of split items (Table 4). They conducted correlation analysis of A1C at 6 months with the nutritional items of mean fat intakes after controlling for baseline measurements using partial Pearson correlations. Two-way repeated-measures ANOVA assessed changes in fat and fiber intake for control versus experimental participants from baseline to 6 months and the effects of diet and intervention between the experimental and control groups upon the self-management of T2DM, as evidenced by changes in A1C, lipid panel, and anthropometric measures. Using 2-way repeated-measures ANOVA, researchers analyzed changes in participant’s SEE scale and perceived quality of life using baseline and 6-month follow-up answers to the SEE and DQOL questionnaires (Table 5).
Split-Half Reliability for Fat, Fiber, and Exercise.
Study Outcomes at Baseline and 6 Months.a
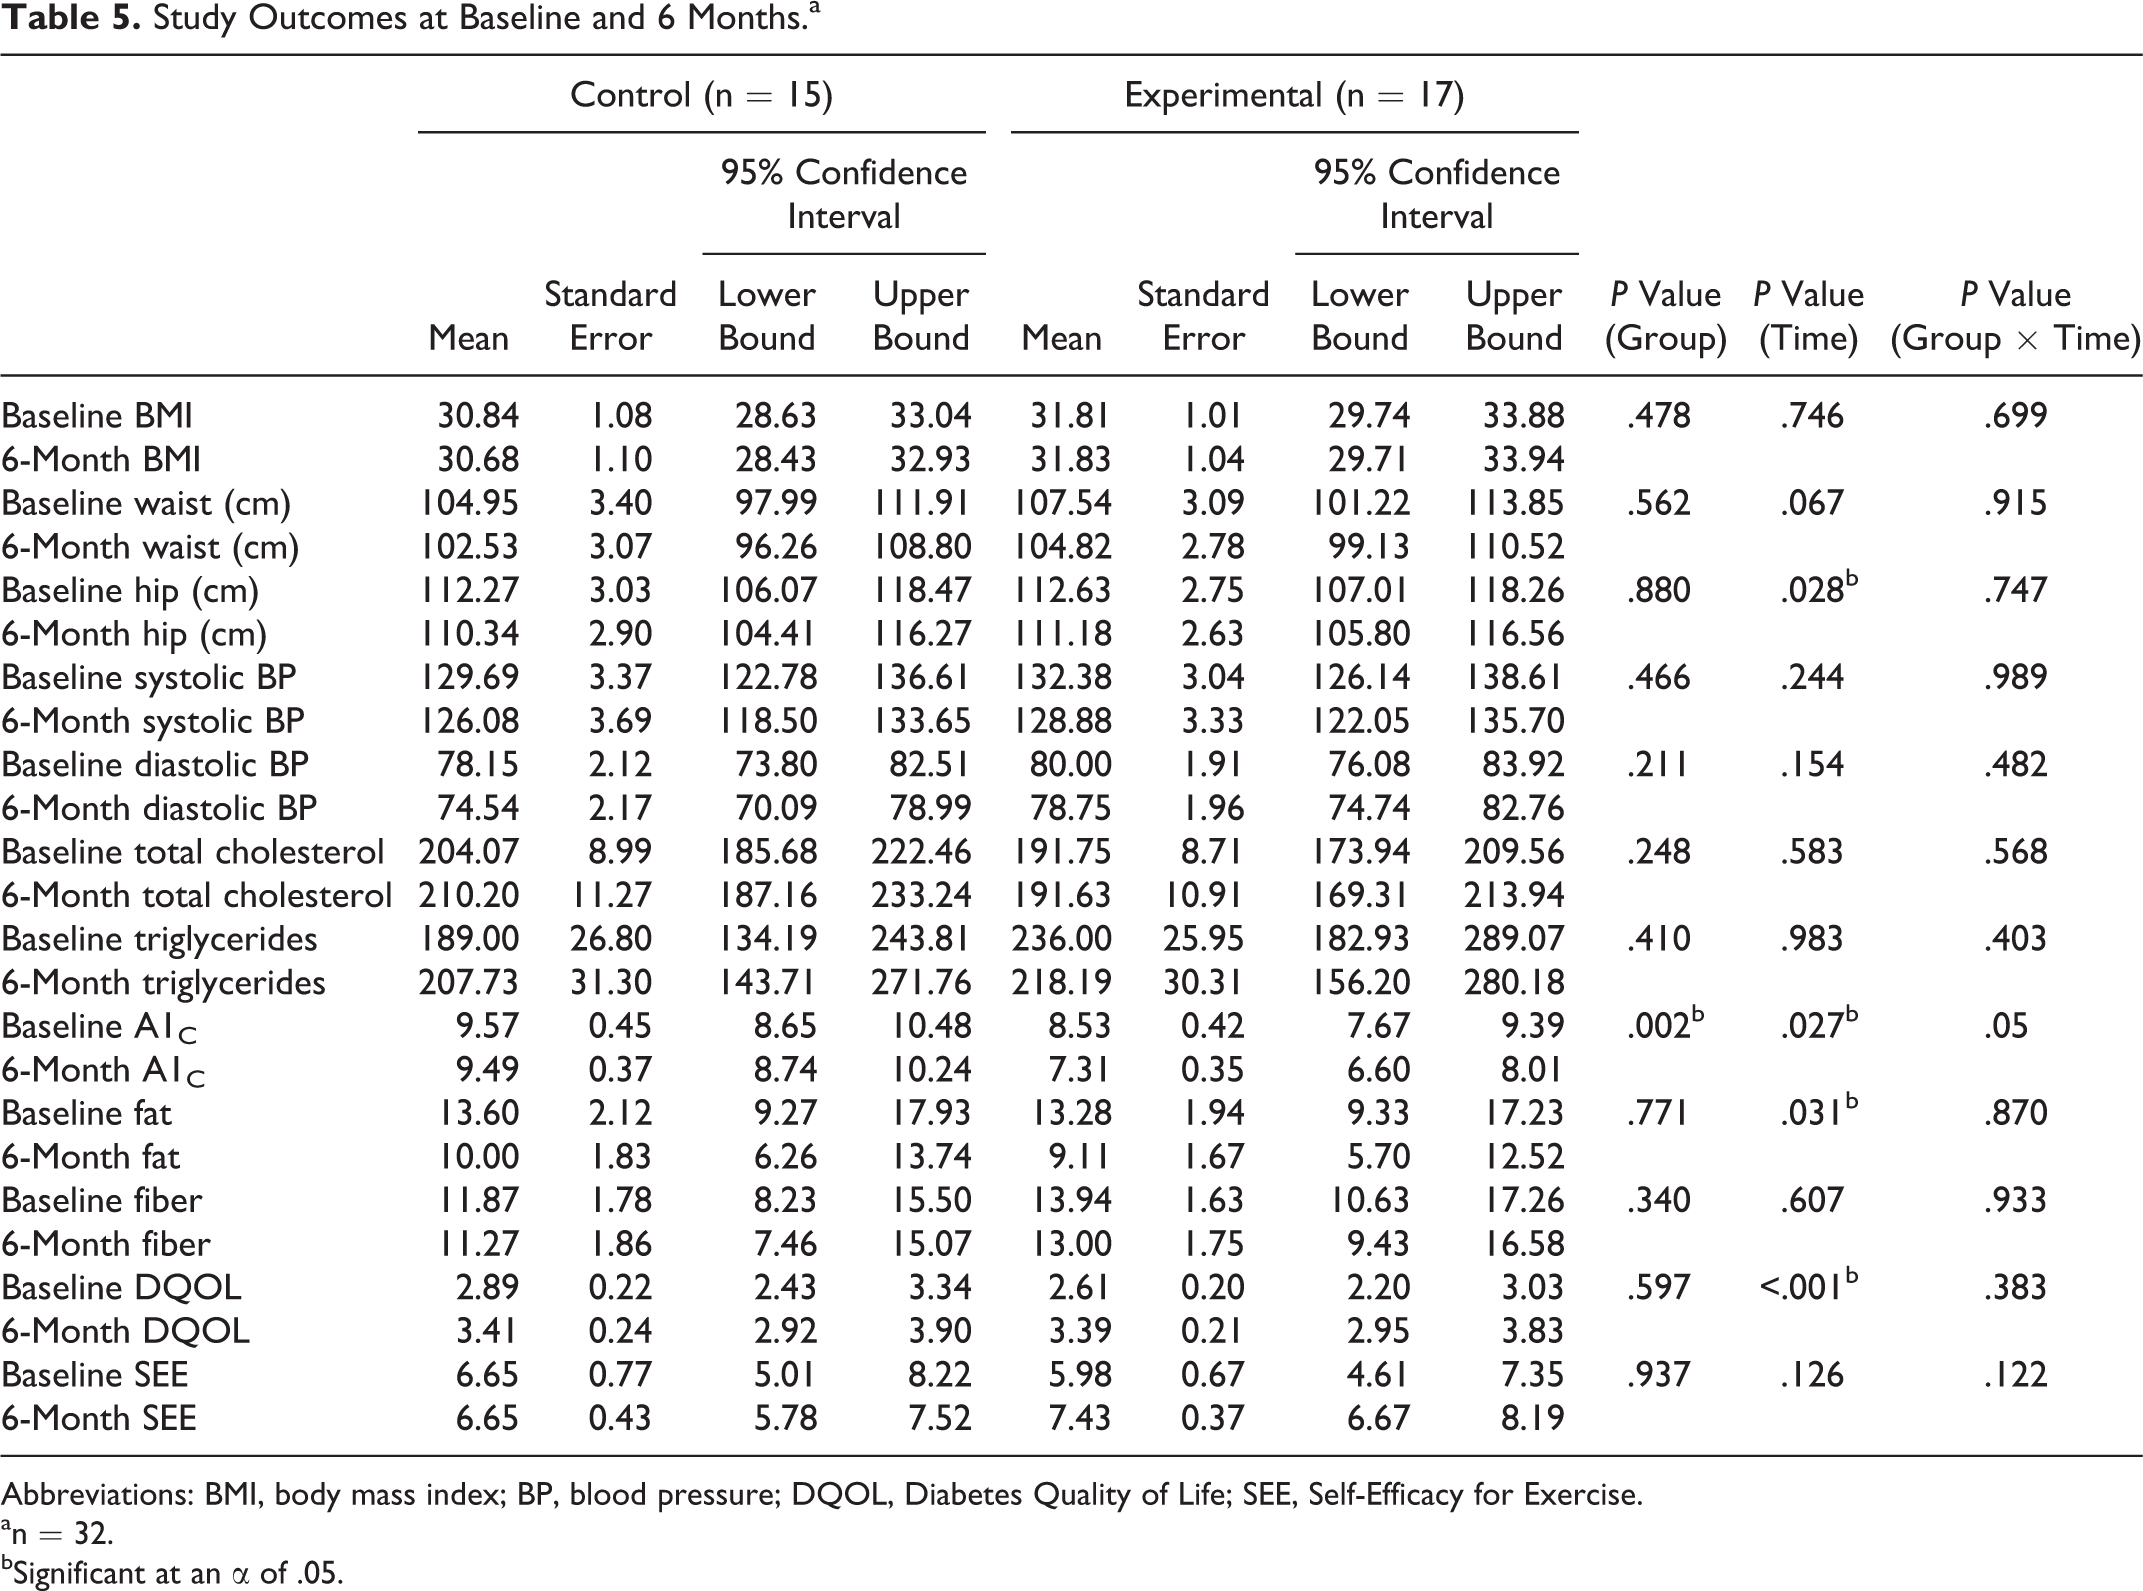
Abbreviations: BMI, body mass index; BP, blood pressure; DQOL, Diabetes Quality of Life; SEE, Self-Efficacy for Exercise.
an = 32.
bSignificant at an α of .05.
Results
As demonstrated in Tables 1 and 2, there was a lack of statistically significant difference between the control and experimental groups at baseline, indicating that both groups were equivalent. The results of the contingency tests (Table 1) demonstrated that fewer controls (26.7%) than experimental participants (52.9%) reported walking 30 minutes/d or 6 d/wk preintervention; however, this difference was statistically insignificant (P = .131). Only 20% of controls and 29.4% of experimental participants reported having ever smoked (P = .469), which also lacked statistical significance. More experimental participants reported consuming alcohol (94.1%) than those in the control group (86.7%); however, this difference was not statistically significant (P = .589). Thirty-three percent of controls reported their nutritional status as poor at baseline, while 53.3% reported that they were in fair health and 13.3% were in good health. Thirty-five percent of experimental participants reported poor health at baseline, 58.5% reported fair health, and 6% reported good health. Neither group had participants who reported excellent health at baseline nor were the differences in their reported health status statistically significant (P = .886). Of those who reported a doctor’s diagnosis for T2DM prior to commencing the study, 86.7% of controls and 82.4% of experimental participants knew their condition (P = .563); however, there was a small percentage in each group (13.3% controls and 17.6% experimental) who learned of their diagnosis through enrolling in the study and completing baseline blood work. The majority of controls (86.7%) and experimental (88.2%) participants reported taking medication to control their diabetes (P = .650), which researchers instructed them to continue taking as prescribed by their doctor. Only a very small percentage of controls (26.7%) or experimental participants (43.8%) reported taking herbal supplements (P = .32). Most controls (80.0%) and experimental participants (76.5%) reported being the only diabetic in their household (P = .576).
Table 2 demonstrates a nonstatistically significant difference between the demographic composition of the control and experimental groups for quantitative measures. The mean age for control (52.93 ± 13.11) and experimental (53.35 ± 6.74) participants at baseline was not statistically significant (P = .912). The difference in the mean length of time in months that participants resided in the United States was not significantly different for the control group (27.29 ±12.64) when compared to the experimental group (21.21 ± 9.51; P = .137). Both groups reported similar average hours of sleep per night: controls 7.96 ± 2.88 versus experimental 6.82 ± 1.07, P = .141. Neither group’s baseline mean water intake (controls 6.54 ± 5.23 and experimental 5.71 ± 2.18) nor coffee consumption (controls 0.57 ± 0.65 and experimental 0.97 ± 0.91) was significantly different (P = 0.179). Although the mean length of time since controls (15.63 ± 12.16) had been diagnosed with T2DM was almost twice that of experimental participants (8.79 ± 6.30), this difference was not statistically significant (P = .095).
The results of the repeated-measures ANOVA (Table 5) indicated that there was a significant effect of diet on A1C levels (F 1, 30 = 5.43, P = .027), such that the mean A1C levels improved from baseline to postintervention for both the experimental and control groups. Additionally, there was a significant effect of intervention on A1C levels. The experimental group demonstrated a statistically significant reduction in mean A1C levels when compared to the control group (F 1, 30 = 10.90, P = .002). The interaction between diet and intervention for A1C levels lacked statistical significance (F 1, 30 = 4.18, P = .050). Both the experimental and control groups perceived an increase in quality of life as demonstrated by the significant effect of diet on the DQOL (F 1, 27 = 21.41, P < .001). Researchers found a lack of statistical significance for all other variables, except for the main effect of diet on hip circumference (F 1, 29 = 5.34, P = .028) and fat intake (F 1, 30 = 5.35, P = .031), such that hip circumference and fat intake decreased for both groups’ participants over the course of the study.
The results of the split-half reliability analysis indicated mostly high reliability (Cronbach α greater than .7) for the SEE, mean fat scale, and fiber scale at both baseline and 6 months (Table 4). The correlation of mean fat and fiber intakes with A1C at 6 months demonstrated a nonsignificant positive correlation of A1C with fat intake (r = .122, P = .507) and an inverse correlation with fiber intake (r = −.132, P = .571).
Discussion
Participating in the DSMEP conducted before the randomization of the participants seemed to have motivated both groups to adopt and continue self-care behaviors that positively impacted 3 of the variables measured in this study as demonstrated by the statistically significant reduction in fat intake, A1C levels, and hip circumference for both groups. In addition to knowledge about the benefits of a plant-based diet, the DSMEP provided participants with the opportunity to prepare and sample tasty culturally aligned plant-based foods, thus enhancing their likelihood of preparing and consuming a high-fiber, low-fat diet at home. Although the correlation between mean fat and fiber intake and A1C levels at 6 months lacked statistical significance, there was a positive correlation of A1C with fat intake and an inverse correlation with fiber intake. The positive correlation between fat intake and A1C levels is consistent with research findings in the literature that diets high in animal fat are a risk factor for T2DM and are detrimental to controlling one’s blood glucose. 4 -12 The inverse correlation between fiber intake and A1C levels at 6 months concurs with research findings that diets high in fiber may have a positive impact on lowering A1C levels for those with T2DM. 6,8
The statistically significant effect of support on A1C levels suggests that other factors besides the DSMEP were instrumental in this decrease, such as the focus group support offered to the experimental group. Findings from the literature suggest that social support by itself is insufficient to positively impact A1C levels. 27 On the other hand, a meta-analysis of diabetes self-management programs for older adults concluded that an education program when paired with other therapies such as tailored interventions and psychological support results in outcomes of greater clinical relevance than the DSMEP by itself. 28
This study has some limitations relevant to the impact of the DSMEP on biomarkers. The uncertain reliability of dietary recall may have impacted the accuracy of participants reported dietary intake of fat and fiber affecting outcomes. Participants may in fact have been consuming less fiber and more fat than reported. Information bias may have also influenced experimental participants’ reporting and compliance, given their participation in the focus group follow-up at which they were being assessed. The study’s findings lack generalizability to a larger population with T2DM due to the specific target population—Latinos with T2DM living in MUAs. Limited sample size and the presence of a significant dropout rate may have affected the internal validity of the study. Consequently, the researchers cannot completely exclude significant differences in some variables at baseline, despite being statistically not significant (due to lack of statistical power), or perform multivariate analysis to provide effect size of the intervention. Hence, the investigators recommend that future studies be performed to conduct multivariate analysis and examine the differences in some of the variables at baselines between the 2 groups.
Conclusion
Participating in the post-DSMEP focus group support facilitated participants’ ability to implement and maintain the recommended dietary and self-management behaviors as evidenced by their statistically significant improvement in mean A1C when compared to the control group. These findings are supported by existing research that states that DSMEP when paired with psychological support provided by health-care professionals has significant positive patient outcomes. 28
The adoption of a mostly plant-based, high-fiber, low-fat diet proved challenging for many study participants, as evidenced by participants’ comments in the follow-up focus group discussions. However, results of existing research demonstrate effective solutions to this challenge that merit further investigation with this target population, 5,29-31 as well as other ethnic groups living in MUAs. Dietary habits can be modified if providers, patients, and families are aware of the benefits of the recommended diet and the clients receive the necessary support. 32 The acceptability of a plant-based diet is similar to that of other therapeutic diets, 5 and culturally tailoring foods can enhance patient’s adherence to dietary modifications. 29 Hence, the acceptability of a mainly plant-based diet need not be considered a barrier to diabetes management among Latinos with T2DM living in MUAs. 31
So What? Implications for Health Promotion Practitioners and Researchers
What is already known on this topic?
Consuming a high-fiber, low-fat diet, primarily from plant-based sources, and engaging in physical activity can increase insulin sensitivity and prevent T2DM and related complications as reported in the literature.
What does this article add?
In Latinos with T2DM living in MUAs, follow-up support for 6 months post-DSMEP that focused on a high-fiber, low-fat, plant-based diet and exercise contributed to significantly lowering participants A1C levels.
What are the implications for health promotion practice or research?
Health-care professionals should not only continue to provide DSMEP for their patients with T2DM but also seek ways to increase post-DSMEP support by encouraging them to set goals and join support groups that will hold them accountable. Pairing DSMEP that focuses on a plant-based diet with follow-up support is an acceptable option for obtaining positive outcomes in Latinos with type 2 diabetes living in MUAs. Further investigation with Latinos as well as other ethnic groups living in MUAs is needed.
Footnotes
Declaration of Conflicting Interests
The author(s) declared no potential conflicts of interest with respect to the research, authorship, and/or publication of this article.
Funding
The author(s) disclosed receipt of the following financial support for the research, authorship, and/or publication of this article: This study was funded by the Diabetes Action Research and Education Foundation and Loma Linda University School of Nursing.