
Abstract
Purpose:
This study describes the association between frequency of bicycling for active transportation and modifiable cardiometabolic risk factors in the Minneapolis–Saint Paul (MSP) metropolitan area.
Design:
We conducted an online survey from a convenience sample of likely bicycle commuters.
Setting:
Participants were e-mailed invitations including a link to the online survey.
Participants:
Participants (n = 1450, 15.6% response rate) were residents of the 7-county MSP metropolitan area aged 20 to 64 years.
Measures:
Participants reported frequency of commute and destination cycling from April to September and October to March, prevalent cardiometabolic risk factors, and demographic covariates.
Analysis:
We performed logistic regressions for associations between average weekly transportation bicycling and self-reported prevalent obesity, high blood pressure, high cholesterol, low high-density lipoprotein cholesterol, and high triglycerides. We used Poisson regression for the count of cardiometabolic risk factors. All models were adjusted for age, sex, race, smoking, alcohol consumption, and other physical activity, with random intercepts by zip code.
Results:
Self-reported bicycling frequency is associated with significantly lower odds of prevalent obesity, hypertension, and high triglycerides. Three bicycling trips per week is associated with 20% fewer (95% confidence interval: 12%-28%) cardiometabolic risk factors.
Conclusion:
Bicycling frequency is inversely associated with cardiometabolic risk factors. These results provide empirical support for the promotion of active transportation as public health policy.
Keywords
Purpose
Minnesota and the Minneapolis–Saint Paul (MSP) metropolitan area have been recognized among the top bicycling locations in the United States for both public infrastructure and transportation mode share. 1 -3 To obtain information on bicycling’s contribution to the Minnesota economy, the Minnesota Department of Transportation commissioned a 4-component project assessing (1) the economic impact of the bicycling industry, (2) the economic impact of bicycling events, (3) the magnitude of bicycling infrastructure use, and (4) the health benefits associated with bicycling. This article presents the findings on the health benefits associated with bicycling among MSP area bicycle commuters.
The present study estimates the association between bicycling for active transportation and established risk factors for cardiovascular disease and metabolic syndrome, collectively referred to as cardiometabolic disease. Cardiometabolic diseases are major drivers of health-care spending in Minnesota. 4 According to the latest estimate from the Minnesota Department of Health, 35% of Minnesotans (and 33% of those younger than 65 years) had 1 or more chronic medical conditions in 2012 accounting for 83% of all medical spending that year. 4 In the same year, 8.7% of medical spending in Minnesota was attributable to obesity. 5
Physical activity has a well-established inverse association with mortality and cardiometabolic disease. 6 Exercise is protective against metabolic syndrome 7 and diabetes 8 and reduces the risk of cardiovascular disease by increasing high-density lipoprotein (HDL) cholesterol, lowering resting blood pressure, reducing blood sugar, increasing myocardial oxygen supply, and reducing resting myocardial effort. 6,9
Despite the well-established link between physical activity and cardiometabolic risk, many US adults do not meet physical activity guidelines. 10 Both perceived available time and access to exercise facilities predict spontaneous exercise (ie, not a supervised exercised program). 11 Active transportation, such as walking or cycling, has been promoted as a way of integrating physical activity into daily life. 10,12 Compared to leisure-time exercise, active transportation is more readily integrated into people’s lives because it is at least partially offset by reducing sedentary transportation time. 12
The World Health Organization in 2013 identified 7 prospective studies that examined all-cause mortality in relation to baseline bicycling exposure after accounting for other (noncycling) physical activity. 13 Results from the 7 studies supported a linear relationship between cycling and all-cause mortality, with a 10% reduction in mortality associated with 100 minutes of cycling per week. 13
In addition to reducing risk of mortality, active transportation is associated with reduced morbidity from cardiometabolic disease. Adults who engage in active transportation have lower body mass index (BMI) and waist circumference and reduced odds of hypertension and diabetes, compared to adults who do not engage in active transportation. 14 A study in 6 middle-income countries found significant inverse associations between active transportation and waist circumference, systolic blood pressure, and BMI. 15
Evidence for prevention of cardiometabolic disease by active transportation is not unambiguous, and few studies of active transportation focus exclusively on bicycling. One cohort study found active commuting to be inversely associated with 10-year coronary heart disease (CHD) events among women, but not among men, after adjusting for baseline predicted CHD risk and other physical activity. 16 There have also been few studies conducted specifically in the MSP area. We found a single cross-sectional study in the MSP area, which found bicycling volume associated with greater overall physical activity and lower BMI, but not with self-perceived health. 17 This study did not attempt to measure specific health outcomes.
Methods
Design
A nonexperimental cross-sectional design was used.
Sample
We used data from the Twin Cities Cyclist Survey (TCCS). Twin Cities Cyclist Survey is an online survey conducted among a convenience sample of MSP metro area adults with a high probability of bicycle commuting. Twin Cities Cyclist Survey was designed to examine cycling volume, other physical activity, and cardiometabolic risk factors.
In order to select participants who are representative of the bicycle commuting population, only participants aged 20 to 64 years with residence in the 7-county MSP metro area were eligible for inclusion. Invitations to participate in TCCS were sent to the membership lists for the University of Minnesota Zap!, a bicycle commuter program; Saint Paul Smart Trips and Move Minneapolis, 2 sustainable transportation organizations; and employees of Quality Bicycle Products, a national bicycling products distributor located in Bloomington, Minnesota. Data collection occurred in August and September, 2015.
Measures
Outcomes
The outcomes of interest for this analysis were self-reported prevalent obesity, hypertension, high total cholesterol, low HDL cholesterol, high blood triglycerides, and diabetes. Participants were asked to provide their height and weight, from which BMI was calculated. Body mass index of 30 or greater was classified as obese. Participants were also asked whether they had ever been told by a doctor that they have any of the indicated cardiometabolic risk factors. These risk factors were chosen based on their importance in the Framingham Risk Score (FRS) and National Heart, Lung and Blood Institute (NHLBI) definition of metabolic syndrome. 18,19
The FRS predicts 10-year risk of CHD based on age, sex, smoking status, total cholesterol, HDL cholesterol, and systolic blood pressure, along with risk factors not modifiable by physical activity (age, sex, and smoking status). 18 The NHLBI definition of metabolic syndrome includes 3 or more of the following: abdominal obesity, high blood triglycerides, high blood pressure, low HDL cholesterol, and high fasting blood glucose. 19 This study uses clinical obesity instead of abdominal obesity and diagnosed diabetes instead of high blood glucose.
The risk factors were treated as binary variables in all models. Due to interactive effects of risk factors in determining cardiometabolic risk, we also modeled the total number of risk factors each person reported as a count variable.
Bicycling frequency
The main exposure of interest was frequency of bicycling trips to work and to destinations other than work for which the person substituted a bicycling trip for a driving trip. For each type of trip, the TCCS questionnaire asked: during the warm weather months, from April to September, and during the cold weather months, from October to March, how many days each week do you take this type of bicycling trip. From these questions, a bicycling frequency per week was constructed for each mode by averaging the number of bicycle trip-days per week for warm and cold weather months, for a maximum of 14 bicycle trip-days per week (1 commute trip and 1 nonwork trip per day).
We treated bicycling frequency as a continuous variable with a hypothesized linear relationship with chronic disease. All coefficients are reported as 3 trips per week increments. This increment was chosen to represent the amount of cycling a person could reasonably be expected to conduct. This increment is roughly consistent with other presentations of active transportation; the World Health Organization uses a 100-minute per week increment, 10 which is consistent with an assumption of three 30-minute trips.
Physical activity covariate
To isolate the effect of active transportation by bicycling from the effect of total physical activity, we adjusted each model for total noncycling physical activity. Noncycling physical activity was collected using a modified version of the Godin Leisure-Time Physical Activity questionnaire, designed to provide a measure of how strenuously and how often the participant engages in strenuous, moderate, and mild exercise, other than bicycling, for more than 15 minutes each week. 20 We chose the Godin questionnaire for its ease of use by the participant and because it has consistently been assessed to be both a reliable and valid measurement of participant exercise frequency and intensity. 21
Exercise was converted to metabolic equivalent of task (MET) scores using 9 METs for strenuous exercise, 5 METs for moderate exercise, and 3 METs for mild exercise as directed by the Godin questionnaire. 20 Noncycling exercise METs were summed and a single continuous value assigned to each individual.
Information was collected on leisure time (nontransportation) bicycling. However, we judged that the TCCS questionnaire did not adequately distinguish between nontransportation bicycling and bicycling for transportation, our main exposure. As a result, we did not adjust for nontransportation bicycling.
Demographic covariates
We adjusted for gender and race (non-Hispanic white, other) as binary variables, and age as a quadratic term, in all models. We included the quadratic term for age because of a hypothesized exponential association between age and cardiometabolic disease between ages 20 and 64 years. We accounted for geographic clustering of exposure and outcome variables by including random intercepts by zip code.
Health-related covariates
We adjusted for 2 health-related covariates: self-reported number of alcoholic drinks consumed per week, as a quadratic term, and smoking status (current smoker or current nonsmoker) as a binary term. We included the quadratic term for alcohol intake because of a hypothesized J-shaped association between alcohol intake and cardiometabolic disease.
Analysis
We constructed all models as generalized linear mixed models using PROC GLIMMIX in SAS version 9.4. We modeled each risk factor using a binomial distribution and logistic link. The count of risk factors was modeled using a Poisson distribution and log link. The models are adjusted as described above for age, race, gender, smoking status, alcohol consumption, and other noncycling physical activity. Random intercepts by zip code were included to account for potential geographic clustering of health risks and cycling behavior, with classical sandwich covariance estimation. Analyses were considered significant using P < .05.
Results
Sample
A flow diagram illustrating recruitment and analysis is shown in Figure 1. From 11 373 invited participants, TCCS collected 1771 completed surveys. Informed consent was obtained by requiring participant assent prior to initiation of the online survey. A total of 161 completed surveys were excluded because the participant reported an ineligible age, ineligible county of residence, or was missing information to assess eligibility. This left 1610 completed surveys from eligible participants.
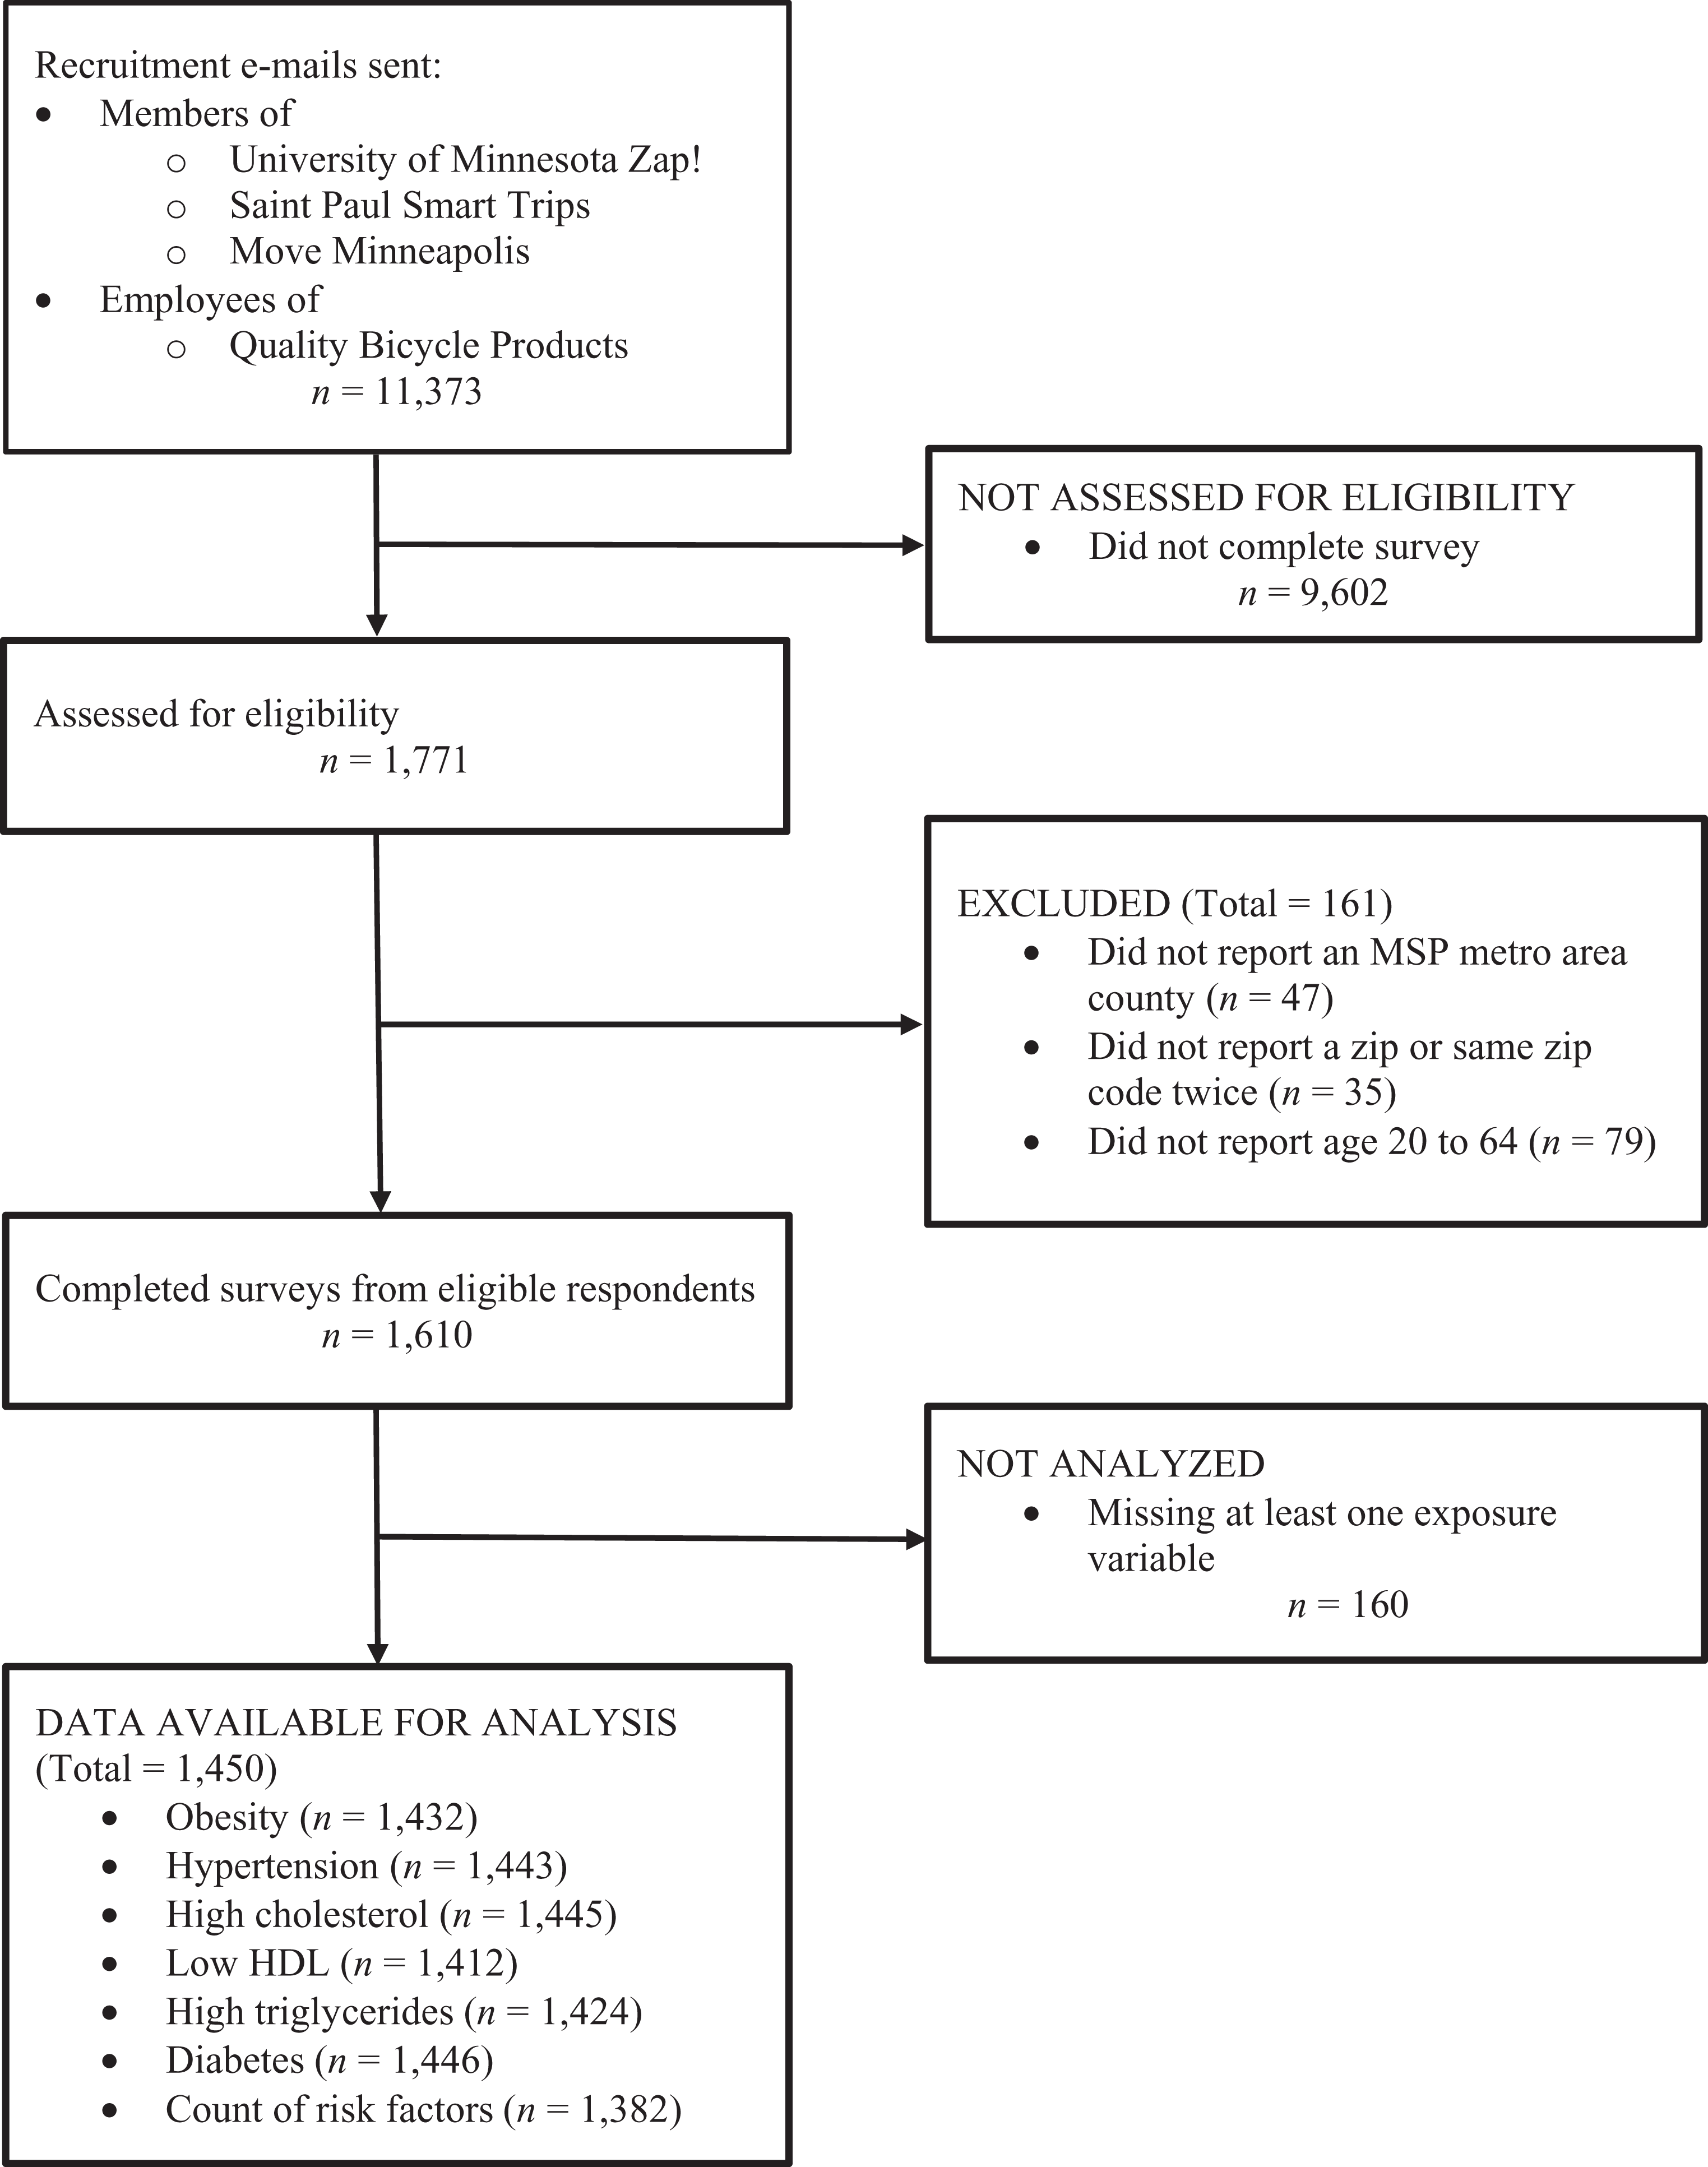
Flow diagram of participant recruitment and analysis.
Of the eligible surveys, 160 (9.9%) were missing at least 1 exposure response. These cases were excluded from analysis for a final sample of 1450. The demographics of the eligible participants and final sample are shown in Table 1, along with similar descriptive statistics for the eligible population from the 2014 American Community Survey (ACS). 22
Characteristics of All Eligible Participants Compared to Participants With No Missing Data.a
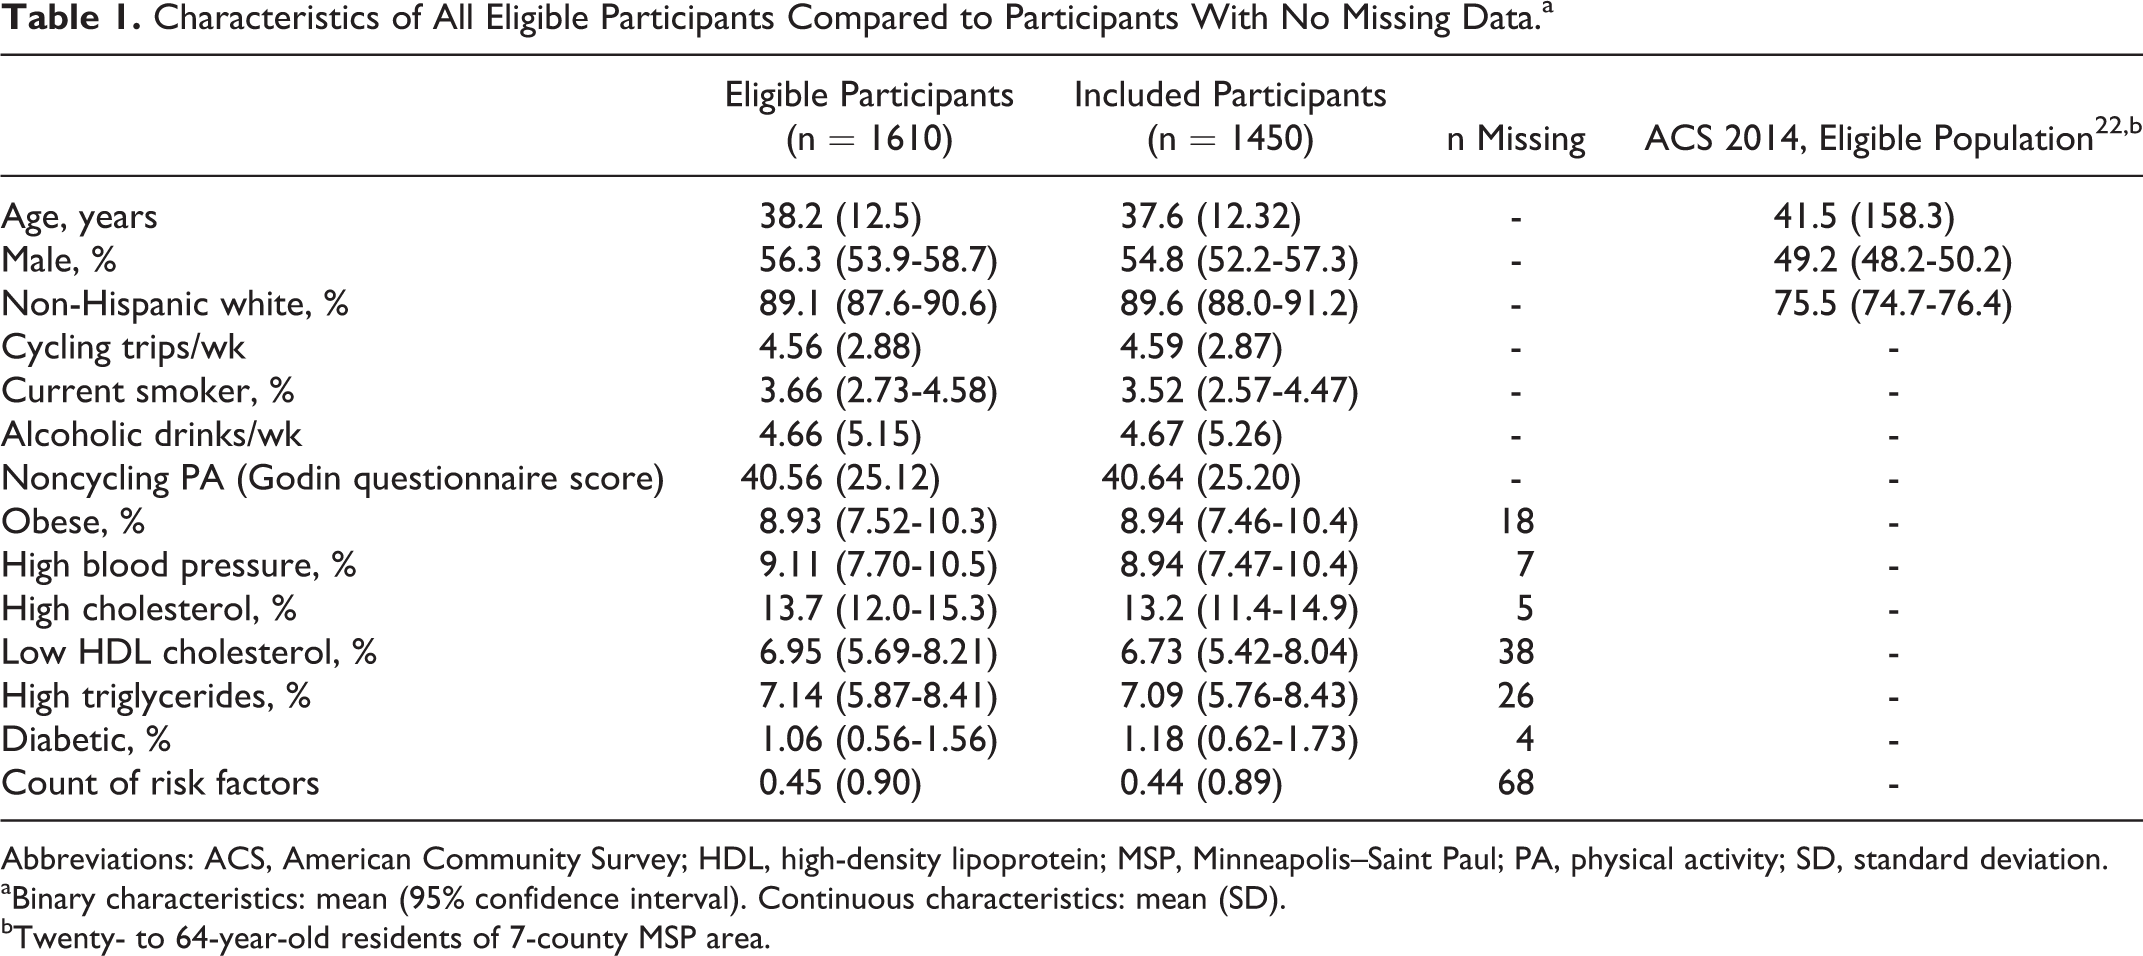
Abbreviations: ACS, American Community Survey; HDL, high-density lipoprotein; MSP, Minneapolis–Saint Paul; PA, physical activity; SD, standard deviation.
aBinary characteristics: mean (95% confidence interval). Continuous characteristics: mean (SD).
bTwenty- to 64-year-old residents of 7-county MSP area.
There were no statistically significant or material differences between those with complete and partial responses for demographics, physical activity, or outcomes. In order to minimize the average number of exclusions, the final sample used for each model was allowed to float due to missing or unknown outcomes, with sample sizes ranging from 1382 (count of risk factors; all outcomes complete) to 1446 (prevalent diabetes).
Respondents were younger, more likely to be male, and more likely to be non-Hispanic white than the 20- to 64-year old population of the MSP area as measured in the ACS. 22 As respondents were selected from a high-bicycling pool, this is consistent with hypotheses that bicycling is associated with age, gender, and race/ethnicity.
Outcomes
For these models, we examined the association of 3 bicycling transportation trips per week with self-reported prevalent obesity, hypertension, high cholesterol, low HDL cholesterol, high triglycerides, diabetes, and the count of risk factors. The unadjusted and adjusted prevalence odds ratios for each cardiometabolic risk factor and the prevalence ratio for the count of risk factors are shown in Table 2.
Coefficients for Cardiometabolic Risk Factors Per 3 Bicycle Trip Per Week Increment.
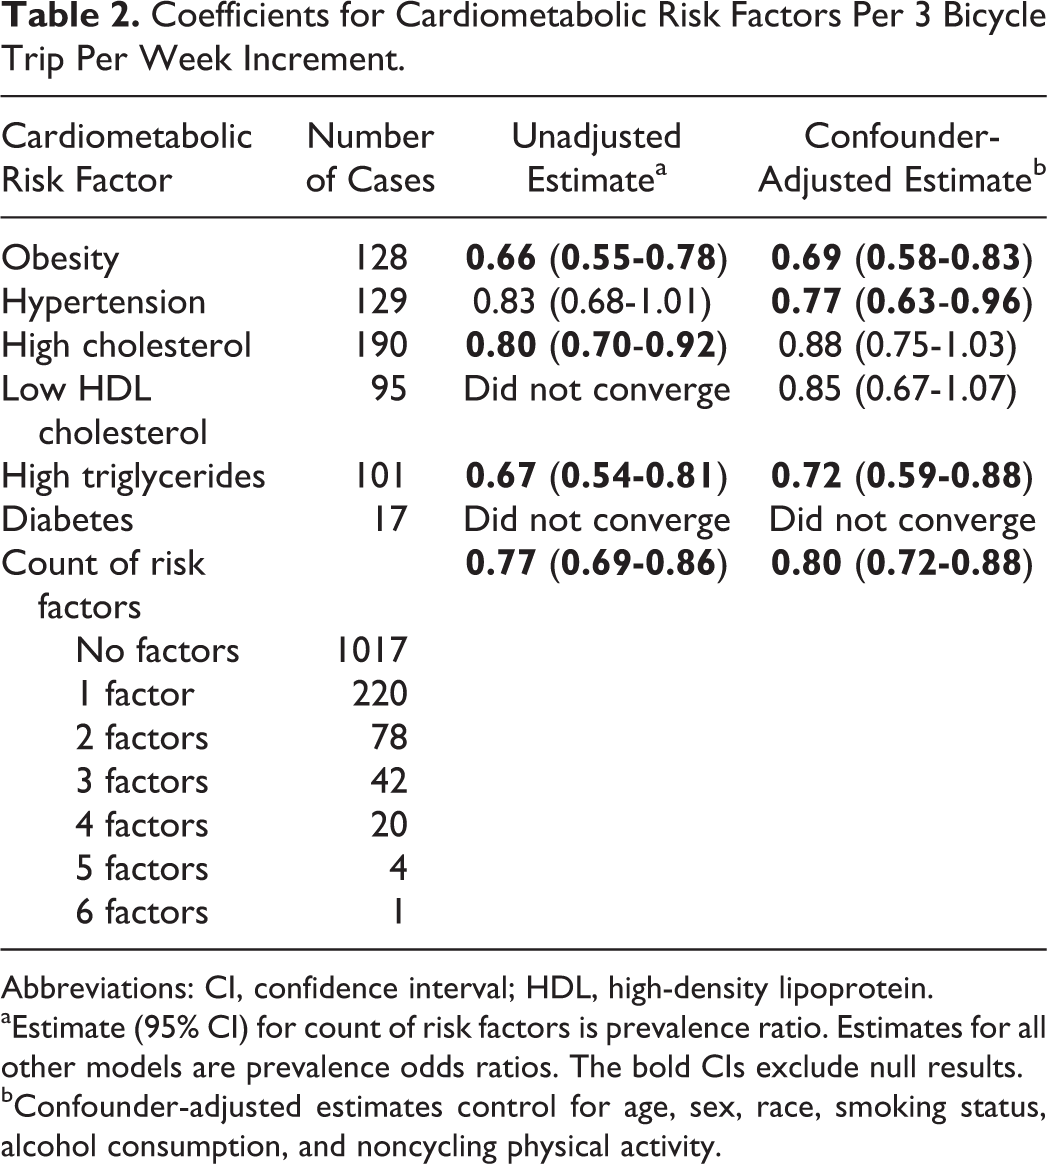
Abbreviations: CI, confidence interval; HDL, high-density lipoprotein.
aEstimate (95% CI) for count of risk factors is prevalence ratio. Estimates for all other models are prevalence odds ratios. The bold CIs exclude null results.
bConfounder-adjusted estimates control for age, sex, race, smoking status, alcohol consumption, and noncycling physical activity.
We found bicycling frequency to be significantly inversely associated with prevalent self-reported obesity, hypertension, high blood triglycerides, and the count of prevalent risk factors, after adjusting for the identified confounders. Both models for diabetes and the unadjusted model for low HDL cholesterol did not converge, likely attributable to the small number of cases. Each 3 trips per week increment is associated with 31% lower odds of obesity (adjusted odds ratio [AOR], P < .001, 95% confidence interval [CI]: 0.58-0.83), 23% lower odds of hypertension (AOR, P = .02, 95% CI: 0.63-0.96), 28% lower odds of high triglycerides (AOR, P = .001, 95% CI: 0.59-0.88), and 20% fewer prevalent risk factors (APR, P < .001, 95% CI: 0.72-0.88).
Confounding factors accounted for a substantial portion of the unadjusted association between bicycling frequency and risk factors. Unadjusted estimates for obesity, high cholesterol, high triglycerides, and risk factor count were 12% to 40% more extreme than adjusted estimates; the unadjusted estimate for hypertension was 39% less extreme than the adjusted estimate.
Males had significantly greater prevalent cardiometabolic disease burden than females. Every cardiometabolic risk factor was more prevalent in males than in females. The total count of risk factors was 86% greater for men than for women (APR, P < .001, 95% CI: 1.53-2.28). Unlike the longitudinal study conducted by Hu et al, 16 we found no evidence that the association between bicycling frequency and overall prevalent cardiometabolic disease differs by sex.
Discussion
Inadequate physical activity is one factor contributing to the prevalence of chronic diseases that drive much of medical spending. Active transportation by bicycling or walking is one way to overcome perceived barriers to physical activity such as lack of time or access to exercise facilities, allowing more people to meet physical activity guidelines. This study was conducted to quantify the association between bicycling for transportation and cardiometabolic risk factors in the Twin Cities metro area.
We found that each increment of 3 bicycle trips per week is associated with lower odds of prevalent obesity, hypertension, and high triglycerides, and a 20% reduction in prevalent risk factors. These findings suggest that promotion of active transportation is a practical venue for using public policy to limit growth of cardiometabolic disease and its attendant medical spending.
Strengths and Limitations
This study presents a large and demographically inclusive sample of MSP area bicyclists, providing a unique look at the association between bicycling and health in a specific geographic area. Although the bicyclists included in the sample are somewhat younger, more male, and less racially diverse than the Twin Cities working-age population as a whole, TCCS includes substantial numbers of older, female, and racial–ethnic minority respondents. Findings may be more generalizable to subpopulations with a higher than average level of bicycling than to the population as a whole. However, given the potential biases and limitations described below, this article should be regarded as a description of prevalent risk among MSP area bicycle commuters rather than a prediction of how greater active commuting would affect population risk.
As with any cross-sectional study, caution should be taken not to interpret associations as etiologic findings. First, temporal bias is likely to affect results, as this study measures current exposures while asking if the person has ever had the outcome. The effect of this bias is uncertain. If persons who become ill begin bicycling less often due to their illness, the resulting associations between bicycling and disease risk would be inflated. On the other hand, if persons with high cardiometabolic risk attempt to reduce it by bicycling, this could lead to a reverse causal relationship.
Twin Cities Cyclist Survey is also likely subject to healthy participant bias and healthy worker effect. Participants were recruited from commuting organizations and so represent a healthier population than the full population, which includes persons too sick to work. Because the TCCS population as a whole is likely healthier than the general population, noncyclists in the TCCS population are likely healthier than noncyclists in the full population. This bias would likely lead to more conservative observed associations between bicycling and prevalent cardiometabolic risk.
An additional potential source of bias is the nonrandom convenience sample of identified cyclists. We attempt to control for systematic differences between more and less frequent cyclists in our population by adjustment for predicted confounders and inclusion of random intercepts by zip code. We do not adjust any analyses by BMI, which is a potential independent predictor of both cycling and health status, because BMI is also on the hypothesized causal pathway between cycling and these cardiometabolic risk factors and because obesity is an independent outcome.
Finally, the TCCS estimate of bicycling frequency was self-reported and not objectively measured. Responses reflect the person’s intention to engage in a behavior and are likely influenced by social desirability bias. 23 Although the validity of the instrument used to measure bicycling frequency has not been assessed, many physical activity self-reported instruments have been found to be reliable with high test–retest correlations. 23 Greater self-reported bicycling frequencies likely reflect greater relative volumes, but few studies have examined the absolute validity of self-reported physical activity. 23 This may affect the magnitude and precision of coefficients but is unlikely to produce spurious associations.
Interpretation
This is the first study to attempt to estimate the association of bicycling with prevalent cardiometabolic risk in the Twin Cities metropolitan area. We found that greater bicycling frequencies are associated with lower prevalent cardiometabolic risk after adjusting for other factors that contribute to the difference in prevalent chronic disease.
These results are consistent with numerous studies finding a causal pathway or association between physical activity and chronic disease or mortality. 6 -9,12 -18 Furie and Desai’s analysis of National Health and Nutrition Examination Survey (NHANES) data found that moderate (below 150 minutes per week) active transportation is associated with 24% lower odds of doctor-diagnosed hypertension (95% CI: 0.61-0.94) and 23% lower odds of doctor-diagnosed diabetes (95% CI: 0.58-1.02). 14 We find similar reductions, with 23% lower odds of self-reported prevalent hypertension (95% CI: 0.66-0.95) and 20% fewer average cardiometabolic risk factors (95% CI: 0.72-0.87) associated with 3 bicycle trips per week in the TCCS sample. Furie and Desai also found significant inverse associations between active transportation and both BMI and waist circumference. 14 We found each 3-trip increment to be associated with 31% lower odds of self-reported prevalent obesity (95% CI: 0.58-0.83) in the TCCS sample.
Active transportation such as bicycle commuting allows a substantial number of people to integrate physical activity into their daily routine. Increasing the proportion of trips made by bicycling and increasing policies for access and availability of physical activity in the built environment are objectives of Healthy People 2020. 10 These objectives point policymakers toward bicycle infrastructure and bicycling promotion but leave unanswered the question of whether these investment yields returns to public health.
Although this study cannot answer the question of whether transportation bicycling improves population health, the results suggest that the association between bicycling and cardiometabolic risk is robust to potentially confounding factors. Future directions for research include the question of whether transportation policy can convert noncyclists into cyclists. One potential avenue could be a cluster randomized trial assessing whether bicycling promotion can impact relevant biomarkers. Such a trial could provide more definitive findings of the potential health improvement from bicycling.
So What? Implications for Health Promotion Practitioners and Researchers
Participants who bicycle more frequently have significantly lower odds of obesity, hypertension, and high triglycerides, and significantly fewer total cardiometabolic risk factors.
What is already known on this topic?
Cardiometabolic diseases are preventable through physical activity. Several studies have found inverse associations between active transportation and cardiometabolic morbidity.
What does this article add?
This study provides a large sample from the Minneapolis–Saint Paul (MSP) metropolitan area, a top bicycling location in the United States. Unlike most active transportation studies, this article focuses exclusively on bicycling.
What are the implications for health promotion practice or research?
Active transportation such as bicycling or walking has been promoted because it replaces sedentary time with physical activity. We find a robust association between bicycling and lower prevalent cardiometabolic risk, in a community in which bicycling is heavily promoted. Future work should help health promotion practitioners consider whether transportation policy can convert noncyclists into cyclists.
Footnotes
Declaration of Conflicting Interests
The author(s) declared no potential conflicts of interest with respect to the research, authorship, and/or publication of this article.
Funding
The author(s) disclosed receipt of the following financial support for the research, authorship, and/or publication of this article: Minnesota Department of Transportation, NS-326.