
Abstract
Purpose:
To describe the presence of licensed tobacco retailers (LTRs), cigarette advertisements, price-reducing promotions, and compliance with tobacco control policies in New York State from 2004 to 2015 and to discuss implications and lessons learned from 11 years of experience conducting LTR surveys.
Design:
Annual surveys of tobacco advertising from cross-sectional, stratified random samples of LTRs in New York State from 2004 to 2015 were conducted by professional data collectors. Data for 2013 were unavailable as the survey was not fielded in that year.
Setting:
New York State.
Participants:
Licensed tobacco retailers, which are stores licensed to sell tobacco in the state of New York. Between 3.6% (n = 800) and 19.7% (n = 3945) of all LTRs were sampled annually.
Measures:
The presence and number of cigarette advertisements and the presence of price-reducing promotions, required age-of-sale signage, and self-service tobacco displays were documented.
Analysis:
We tested for significant differences between 2014 and 2015 and significant trends overall and by outlet type. We used logistic regression for binary outcomes and Poisson regression for count variables.
Results:
The number of LTRs in New York State decreased 22.9% from 2004 (n = 25 740) to 2015 (n = 19 855). The prevalence and number of cigarette advertisements and the prevalence of cigarette price-reducing promotions decreased significantly over time. Compliance with posting required age-of-sale signs increased significantly from 2004 to 2015 and from 2014 to 2015. Compliance with the ban on self-service tobacco displays was consistently near 100%.
Conclusion:
The tobacco retail environment in New York State improved substantially from 2004 to 2015. The implications of these findings for youth and adult smoking and the associated social costs are unknown; however, decreases in pro-tobacco marketing, decreases in the number of LTRs, and improvements in compliance are likely to have positive impacts on youth and adult smoking outcomes, such as reduced initiation and increased cessation, given previous research findings.
Purpose
The 1998 Master Settlement Agreement (MSA) between 46 US states and the tobacco industry changed the landscape of tobacco advertising. The MSA eliminated transit advertisements and billboards, prohibited the use of cartoon characters and branded merchandise, restricted sponsorships for sporting events and concerts, and reaffirmed existing prohibitions on tobacco advertising in movies and on television. 1 However, the MSA did not address tobacco advertising and promotion at retailers, and tobacco industry spending on advertising and promotions in the US retail environment increased from $5.3 billion in 1998 to $8.9 billion in 2013. 2 In 2013, tobacco industry spending included $7.6 billion for price discounts to reduce the price of cigarettes, $688.5 million for promotional allowances, $248.8 million for coupons, and $55.7 million for point-of-sale (POS) advertising. 2
Tobacco marketing is widespread in the United States. 3 –6 Tobacco advertising and promotion at the POS are associated with adolescent smoking initiation, 7,8 current youth smoking, 9 relapse among former smokers, 10 and unplanned cigarette purchases. 11 Point-of-sale advertising is more common in low-income and minority neighborhoods, 4,12 in stores near schools, 3 and in stores frequented more often by adolescents. 13
State and local policy initiatives could change the tobacco POS environment by reducing or eliminating exposure to retail tobacco advertising and promotions. New York State (NYS) has conducted the Retail Advertising of Tobacco Survey (NY-RATS), a store audit of licensed tobacco retailers (LTRs), since 2004. The NY-RATS provides data on the retail environment in NYS to raise awareness of tobacco’s influence at the POS and provides partners, policy makers, and others with information useful in advocating for change in tobacco retail environments. We present results from NY-RATS from 2004 to 2015.
Methods
Design
Annually, from 2004 to 2015 (excluding 2013, as no survey was conducted in this year), the New York Tobacco Control Program sponsored NY-RATS, a store audit of LTRs in NYS. Sample sizes for NY-RATS ranged from 3.6% (n = 800) to 19.7% (n = 3945) of all LTRs. For all years, NY-RATS was designed as stratified random samples and was pulled from the most recent LTR list available. Annual sample sizes by outlet type are presented in Table A1.
Between 2004 and 2011, the design was stratified by outlet type and 8 geographic areas using county identifiers from the LTR list (ie, Buffalo, Hudson Valley, North Capital, North Central, New York City [NYC]–Long Island, Rochester, South Capital, and South Central). In 2012, the design was stratified by outlet type, the 8 geographic areas, and proximity to a school. In 2014 and 2015, the design was stratified by outlet type and 2 geographic areas (NYC and the rest of NYS). Survey weights were calculated each year, which accounted for the sample design and allowed for the calculation of state representative estimates, comparisons across outlet type and geographic strata, and time trends.
Each year, RTI created training materials to train data collectors on identifying and gathering the desired tobacco advertising information. The data collectors visited each sampled LTR and completed the survey instrument unobtrusively. Data were collected using a paper survey instrument from 2004 to 2011 and using electronic tablets from 2012 to 2015. Data collection was conducted by a professional data collection agency in all years. In 2005 and 2006, data collection was also supported by NYS community-based partners. 14
The survey instrument and accompanying trainings were revised annually to incorporate lessons learned. Collecting reliable retail audit data is critically dependent on the training and experience of the data collection staff. Every year of the NY-RATS, RTI staff conducted multiday classroom and field training sessions for all data collection staff. Measurement of some items on the NY-RATS notably improved as a result of wording changes, the training protocol, or both. In some cases, veteran data collection staff suggested changes that improved the quality of training and data collection. We were fortunate to retain experienced, professional data collectors who in many cases had conducted hundreds of retail audits, making it possible to develop, test, and reliably collect data, such as counting the number of cigarette advertisements inside a store, obtaining detailed price and promotion information, and assessing multiple aspects of the power wall, which are inherently difficult to measure. Our experience highlights the importance of working closely with trained, professional data collectors to obtain the highest quality retail audit data possible.
Sample
The NYS Department of Tax and Finance maintains a list of LTRs. Each year since 2004, RTI has obtained a list of active LTRs in NYS for use in retail density and survey efforts. Stores with PO Box addresses were excluded and accounted for less than 4.0% of LTRs annually. Each year, online searches were used to classify retailers by outlet type (convenience with gas, convenience only, pharmacy, large grocery, small grocery, mass merchandiser, tobacco specialty shop, and “other”).
Measures
The NY-RATS collected a wide range of information on POS tobacco marketing in LTRs. However, because the survey instrument evolved over time, we present results only for outcomes available in all survey years.
“Advertisements” were defined as anything that replicated the logo, tag line, or branding of a cigarette product. Exterior advertisements included posters, signs, banners, and decals located on windows, doors, sidewalks, gas pumps, light posts, fences, and walls and functional items (eg, branded door mats, push/pull, and open/closed signs). Interior advertisements included posters, signs, banners, and decals; displays; temporary stocking locations; and functional items (eg, clocks, trash cans). Cigarette packs and cartons were not counted as advertisements. We combined the presence of exterior and interior advertisements into a single measure and did the same for the number of exterior and interior advertisements. The average number of advertisements included all LTRs and was not limited to those with 1 or more advertisements. The presence of advertisements was available for all years; however, the number of advertisements was unavailable in 2015.
“Price-reducing promotions” were defined as advertisements that communicated the availability of a temporarily reduced price for cigarettes. Terms used to identify price-reducing promotions included “reduced price,” “special offer,” “special price,” “sale,” “lower price,” “bundled,” and “introductory offer.” An example price promotion is “$3.29 per pack when you buy 2 packs.” Manufacturers’ coupons attached to packs and mail-in rebates were also considered price-reducing promotions. Data collectors reported whether any price-reducing promotions for cigarettes were present at each retailer. Between 2004 and 2012, the presence of price-reducing promotions for Marlboro, Newport, and Doral was recorded. However, in 2014 and 2015, price-reducing promotions for any cigarette variety were recorded. Because of the measurement change, we focused on the presence of price-reducing promotions in 2014 and 2015.
Both NYS and NYC require LTRs to post signage, stating the minimum legal age to purchase tobacco products. The instrument was updated annually to reflect the current year’s required text for the age-of-sale sign, accounting for differences between NYS and NYC. We defined an indicator measuring whether retailers complied with posting the age-of-sale sign (ie, surveyors noted “yes” for the posted age-of-sale sign).
Self-service tobacco displays allow customers to access tobacco products without assistance from the clerk. New York state law requires tobacco products to be located out of consumers’ reach, behind counters, or in locked cabinets. Self-service displays are prohibited. Additionally, the 2009 federal Family Smoking Prevention and Tobacco Control Act restricts vending machines, a type of self-service display, to adult-only facilities. A box of cigars at the checkout counter that the customer can access is an example of self-service tobacco. When inside the store, data collectors noted whether any tobacco products were available by self-service to customers.
Analyses
The data consist of pooled annual cross-sections of tobacco outlets. For each measure, we examined differences over time for all outlets combined and stratified by outlet type. Due to the disparate nature of “other” retailers (eg, gift shops, book stores, coffee shops, newsstands, restaurants, bars), we omitted these estimates from the results. For each measure, we tested for statistically significant differences between 2014 and 2015 and for statistically significant upward or downward linear trends from 2004 to 2015. We used logistic regression for binary outcomes (presence of cigarette advertisements, price-reducing promotions, age-of-sale signage, and self-service displays) and Poisson regression for the number of cigarette advertisements. The models controlled for linear trend and outlet type using indicators for each outlet relative to convenience/gas retailers. Significance tests were computed using adjusted Wald tests that account for the complex survey design, using a P value less than .05 to determine significance. 15 Convenience stores with gas, convenience stores without gas, and gas stations were combined for this analysis.
Results
The number of LTRs decreased 22.9% from 2004 (25 740) through 2015 (19 855; Figure 1). This decrease occurred primarily between 2004 and 2010, with little change between 2010 and 2013. The number of LTRs increased 13.3% between 2013 (19 534) and 2014 (22 130), but remained lower than the 2004 LTR level and decreased again in 2015 (19 855). In all years, small grocers were the most common LTR, accounting for approximately 40% of retailers in the state. Convenience and convenience/gas accounted for 20% to 25%, followed by pharmacies (8%), large grocers (3%), tobacco specialty (2%), and mass merchandisers (1%). Although “other” retailers accounted for 20% to 30% of LTRs, this group is so diverse that we focus our results on the remaining categories. Data from the 2015 NY-RATS showed that 95.7% of LTRs sold cigarettes, and a majority also sold cigars (82.7%), e-cigarettes (67.6%), and smokeless tobacco (43.9%).
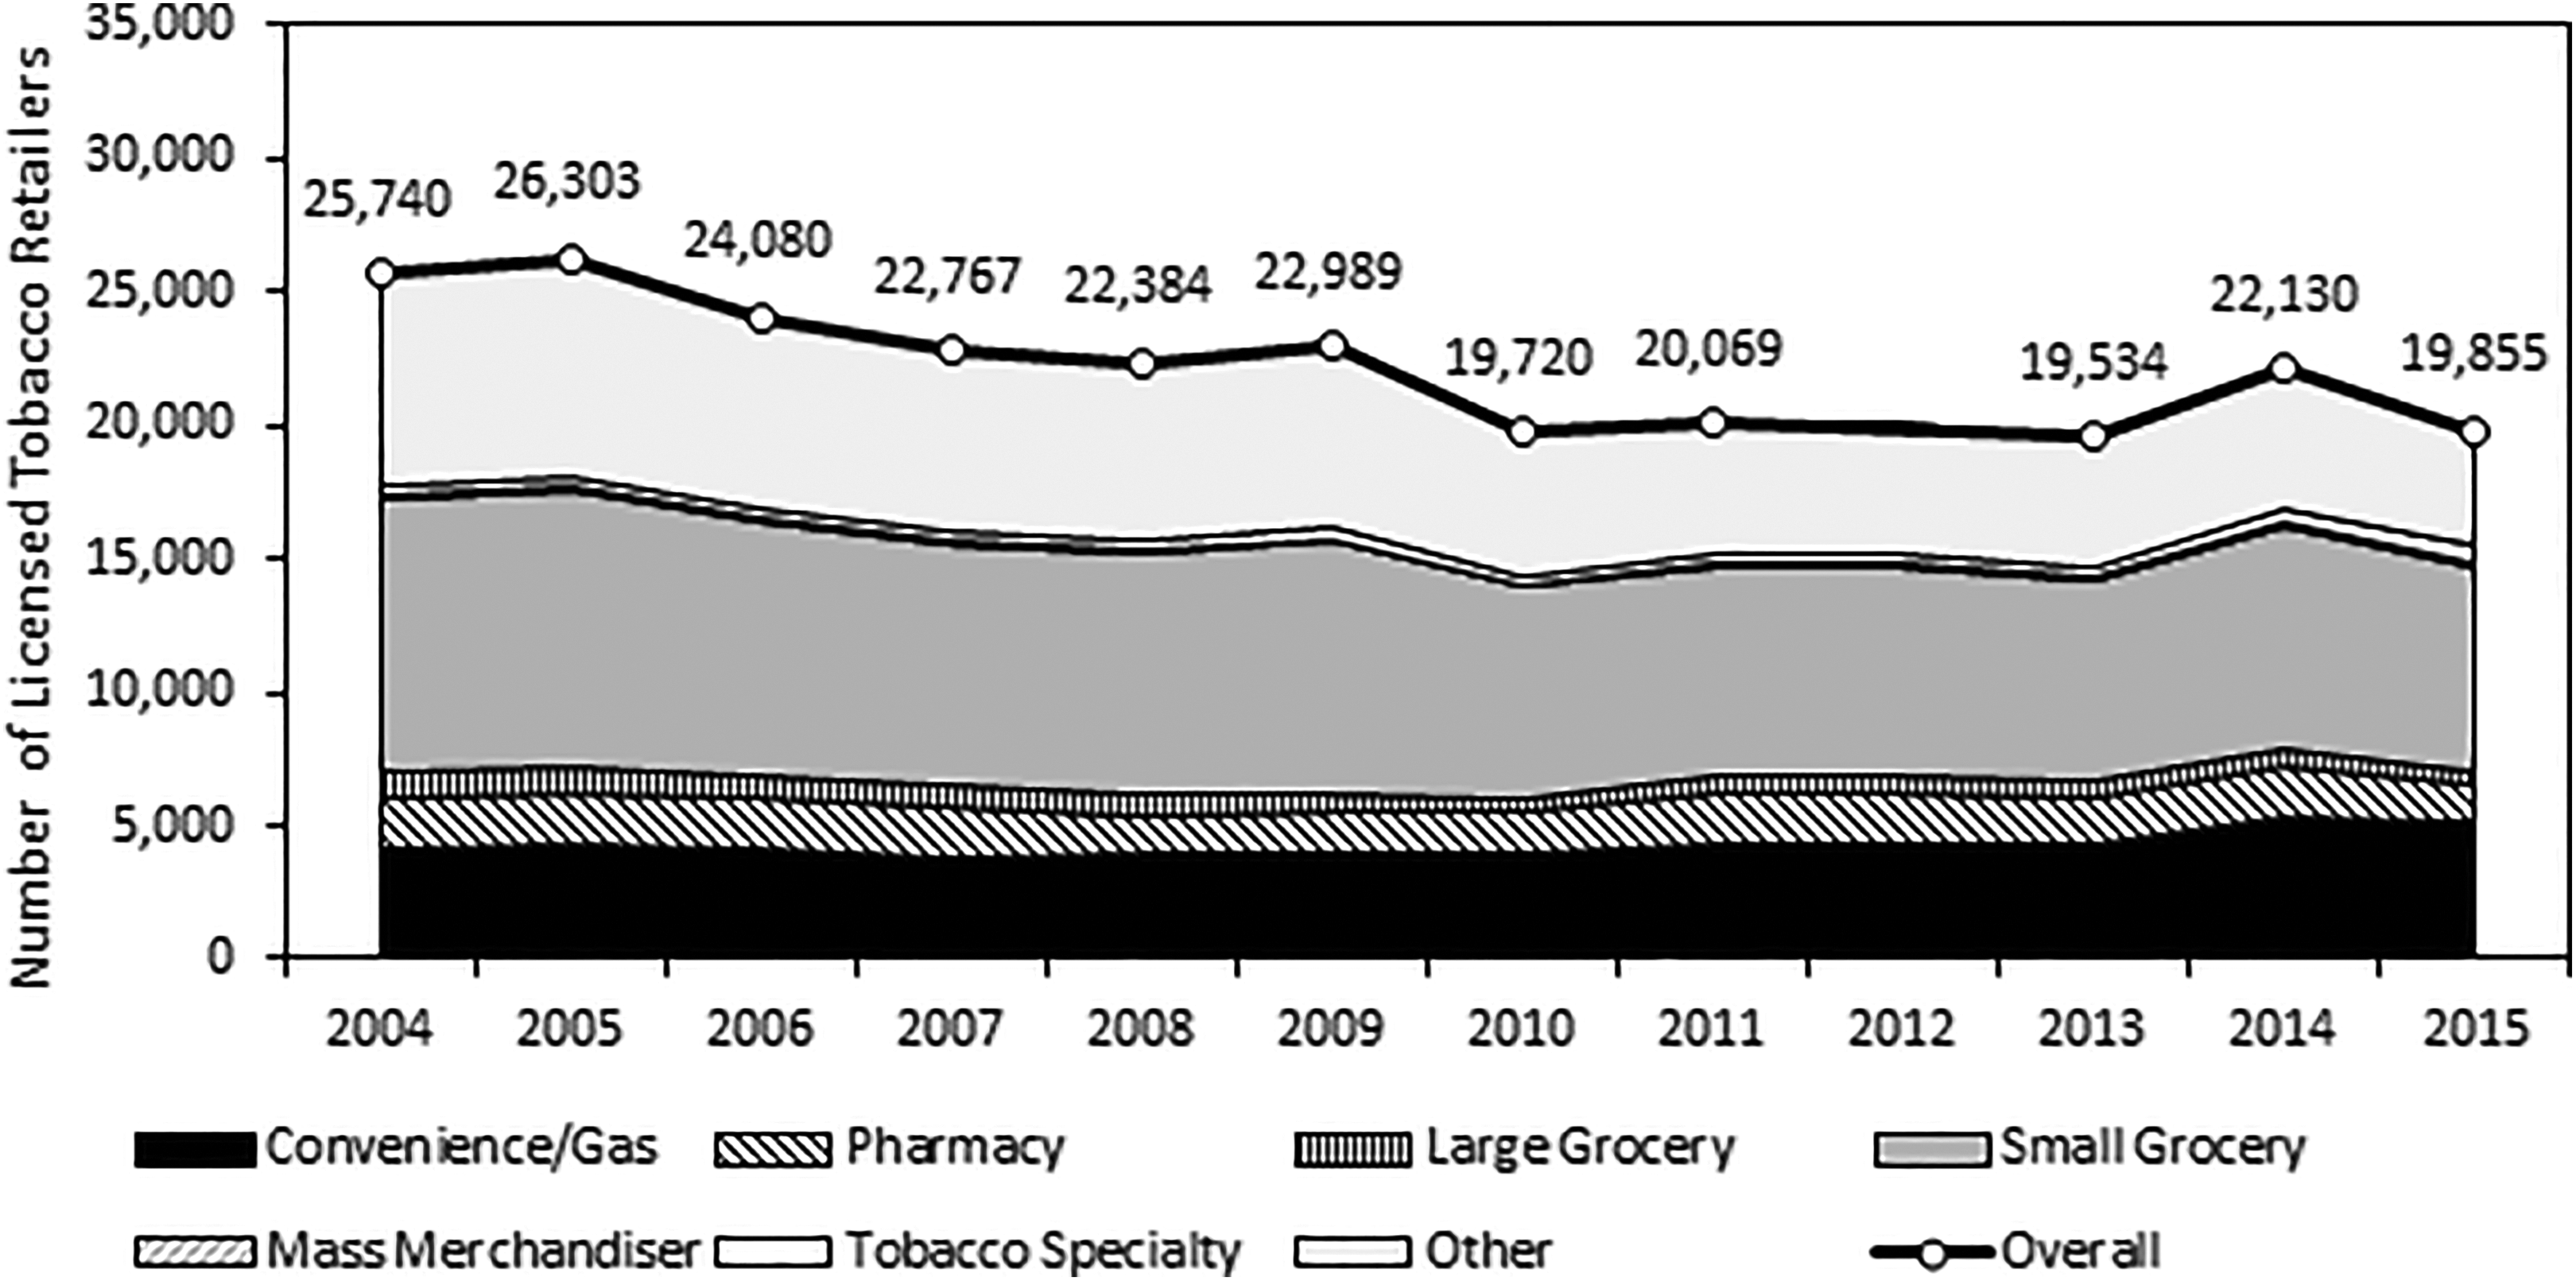
Number of licensed tobacco retailers in New York, 2004 to 2015. Adapted from Department of Taxation and Finance unpublished raw data.
Table 1 presents prevalence and average number of cigarette advertisements by year and outlet type. Overall, the prevalence of LTRs with at least 1 cigarette advertisement decreased significantly from 2014 (84.2%) through 2015 (75.2%; P < .001) and trended downward significantly across the period (odds ratio, OR = 0.81 P < .001). There was also a significant downward trend in the average number of advertisements per LTR (b = −0.03, P < .001). Across the period, the average number of cigarette advertisements increased from 15.0 advertisements in 2004 to a peak of 21.2 advertisements in 2008 and then decreased through 2014 (13.7 advertisements). In convenience stores, the prevalence of retailers with any cigarette advertising decreased, but the average number of cigarette advertisements per store increased. Large grocers experienced decreases in the average number of advertisements per store, but the prevalence of stores with advertisements did not change.
Prevalence and Average Number of Cigarette Advertisements by Year and Outlet Type, NY-RATS 2004 to 2012 and 2014 to 2015.a,b
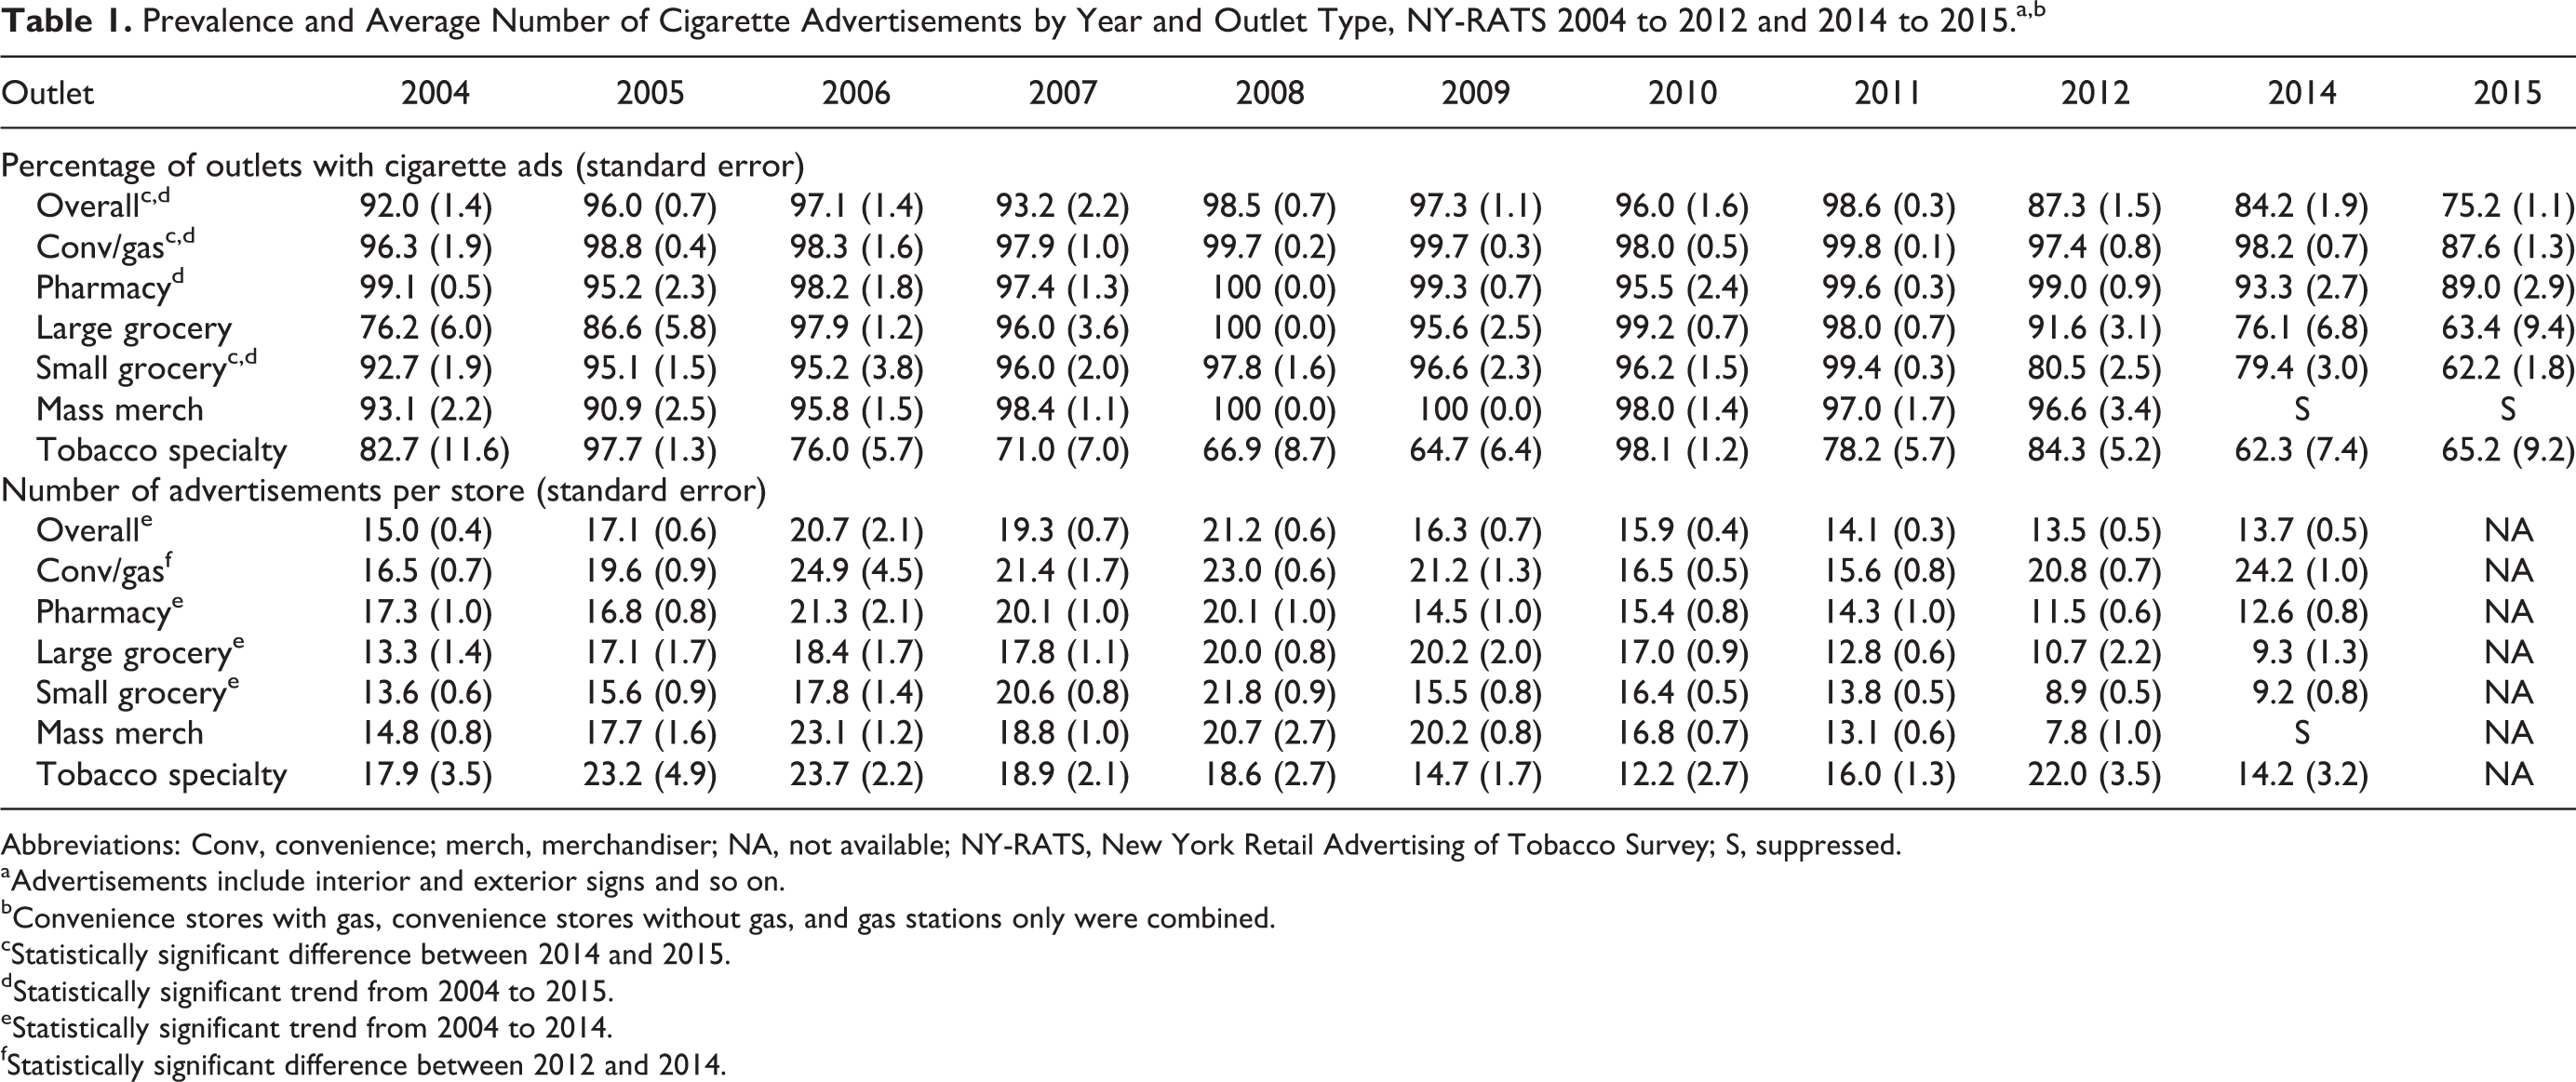
Abbreviations: Conv, convenience; merch, merchandiser; NA, not available; NY-RATS, New York Retail Advertising of Tobacco Survey; S, suppressed.
aAdvertisements include interior and exterior signs and so on.
bConvenience stores with gas, convenience stores without gas, and gas stations only were combined.
cStatistically significant difference between 2014 and 2015.
dStatistically significant trend from 2004 to 2015.
eStatistically significant trend from 2004 to 2014.
fStatistically significant difference between 2012 and 2014.
Analysis of price-reducing promotions was limited to 2014 and 2015. The presence of at least 1 price promotion decreased from 2014 (45.2%) through 2015 (24.3%; P < .001; Table 2). Significant decreases were seen in convenience/gas, pharmacies, and small grocers. Almost 65% of convenience/gas stores and pharmacies had at least 1 price promotion in 2014 compared to approximately 40% in 2015.
Prevalence of Price Reducing Promotions for Cigarettes by Year and Outlet Type, NY-RATS 2014 to 2015.a
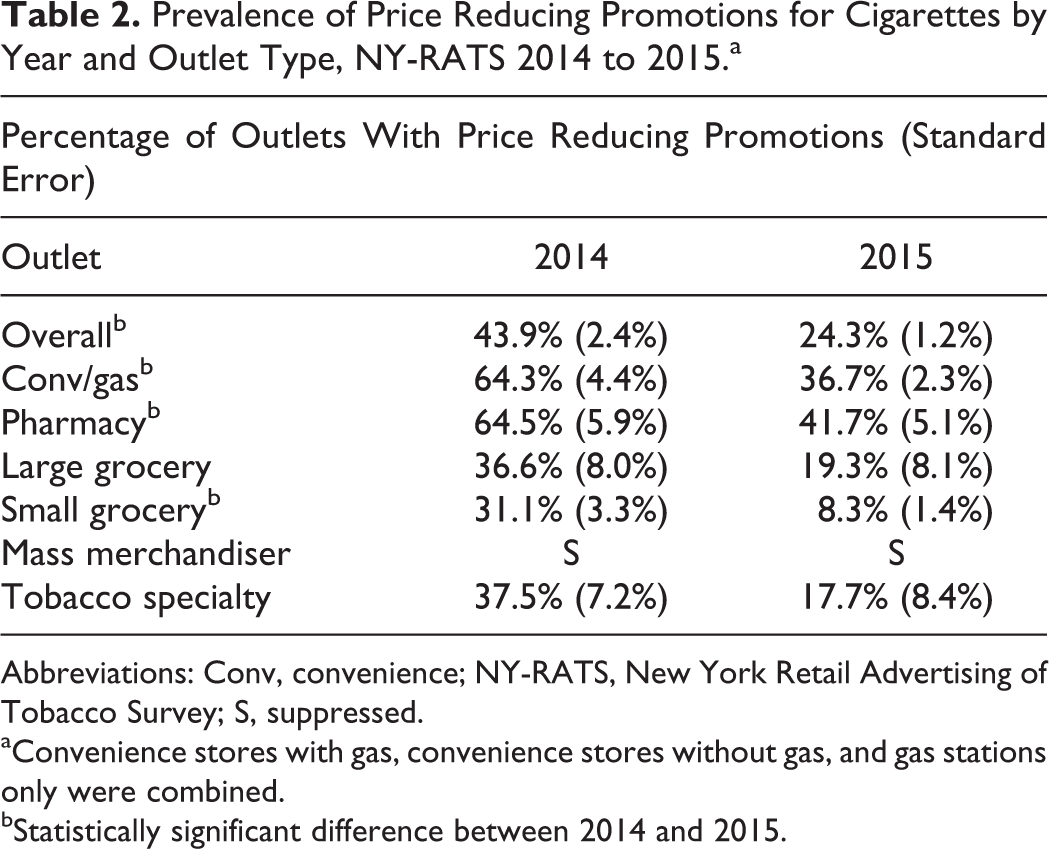
Abbreviations: Conv, convenience; NY-RATS, New York Retail Advertising of Tobacco Survey; S, suppressed.
aConvenience stores with gas, convenience stores without gas, and gas stations only were combined.
bStatistically significant difference between 2014 and 2015.
Compliance with the age-of-sale sign requirement increased from 39.2% in 2004 to 92.3% in 2015, a statistically significant upward trend (OR = 1.20, P < .001; Table 3). Significantly more retailers posted the required age-of-sale sign in 2015 (92.3%) compared to 2014 (84.5%). Similar trends were observed across outlet types, with significant increases from 2014 through 2015.
Prevalence of Required Age-of-Sale Sign and Self-Service Tobacco, by Year and Outlet Type, NY-RATS 2004 to 2012 and 2014 to 2015.a
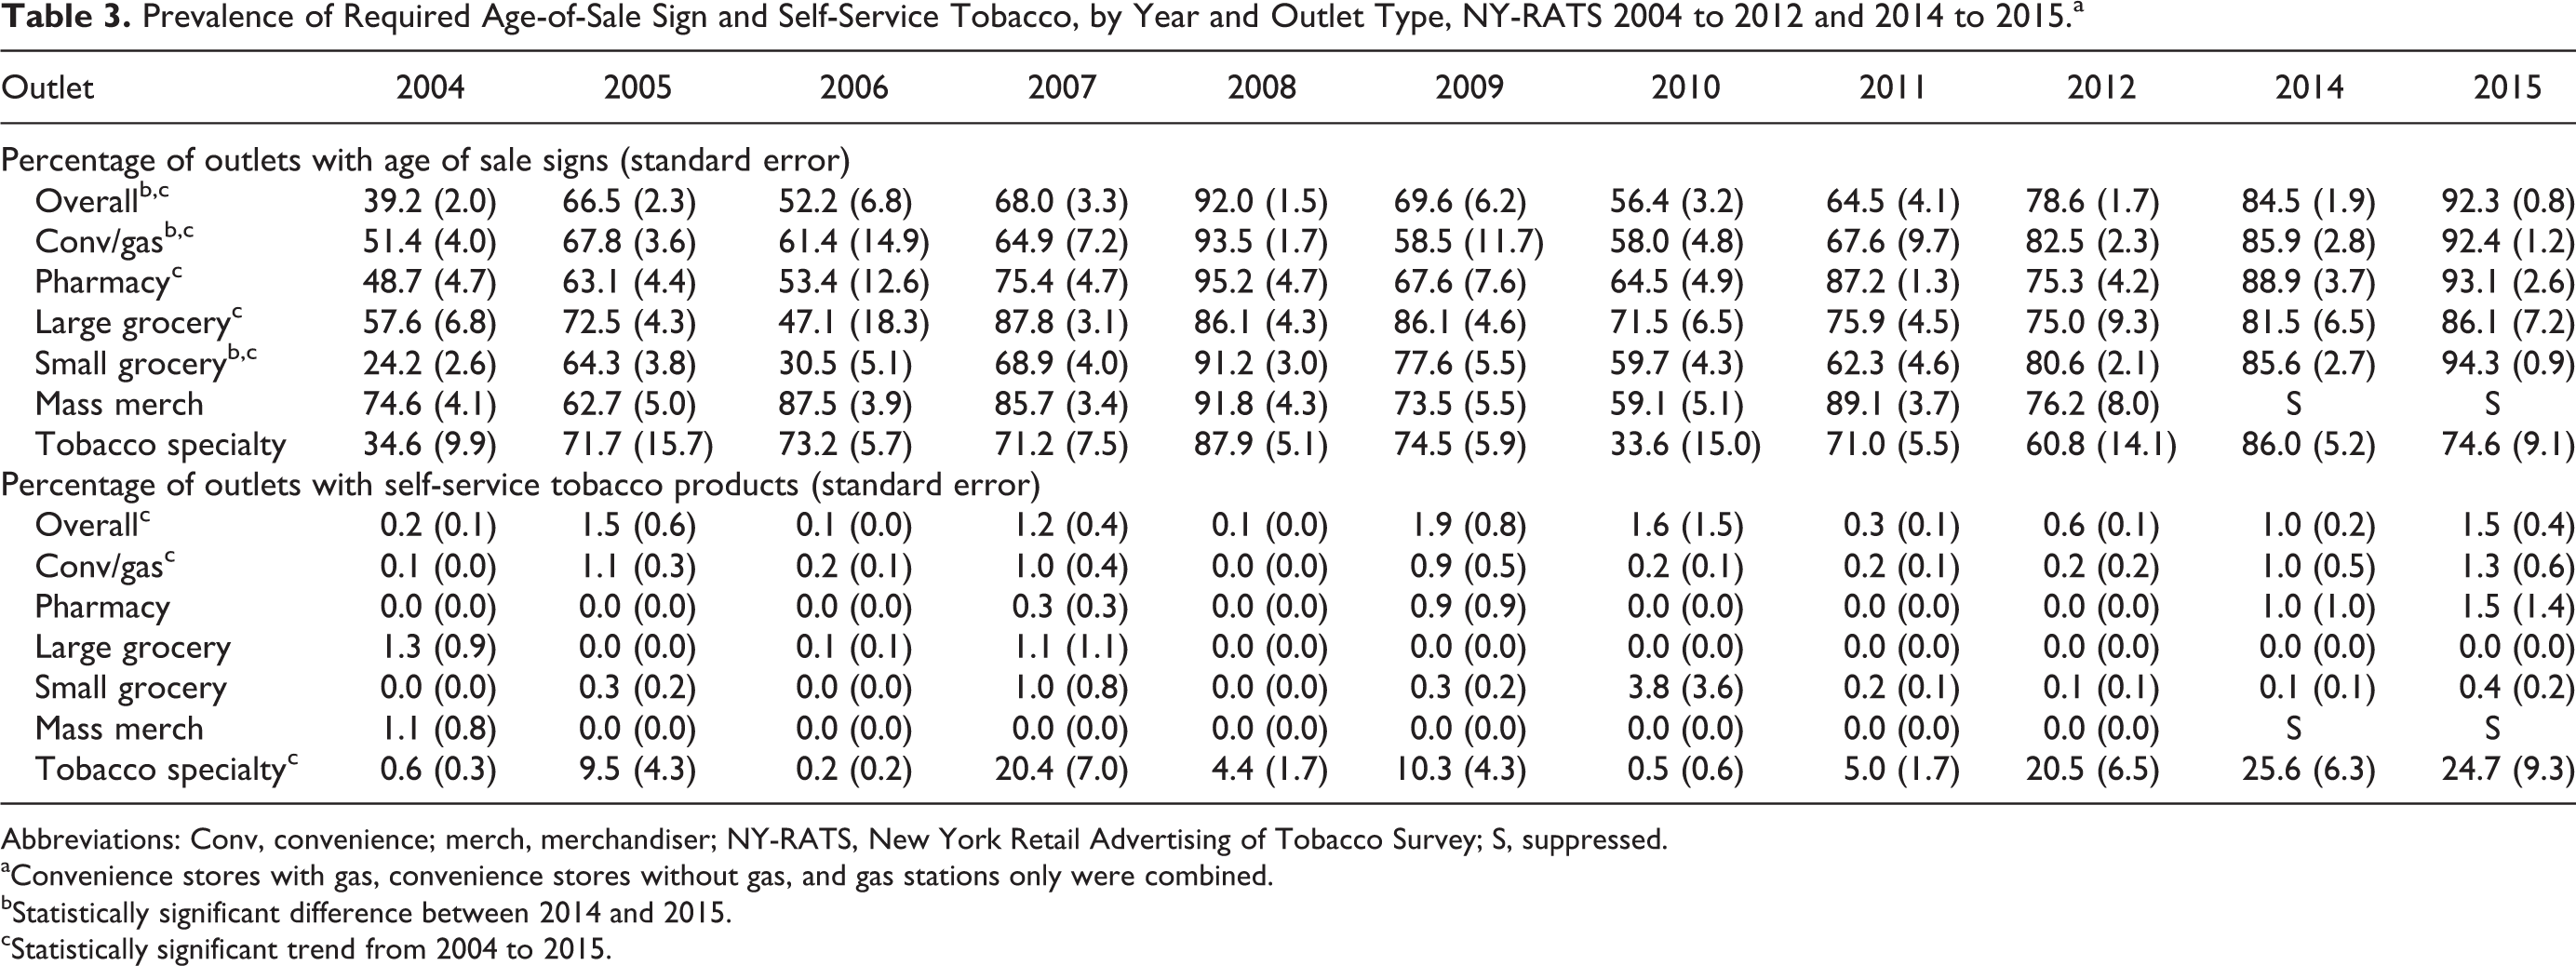
Abbreviations: Conv, convenience; merch, merchandiser; NY-RATS, New York Retail Advertising of Tobacco Survey; S, suppressed.
aConvenience stores with gas, convenience stores without gas, and gas stations only were combined.
bStatistically significant difference between 2014 and 2015.
cStatistically significant trend from 2004 to 2015.
Compliance with state and federal restrictions on self-service access to tobacco products was very high (Table 3). Across all years, less than 3% of nontobacco specialty retailers had self-service tobacco products. However, given that self-service products were banned in retailers open to minors in 2009, self-service areas should not be present in any nontobacco specialty retailers after 2009. Among tobacco specialty retailers, the presence of self-service products ranged from 0.5% to 25.6%, with a statistically significant upward trend from 2004 to 2015 (OR = 1.12, P = .002).
Discussion
This study examined trends in the number of LTRs and the amount of cigarette advertising and other characteristics of the tobacco retail environment in NYS from 2004 to 2015. From 2004 to 2015, the number of LTRs in NYS decreased 22.9%. The number of convenience/gas and tobacco specialty retailers increased, whereas the number of large grocery stores, small grocers, pharmacies, and mass merchandisers decreased. Additional analyses (not reported) show that the decrease in LTRs was uniformly distributed across the state and not concentrated in any 1 area, suggesting that the density of LTRs in NYS may have decreased more or less uniformly. The density of LTRs in NYS is positively associated with exposure to POS advertising and positive beliefs about smoking among youth. 16 More generally, LTR density in school neighborhoods correlates with susceptibility to smoking, 17 experimental smoking, 18 ever smoking, 19 and current smoking 20,21 and a higher likelihood of youth using retail sources to obtain cigarettes. 22 Therefore, to the extent that the decrease in the number of LTRs has also reduced retailer density, it could potentially improve youth smoking outcomes in NYS by reducing exposure to POS marketing and/or access to tobacco. A 2009 study found that LTRs were more likely to be concentrated in low-income and minority areas of NYS compared to high-income, nonminority (white) areas. 23 However, it is unknown whether declines in the number of LTRs since 2009 have changed the relationship between retailer density and community sociodemographic characteristics.
The prevalence of LTRs with cigarette advertising and the average number of cigarette advertisements significantly decreased during the study period, with variations by outlet type. These decreases have the potential to affect smoking among youth in NYS. New York State youth exposed to high levels of cigarette advertising are more likely to have positive attitudes about smoking. 9 Exposure to POS tobacco advertising among youth is associated with higher risk for smoking initiation 7,8 and higher school smoking prevalence. 20 Although cigarette advertising has decreased, a high level of advertising remains, possibly attenuating any positive impact. In 2015, 75.2% of LTRs had at least 1 cigarette advertisement and averaged 13.7 advertisements per store in 2014. High levels of cigarette advertising remain in convenience/gas stores. Despite a significant decrease in advertising, pharmacies also have high levels of cigarette advertisements.
The prevalence of LTRs with price-reducing promotions significantly decreased by 45% from 2014 to 2015. Significant decreases in price-reducing promotions were observed in all outlet types. Previous work in NYS links living near high levels of price-reducing promotions with current smoking among youth. 9 Additionally, price-reducing promotions increase the likelihood that youth will move from experimentation to regular smoking. 8 The decrease in price-reducing promotions coupled with the highest state cigarette tax in the nation 24 could lower youth smoking rates.
Two tobacco control policy measures were also examined: the presence of required age-of-sale signage and the prevalence of prohibited self-service displays. The presence of age-of-sale signage in NYS LTRs increased significantly from 2004 to 2015 in all outlets except tobacco specialty stores. Self-service tobacco products were near 0 in all LTRs, except tobacco specialty retailers, which are often adult-only facilities. New York State inspects every LTR at least once per year, 25 which may explain improved compliance with age-of-sale sign postings and compliance with the self-service display ban.
Beginning in March 2010, community partners in NYS shifted from advocating with store owners for voluntary reductions in tobacco advertising and promotions to a policy-focused approach. Community partners focus on community education (including paid and earned media), community mobilization, and education of government policy-makers about the impact of the tobacco industry’s presence in retail stores. Talking points include information about the effect and extent of signage and power walls, the effect of tobacco retailer density on smoking rates, and the effect of price on youth smoking behaviors. Community partners work to create environments open to policy change by educating the public, key stakeholders, and decision-makers about the presence and effects of tobacco marketing within local communities.
The mobilization of opinion leaders and community-based organizations helps to raise awareness among decision-makers and the public about the benefits of adopting policies to protect residents from the tobacco industry’s influence at the POS. In recent years, support for a range of POS policies, including prohibiting cigarette sales in pharmacies and in close proximity to schools, requiring tobacco products to be out of sight of customers, and capping the number of retailers, has increased significantly among elected officials 26 and the public. 27 As a result, several local policies have been implemented across NYS that directly affect tobacco industry marketing practices at the POS: NYC passed a policy to establish a price floor and prohibited the redemption of coupons and multipack discounts. Cayuga County, Ulster County, and the city of Newburgh now prohibit new LTRs within an established radius of schools. The cities of Binghamton and Rochester adopted new zoning policies that limit the location of new LTRs in relation to schools. Although notable, adoption of these local policies is not likely the sole cause of the measured changes reported in this study, and the changes noted here cannot yet be tied directly to program activities.
Limitations
Because this study was conducted in NYS, the findings may not be generalizable to other areas without similar demographic and policy profiles. As noted in the Methods section, several changes have been made to the conduct of the NY-RATS during the projects’ 11-year history. Survey questions were periodically revised, omitted, and added, and the instrument was revised to improve item measurement, manage survey length, and focus data collection on outcomes of interest to NYS. Continuous improvements in the survey instrument, training, and data collection techniques may contribute to some of the variation observed in this study. In this study, we included selected items that are most similar across waves; however, subtle differences over time may affect internal validity. There were also changes in the stratifications used within the overall stratified random sample design. Each year, we balanced short-term analysis goals with the need to maintain long-term trends. Despite changes, every year’s sample was designed to be state representative by store type. Therefore, we only present results for NYS as a whole and by store type.
We examined sample size and considered each estimate in relation to its relative standard error (RSE) as possible indicators of estimate reliability. Given that this study is largely intended to provide a general description of the retail environment, rather than to direct specific policy decisions, we provide the standard error for each estimate, which allows for RSE calculation and only suppress estimates when the sample size was less than 30 retailers. In this way, we are transparent about inference limitations, while also reporting relevant trends from the tobacco retail environment.
Conclusion
Overall, the results show that substantial reductions occurred in POS tobacco advertising and promotion in NYS. From 2004 to 2015, the number of stores selling tobacco, the prevalence of cigarette advertisements, and the number of cigarette advertisements decreased. From 2014 to 2015, the prevalence of price-reducing promotions decreased significantly. Compliance with posting the required age-of-sale sign and banning self-service tobacco displays was high. The implications of these findings for youth and adult smoking and the associated social costs are unknown, but the direction of change is likely to be positive.
So What? Implications for Health Promotion Practitioners and Researchers
What is already known on this topic?
Tobacco advertising and promotion at the POS are associated with adolescent smoking initiation, current youth smoking, relapse among former smokers, 10 and unplanned cigarette purchases. Point-of-sale advertising is more common in low-income and minority neighborhoods, in stores near schools, and in stores frequented more often by adolescents.
What does this article add?
New York Retail Advertising of Tobacco Survey provides data on the retail environment in NYS to raise awareness of tobacco’s influence at the POS and provides partners, policy-makers, and others with information useful in advocating for change in tobacco retail environments. Lessons learned during the 12-year surveillance period may be applied to future environmental studies at various geographical levels (eg, national, state, and local).
What are the implications for health promotion practice or research?
State and local policy initiatives could change the tobacco POS environment by reducing or eliminating exposure to retail tobacco advertising and promotions. Identifying recent levels of or trends in advertising, promotion, and policy compliance allows tobacco control advocates to make informed decisions regarding prioritization and impact.
Footnotes
Appendix A
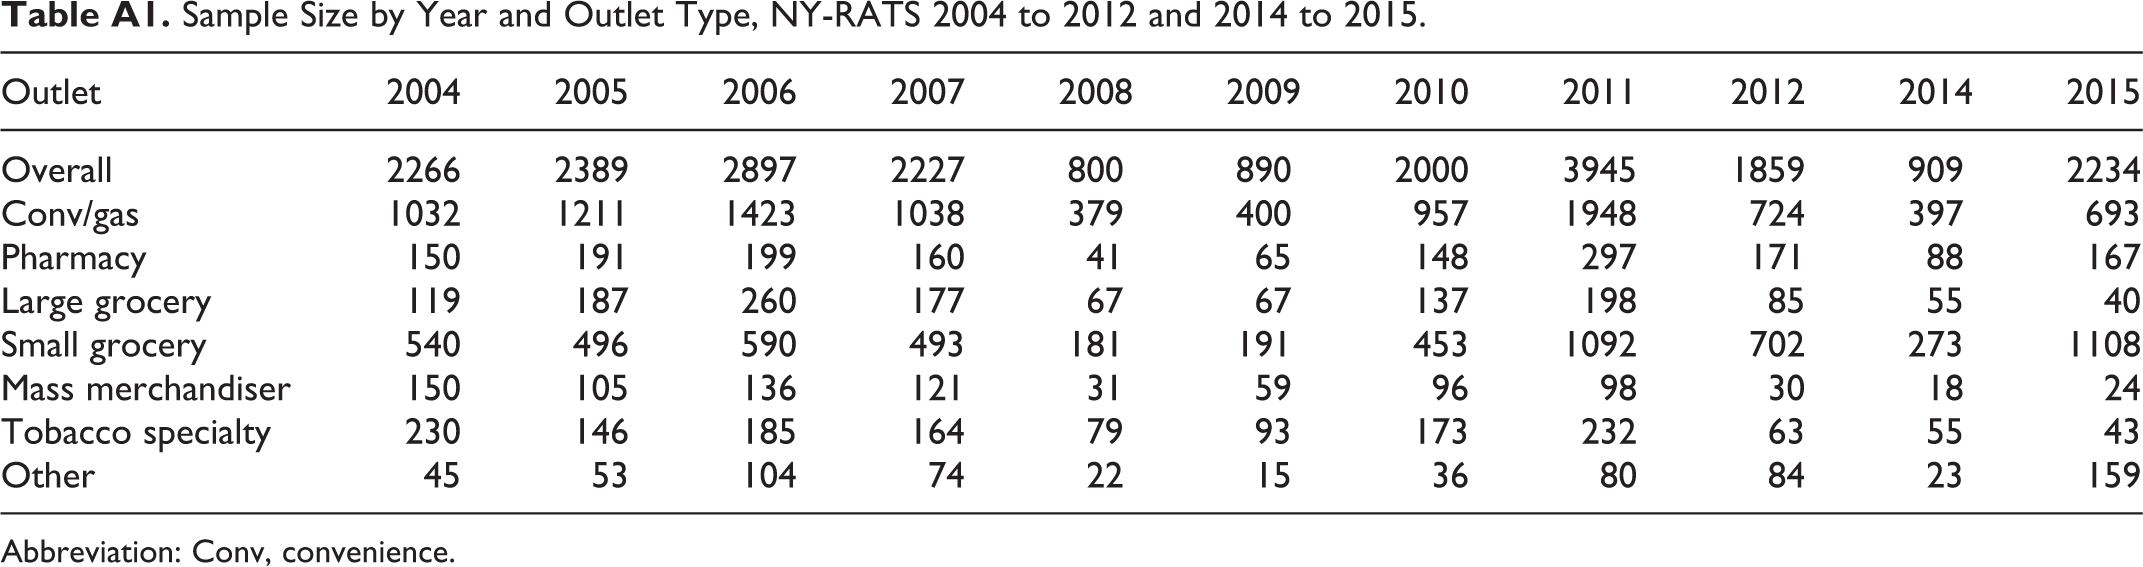
Sample Size by Year and Outlet Type, NY-RATS 2004 to 2012 and 2014 to 2015.
| Outlet | 2004 | 2005 | 2006 | 2007 | 2008 | 2009 | 2010 | 2011 | 2012 | 2014 | 2015 |
|---|---|---|---|---|---|---|---|---|---|---|---|
| Overall | 2266 | 2389 | 2897 | 2227 | 800 | 890 | 2000 | 3945 | 1859 | 909 | 2234 |
| Conv/gas | 1032 | 1211 | 1423 | 1038 | 379 | 400 | 957 | 1948 | 724 | 397 | 693 |
| Pharmacy | 150 | 191 | 199 | 160 | 41 | 65 | 148 | 297 | 171 | 88 | 167 |
| Large grocery | 119 | 187 | 260 | 177 | 67 | 67 | 137 | 198 | 85 | 55 | 40 |
| Small grocery | 540 | 496 | 590 | 493 | 181 | 191 | 453 | 1092 | 702 | 273 | 1108 |
| Mass merchandiser | 150 | 105 | 136 | 121 | 31 | 59 | 96 | 98 | 30 | 18 | 24 |
| Tobacco specialty | 230 | 146 | 185 | 164 | 79 | 93 | 173 | 232 | 63 | 55 | 43 |
| Other | 45 | 53 | 104 | 74 | 22 | 15 | 36 | 80 | 84 | 23 | 159 |
Abbreviation: Conv, convenience.
Authors’ Note
The conclusions in this paper are those of the authors and do not represent the views of the New York State Department of Health.
Acknowledgments
The authors would like to acknowledge Maria Girlando of RTI, who managed the RATS study from 2004 through 2012, and Becky Durocher of RTI, who is responsible for training the data collectors. The authors would like to acknowledge Susan Murchie of RTI for editorial assistance.
Declaration of Conflicting Interests
The author(s) declared no potential conflicts of interest with respect to the research, authorship, and/or publication of this article.
Funding
The author(s) disclosed receipt of the following financial support for the research, authorship, and/or publication of this article: The support was provided by the New York State Department of Health Bureau of Tobacco Control.