
Abstract
Given the critical nature of stakeholder support for the success of wellness initiatives, developing tools to convey a wellness program’s value in a meaningful way to gain buy-in from leadership and other stakeholders has been a long-standing discussion in the field of worksite health promotion. 1 -4 In June of 2018, the Health Enhancement Research Organization (HERO) convened a Summer Think Tank focused on Developing Dashboards that Engage Leaders at All Levels. 5 The meeting exposed attendees to employer case studies and industry subject matter experts in measurement and evaluation and discussed guidelines for designing and developing effective dashboards. Even though the measures that suggest value may vary over time and from one organization to another, the use of dashboards as an important communication tool remains constant.
Dashboard Development
Given the importance of conveying value to stakeholders, MHealthy’s leadership team was tasked with the creation of a macrolevel dashboard, a dashboard that reflects large-scale constructs with which the employee wellness initiative may be associated. The first phase of dashboard development focused on identifying the goals that should be displayed to tell the story of the important work happening in MHealthy. Fortunately, this phase came fairly easily since several years earlier, following MHealthy’s 5-year evaluation, MHealthy leadership was charged by the university’s executive vice presidents to develop a series of macrolevel metrics to track over time. In developing these goals, MHealthy leadership considered 3 main guiding principles.
The first guiding principle was the mandate of the executive vice presidents to focus on specific subpopulations and nonfinancial metrics. While maintaining a total population approach, U-M executives asked MHealthy leadership to concentrate programming on those employees who are at high risk and those with chronic conditions. They also suggested that when developing the metrics, to pay particular attention to nonfinancial metrics such as culture and engagement.
The second guiding principle was alignment with Dee Edington’s 5 pillars that are important to an organization’s health and wellness. 6 Dr Edington is a former, well known, faculty member from the university. Since the act of creating the dashboard fell into Pillar 5, Quality Assurance: Measuring and Communicating What Matters, MHealthy leadership focused on pillars 1-4 for the development of the macrolevel metrics. Those remaining 4 pillars are (1) Senior Leadership: Engaged and Committed Leadership, (2) Operations Leadership: Positive Environment, Culture and Climate, (3) Self-Leadership: Positive Individual Health and Self-Leadership, and (4) Incentives: Positive Personal Motivation.
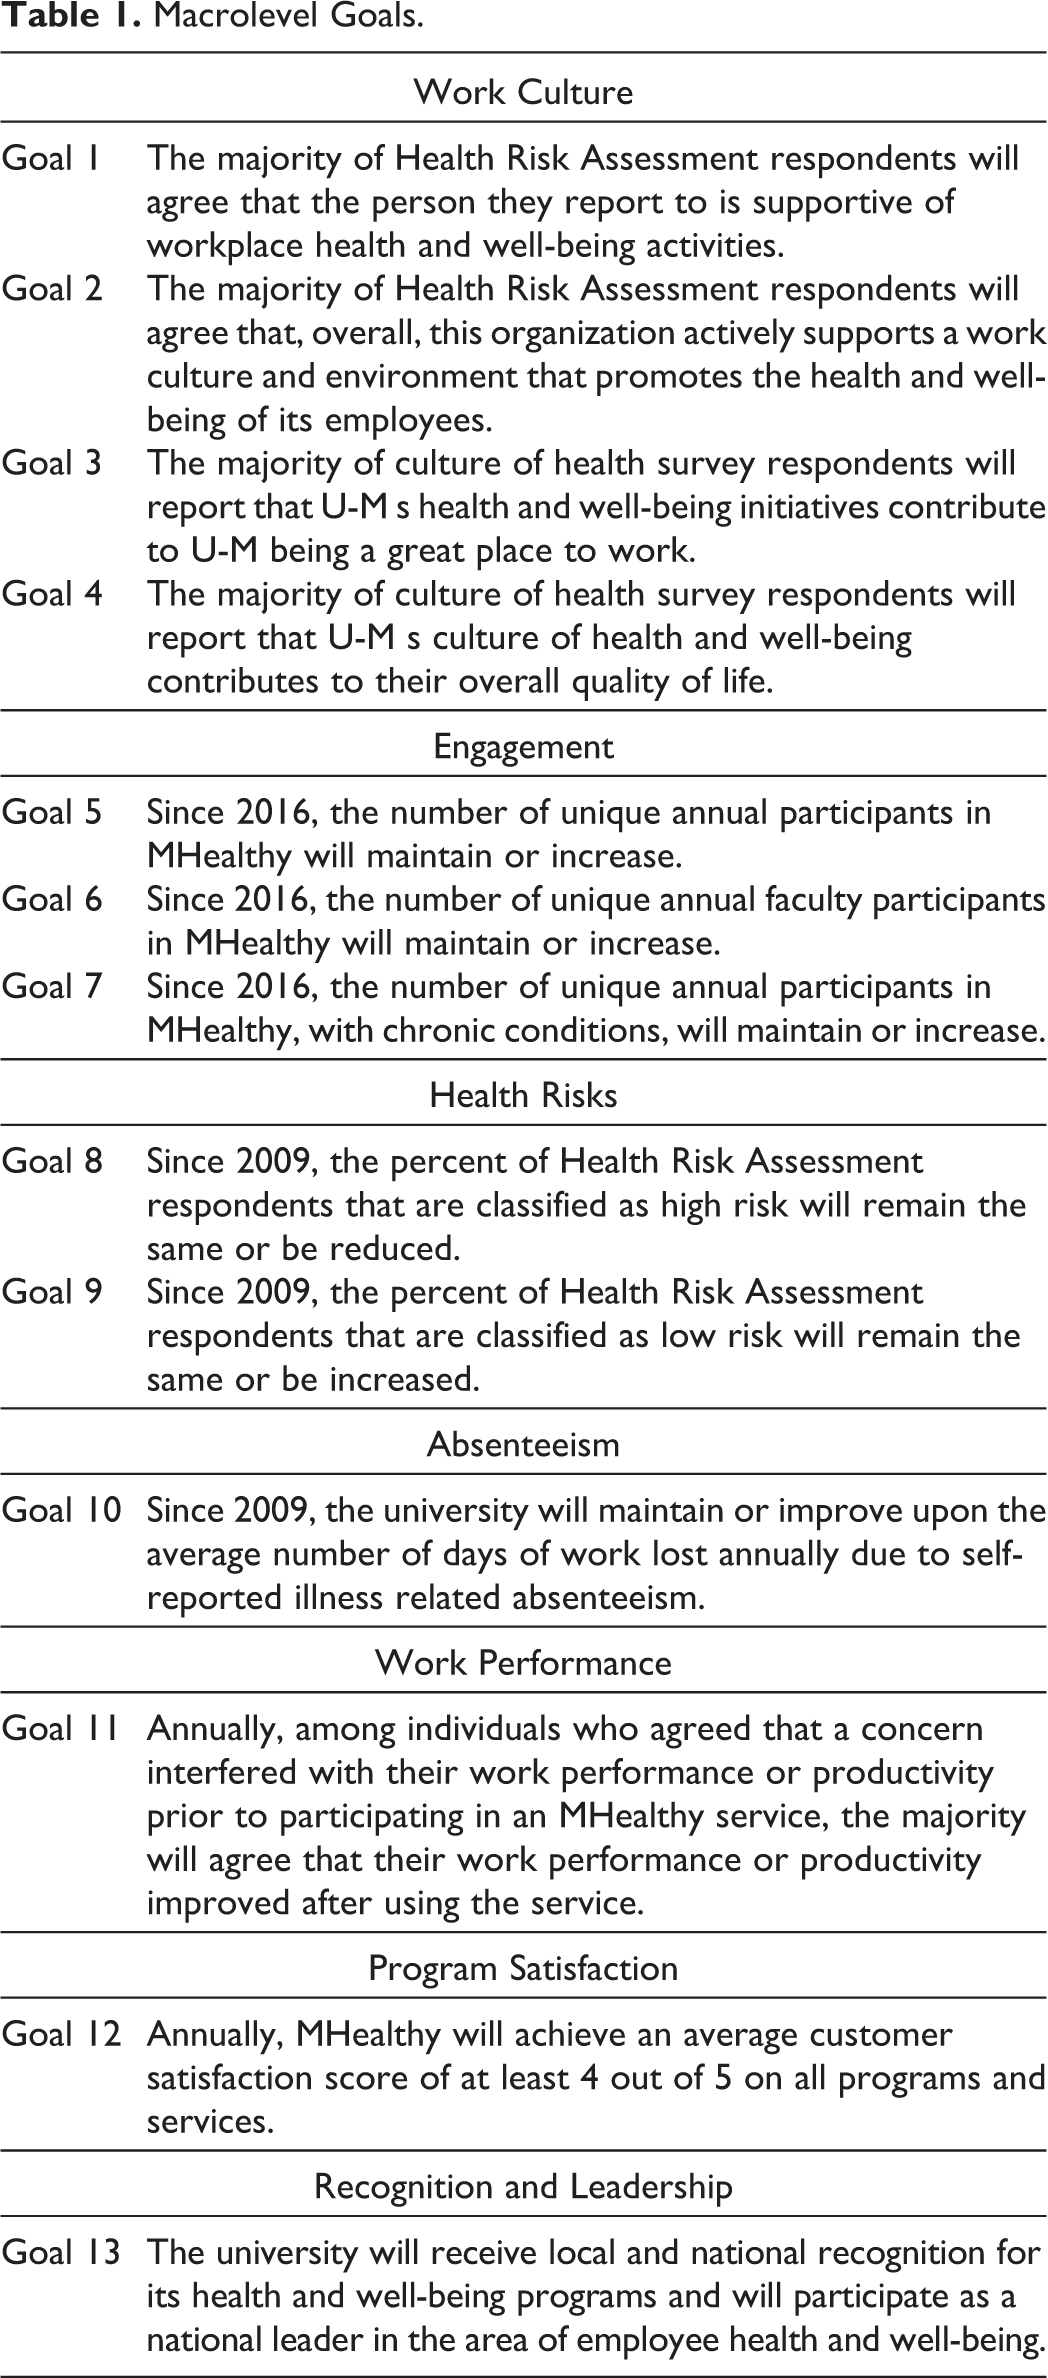
The third guiding principle was to build upon the work completed in the initial 5-year evaluation. MHealthy leadership considered the list of metrics prior to the 5-year evaluation and what MHealthy leadership wanted to continue tracking or improve upon. After several lengthy meetings over the course of several months, MHealthy leadership developed the goals listed in Table 1.
Macrolevel Goals.
Goals and Metrics
The guiding principles were used to clarify the 13 goals that MHealthy leadership wanted to see addressed. Based on those goals, MHealthy leadership identified 13 specific metrics to track on the dashboard.
Gaining Buy-In
Since MHealthy already had goals to demonstrate its value, those goals served as the basis for the metrics on the dashboard. A rough draft of the dashboard was then created by developing basic graphs and charts that show the results of the goals (in Table 1). The rough draft was reviewed in a meeting that contained MHealthy and benefits administration colleagues. After detailed discussions, it was decided that the important information was included and that only minor changes were needed to the dashboard’s content. After those minor changes were implemented, the dashboard was passed off to a graphic designer for formatting (see Figure 1).
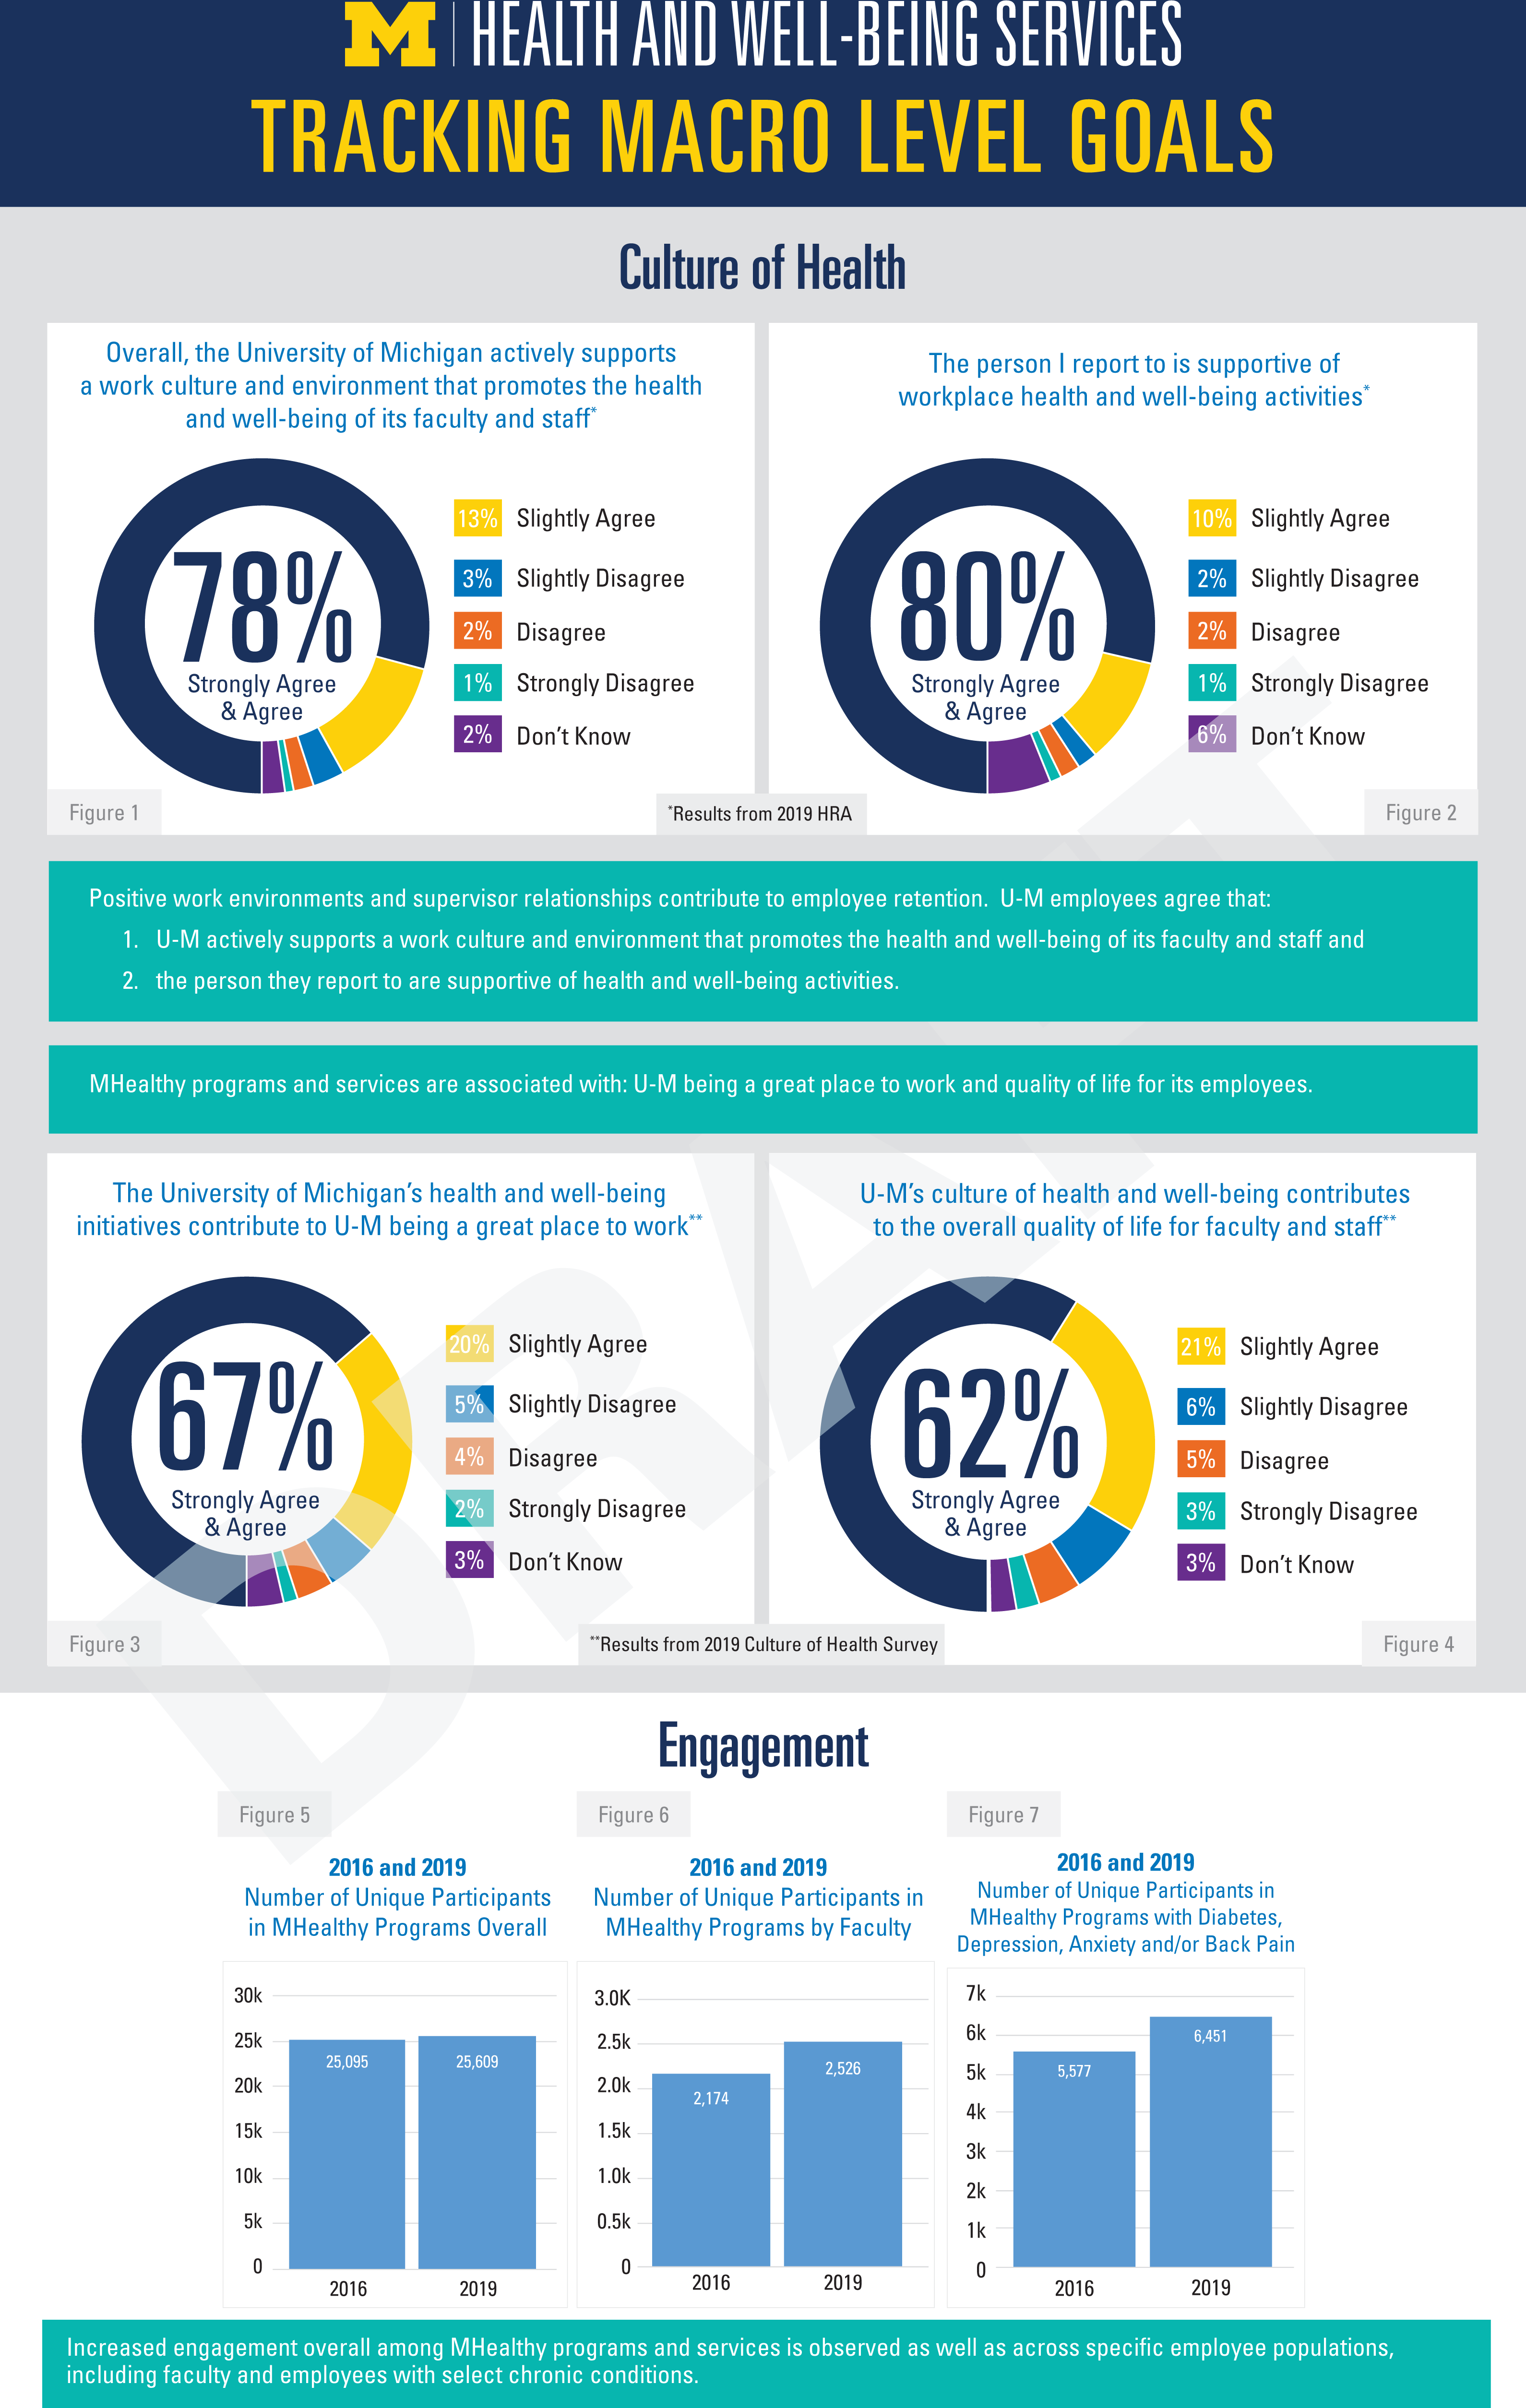
University of Michigan MHealthy dashboard.
Once the dashboard was finalized, MHealthy leadership began the process of socializing it. One of the ways this was accomplished was by creating a webinar that was promoted to all MHealthy staff that detailed the history, process, and results of the dashboard. In addition to the webinar, the dashboard was presented at various internal meetings. In the process of creating and socializing the dashboard, there were various comments regarding how additional dashboards might be helpful. This led to the creation of a committee with members from the benefits administration office and MHealthy. This committee is currently in the process of developing 3 additional dashboards. One of these additional dashboards includes a benefits, health and well-being combined macrolevel dashboard that displays important high-level value metrics from both offices. Two additional combined MHealthy and benefits administration office macrolevel dashboards are also in process of being developed. One of those dashboard’s focus is on chronic conditions and the other one’s focus is on low-wage earning employees. Once those 3 dashboards are finalized, MHealthy leadership will discuss the possibility of developing program-specific dashboards where program leads can assess their program’s progress.
Conclusion
Conveying a wellness program’s value via a dashboard is a process that is time intensive, involves organizational input and needs to be well thought out. In particular, the main steps in creating a dashboard are identifying stakeholder needs, identifying available metrics aligned with goals, drafting the dashboard, obtaining feedback and stakeholder buy-in, formatting and designing the final dashboard, and building awareness for it. In the future, MHealthy leadership is planning to develop a regular review process to ensure the quality and accuracy of the data represented.