
Abstract
Purpose:
To examine multilevel predictors on American public response to COVID-19.
Design:
Multilevel study.
Setting:
A national survey was conducted by Qualtrics from August 24 to September 11, 2020. The state-level variables were constructed on data from multiple sources.
Subjects:
2,440 respondents 18 years and older from all 50 states and D.C.
Measures:
The outcome variable is the public response to COVID-19 measured by threat perception, behavioral adjustment, and policy support. The predictors include individual-level sociodemographic factors and state-level indicators about public health conditions, political context, and economic recovery.
Analysis:
Multilevel structural equation modeling is used for statistical estimation.
Results:
People from states with more COVID-19 cases (β = 0.020, p < 0.1), mandatory face mask policies (β = 0.069, p < 0.05), and liberal governments (β = 0.002, p < 0.05) are more likely to respond while people from states whose economies have recovered closer to the pre-pandemic level are less likely to do so (β = −0.005, p < 0.05). Regarding individual-level predictors, older people (β = 0.005, p < 0.001) and people with better education (β = 0.029, p < 0.01), leaning toward the Democrat Party (β = 0.066, p < 0.001) and liberal political ideology (β = 0.094, p < 0.001), and have stronger generalized trust (β = 0.033, p < 0.001) are more likely to respond than their counterparts.
Conclusion:
Differences in the public response to the pandemic stem from variations in individual characteristics and contextual factors of states where people live. These findings contribute to the rapidly growing literature and have implications for public health policies.
Purpose
The COVID-19 pandemic has had enormous impacts on Americans. The latest data reports over 31 million confirmed cases and more than 560,000 deaths nationwide as of April, 2021. To contain the alarming outbreak, the public response becomes critical. 1 However, not all Americans perceive the threat of COVID-19 or are willing to change their routine behaviors to mitigate the transmission of the virus.2-6 Therefore, it is significant to identify the underlying factors that can motivate the public to slow the transmission of the pandemic.7,8 In this study, we aim to investigate multilevel determinants of American public response to COVID-19. We treat the public response as functions of their individual characteristics and the circumstances of the state where they live.
Despite a rapidly growing literature that examines individual factors influencing behavioral adjustment to respond to COVID-19, there is a paucity of studies that take a comprehensive approach to investigate both individual and contextual factors. We attempt to fill this gap in the literature. Specifically, we select state-level measures that reflect public health, political, and economic conditions. We expect that people from states with more cases and states that have adopted the mask mandate policy are more likely to adjust their behaviors to the pandemic due to the urgency of the situation. Meanwhile, given the politicization of the pandemic, residents from liberal states are expected to be more responsive than residents from conservative states. Additionally, a better economic recovery would reduce responses because people are likely under the misimpression that return to normality is around the corner. At the individual level, we select variables by following previous studies on this topic and expect these variables to be comprehensive to represent one’s demographic, socioeconomic, and political background.2,3,5 These variables are presented in Figure 1 with state-level variables on the top of the diagram and individual-level variables at the bottom.
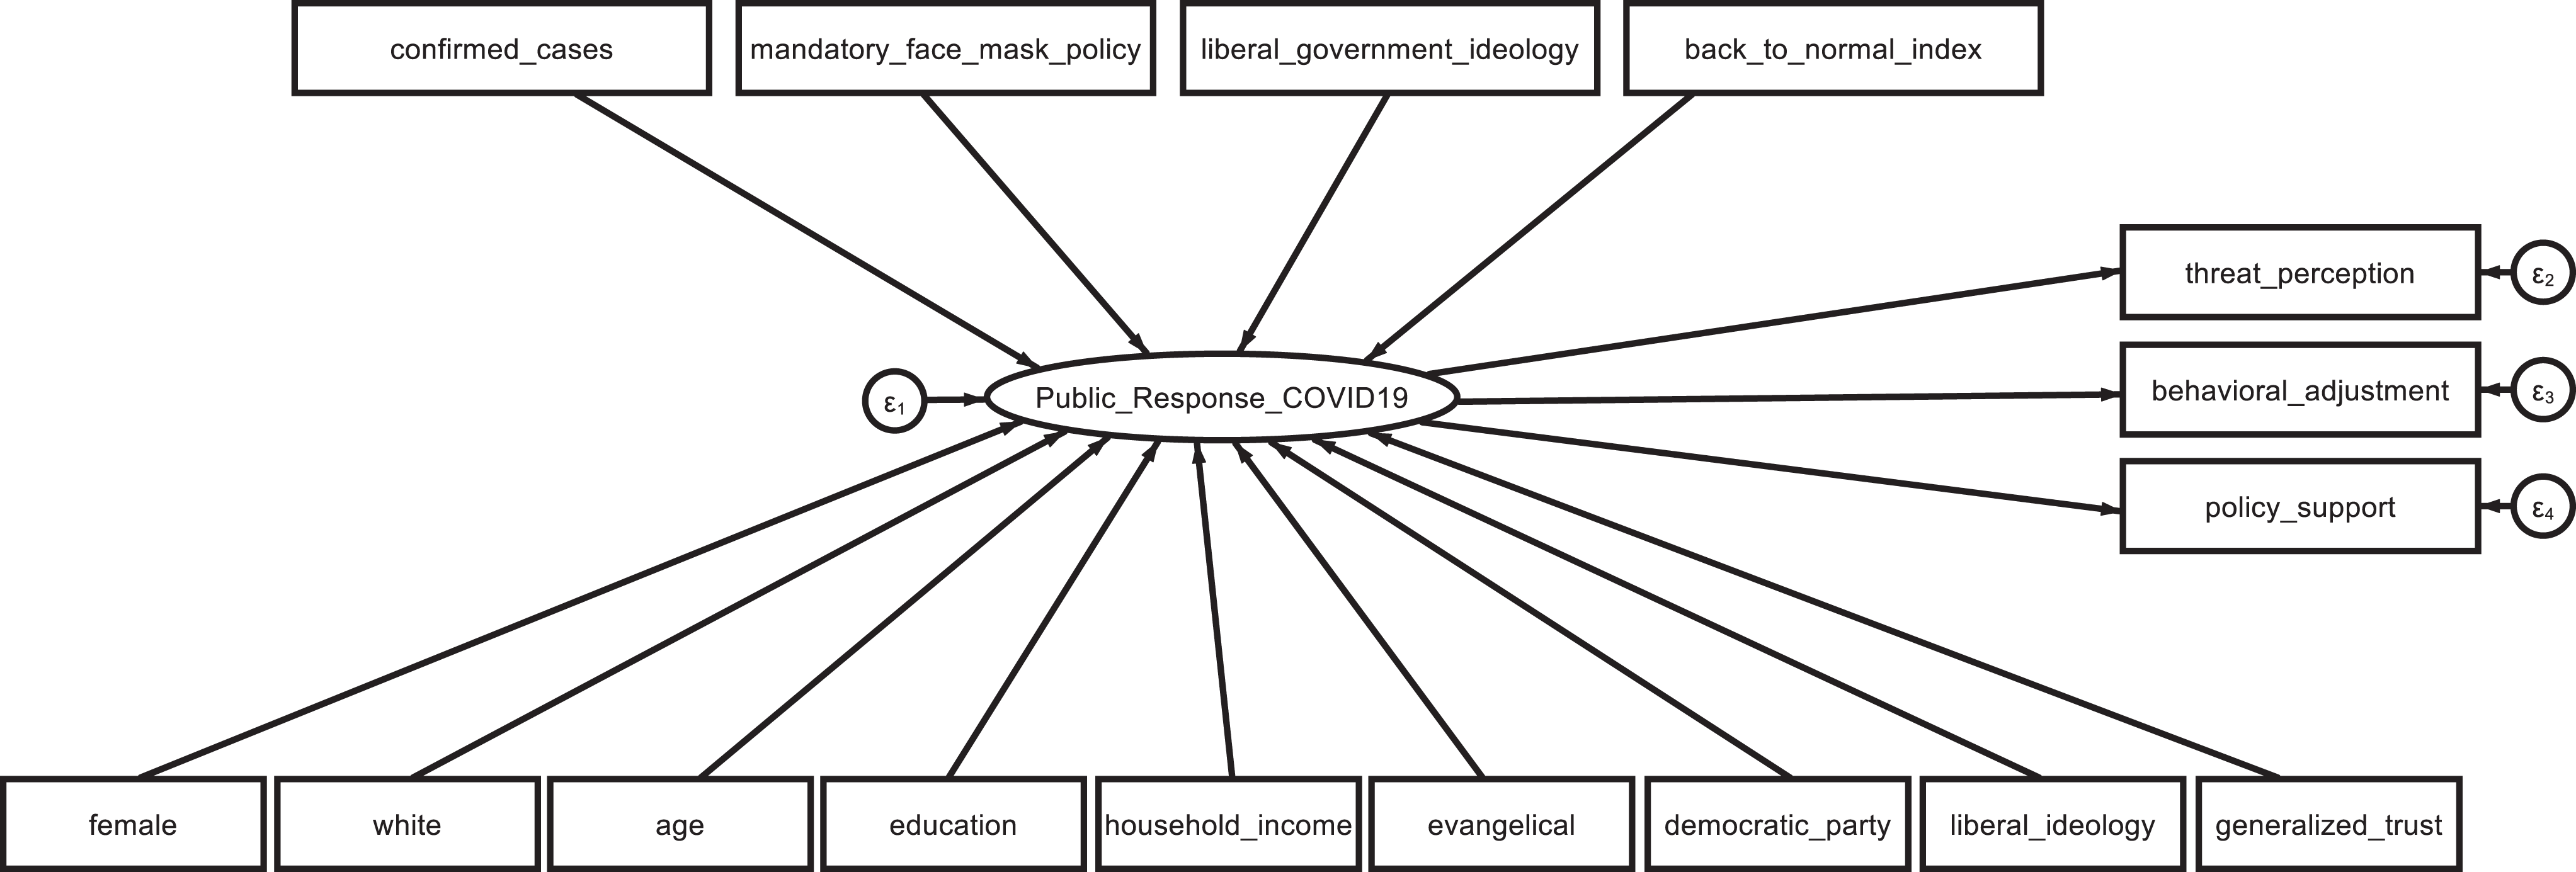
Multilevel structural equation modeling diagram.
Methods
Design
The data used in this study are from several sources. All individual-level measures are drawn from a nationwide survey designed by the lead author and administered by Qualtrics from August 24 to September 11, 2020. Qualtrics’s online samples are drawn from multiples sources. Online surveys have become a standard method in research across disciplines, ranging from public health to psychology, criminology, and sociology.2,9-11 Compared with other survey data collection modes, online surveys can result in more honest and accurate self-reports with less social desirability bias.12,13 This approach can also assure cost-effective and timely survey administration while still providing robust and reliable results. At the state level, we obtain data of the confirmed COVID-19 cases based on a dataset compiled by The New York Times (github.com/nytimes/covid-19-data) and the adoption of mandatory face mask policies based on a CNN report that is regularly updated (www.cnn.com/2020/06/19/us/states-face-mask-coronavirus-trnd/index.html). The political context is gauged by an indicator about the political orientation of state Congress members (rcfording.com/state-ideology-data). 14 The level of economic recovery is measured using a back-to-normal index constructed by Moody’s Analytics and CNN Business (www.cnn.com/business/us-economic-recovery-coronavirus). We use state-level data due to data availability issues and the location identifier included in the survey. We acknowledge this approach has limitations such as localities might pass their mask mandates. We shed light on how subsequent research can address the limitations at the end of this article.
Sample
A total of 2,440 respondents 18 years and older from all 50 states and D.C. completed the survey in English. We set the sample size based on the power analysis result and the budget constraint to carry out this survey. The sample was drawn from numerous Qualtrics online panel partners, which are composed of individuals who made a conscious decision to participate in online surveys through a double opt-in registration process. The panelist opted in the panel source to be a participant first and then went through qualification screening criteria before entering the survey. Potential respondents were contacted until the target sample size was reached. Respondents who completed the survey received a small financial incentive in return. The participants were asked about their opinions regarding the pandemic and several sociodemographic questions. The average completion time is approximately 8 minutes. Qualtrics uses a sophisticated matching approach when choosing whom to invite and then include in any given survey. The qualified respondents were randomly selected and matched to a sampling frame based on the demographic benchmarks of the American Community Survey. Qualtrics-generated panels are generally representative of the U.S. adult population. Notably, our data includes approximately 13% people 18-24, 18% people 25-34, and 49% female, which are analogous to the U.S. population (12% people 18-24, 18% people 25-34, and 51% female). Also, approximately one-third of respondents are liberal, one-third are conservative, and the rest one-third are moderate. Meanwhile, we acknowledge there are limitations of this online sample. For instance, the English-only criteria could have excluded respondents who prefer other languages such as Spanish. In addition, our sample includes 62% white, which is lower than the national benchmark (74% white). Almost half (46%) of the respondents in our sample have at least a Bachelor’s degree, which is higher than the American Community Survey results showing around 31% of American adults have a Bachelor’s degree or higher. To address this issue, we have performed additional tests on a weighted sample and discussed the results in the next section.
Measures
Public response to COVID-19 is measured by answers to 3 questions. The first question concerns threat perception of COVID-19: “How much threat do you perceive that COVID-19 has posed to the U.S.?” Responses are coded as minor threat = 1, some threat = 2, major threat = 3. The second question covers the willingness to adopt behaviors to prevent COVID-19: “How willing are you to adopt behaviors to prevent COVID-19?” Responses are coded very unwilling = 1, somewhat unwilling = 2, somewhat willing = 3, very willing = 4. The third question deals with public support for policies on COVID-19: “How much do you support policies to prevent COVID-19?” Responses are coded as strongly opposed = 1, somewhat opposed = 2, somewhat supportive = 3, very supportive = 4. A higher value means the respondent is more likely to perceive the pandemic as a major threat, willing to adjust behaviors, and support relevant policies. We design these survey questions by following Pew Research Center’s Election News Pathways Survey. Qualtrics has tested these measures in a soft launch among a diverse but limited sample before a full launch. The confirmatory factor analysis results in Table 1 show that the standardized factor loadings of all individual items are statistically significant, and the loadings are reasonable in magnitude (all above 0.7). The Cronbach’s Alpha score for these 3 indicators is 0.75. The results suggest adequate internal consistency of using these variables to construct a latent measure of public response to COVID-19.
Confirmatory Factor Analysis of Public Response to COVID-19.
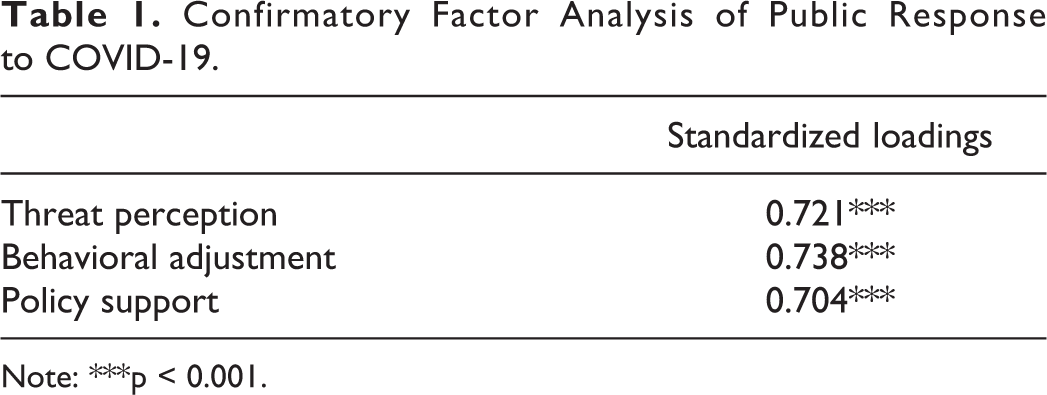
Note: ***p < 0.001.
We include 9 individual-level predictors including sex (female = 1), race (white = 1), age, education (high school and less = 1, some college = 2, Bachelor’s degree = 3, graduate and higher = 4), household income (less than $25,000 = 1, $25,000-$49,999 = 2, $50,000-$74,999 = 3, $75,000-$99,999 = 4, $100,000 and above = 5), religious background (Evangelical = 1), political party affiliation (strong Republican = 1, leaning Republican = 2, Independent = 3, leaning Democrat = 4, strong Democrat = 5), political ideology (very conservative = 1, somewhat conservative = 2, moderate = 3, somewhat liberal = 4, very liberal = 5), and generalized trust (strongly distrust = 1, distrust = 2, neutral = 3, trust = 4, strongly trust = 5). In addition, it will be helpful to examine the association between individual experience with COVID-19 (e.g., being tested and received a positive test result) and the response. People with personal experience would perceive the risk more directly and are more likely to respond. However, the questions were not included in the survey primarily due to the concern of privacy because the information is sensitive and people might not be willing to share.
At the state level, the confirmed COVID-19 cases are measured as the number of cases from each state during the period when the survey was conducted. California, Texas, and Florida have the most cases while Vermont, Wyoming, and Maine have the least. The variable has been transformed into the logarithmic form when included for analyses. At the time of the survey administration, there are 35 states including California and Texas that require people to wear masks when out in public. A higher score of political contexts for each state indicates a more liberal ideology of the state Congress. California, New York, and Massachusetts are some of the most liberal states while South Carolina, Texas, and Kentucky are the top conservative states. The back-to-normal index represents the percentage of the economy returning to its pre-pandemic level. The index has daily indicators for each state from February of 2020 to January of 2021. We calculated the mean based on the data when the survey was administered and used the mean index for analyses. Maine, South Dakota, and Rhode Island have around 90% of their economy returning to the pre-pandemic level. The number is only 70% for New York and Louisiana and 60% for Hawaii. The first 2 variables have data available for all 50 states and D.C. and the last 2 variables do not have data for D.C. The descriptive statistics of all variables are reported in the Appendix of the supplemental material.
Analysis
We merge the individual-level data with state-level measures and use multilevel structural equation modeling to simultaneously estimate their effects on the public response to COVID-19 estimation. 15 As Figure 1 demonstrates, the public response to COVID-19 is measured by 3 indicators and the variable has adequate reliability according to the confirmatory factor analysis results. This endogenous variable is predicted by 4 state-level exogenous variables and 9 individual-level exogenous variables. The analyses are performed in different models step-by-step and the results are reported in Table 2. Model 1 only includes the individual-level variables, Model 2 adds 2 state-level variables that have data for all 50 states and D.C., and Model 3 includes 2 other state-level variables that have data for 50 states.
Multilevel Structural Equation Modeling Results on American Public Response to COVID-19.
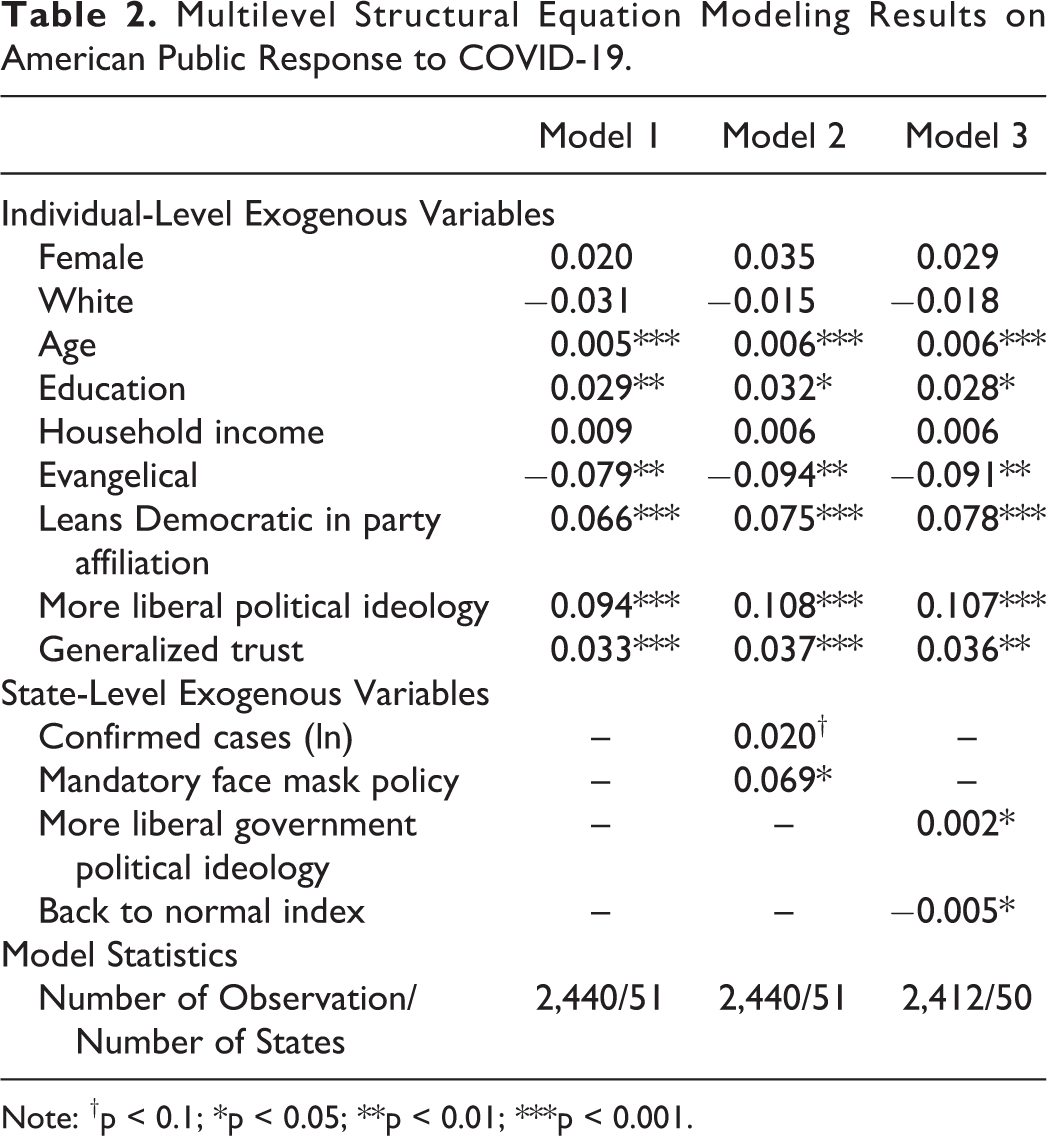
Note: †p < 0.1; *p < 0.05; **p < 0.01; ***p < 0.001.
Results
The analyses are performed on 2,440 individual responses to the survey plus the state-level measures. Due to the study design and sampling approach outlined above, a response rate is somewhat less interpretable than it would be in a simple random sample. There were approximately 188,400 survey invitations sent to potential participants. A total of 4,981 respondents entered the survey after clicking on the invitation with 2,440 respondents finished the survey and 2,541 were terminated from the survey after the target sample size was reached.
Findings in Model 1 show that 6 individual-level variables have significant effects on public response to COVID-19. People who are older (β = 0.005), have better education (β = 0.029), are not Evangelicals (β = −0.079), lean to the Democratic party (β = 0.066) and liberal ideology (β = 0.094), and have stronger generalized trust in others (β = 0.033) are more likely to respond to the pandemic than their counterparts. The effects of these variables remain significant in subsequent models after adding state-level measures. The state-level measures are all significant. According to Model 2, people from states with more confirmed cases (β = 0.020) and mandatory face mask policies (β = 0.069) are more likely to perceive threats of COVID-19, take precautionary measures, and support mitigation policies. In addition, as suggested in Model 3, people from states with liberal governments are more likely to respond to the pandemic compared to people from states with conservative governments (β = 0.002). Also, people from states whose economies have recovered closer to the pre-pandemic level are less likely to respond than people from states whose economies are still far from full recovery (β = −0.005).
To visualize the influence of these state-level factors on individual response to the pandemic, we compute the adjusted means of the 3 indicators of the endogenous variable given different values of the state-level measures after controlling for other variables in the model. The plots are presented in Figure 2. We have checked the results by analyzing the data after being weighted based on national demographic benchmarks of the race (percent of white) and education (percent of people have at least a Bachelor’s degree). Findings show that the influence of these 2 variables and other individual-level variables remains unchanged in terms of statistical significance and coefficient direction.
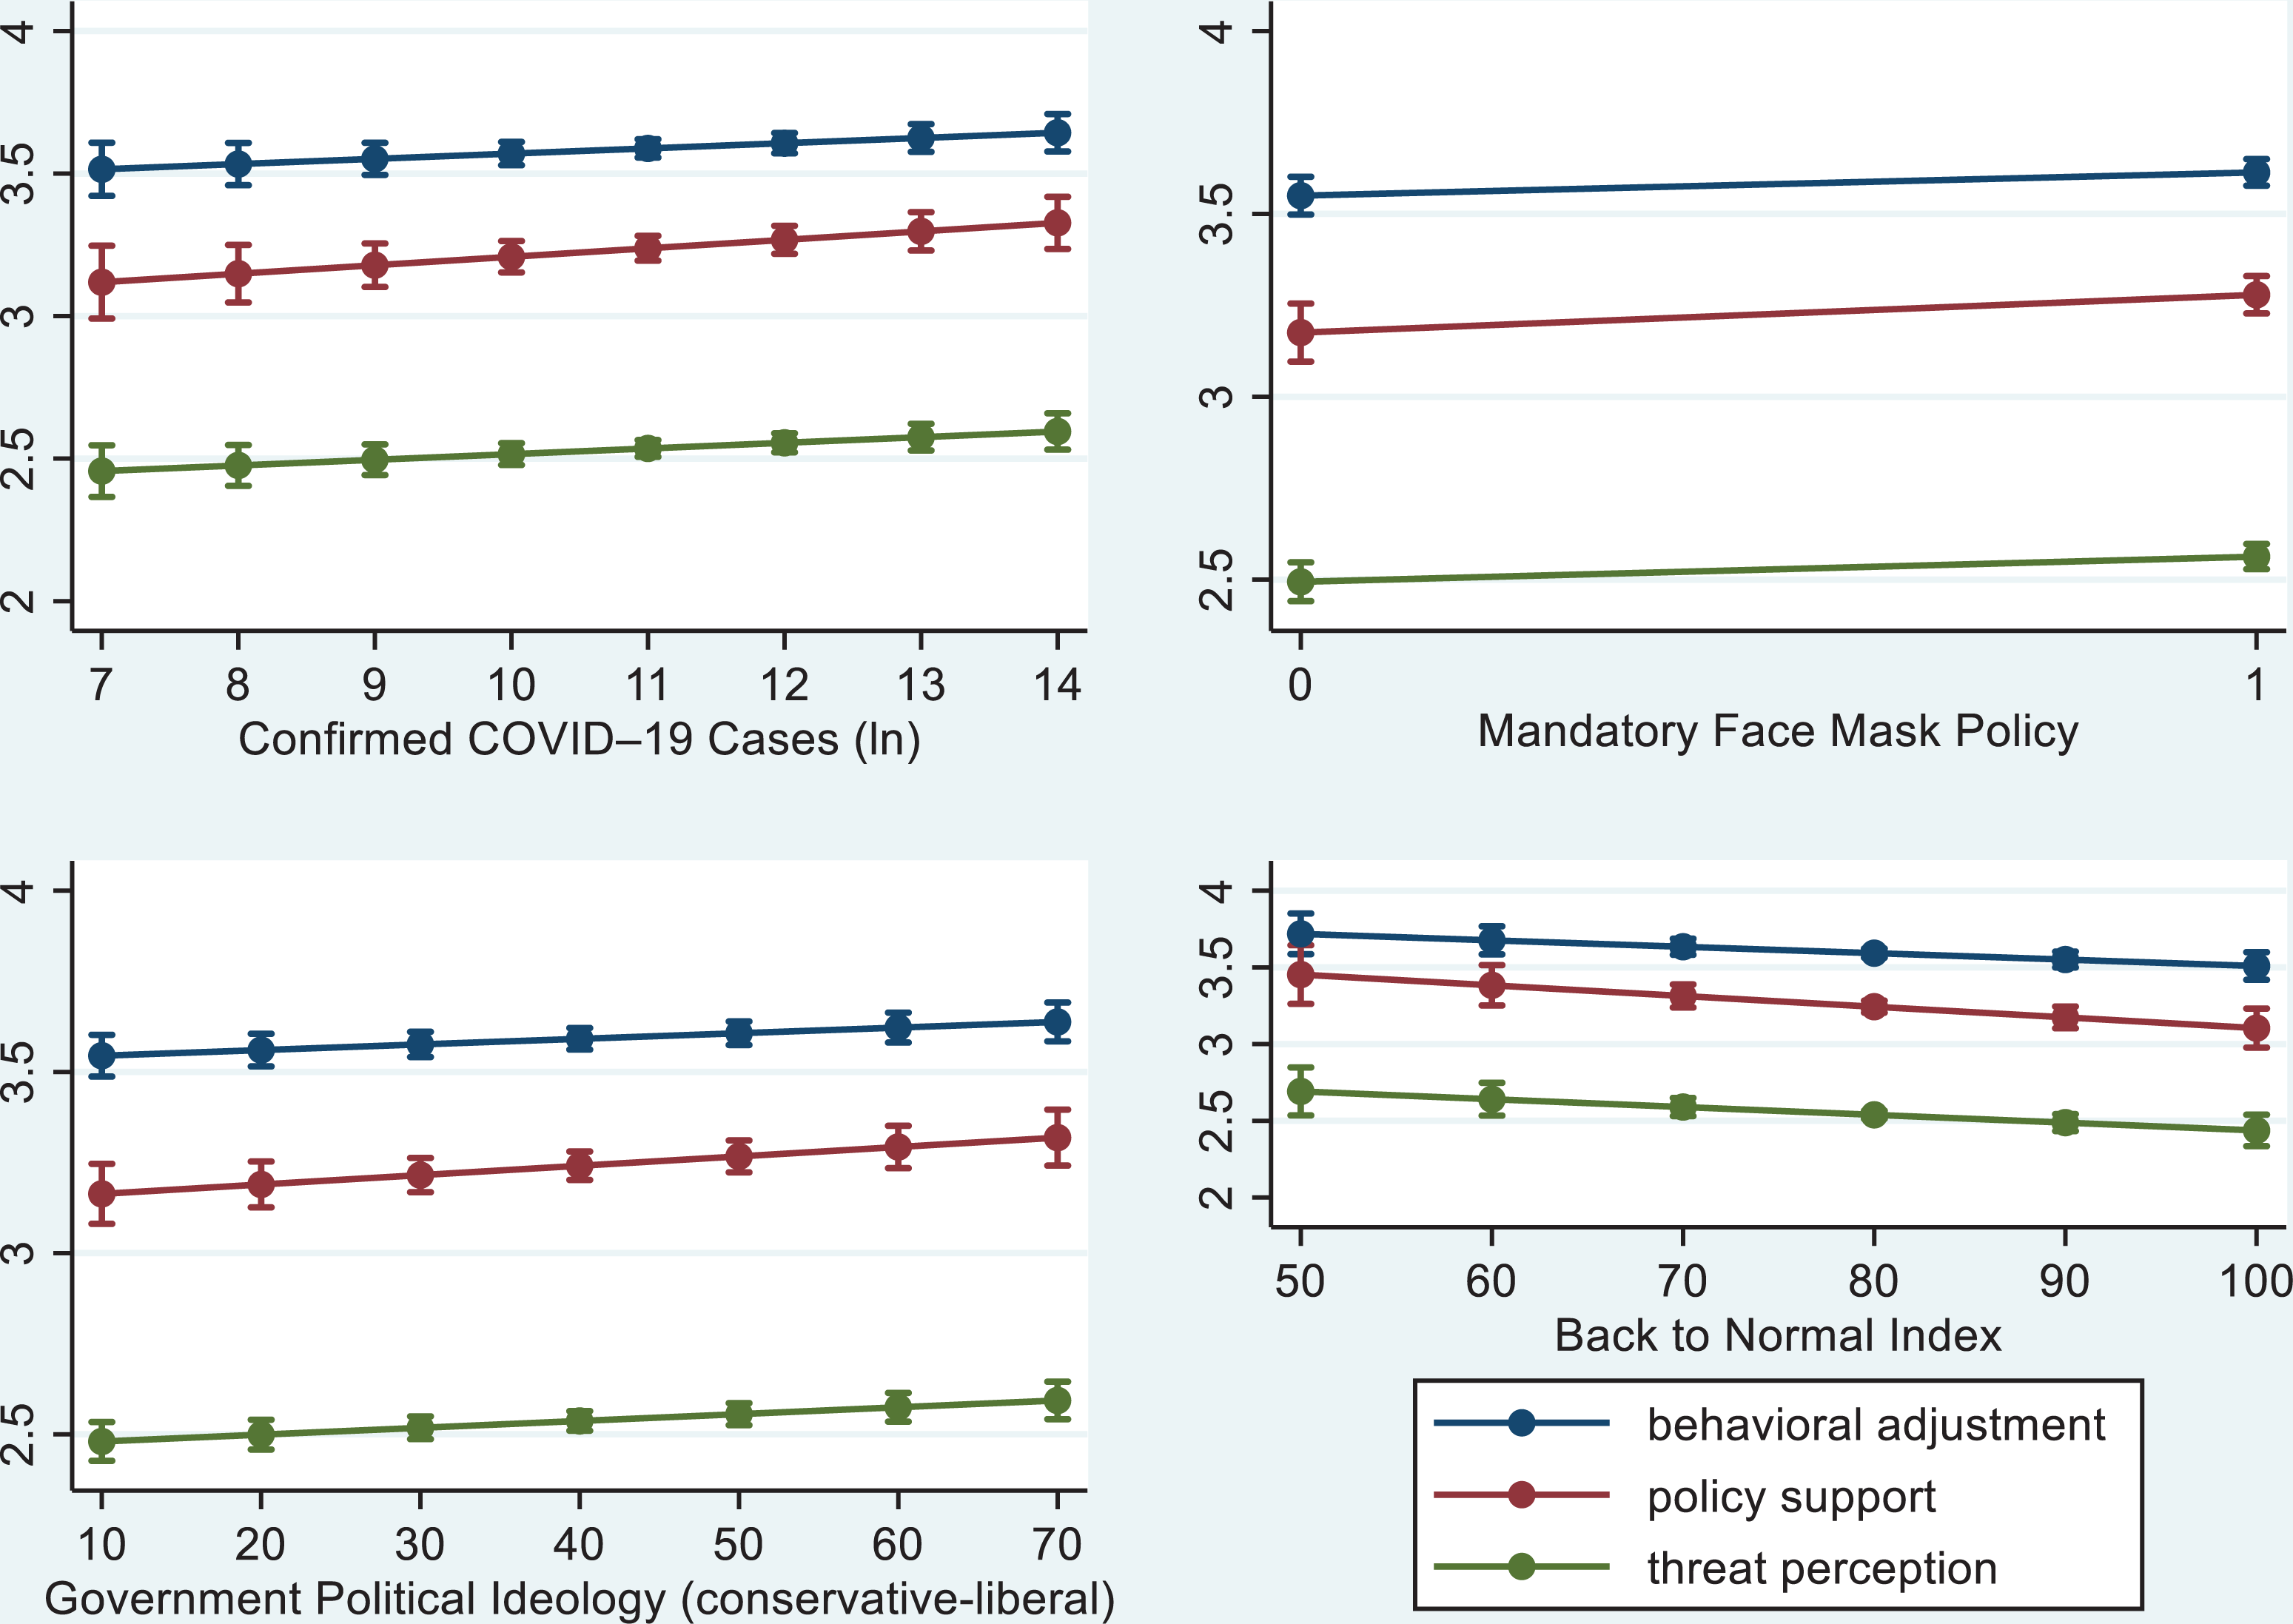
The Influence of state-level factors on public response to COVID-19.
Discussion
Summary
The COVID-19 pandemic has afflicted Americans for more than a year with probably an extended period to come. The public response is crucial to prevent transmitting the disease and slowing the death toll. In this study, we systematically examine the effects of multilevel determinants on a comprehensive measure of American public response to this pandemic. At the state level, the exponential growth of cases can incentivize people to perceive this issue as more urgent, leading to perceptions and behaviors to mitigate its threat. In addition, the state governments with different political ideologies (liberal or conservative) have sent contrasting messages about COVID-19 from the outset. The states also formulate different policies such as whether to mandate face masks. Thus, individuals embedded in different political contexts assess and react to the pandemic differently. Furthermore, a better economic recovery can send a misleading message to the public that the COVID-19 outbreak is under control. As a result, people tend to neglect growing cases and are less likely to take preventive actions. At the individual level, the public response is influenced by age, education, religious background, and political orientation. Meanwhile, the generalized trust in each other can also coordinate individual responses and shape the course of the pandemic.
Limitations
From a spatial perspective, this study merges individual-level data with state-level data. Subsequent research should explore data at a finer geographic level (county-level or city-level) and explore whether the underlying mechanism identified in this study remains. From a longitudinal perspective, the data of this study is cross-sectional and cannot reveal temporal changes. Future studies should continue tracking the public response using data of multiple time points and examine the dynamics of public response over time. In addition, the sample of only English speakers results in external validity issues. Thus, this study can be improved with more inclusive data composed of English-speaking and non-English-speaking populations. Regrettably, no measures of personal experience with COVID-19 at the individual level are included in this study. Future studies should consider measures of personal experience and their interactions with state-level measures of COVID-19 cases. Finally, the response rate of this survey (∼3%) is low. The non-response error, represented by the differences between respondents and non-respondents, might affect any descriptive statistics (e.g., percent of people who support policies to prevent COVID-19).
Significance
Since its outbreak, COVID-19 has posed unprecedented risks to the American public health and wellbeing. The present study identifies that differences in the public response to the pandemic stem not only from variations in individual characteristics but also from variations in contextual factors of states where people live. Existing research and news reports have shown that this public health crisis has been politicized and polarized at the individual level with liberals concerning the crisis more than conservatives. We contribute by revealing the influence of state-level political climate. We also add to the literature by identifying the effects of public health and economic factors at the state level on individual response to the pandemic.
Facing these challenges, the federal government under the Trump administration has done little to promote a unified national plan. 16 To maintain public alertness, it would be helpful if the government could provide accurate information about the pandemic in a transparent and timely manner, overcome disagreements due to the political division, enforce uniform mandatory face mask policy, and take precautionary approaches when reopening the economy. In addition, there have been reports showing racial disparities and minority communities have suffered more impact with higher mortality rates and fewer medical resources. Future research using county-level data can examine whether people from areas with more African American populations, Latinos, and Native Americans might respond to the pandemic differently. While the race variable has an insignificant effect on the public response in this study, it is important to note that the survey was conducted in a period of a massive surge of cases nationwide. Thus, people of different races might have similar experiences. However, racial heterogeneity might be revealed in follow-up surveys when the minorities find themselves to have limited resources to recover from the pandemic. Hence, regardless of the insignificant result of race in the present study, from a policy perspective, it would be necessary to allocate the relief funding disproportionately to those counties that have been most affected to assist their efforts to combat and recover from the pandemic.
So What?
What is already known on this topic?
Public response to COVID-19 is influenced by a number of factors, mostly the sociodemographic characteristics at the individual level.
What does this article add?
Differences in the public response to the pandemic also stem from variations in contextual factors such as the public health condition, political climate, and economic recovery of the state where people live.
What are the implications for health promotion practice or research?
To manage the pandemic effectively, the government needs to treat COVID-19 as a public health issue rather than a political issue. Decisions regarding the face mask mandate or economy reopening should be based on the best available scientific evidence.
Supplemental Material
Supplemental Material, sj-pdf-1-ahp-10.1177_08901171211017286 - Understanding the Effects of Individual and State-Level Factors on American Public Response to COVID-19
Supplemental Material, sj-pdf-1-ahp-10.1177_08901171211017286 for Understanding the Effects of Individual and State-Level Factors on American Public Response to COVID-19 by Feng Hao and Wanyun Shao in American Journal of Health Promotion
Footnotes
Authors’ Note
F.H. conceptualized the study and performed statistical analyses. F.H. and W.S. wrote the manuscript. All authors approve of the final version of the manuscript.
Declaration of Conflicting Interests
The author(s) declared no potential conflicts of interest with respect to the research, authorship, and/or publication of this article.
Funding
The author(s) received no financial support for the research, authorship, and/or publication of this article.
Supplemental Material
Supplemental material for this article is available online.
References
Supplementary Material
Please find the following supplemental material available below.
For Open Access articles published under a Creative Commons License, all supplemental material carries the same license as the article it is associated with.
For non-Open Access articles published, all supplemental material carries a non-exclusive license, and permission requests for re-use of supplemental material or any part of supplemental material shall be sent directly to the copyright owner as specified in the copyright notice associated with the article.