
Abstract
Purpose
This study examined the relationship between employee outcomes and employer implementation of evidence-based interventions (EBIs) for chronic disease prevention.
Design
Cross-sectional samples collected at 3 time points in a cluster-randomized, controlled trial of a workplace health promotion program to promote 12 EBIs.
Setting
King County, WA.
Sample
Employees of 63 small, low-wage workplaces.
Measures
Employer EBI implementation; 3 types of employee outcomes: perceived implementation of EBIs; perceived employer support for health; and health-related behaviors, perceived stress, depression risk, and presenteeism.
Analysis
Intent-to-treat and correlation analyses using generalized estimating equations. We tested bivariate associations along potential paths from EBI implementation, through perceived EBI implementation and perceived support for health, to several employee health-related outcomes.
Results
The intent-to-treat analysis found similar employee health-related behaviors in intervention and control workplaces at 15 and 24 months. Workplaces implemented varying combinations of EBIs, however, and bivariate associations were significant for 4 of the 6 indicators of physical activity and healthy eating, as well as perceived stress, depression risk, and presenteeism. We did not find significant positive associations for cancer screening and tobacco cessation.
Conclusion
Our findings support broader dissemination of EBIs for physical activity and healthy eating, as well as more focus on improving employer support for employee health. They also suggest we need better interventions for cancer screening and tobacco cessation.
Purpose
Workplaces and workplace health promotion programs (WHPPs) offer an important opportunity for delivering evidence-based interventions (EBIs) to promote healthy behaviors and decrease chronic diseases. 1 More than 61% of adults of working age are currently employed, 2 and EBIs to address cancer screening, healthy eating, physical activity, and tobacco use can be delivered via the communications, physical, and social environments of the workplace.3-8 Small workplaces (< 200 employees) offer a particularly important opportunity to deliver WHPPs because they make up more than 90% of workplaces, but they have little capacity to implement EBIs to prevent chronic diseases. 9 They are also poorly served by commercial vendors of WHPPs, 9 and they rarely offer comprehensive WHPPs. 10
The literature about WHPPs is large and generally positive about their effectiveness and cost-effectiveness.11,12 There are, however, few randomized controlled trials (RCTs) of WHPPs, and 2 recent RCTs and a systematic review have raised concerns about effectiveness.13-15 A 2016 trial in a large U.S. warehouse retail company delivered a WHPP to 32,794 employees in 20 treatment and 140 control worksites. 14 After 18 months, employees in the treatment worksites were modestly but significantly more likely to engage in regular exercise and to actively manage their weight, but there were no other observed differences in self-reported behaviors and outcomes, clinical markers, medical spending and utilization, or productivity outcomes. A 2 year trial from 2016 to 2018 in the University of Illinois’s workplace delivered a WHPP to 4834 of its employees (two-thirds of whom were in the treatment group, one-third in the control). 13 The only significant outcomes were modest increases in health screening and the employees’ perception that the university places a priority on health and safety. These 2 studies have resulted in caution about the effectiveness of WHPPs. 16 More recently, a systematic review included 25 workplace studies and found no evidence for a positive return-on-investment in the short term. 15
A recently published report of the results of a RCT sheds further light on WHPP effectiveness.
17
The RCT studied HealthLinks, a low-cost WHPP that assists employers in implementing 12 EBIs for chronic disease prevention in small, low-wage workplaces. HealthLinks makes use of the Integrated Behavior Model and its 3 main constructs, that changes in attitudes, perceived norms, and personal agency (perceived control and self-efficacy) lead to changed intentions and behaviors.
18
The 12 EBIs include policy and environmental approaches (affecting norms and personal agency) and related communications (affecting attitudes and norms) to promote employees’ health-related behaviors: cancer screening, healthy eating, physical activity, and tobacco cessation. Before conducting the trial, the authors had 3 sets of hypotheses. First, we hypothesized that if the EBIs were implemented, employees’ health-related behaviors would increase. Second, we hypothesized that we would find bivariate associations among outcomes along a potential path beginning with (1) awareness of implementation of these approaches (affecting attitudes), and moving to (2) behavior-specific perceptions of employer support for these behaviors (affecting norms and personal agency), and (3) the behaviors themselves (Figure 1). Third, we hypothesized that implementation of EBIs, measured overall, would be associated with decreases in perceived stress, depression risk, and presenteeism. We found in an intent-to-treat analysis that 2 versions of HealthLinks, with and without workplace wellness committees, did increase employers’ implementation of EBIs, the primary outcome. We also found increases in employees’ perceptions of employer support for (a) their health overall and (b) 3 of the 4 health-related behaviors—cancer screening, healthy eating, and physical activity. Correlation analysis: conceptual model.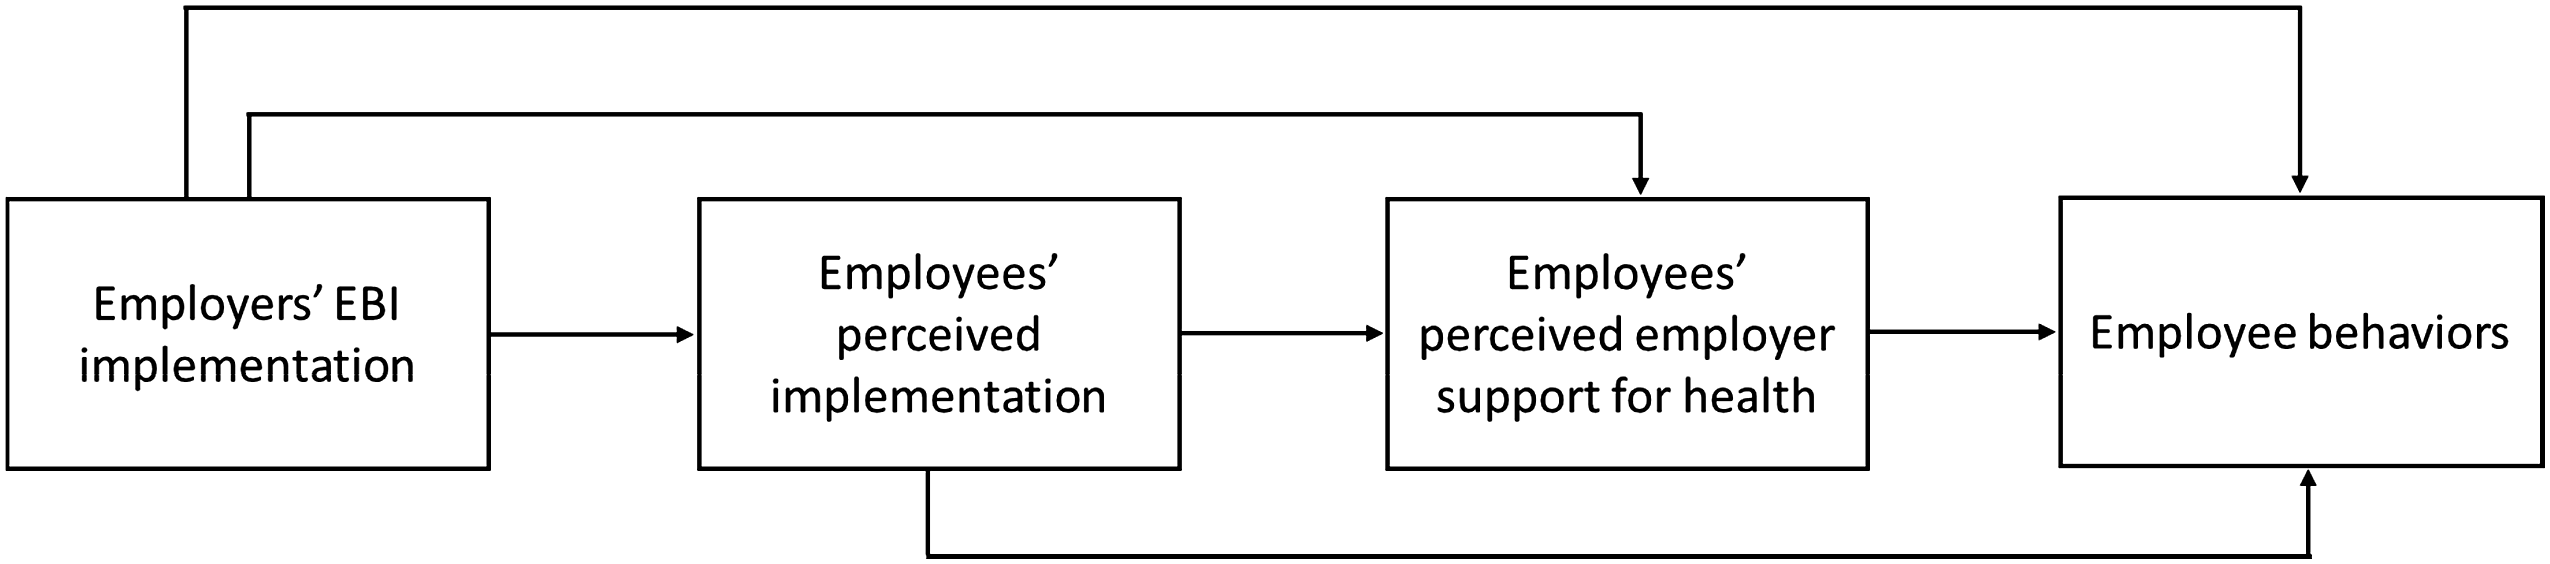
In this paper, we look at the effect of HealthLinks on more distal employee outcomes—the 4 health-related behaviors, as well as perceived stress, depression risk, and presenteeism. We conducted an intent-to-treat analysis for these outcomes, but employers who participate in HealthLinks select for implementation only a subset of EBIs from a broad menu of options. Thus, every employer in the intervention arms of the HealthLinks RCT implemented a different set of EBIs, and not all employers addressed all 4 health behaviors. To help us better understand the relationships between these outcomes and employers’ EBI implementation, we also conducted bivariate correlation analyses consistent with the stated hypotheses.
Methods
Design
The HealthLinks trial was a three-arm cluster-randomized trial, with worksites as the unit of randomization. Worksites participated in the trial for 2 years. The trial protocol and main findings appear in detail elsewhere.17,19 Briefly, HealthLinks consisted of 4 phases: (1) assessment by the interventionist of the employer’s baseline implementation of EBIs; (2) based on response to the assessment, recommendation to the employer of which EBIs to implement; (3) EBI implementation by the employer; and (4) EBI maintenance. The study included an Implementation Survey and an Employee Survey administered at 3 time points (baseline, 15 months, and 24 months). Our Institutional Review Board (IRB) approved the study design and consent procedures. Each participating workplace signed a Memorandum of Understanding that indicated organizational consent. Individual employees who completed surveys received an information sheet on the study but did not sign a consent form, which was deemed unnecessary by the IRB because of the non-sensitive nature of the questions asked.
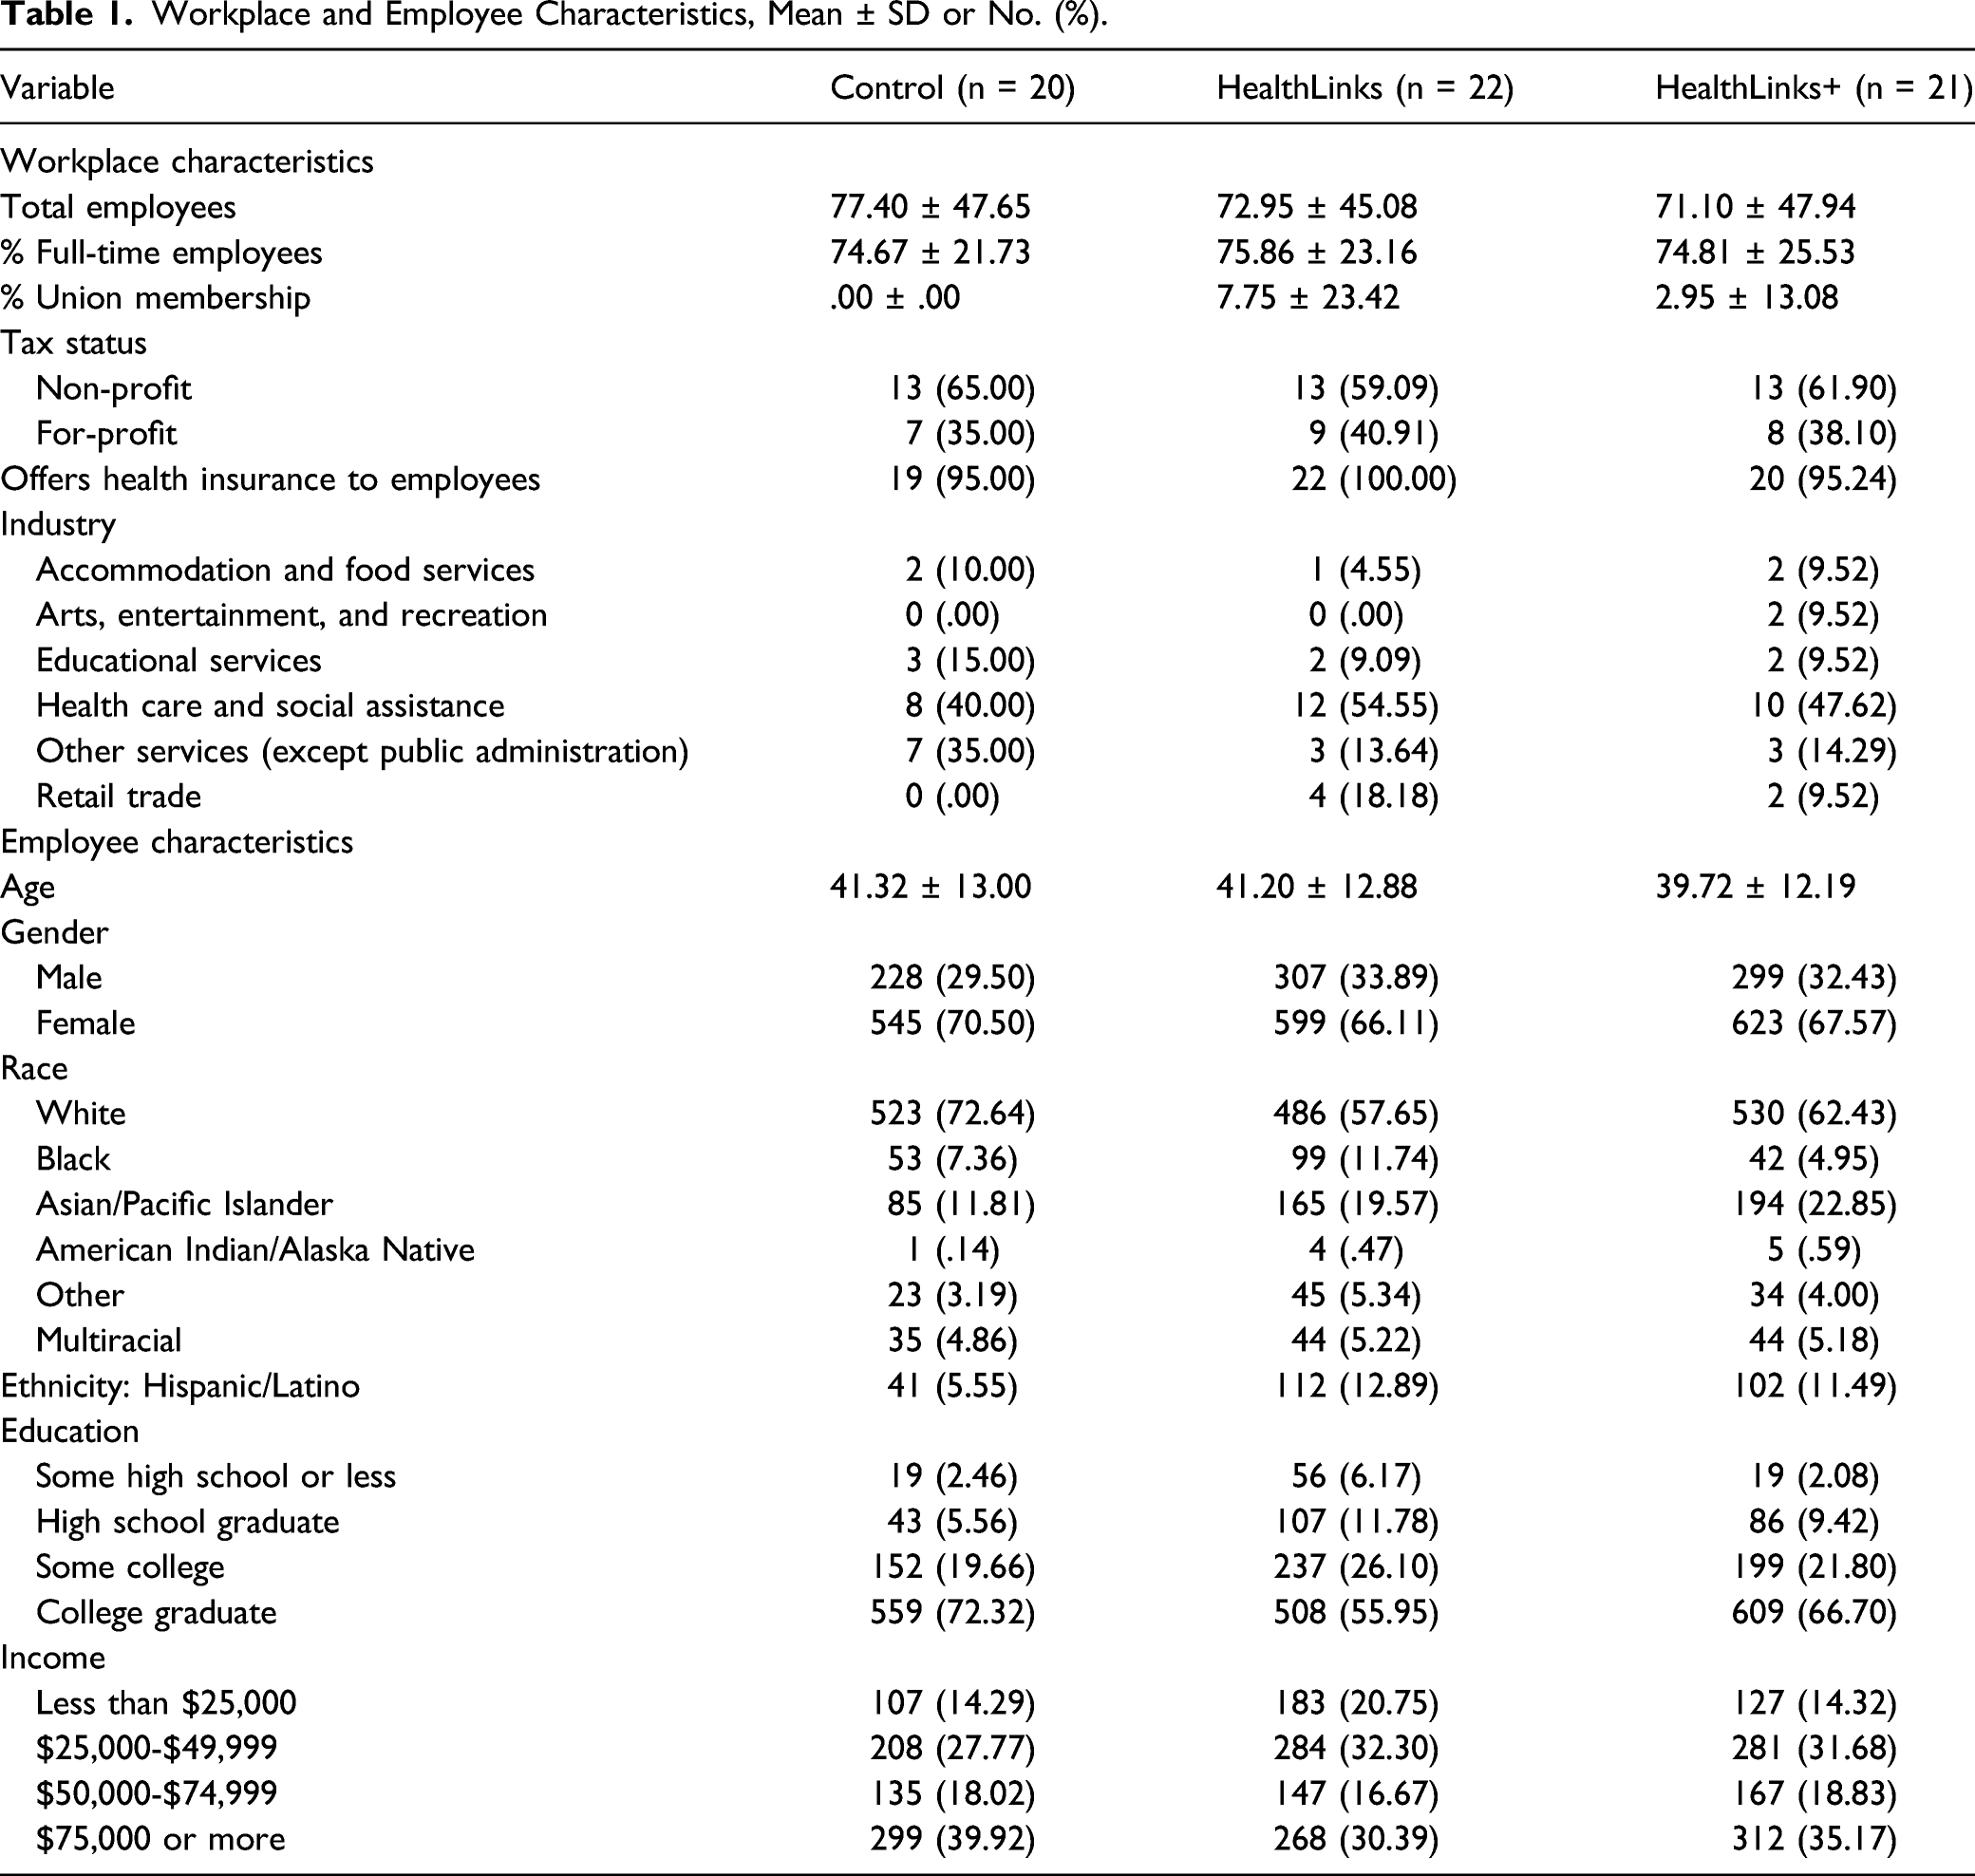
Sample
Workplace and Employee Characteristics, Mean ± SD or No. (%).
Measures
We used the Implementation Survey to measure employers’ EBI implementation and the Employee Survey to measure employees’ perceived implementation, employees’ perceived employer support for health, as well as employees’ health-related behaviors, perceived stress, depression risk, and presenteeism. We describe these measures in detail below.
Evidence-Based Intervention Implementation
The Implementation Survey included items that characterized worksite implementation of EBIs to promote cancer screening, healthy eating, physical activity, and tobacco cessation. The EBIs fell into 3 categories: health-related policies; programs (health-related programs that employees chose to participate in, eg, healthy eating program, physical-activity program, and telephone tobacco cessation counseling); and communications (print, multimedia, or other communications to employees about health). For each of the EBIs, the survey included 5-10 items to assess level of implementation.
For each EBI, we combined items using a weighted algorithm to form an implementation score from 0 to 1.00, with 0 indicating no implementation and 1.00 indicating full implementation. We scored EBI categories (policy, program, and communications) by taking the mean of the EBI scores within that category. The overall EBI score for each employer was created by summing the EBI category scores and taking the mean; we used this approach to minimize communications EBIs driving the total score, as there were more communications EBIs than EBIs in other categories. 19
We calculated a total implementation score to reflect the proportion of all 12 EBIs that were implemented. Even though employers picked a subset of EBIs to implement at the start of the intervention, they were not confined to the set that they chose. Over the course of HealthLinks implementation, they could decide to try to implement additional EBIs, and the interventionist would support those attempts. For this reason, as well as our desire to gauge how much employers do across all EBIs HealthLinks promotes, we used the total EBI score in some analyses.
Perceived Implementation
For cancer screening, employees reported how often their employer provided information about cancer screening, specifically when men and women should be screened for cancer (1 = never to 5 = always). For healthy eating, employees reported how often their employer offered healthy foods at meetings or other company events (1 = never to 5 = always); provided information about nutritious foods and healthy eating (1 = never to 5 = always); sold healthy beverages such as water, milk, or unsweetened tea (1 = yes); and sold healthy food items such as fruits, salads, or low-calorie snacks or meals (1 = yes).
For physical activity, employees answered how often their employer provided information about physical activity recommendations and how to meet them (1 = never to 5 = always); the extent to which physical activity breaks were encouraged during work hours (reverse coded as 1 = not allowed to 4=encouraged); if their employer offered a physical activity program (1 = yes); and the extent to which their employer provided information about physical activity resources such as nearby gyms, parks, walking trails, or other places for physical activity (1 = never to 5 = always). For tobacco cessation, employees indicated how often their employer provided tobacco cessation information (1 = never to 5 = always) and if they had ever seen information about a tobacco quitline at their workplace (1 = yes).
Perceived Employer Support for Health
Employees answered a total of 4 items on the extent to which they agreed their employer supported them in trying to obtain recommended cancer screenings, eat healthy foods and drink healthy beverages, live an active life, and provided support for tobacco cessation. We also measured workplace support for health and supervisor support for health with 2 additional items asking employees to indicate the extent to which they believed their workplace and supervisor supported them in living a healthier life, respectively. Response options for all perceived support measures ranged from strongly disagree ( = 1) to strongly agree ( = 5).
Employee Behaviors, Perceived Stress, Depression Risk, and Presenteeism
We measured employees’ health-related behaviors, perceived stress, depression risk, and presenteeism. For cancer screening, we created a dichotomous measure for cancer screening status (1 = current on all recommended screenings). We followed guidance from the U.S. Preventive Services Task Force 20 at the time to determine whether employees were current on screenings for breast cancer (women aged 50-74 who received mammogram within past 2 years); cervical cancer (women aged 21-65 who received pap test within past 3 years); and colon cancer (all aged 50-75 who received FOBT in past year, sigmoidoscopy in past 5 years, or colonoscopy in past 10 years). We included only employees who were eligible for 1 or more screenings in our calculation of this variable.
For healthy eating, employees reported how many times per month they ate breakfast, lunch, or dinner at fast food establishments (open-ended question); how often they ate food while engaged in another activity (1 = never to 5 = always); and how often they drank soda (1 = never to 6 = 2 or more times per day). We adapted these measures from previous studies.21,22 Based on recommended dietary guidance, we created dichotomous measures for fast food consumption (1 = 4 or more times per month); secondary eating (1 = always/most of the time); and soda consumption (1 = drank soda 2 or more times a day). Employees also reported how many fruit and vegetable servings they ate each day (0 to 11+). We created a dichotomous measure for fruit and vegetable servings (1 = 5 or more servings per day) for the intent-to-treat analysis.
We used the Godin Leisure-Time Physical Activity Questionnaire 23 to assess physical activity. We calculated a continuous measure for moderate or strenuous leisure activity based on how many times employees reported moderate and strenuous exercise for more than 10 minutes during their free time in the past week. Based on scoring guidelines, 23 we created a categorical variable denoting insufficient ( = 0), moderate ( = 1), or sufficient ( = 2) physical activity for our intent-to-treat analysis. We measured sweat during physical activity by asking employees to report how often they engaged in regular activity during their free time long enough to make them sweat (1 = rarely/never to 3 = often).
For tobacco cessation, we assessed quit attempt by asking current smoking employees if they had stopped smoking for 1 day or longer during the past 6 months because they were trying to quit smoking (1 = yes). We also measured tobacco use (1 = yes) for our intent-to-treat analysis; employees were defined as a tobacco user if they were a current smoker (ie, had smoked 100 cigarettes in their life and currently smoked every day or some days) and/or a current smokeless tobacco user (ie, currently chewed tobacco, snuff, or snus every day or some days).
We assessed perceived stress with a four-item scale 24 asking employees to report how often in the past month they felt: unable to control the important things in their life; confident about their ability to handle personal problems; things were going their way; and difficulties were piling up so high they could not overcome them. Item responses ranged from never ( = 0) to very often ( = 4). Following scoring guidelines, 24 we reverse coded the positively worded items and created a total perceived stress score by summing scores across all items. We created a dichotomous measure for analysis; similar to prior studies,24,25 we defined high stress ( = 1) as having a total score of 9 or higher, or 1 standard deviation above our population mean.
We used the Patient Health Questionnaire-2 26 to measure depression risk; employees reported how often in the past month they were bothered by having little interest or pleasure in doing things and feeling down, blue, or hopeless (1 = not at all to 4 = nearly every day). Based on scoring guidelines, 26 we classified employees with a total score of 3 or higher as being at risk for depression ( = 1). Lastly, we measured health-related presenteeism with an item from the Work Productivity and Activity Impairment Questionnaire 27 that asked employees to report how much their health problems affected their productivity while at work (0 = had no effect on my work to 10 = completely prevented me from working). We divided total scores by ten (eg, 3/10 = .30) to calculate a percentage for presenteeism.
Additional Variables
We also included data on the following for analysis: trial arm (0 = delayed control; 1=HealthLinks; and 2 = HealthLinks + wellness committee), data-collection time point (1 = baseline; 2 = 15 months; and 3 = 24 months), workplace size at randomization (0 = <50 employees; 1 = 50+ employees), and workplace industry at randomization (0 = group 1: accommodation and food services; other services excluding public administration; and retail trade; 1 = group 2: arts, entertainment, and recreation; education; and health care and social assistance). We categorized industries into groups based on findings from prior studies showing that some industries are more likely to participate in health promotion studies than others.28,29 We wanted to ensure that industries likely to be underrepresented (group 2) were evenly distributed across study arms. For the intent-to-treat analysis, we created dummy-coded indicators of both treatment groups (HealthLinks and HealthLinks+) and follow-up time points (15 months and 24 months).
Analysis
We analyzed data in Stata version 15. 30 We conducted an intent-to-treat analysis; that is, we estimated the effect of the intervention according to which arm worksites were randomized to, regardless of whether they actually implemented EBIs (all worksites in the intervention arms completed the core components of the HealthLinks intervention). We used the same modeling procedures for the intent-to-treat analysis as reported in the main-outcomes manuscript. 17 Data from all 3 waves were included in the regression models. We included the treatment group indicators, the time period indicators, the interaction between treatment indicators and time period indicators, workplace industry at randomization, and workplace size at randomization as additional covariates. We used generalized estimating equations (GEE) with an exchangeable correlation structure to handle within-worksite correlation, and produced robust standard errors to ensure proper inference should the working correlation structure be misspecified. Because individuals are nested within worksites, the analysis can handle misspecification of the intra-individual correlation due to the inability to link those individuals over time. Following the model fit from GEE, we used the Wald test to compare the intervention groups with the control group at 15 months and 24 months. We computed P-values based on Wald chi-squared test statistics with 2 degrees of freedom and tested whether the intervention groups had the same mean as the control group at 15 months and 24 months.
For the correlation analyses, we produced a series of structured linear marginal models to test bivariate associations among EBI implementation, perceived implementation, perceived employer support for health, employee health-related behaviors, stress, depression risk, and presenteeism (see Figure 1 below for a general conceptual model). Within-worksite correlation across the 3 time periods was handled by generalized estimating equations. In total, we carried out 6 tests for cancer screening; 33 for healthy eating; 21 for physical activity; nine for tobacco cessation; and 11 for perceived stress, depression risk, and health-related presenteeism. Models included the behavioral, perceived stress, depression risk, and presenteeism variables, in addition to the following covariates: trial arm, data-collection time point, workplace size at randomization, and workplace industry at randomization. We restricted our analyses for tobacco cessation to current smokers.
Results
Intent-to-Treat Analysis
Intent-to-Treat Analysis, Employees’ Health Behaviors at Baseline, 15 Months, and 24 Months (% of Employees Indicating Behavior).
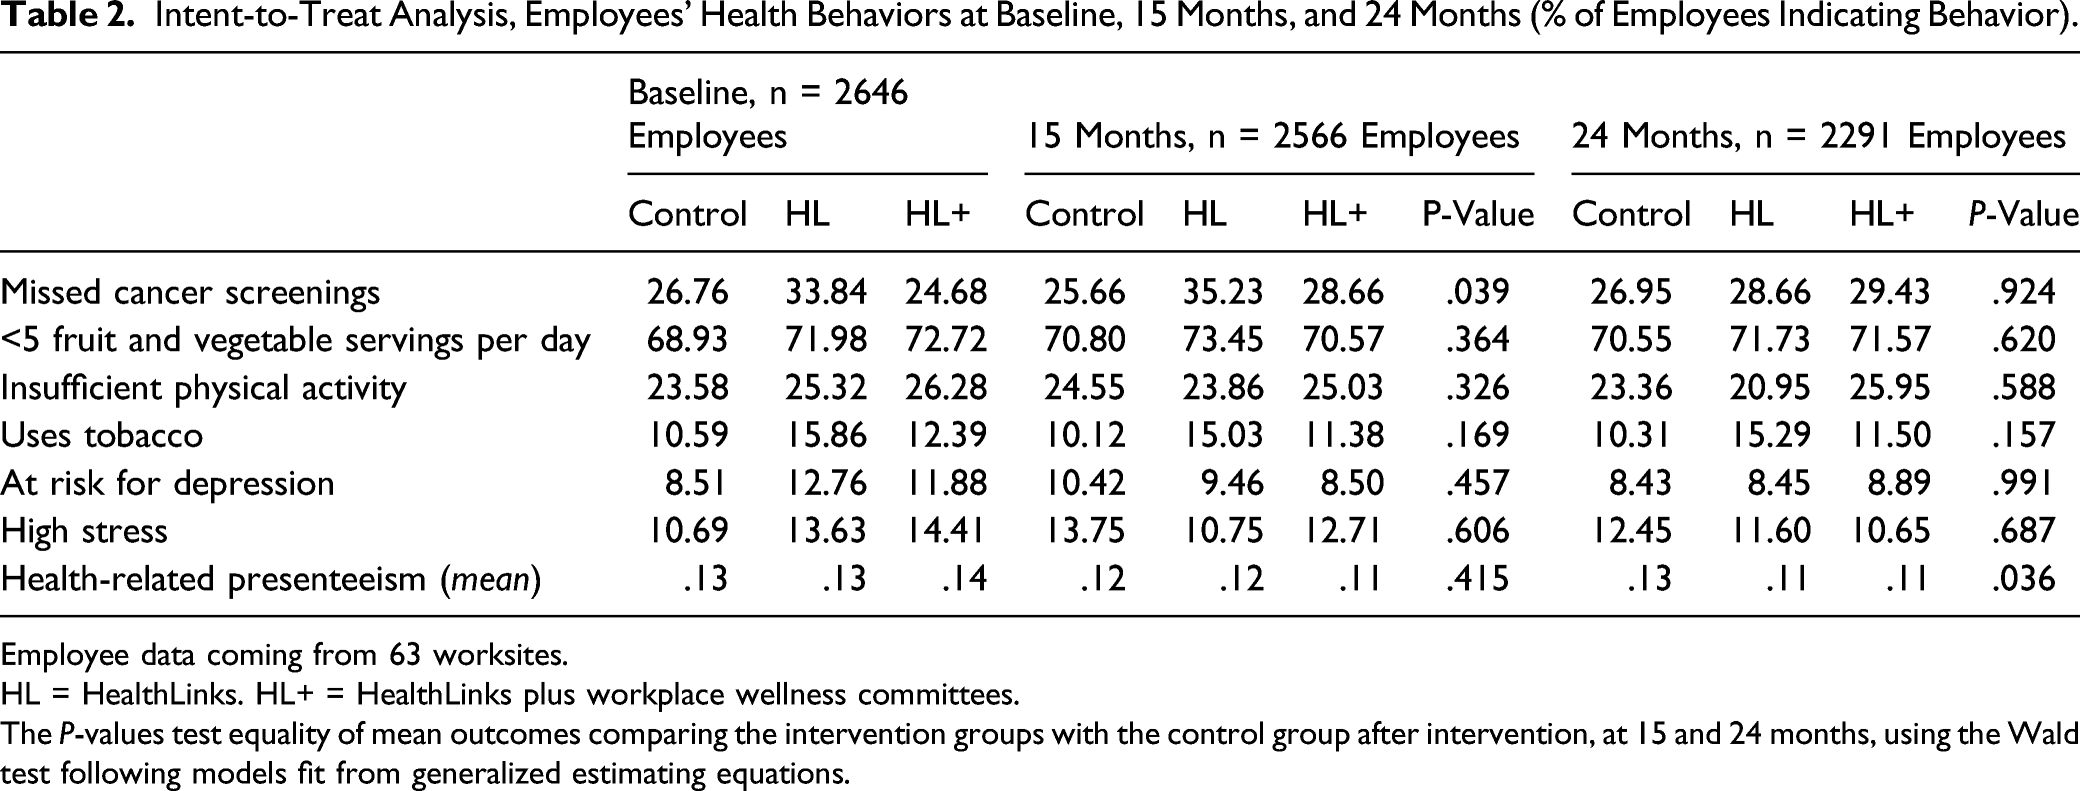
Employee data coming from 63 worksites.
HL = HealthLinks. HL+ = HealthLinks plus workplace wellness committees.
The P-values test equality of mean outcomes comparing the intervention groups with the control group after intervention, at 15 and 24 months, using the Wald test following models fit from generalized estimating equations.
Correlation Analysis
Bivariate Correlation Analyses.
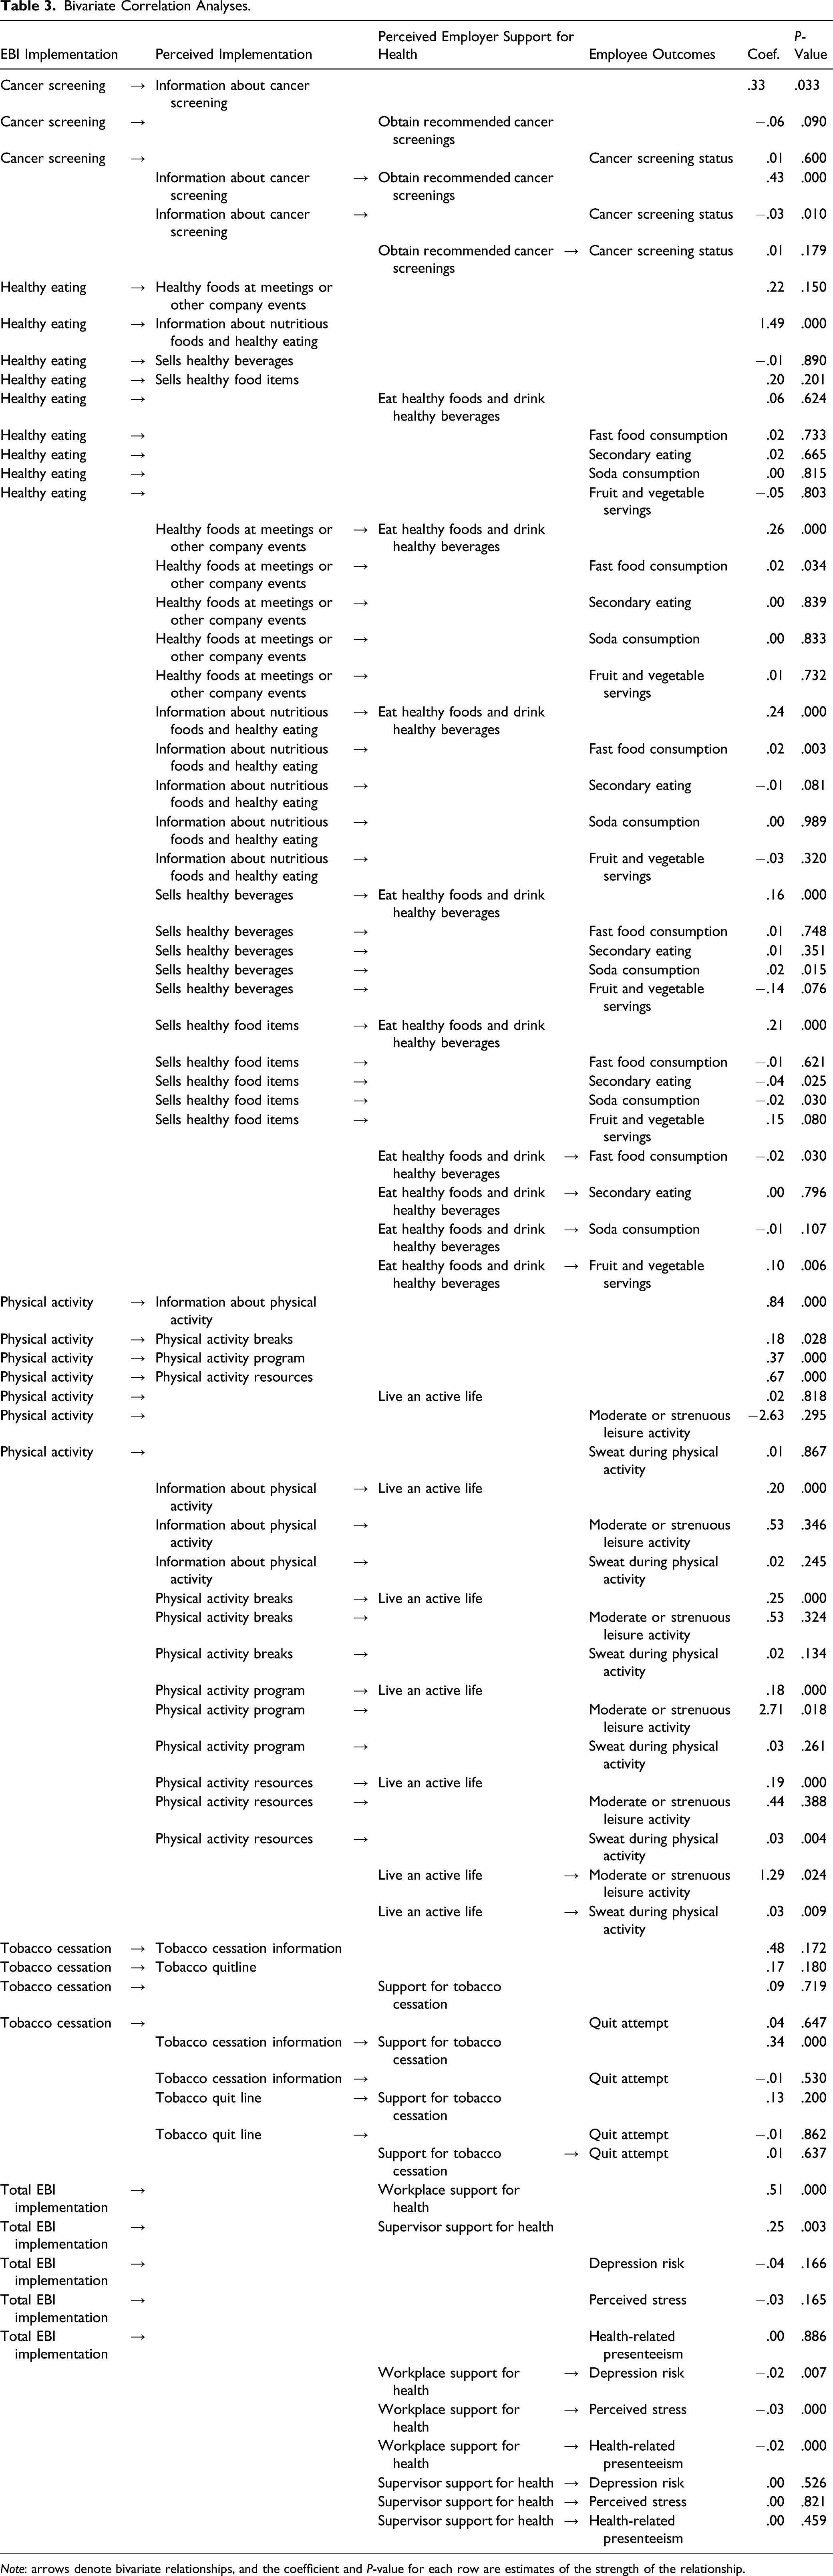
Note: arrows denote bivariate relationships, and the coefficient and P-value for each row are estimates of the strength of the relationship.
Cancer Screening
Evidence-based interventions implementation was associated with perceived implementation of providing information about cancer screening (β = .33; P = .033), which was associated with perceived employer support to obtain recommended cancer screenings (β = .43; P < .001). Perceived support to obtain recommended cancer screenings was not associated with cancer screening status.
Healthy Eating
Evidence-based interventions implementation was associated with only 1 of 4 perceived implementation measures—providing information about nutritious foods and healthy eating (β = 1.49, P < .001). However, all 4 measures of perceived implementation listed here were associated with perceived support for eating healthy foods and drinking healthy beverages: providing healthy foods at meetings or other company events (β=.26, P<.001); providing information about nutritious foods and healthy eating (β = .24, P < .001); selling healthy beverages (β = .16, P < .001); and selling healthy food items (β = .21, P < .001). Perceived support for eating healthy foods and drinking healthy beverages was negatively associated with fast food consumption (β = −.02, P = .030) and positively associated with fruit and vegetable servings (β = .10, P = .006), but was not associated with secondary eating or soda consumption.
Physical Activity
Evidence-based interventions implementation was associated with all 4 measures of perceived implementation: provision of information about physical activity (β = .84, P < .001), encouragement of physical activity breaks (β = .18, P = .028), offering a physical activity program (β = .37, P < .001), and provision of information about physical activity resources (β = .67, P < .001). All 4 measures of perceived implementation were associated with perceived support to live an active life (β′s .18-.25, p’s < .001). Perceived support for living an active life was associated with both measures of employee physical activity: moderate or strenuous leisure activity (β = 1.29, P = .024) and sweat during physical activity (β = .03, P = .009).
Tobacco Cessation
Employees’ perceived implementation of tobacco cessation information was associated with perceived support for tobacco cessation (β = .34, P < .001). Evidence-based interventions implementation was not associated with perceived implementation of tobacco cessation information or tobacco quitlines. Perceived support for cessation was not associated with employees’ quit attempts.
Perceived Stress, Depression Risk, and Presenteeism
Total EBI implementation was associated with workplace support for health (β = .51, P<.001), which was associated with decreased depression risk (β = −.02, P = .007), decreased perceived stress (β = −.03, P < .001), and decreased health-related presenteeism (β = −.02, P < .001). Total EBI implementation was also associated with supervisor support for health (β = .25, P = .003), but supervisor support for health was not associated with depression risk, perceived stress, or health-related presenteeism.
Discussion
The previous publication of the trial of the HealthLinks program reported that both versions substantially and significantly increased employers’ use of EBIs and employees’ perceptions of EBI implementation and of employer support for health-related behaviors. 17 In the additional analyses reported here, we did not find that HealthLinks changed employees’ health-related behaviors, perceived stress, depression risk, or presenteeism, either in our intent-to-treat analysis by treatment arm or in our analyses that correlated EBI implementation with these employee outcomes. We did, however, identify bivariate links from employers’ EBI implementation, through employees’ perceived implementation and perceived employer support, to 4 of 6 indicators of healthy eating and physical activity. We also identified bivariate links from EBI implementation to workplace support for health and from that support to perceived stress, depression risk, and health-related presenteeism. These correlations suggest potential pathways from EBI implementation to these 5 outcomes. These findings support wider dissemination of the EBIs for physical activity and healthy eating and greater emphasis on employer support for healthy behaviors. They also suggest the need for better interventions for cancer screening and tobacco cessation.
The findings are important, because HealthLinks is designed for small workplaces (which are underserved even though they are the majority of workplaces in the U.S.), and because the cost to workplaces of implementing HealthLinks, measured in a separate study, is low, roughly $7 per employee per month. 31 All 5 outcomes are important to employers. Healthy eating and physical activity relate directly to obesity, which continues to increase rapidly in the U.S. and is a leading underlying cause of premature death. 32 Stress, depression, and presenteeism are substantial causes of lowered employee productivity. 33 Stress and depression can lead to presenteeism, which lowers productivity. 33 In addition, a 2004 study that integrated the results of 5 large studies estimated that 18% to 60% of employers’ costs for 10 leading medical conditions are related to presenteeism. 34
Even though our intent-to-treat analyses did not show effects on these outcomes, what might explain these potential pathways identified by our correlation analyses? Individual worksites selected unique subsets of EBIs to implement, and often made substantial implementation gains for the EBIs they chose. Given the differences in selected EBIs between worksites, overall implementation of the EBIs was modest—peaking at 51% in both arms at 15 months, even though the increases in implementation were substantial—32-34% absolute in the 2 treatment arms, vs no change in the control arm. Any effect of EBI implementation on these outcomes might not have been detectable in an overall intent-to-treat analysis, given that workplaces implemented only half of the EBIs.
Our findings on the relationship between WHPP implementation and improved productivity-related outcomes align with the current literature. The previously discussed University of Illinois RCT of a WHPP found a significant increase in treatment arm employees’ perception that the university places a priority on health and safety. 13 A cross-sectional study conducted with 3528 employees of Washington State government found that an increased perception of support for overall health and physical activity was associated with decreased presenteeism, even after controlling for self-reported health behaviors. 35
“SO WHAT?”
What is already known on this topic?
While the literature on workplace health promotion programs is large and generally positive, recent studies have raised concerns about program effectiveness.
What does this article add?
We used data from a randomized controlled trial that was conducted in small workplaces and showed substantial, significant increases in employers’ implementation of EBIs to promote chronic disease prevention. We conducted additional analyses that identified bivariate correlations among EBI implementation, employees’ perceived implementation and perceived employer support, and 5 employee outcomes: healthy eating, physical activity, perceived stress, depression risk, and health-related presenteeism.
What are the implications for health promotion practice or research?
Our findings support broader dissemination of EBIs for physical activity and healthy eating, as well as more focus on improving employer support for employee health. They also suggest we need better interventions for cancer screening and tobacco cessation.
Our study has several limitations. First, the correlation analysis goes beyond an intent-to-treat analysis and does not show causation. As discussed above, because the implementation of EBIs was modest, and worksites varied in which EBIs they attempted to implement, we feel the correlation analysis may offer insights that the intent-to-treat analysis does not. Second, there may be reverse causation. Perceived EBI implementation may be caused by perceived employer support because perceiving employer support primes employees to be aware of EBI implementation. Third, in the correlation analysis, we tested the significance of many associations between variables. Of the 80 bivariate associations we tested, 40% (33) were significant. Fourth, the trial was not powered for the correlation analysis, so the insignificant findings may be due to inadequate sample sizes. Fifth, 24 months is a long follow-up period but may not have been long enough to show behavior change, especially if worksites implemented new EBIs late in the 15-month intervention period. Sixth, as discussed in the main-outcomes manuscript, 17 we conducted the employee surveys on cross-sectional samples of the employees employed at baseline and follow-up 15 and 24 months later. Because these were high-turnover worksites, we surveyed different, though somewhat overlapping, groups of employees at the 3 time points, but the surveys were anonymous, and individuals could not be linked over time.
Our study also has several strengths. First, it used a randomized design to test the effectiveness of HealthLinks. Second, we surveyed a large number of employees—more than 2200—at 3 time points. Third, we hypothesized the relationships among variables a priori and collected data on perceived implementation and perceived support as part of an analysis we planned at the outset. Fourth, our intervention allowed employers to select the EBIs they felt were most relevant for their employees and most feasible for their workplaces. We believe that small workplaces in different industries have different employee populations and needs, and this semi-tailored approach makes HealthLinks relevant and appealing to employers across a range of industries. Due to the demonstrated effectiveness of HealthLinks (recently rebranded as Connect to Wellness) in supporting the health of employees in small, low-wage workplaces, we are currently engaging in efforts to scale the program up nationally.
Footnotes
Declaration of Conflicting Interests
The author(s) declared no potential conflicts of interest with respect to the research, authorship, and/or publication of this article.
Funding
The author(s) disclosed receipt of the following financial support for the research, authorship, and/or publication of this article: This work was supported by the U.S. Department of Health and Human Services, National Institutes of Health, National Cancer Institute, 5R01CA160217, U.S. Department of Health and Human Services, Centers for Disease Control and Prevention, and National Center for Chronic Disease Prevention and Health Promotion, U48DP005013.
ClinicalTrials.gov Identifier
NCT02005497.
Human Participant Protection
The University of Washington Institutional Review Board reviewed and approved all study materials and procedures.