
Abstract
Purpose
The purpose is to examine predictors of intervention non-compliance and develop a risk stratification score.
Design
Prospective cohort.
Setting
Early care and education (ECE).
Subjects
Early care and education programs (n = 3883) randomly allocated (3:1) to a development (n = 2909) or validation (n = 974) sample.
Intervention
Go NAPSACC provides a structured, web-based process to help improve the health of children around 7 modules (nutrition, physical activity, oral health, breast/infant feeding, farm to ECE, outdoor play, and screen time).
Measures
Program characteristics and participation data are collected via Go NAPSACC tool.
Analysis
Multivariable Lasso logistic regression was used to identify predictors. Discriminative ability was based on area under the ROC curve (AUC).
Results
Overall, ECE program non-compliance (lack of valid pre-/post self-assessment) was 65.5%. Six predictors were retained in the final development model: type of program (P = .002), Child and Adult Care Food Program (CACFP) participation (P = .065), acceptance of subsidies (P < .001), past modules attempted (P < .001), past modules completed (P < .001), and action plans created (P < .001). These factors generated a non-compliance risk score which showed good discrimination in the validation sample (AUC: .922, 95% CI: .903–.940).
Conclusion
Lack of qualitative data limits the ability to fully understand the context of non-compliance; however, this study demonstrates readily available data captured by Go NAPSACC are strong predictors of future success. Early identification of high-risk programs will inform targets for future implementation strategies geared toward improving program success.
Early care and education settings have been identified as targets for health promotion initiatives due to their reach (∼12 million children in the United States) 1 and the time children spend in ECE (∼36 hours/week). 2 Early care and education programs can foster healthy behaviors in children by consistently providing access to healthy foods, limiting unhealthy foods and screen time, integrating active playtime, role modeling healthy behaviors, and teaching skills needed to make healthy choices. 3 Several prominent organizations (e.g., Institute of Medicine and American Academy of Pediatrics) have published recommended standards of practice for ECE providers.4-6 Over the past decade interventions (e.g., Go NAPSACC, Healthy Kids Healthy Future, and Caring for Our Children) have provided many promising strategies (e.g., workshops, self-assessments, taking trainings for ECE professionals, learning collaboratives, action planning, engaging families, and updating policies) to help ECE programs meet these standards.7,8 To be effective, however, programs must successfully complete these interventions. Compliance (i.e., participant adherence to intervention as prescribed) to behavioral interventions is a common challenge, and failure limits their effectiveness. Understanding ECE characteristics that predict non-compliance is critical to inform the development of more effective strategies for ECE-based health promotion initiatives. This study aims to (1) identify predictors of non-compliance and (2) develop a risk stratification score to be used to inform future interventions aiming to decrease non-compliance.
Methods
Program data are self-reported by ECE administrators. Administrators report program type (e.g., center-based, family child care home (FCCH)), association (e.g., faith-based, military), Child and Adult Care Food Program (CACFP) participation, care type (full-/half-day), ages served, ages provided meals, percent subsidies received, years in operation, and number of children enrolled. Participation factors consisted of the number of modules started and completed, current module’s content area, baseline self-assessment score, action plans created, and action plans marked complete. A full description of candidate predictor parameters is presented in Supplemental Table 1.
Multivariable logistic regression model applying the least absolute shrinkage and selection operator (Lasso) with Bayesian information criterion stopping criteria was used to determine predictors for non-compliance. Missing data were treated as a separate category. The results are expressed as odds ratio (OR) and 95% confidence interval (CI). A risk stratification score was created to predict the incidence of non-compliance. Calibration (Figure 1A) was assessed graphically by plotting the observed against predicted non-compliance. A smooth nonparametric calibration line was created with the locally weighted scatterplot-smoothing (LOESS) algorithm to visualize the relationship between observed and predicted probabilities.11,12 Discrimination (Figure 1B) was quantified by calculating the area under the receiver operating characteristics curve (AUC). To correct for possible optimistic estimation of AUC in the development cohort, we used 1000 bootstrap resamples to estimate “optimism” and subtracted it from the development AUC to produce optimism-corrected AUC. A model was fit to each bootstrap sample and the average difference between the bootstrap AUC and the development AUC is the “optimism.”
13
An AUC ≥.750 is considered good predictive accuracy.
14
All analyses were performed using SAS statistical software (v9.4, SAS Institute Inc., Cary, NC). Odds ratios for the final multivariable logistic regression model predicting non-compliance with Go NAPSACC. FCCH = Family Child Care Home, CACFP = Child and Adult Care Food Program, SA = self-assessment, AP = action plan.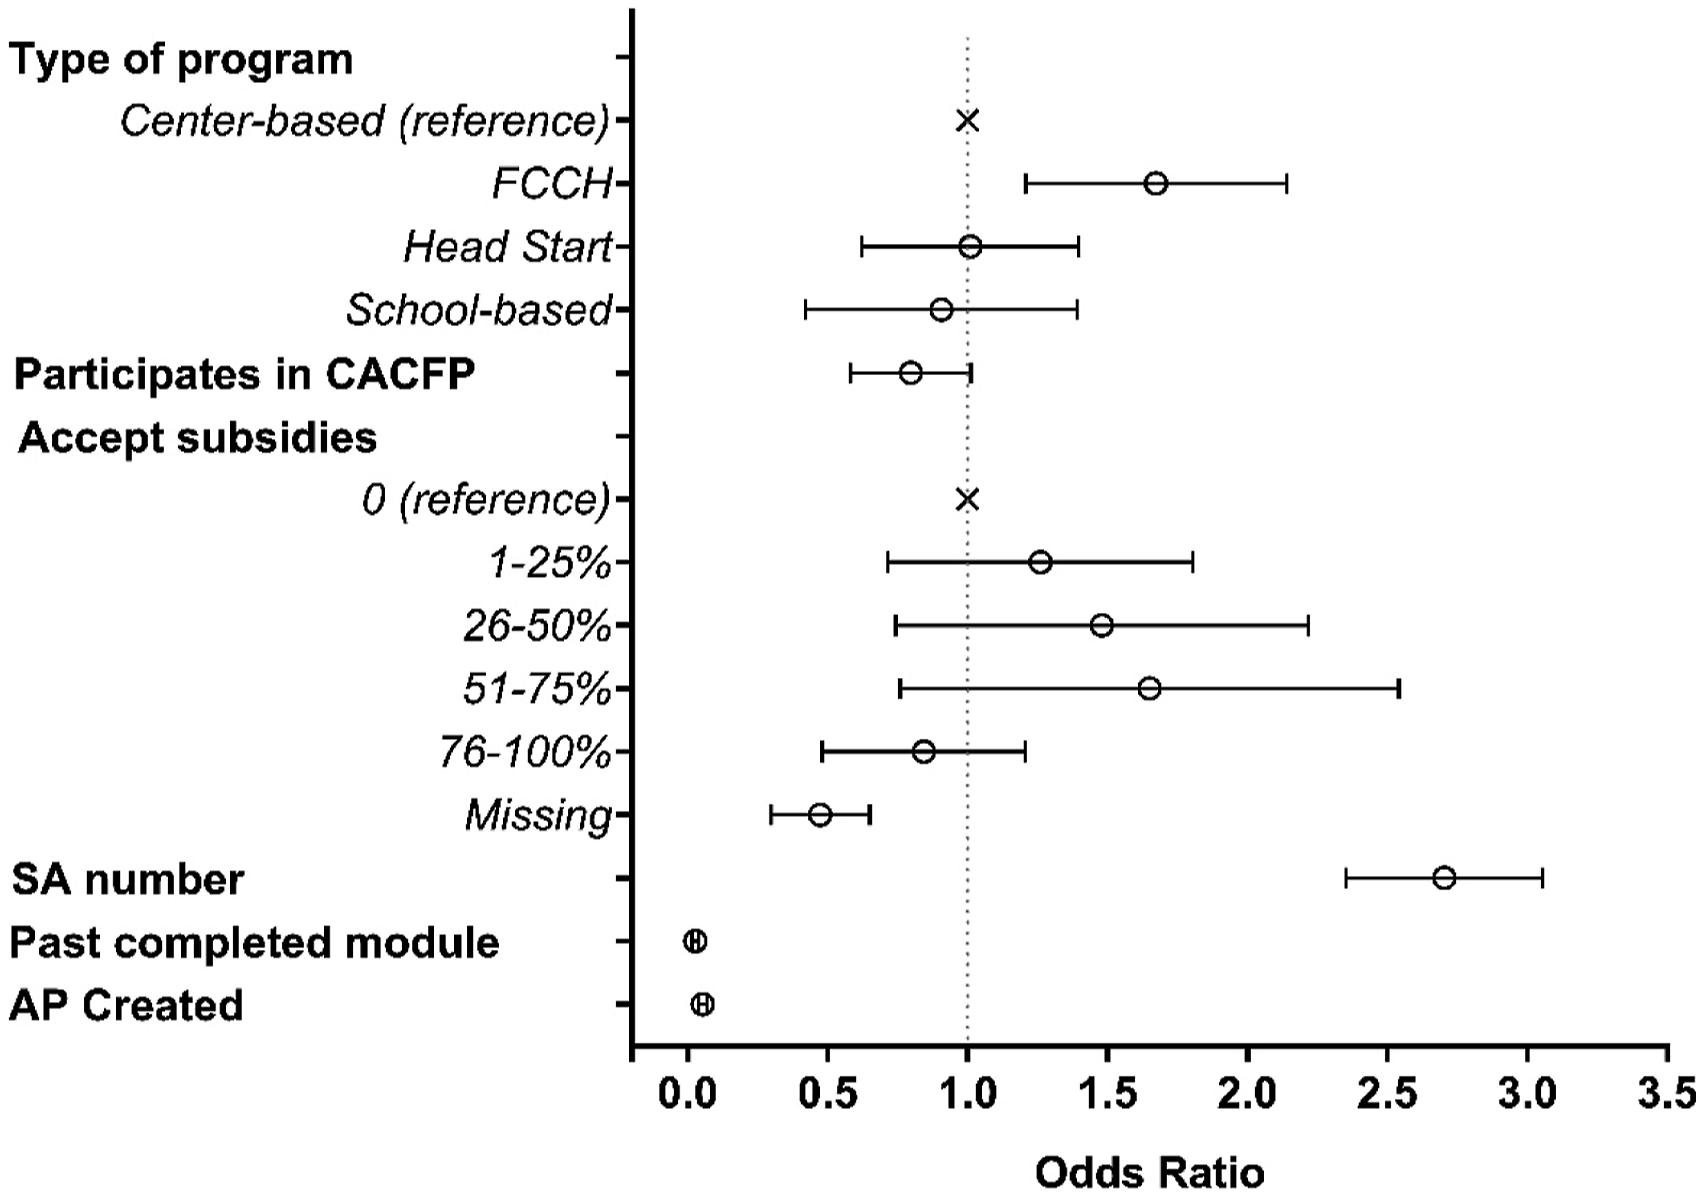
Results
Complete summary of program characteristics is presented in Supplemental Table 2. Among the 4469 ECE programs that registered with Go NAPSACC, 3883 met inclusion criteria for analysis. Most programs registered with Go NAPSACC were center-based (54%), not associated with military, faith-based, or native groups (85%), CACFP participants (68%), and full-day programs (96%). Additionally, programs did not create action plans (65%) or previously complete the five-step process in any other Go NAPSACC module (76%). There were no substantial differences in program characteristics between the development and validation samples. Across a median 15.3 months of follow-up, non-compliance was 65.7% and 64.9% in the development and validation samples, respectively.
Six variables were retained in the final multivariable logistic regression model (Figure 1). Holding all other variables constant, the odds of non-compliance were 99.5% (P < .001) lower if programs created an action plan, 99.8% (P < .001) lower if they successfully completed a previous Go NAPSACC module, 22% (P = .065) lower if they indicated CACFP participation, and 55% (P < .001) lower if they chose not to report accepting subsidies compared to programs that reported not accepting subsidies. The odds of non-compliance were 63% (P = .002) higher for FCCH compared to center-based programs and 169% (P = .002) higher for each subsequent Go NAPSACC module attempted. (A) Calibration plot for predicted probability vs observed frequency of non-compliance risk stratification score in the validation cohort. Nonparametric calibration line (black) was created using the locally weighted scatterplot-smoothing (LOESS) algorithm. (B) Discrimination for predicted probability vs observed frequency of non-compliance for the risk stratification score in the development cohort (gray-solid), the bootstrap sample (gray-dot), and the validation cohort (black-solid).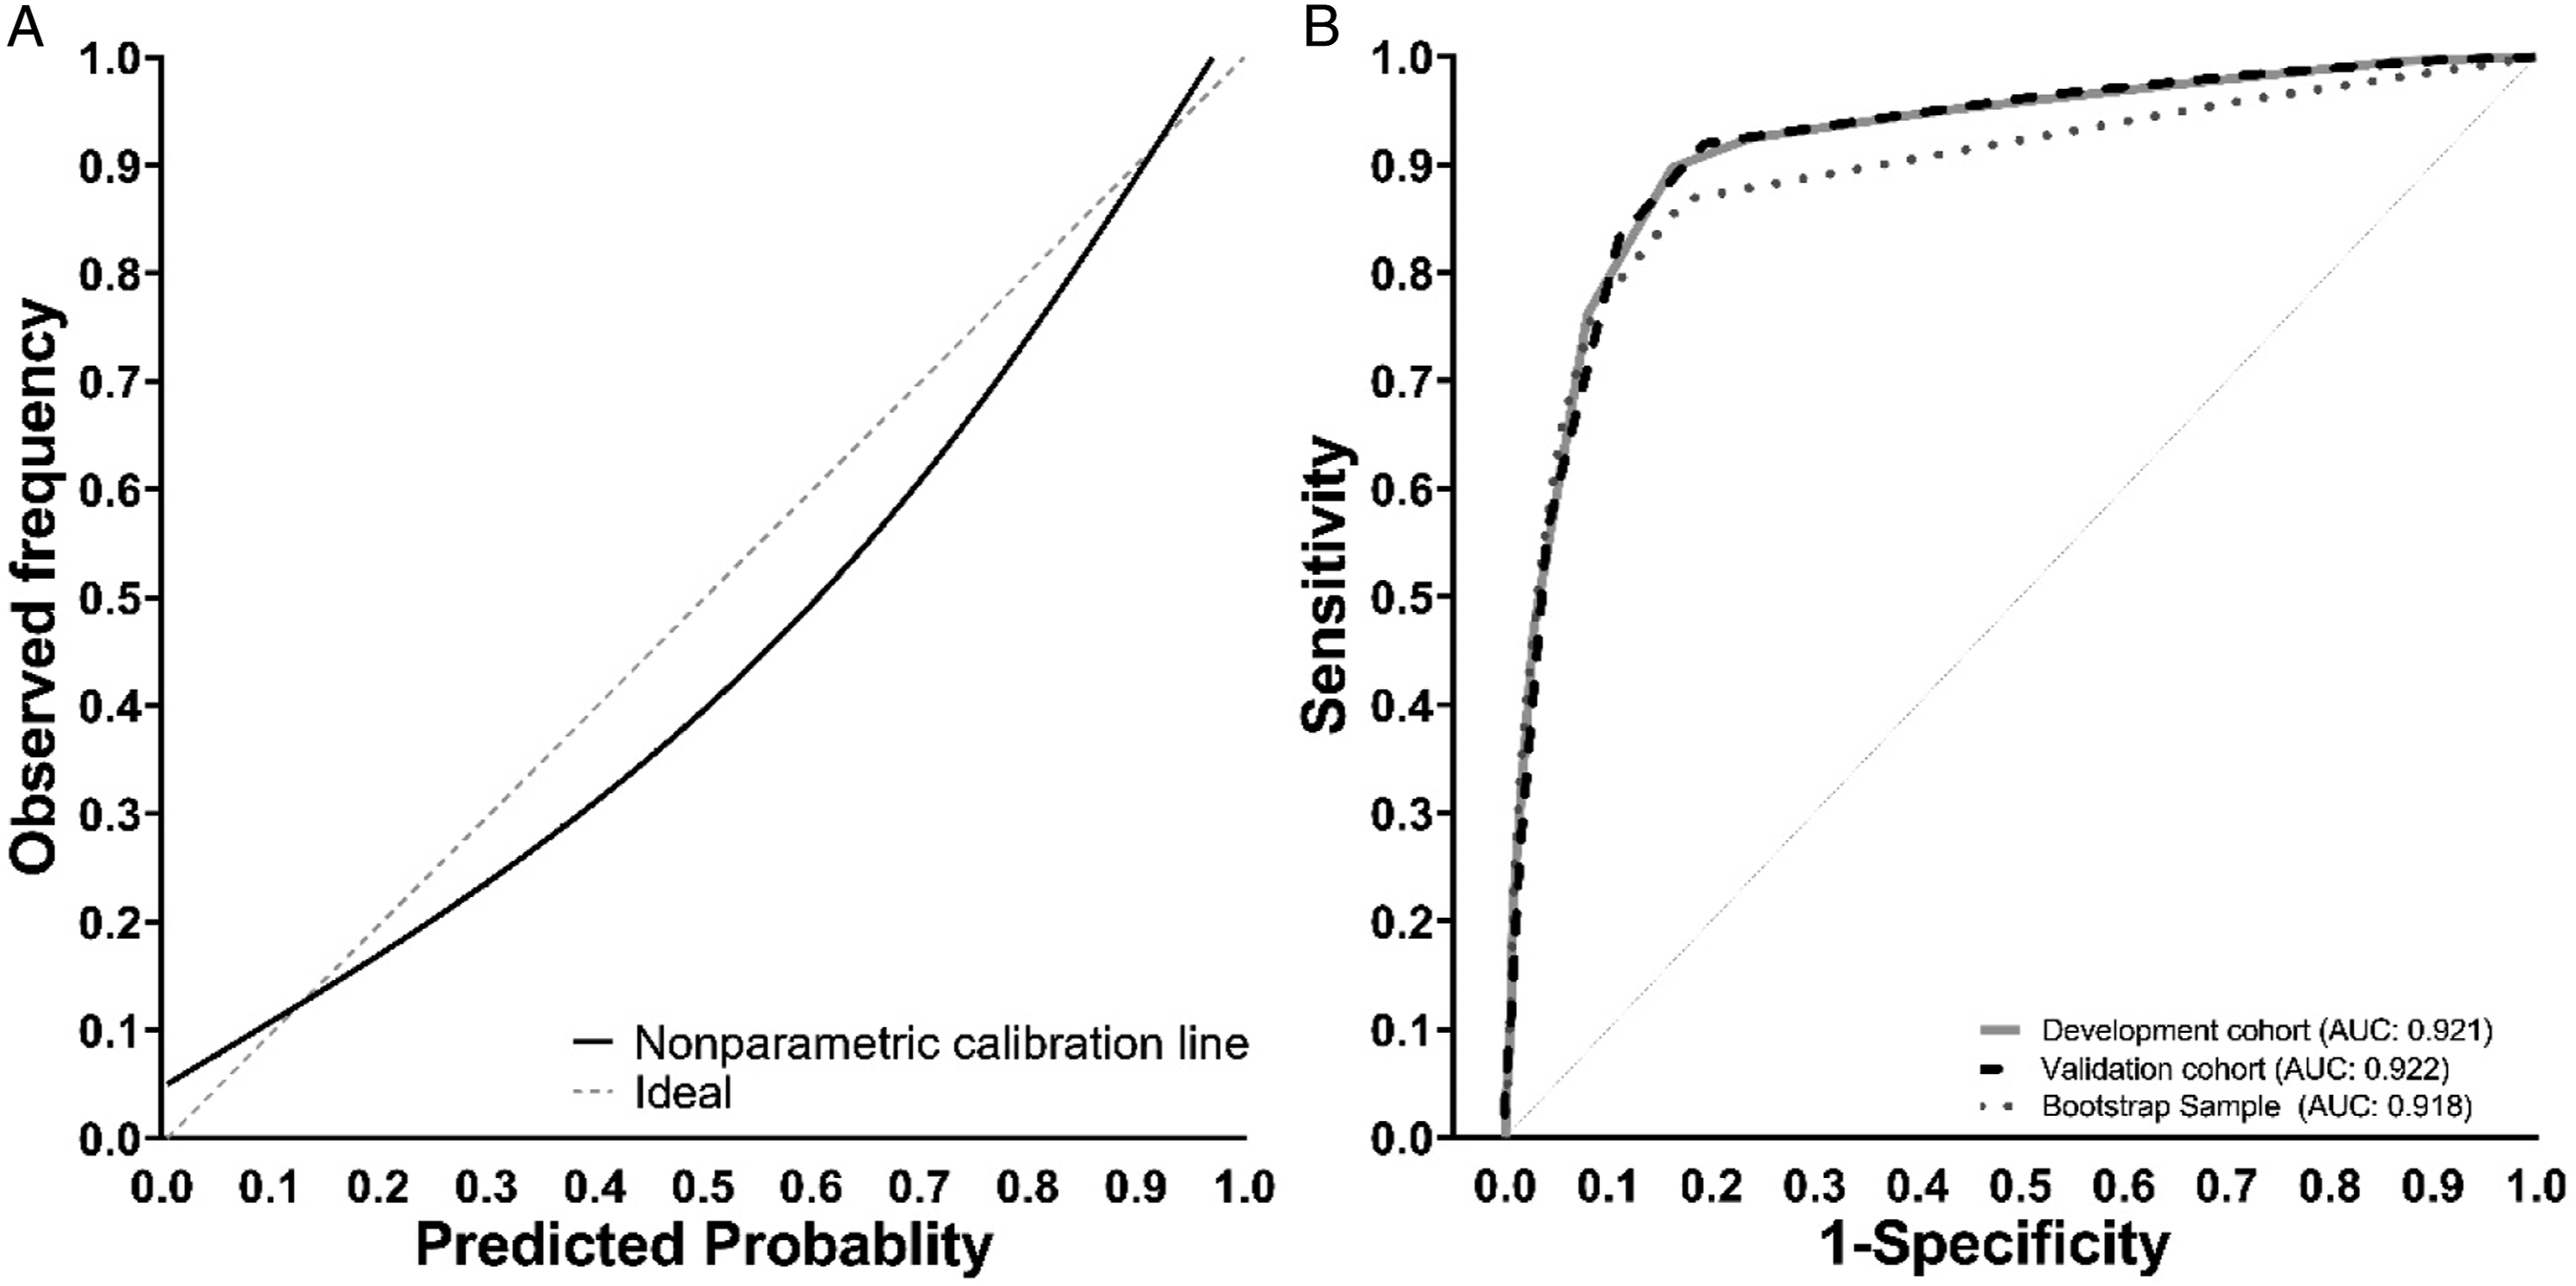
The risk stratification score was developed using predicted probabilities (see Supplemental Materials for complete SAS scoring code). Scores ≤40% are associated with low risk of non-compliance (OR: .02, 95% CI: .02–.03), scores ranging from 40 to 70% are associated with medium risk (OR: .83, 95% CI: .57–1.21), and scores ≥70% are associated with high-risk (OR: 5.53, 95% CI: 4.58–6.68; Supplemental Figure 1). The calibration assessment for the model shows high concordance between the predictive probabilities and observed frequencies (Figure 2A). The optimistic AUC obtained from the development cohort was .921 (95% CI: .910–.932). In the validation cohort, the score showed a good discrimination with an AUC of .922 (95% CI: .903–.940). Using the bootstrap analysis, the optimism-corrected AUC for the development cohort was .917 (95% CI: .906–.928). The AUC for each method is shown in Figure 2B.
Discussion
We developed and validated a score that estimates the risk of non-compliance from a national child health promotion initiative targeting ECE programs (Go NAPSACC). The predictors identified in this study may help identify ECE programs at high-risk of non-compliance when initiating a health promotion intervention. Identifying these high-risk programs could help agencies allocate resources to maximize success. We were able to identify 6 predictors for non-compliance from Go NAPSACC including program characteristics (program type, CACFP participation, and level of subsidies accepted), the number of previously attempted modules, whether those previous modules were completed, and creation of current module action plans. The risk score showed good discriminative power (AUC >.91; Figure 2B) and model calibration (Figure 2A).
This study does not come without limitations. First, there is a lack of qualitative data to fully understand the context of non-compliance. Second, the risk stratification score was created using participation factors specific to Go NAPSACC (e.g., action plans created and past modules completed); therefore, the generalizability to other ECE-based initiatives is limited. Third, the goals of utilizing Go NAPSACC varies by state; therefore, future studies need to assess how localized implementation strategies support such initiatives. Despite these limitations, this study was performed in a large, heterogenous sample of ECE programs with sufficient power to identify numerous potential predictors; thus, these findings offer a unique and important contribution to the literature regarding non-compliance from ECE-based health promotion initiatives.
In conclusion, our study demonstrates ECE program characteristics and participation factors are good predictors for non-compliance with Go NAPSACC. The created risk stratification score may help improve decision making and guide the development of interventions to improve their success. Further studies are needed to assess whether the use of this risk stratification score could improve sustainability of ECE-based health promotion efforts.
So What?
What is already known on this topic?
Past research has found promising strategies to help ECE providers meet recommended standards of practice to foster healthy behaviors in children. However, greater attention is needed to understand the adoption and implementation of the resulting practices.
What does this article add?
This study determined program and participation characteristics associated with the completion of a national obesity prevention initiative. These findings have major dissemination implications in understanding factors associated with greatest risk of non-compliance.
What are the implications for health promotion practice or research?
State agencies are investing increasingly more resources in ECE-based interventions. Identifying high-risk ECE programs early can help allocate resources more efficiently. This study identified important predictors of intervention non-compliance to inform future strategies to improve ECE-based health promotion efforts.
Supplemental Material
sj-pdf-1-ahp-10.1177_08901171211069550 – Supplemental Material for Predictors of Non-Compliance with a National Early Care and Education-Based Obesity Prevention Initiative: Go NAPSACC
Supplemental Material, sj-pdf-1-ahp-10.1177_08901171211069550 for Predictors of Non-Compliance with a National Early Care and Education-Based Obesity Prevention Initiative: Go NAPSACC by Erik A. Willis, Xiuya Chang, Falon Smith, Emily Clarke and Dianne S. Ward in American Journal of Health Promotion
Footnotes
Acknowledgments
We would like to thank Blue Cross Blue Shield of North Carolina for their support in developing the Go NAPSACC website.
Authors' Contributions
EW, FS, and DW conceptualized the study. EW and XC organized and analyzed the data. EW, XC, FS, EC, and DS gave critical feedback and contributions to the manuscript. All authors read and approved the final manuscript.
Declaration of Conflicting Interests
The author(s) declared no potential conflicts of interest with respect to the research, authorship, and/or publication of this article.
Funding
The author(s) received no financial support for the research, authorship, and/or publication of this article.
Ethical Approval
This study was considered exempt by the Institutional Review Board at the University of North Carolina (IRB Number: 21-1620).
Supplemental Material
Supplemental material for this article is available online.
References
Supplementary Material
Please find the following supplemental material available below.
For Open Access articles published under a Creative Commons License, all supplemental material carries the same license as the article it is associated with.
For non-Open Access articles published, all supplemental material carries a non-exclusive license, and permission requests for re-use of supplemental material or any part of supplemental material shall be sent directly to the copyright owner as specified in the copyright notice associated with the article.