
Abstract
Purpose
To quantitatively assess sign language interpreter well-being.
Design
Descriptive, cross-sectional.
Practice settings
Staff, educational, community/freelance, video relay, and/or video remote.
Sample
Certified interpreters bilingual in English and American Sign Language, ≥18 years old, and interpreting ≥10 hours/week.
Measure
National Institute for Occupational Safety and Health Worker Well-Being Questionnaire (NIOSH WellBQ).
Analysis
Descriptive statistics evaluated well-being and internal consistency was calculated as a psychometric property.
Results
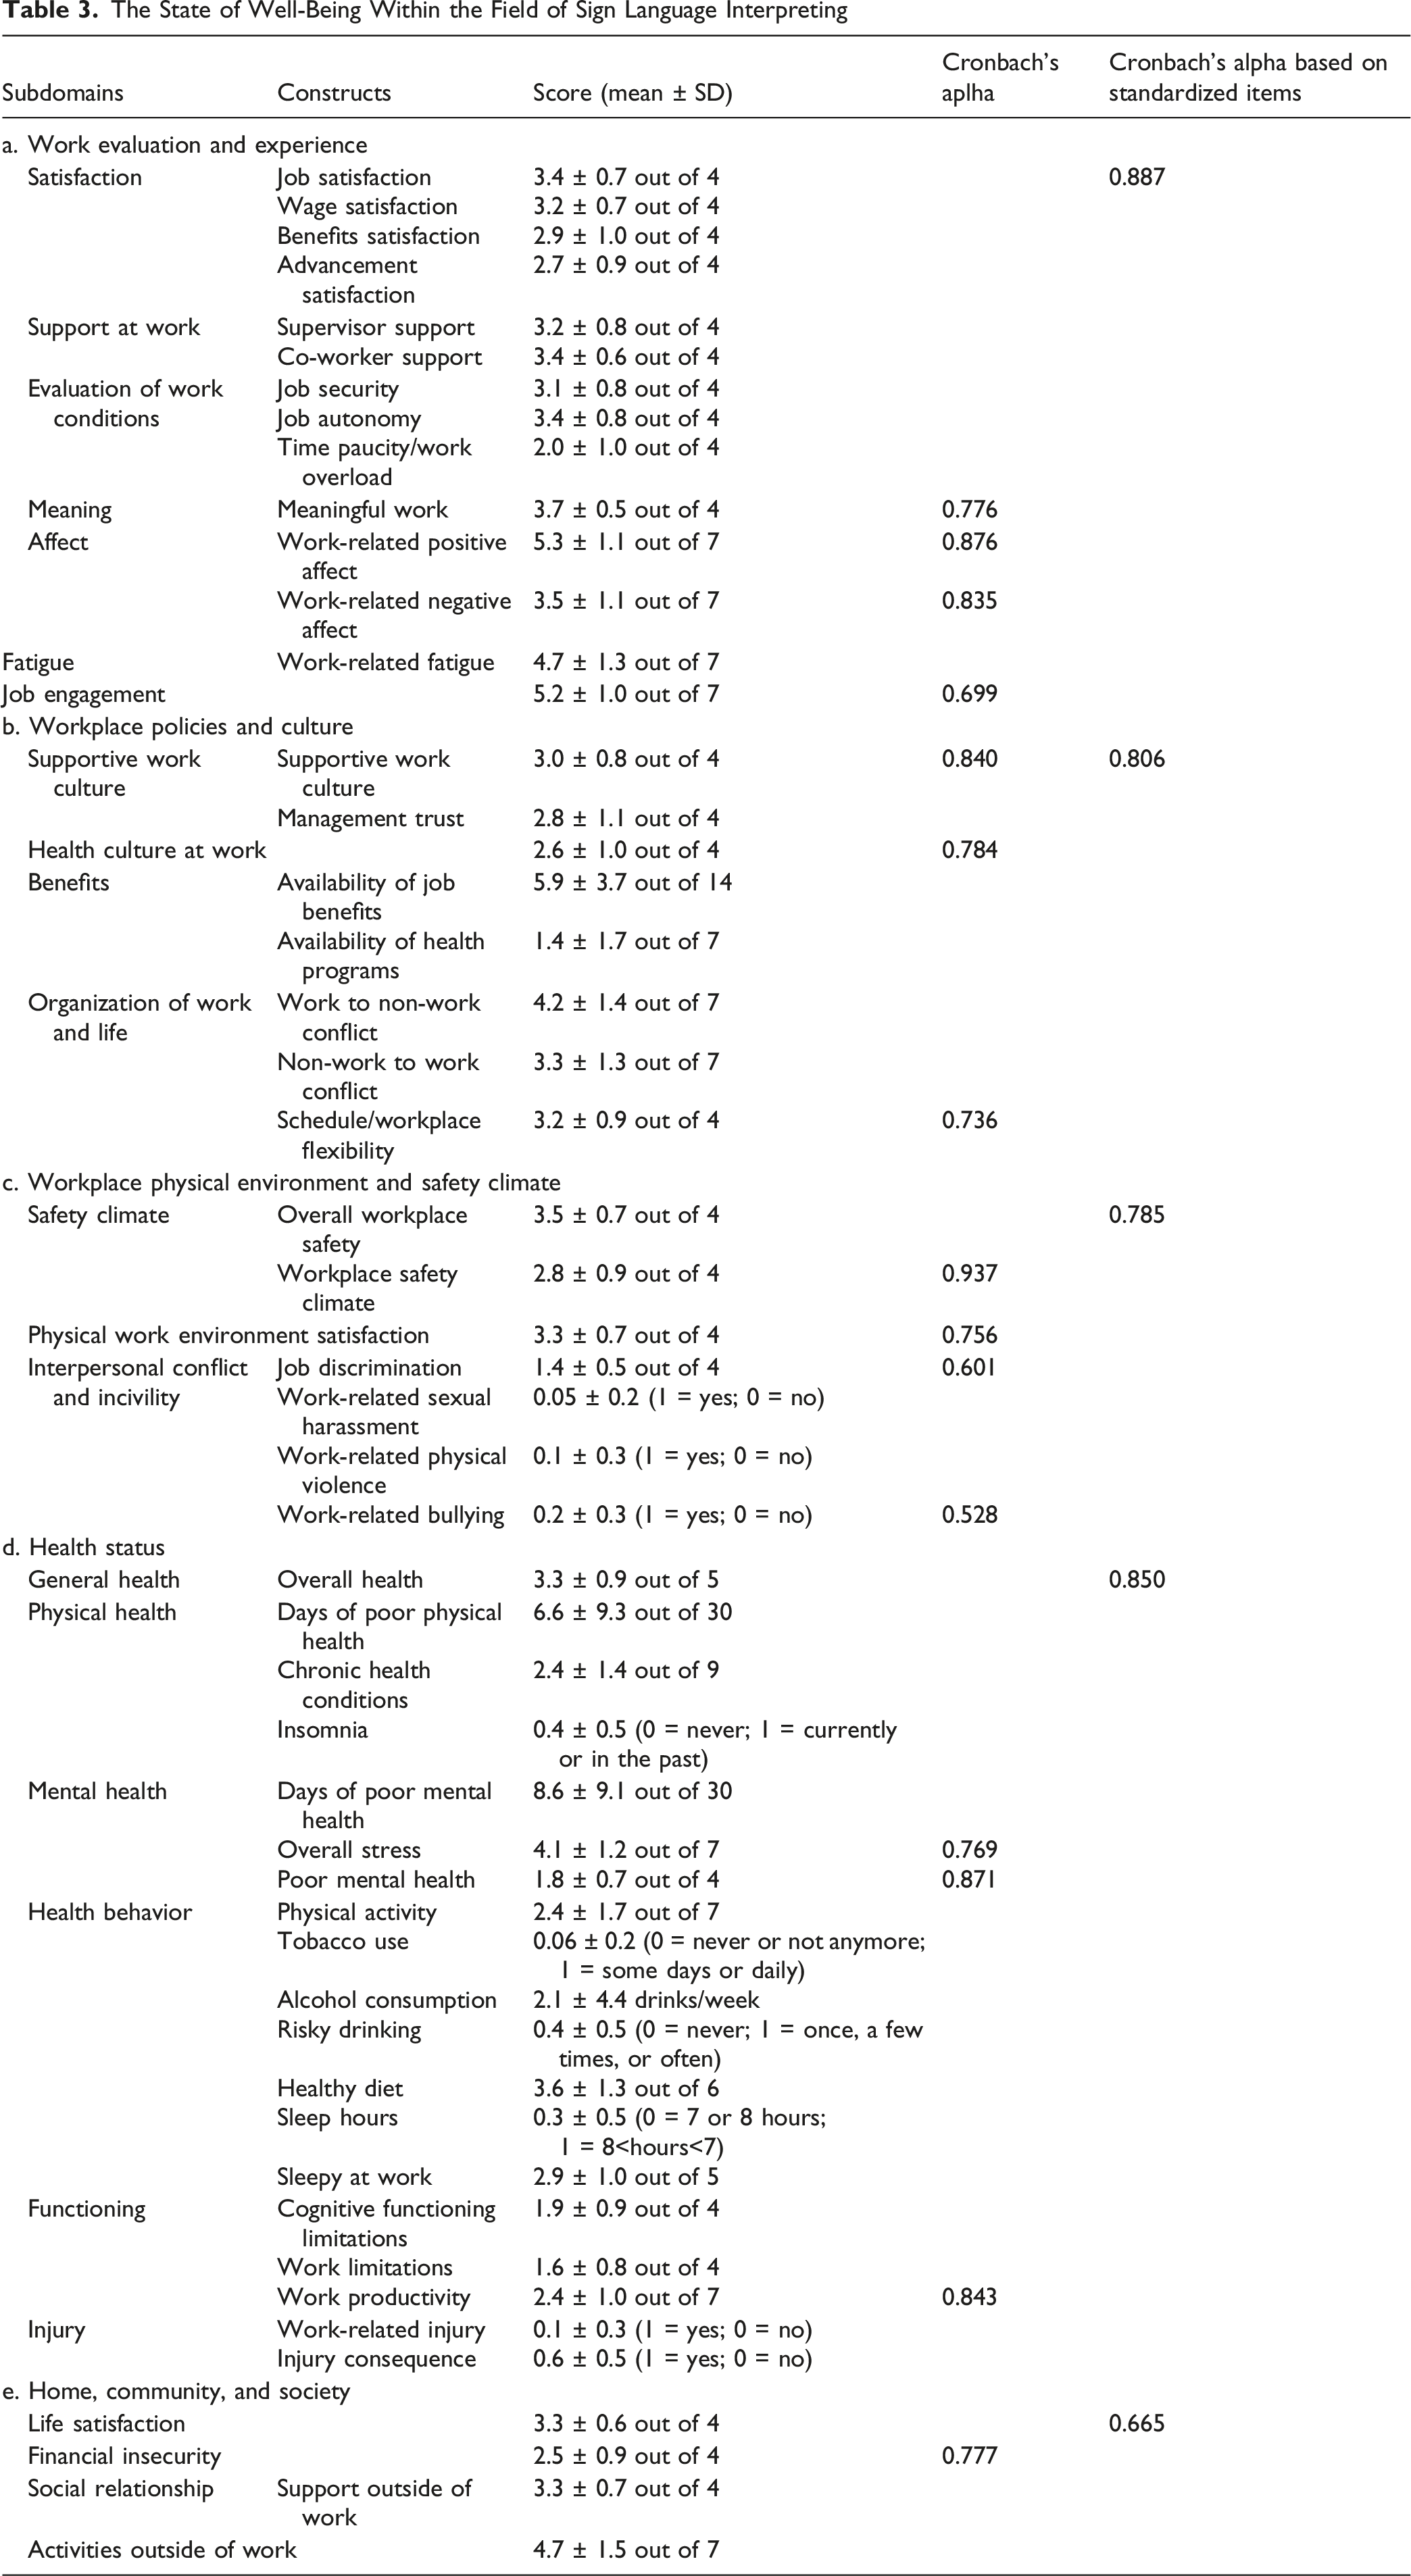
170 interpreters (47.6 ± 11.6 years old; 31.9 ± 11.7 hours/week) were surveyed. They were neutral about a culture of health (2.6 ± 1.0 out of 4) and safety practices (2.8 ± 0.9 out of 4) at work. Regarding work-related incivility, 5% were sexually harassed, 13% experienced physical violence, and 26% reported bullying. In the past 30 days, interpreters had between 7 to 9 days of poor physical or mental health. 57% had cognitive functioning limitations, 42% experienced work limitations due to a physical, mental, or emotional condition, and 43% were worried about maintaining their standard of living and paying monthly bills. Internal consistency was slightly lower for home, community, and society (α = 0.665), otherwise it was acceptable for all domains (α ≥ 0.785).
Conclusion
The NIOSH WellBQ is a valid measure that offers a comprehensive quantitative assessment of worker well-being. Areas of focus for future health promotion practice and research with sign language interpreters include fostering a health culture and safety climate at work, addressing work-related incivility, and promoting physical, mental, emotional, cognitive, and financial health.
Keywords
Purpose
The goal of this study was to provide a generalized understanding of the state of well-being within the field of sign language interpreting.
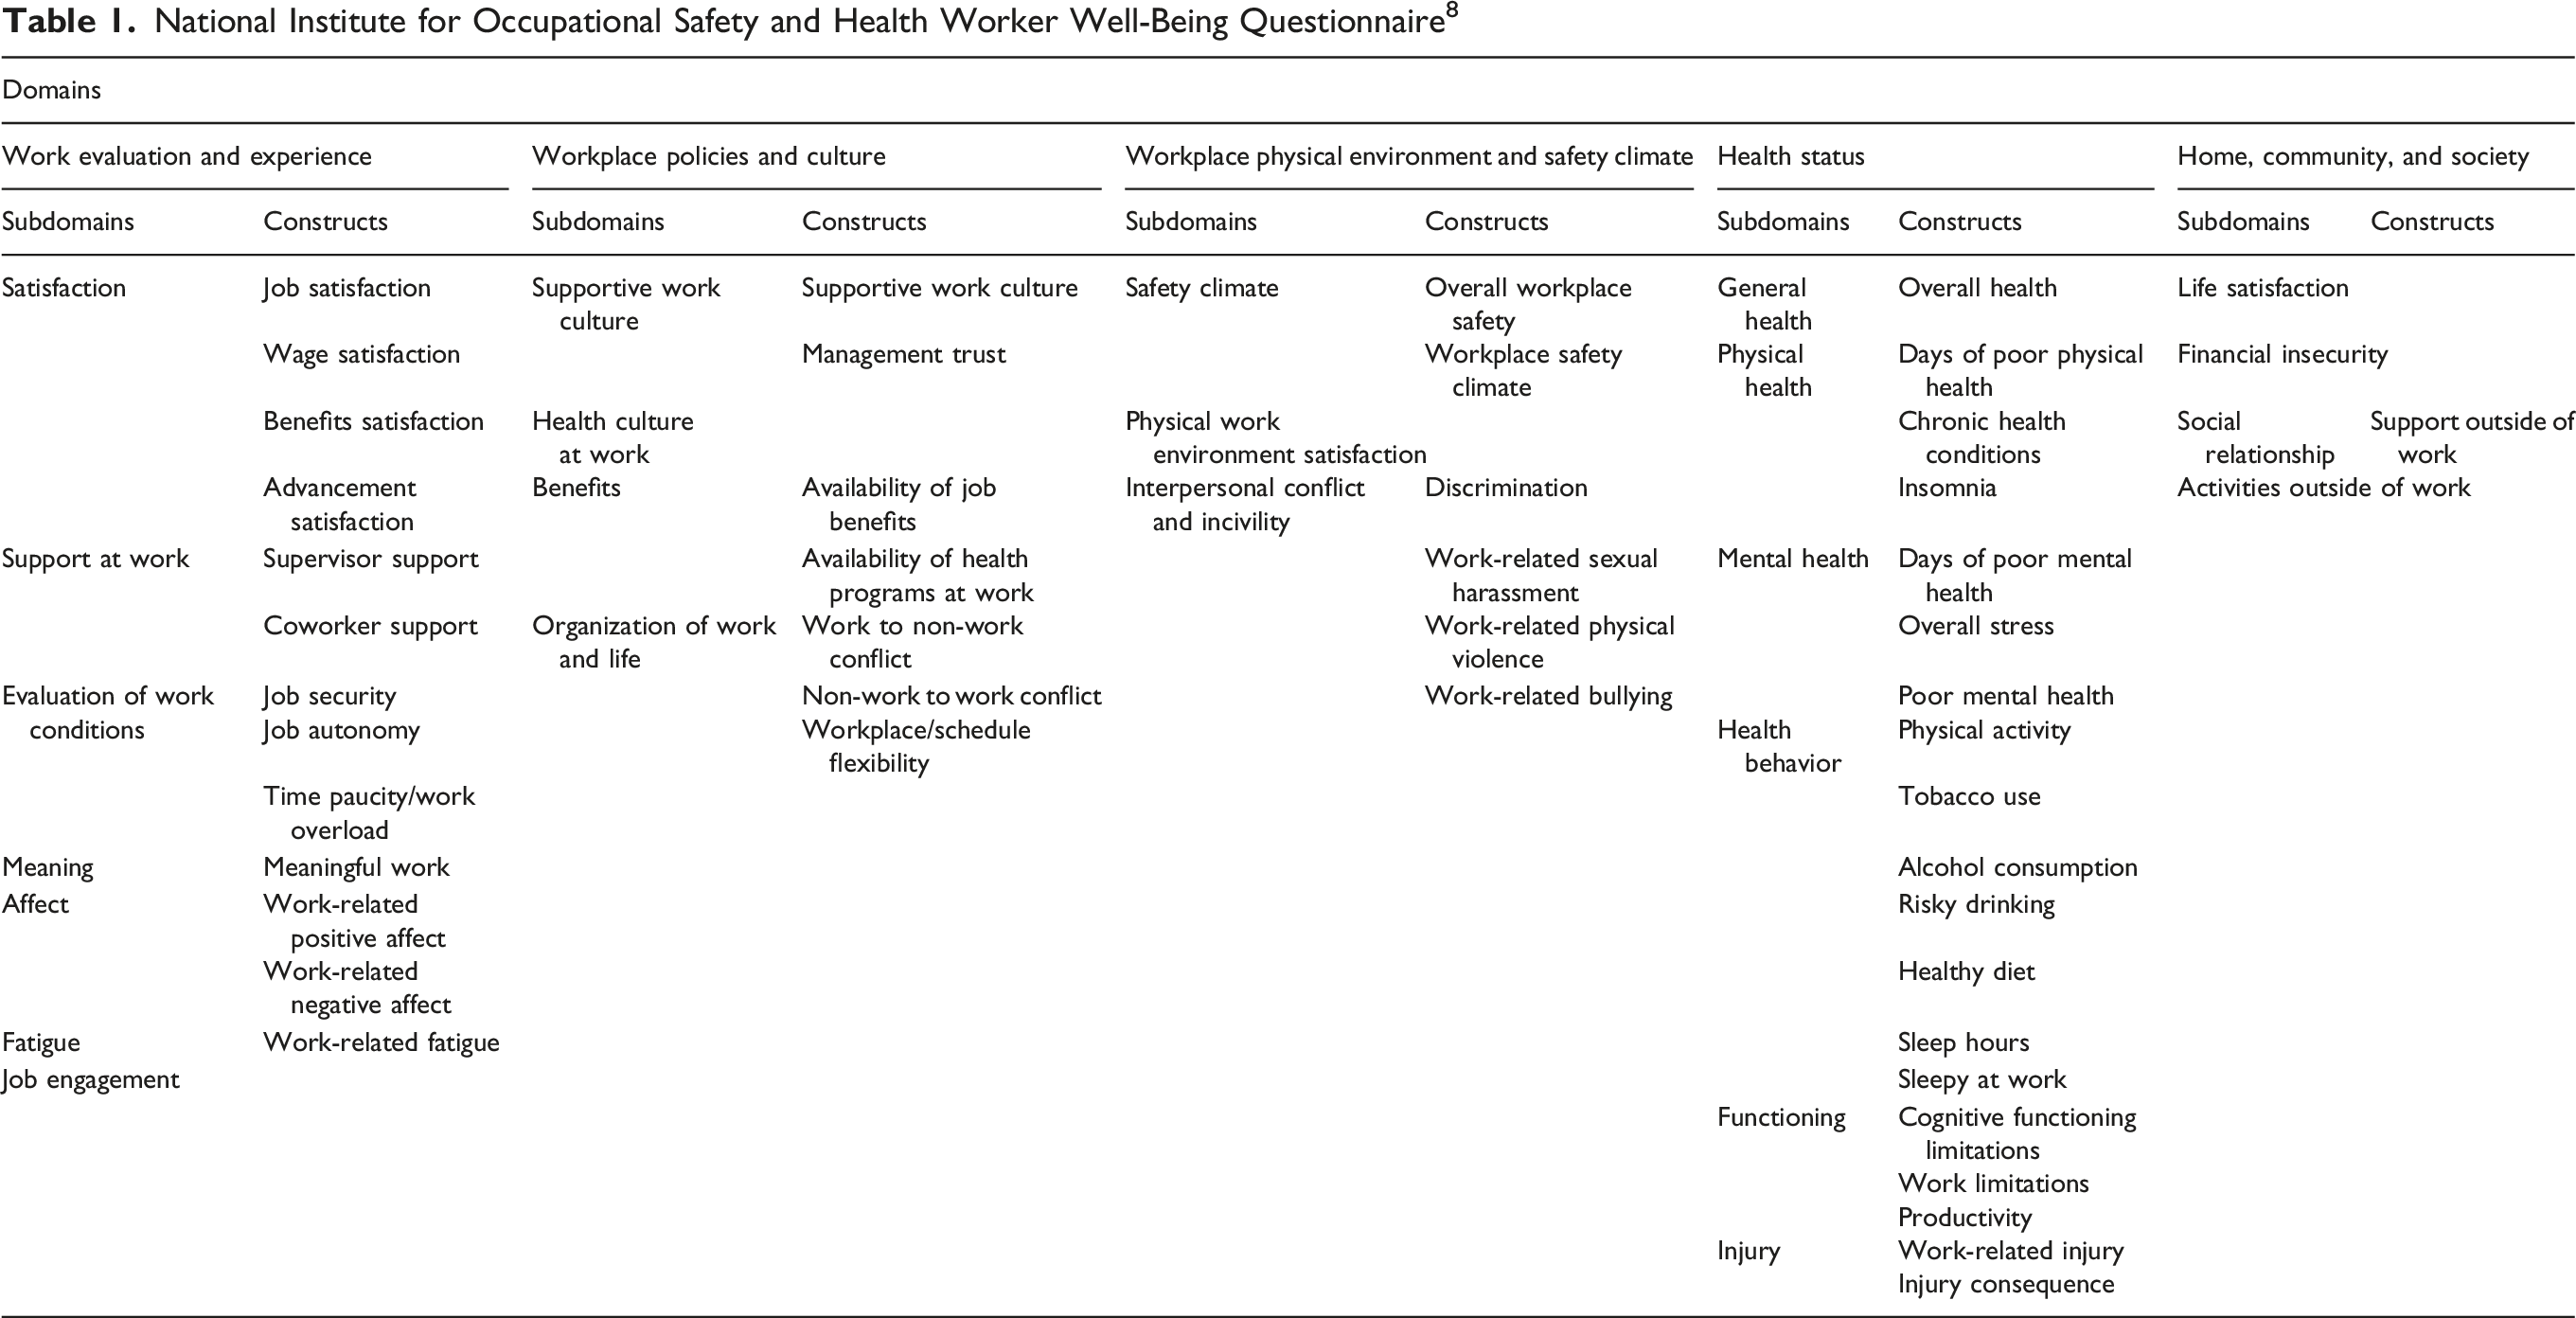
As one of the core terms in the World Health Organization’s Health Promotion Glossary, well-being is defined as “a positive state experienced by individuals and societies. Similar to health, it is a resource for daily life and is determined by social, economic, and environmental conditions.” 1 Well-being is multi-faceted and various disciplines are drawn to its different dimensions.2,3 For example, the National Center for Complementary and Integrative Health at the National Institutes of Health funds 6 high priority research networks to advance research on psychological aspects of well-being. 4 Their working definition of emotional well-being is “a multi-dimensional composite that encompasses how positive an individual feels generally and about life overall.’’ 5 They go on to share that emotional well-being includes experiential and reflective features which are contextualized by one’s culture, resources, and life circumstances and course. Similarly, the National Institute for Occupational Safety and Health (NIOSH) at the Centers for Disease Control and Prevention funds 10 Centers of Excellence for Total Worker Health®. 6 Total Worker Health® is research, practice, policy, or capacity building that protects the worker while promoting their health and advancing their well-being. 7 NIOSH developed a Worker Well-Being Questionnaire (NIOSH WellBQ) which identifies (1) work evaluation and experience, (2) workplace policies and culture, (3) workplace physical environment and safety climate, (4) health status, and (5) home, community, and society as the five domains of worker well-being.8–10 Along with the World Health Organization’s description of well-being, it's important to note that each of the definitions for the emotional and occupational dimensions intentionally intersect with multi-level contextual factors and outside influences. Specific to worker well-being, the NIOSH WellBQ acknowledges beyond the worker’s individual aspects by including organizational aspects, as well as the interplay between work and non-work.
Interpreters are critical for bridging communication between individuals who communicate using different languages. Additionally, they serve as message clarifiers and cultural mediators and help to navigate the power dynamics between majority and minority cultures. 11 Interpreters are considered workers within the services industry sector; specifically, offering business and professional services. 12 This study focused on the field of sign language interpreting with the hope of contributing to efforts that will establish normative values for the well-being of this particular occupation. Much of the evidence on the occupational health of sign language interpreters has investigated how physical exertion, ergonomics, posture, workstation set-up, and sign production and style or upper limb biomechanics may contribute to physical health concerns.13–17 However, there is growing evidence about other adverse health exposures; particularly stress, burnout, vicarious trauma and emerging concerns like work-related incivility and emotional or psychological safety.17–22 With previous work demonstrating the influence of environmental conditions and strong associations between physical and mental health outcomes, 23 we were drawn to the integrated framework of Total Worker Health® to provide an overall capture of sign language interpreter well-being.
Methods
Design
This research adhered to a descriptive, cross-sectional study design to broadly characterize and inspect specific aspects of sign language interpreter well-being.
Sample
Certified sign language interpreters bilingual in English and American Sign Language were eligible to participate if they were ≥18 years old and interpreted ≥10 hours/week. Deaf or hearing sign language interpreters across practice settings were encouraged to participate. The practice settings included roles as a staff, educational, community/freelance, video relay service, and/or as a video remote interpreter. A staff interpreter may be an agency, business, government, or hospital employee that works part- or full-time in a salaried position. An educational interpreter serves as a primary or secondary (kindergarten through 12th grade) or as a post-secondary (college or university) interpreter. A community/freelance interpreter is self-employed and independently contracts directly with business entities or indirectly through interpreter referral agencies. A video relay service interpreter provides telecommunication for phone calls between Deaf and hearing parties and finally, a video remote interpreter is an offsite interpreter who facilitates communication between onsite Deaf and hearing consumers.
A recruitment flyer and study information were emailed directly to interpreters who publicly shared their contact information on the national professional association for sign language interpreters’ website. 24 To express interest in participating, interpreters were asked to click on a link within the email and complete a prescreening survey. The prescreening survey discerned if eligibility criteria were met and asked demographic questions about practice setting, types of certifications maintained, years of interpreting experience, and geographical location. If eligibility was met on the prescreening, then prospective participants were emailed a link to the study’s bookings page in Outlook (Microsoft, Redmond, WA) and enrollment meetings were either conducted virtually (Teams, Microsoft, Redmond, WA; Zoom, Zoom Communications, San Jose, CA) or over the phone.
Measure
National Institute for Occupational Safety and Health Worker Well-Being Questionnaire 8
Analysis
Descriptive statistics (mean ± SD and frequencies) were used to evaluate the state of well-being within the field of sign language interpreting via all constructs of the NIOSH WellBQ. Because the WellBQ is still a relatively new measure, we calculated internal consistency as a psychometric property. We measured the internal consistency of the constructs with multiple ordinal items (that were scored by taking the average across the number of items, rather than by re-coding and taking the sum) using Cronbach’s alpha. We also measured the internal consistency of the domains using Cronbach’s alpha based on standardized items because constructs within the domains had varying scales. We excluded the items within workplace safety climate and physical work environment satisfaction where the respondent answered “does not apply” because we presumed the interpreter, indeed, did not have a workplace or physical work environment. Otherwise, we used the midpoint for the other ordinal items where the interpreter responded “does not apply” (except for the activities outside of work subdomain where we converted “does not apply” to 1 = ”never”) and converted the “does not apply” on the dichotomous items to “no.” For the internal consistency of the domains, we used the average for the scale items and if there was a mix of positively and negatively worded items within a construct or subdomain, then we reverse-coded the negatively worded items. We interpreted Cronbach’s alpha between 0.70 to 0.95 to be acceptable. 25
Results
Participant Demographics
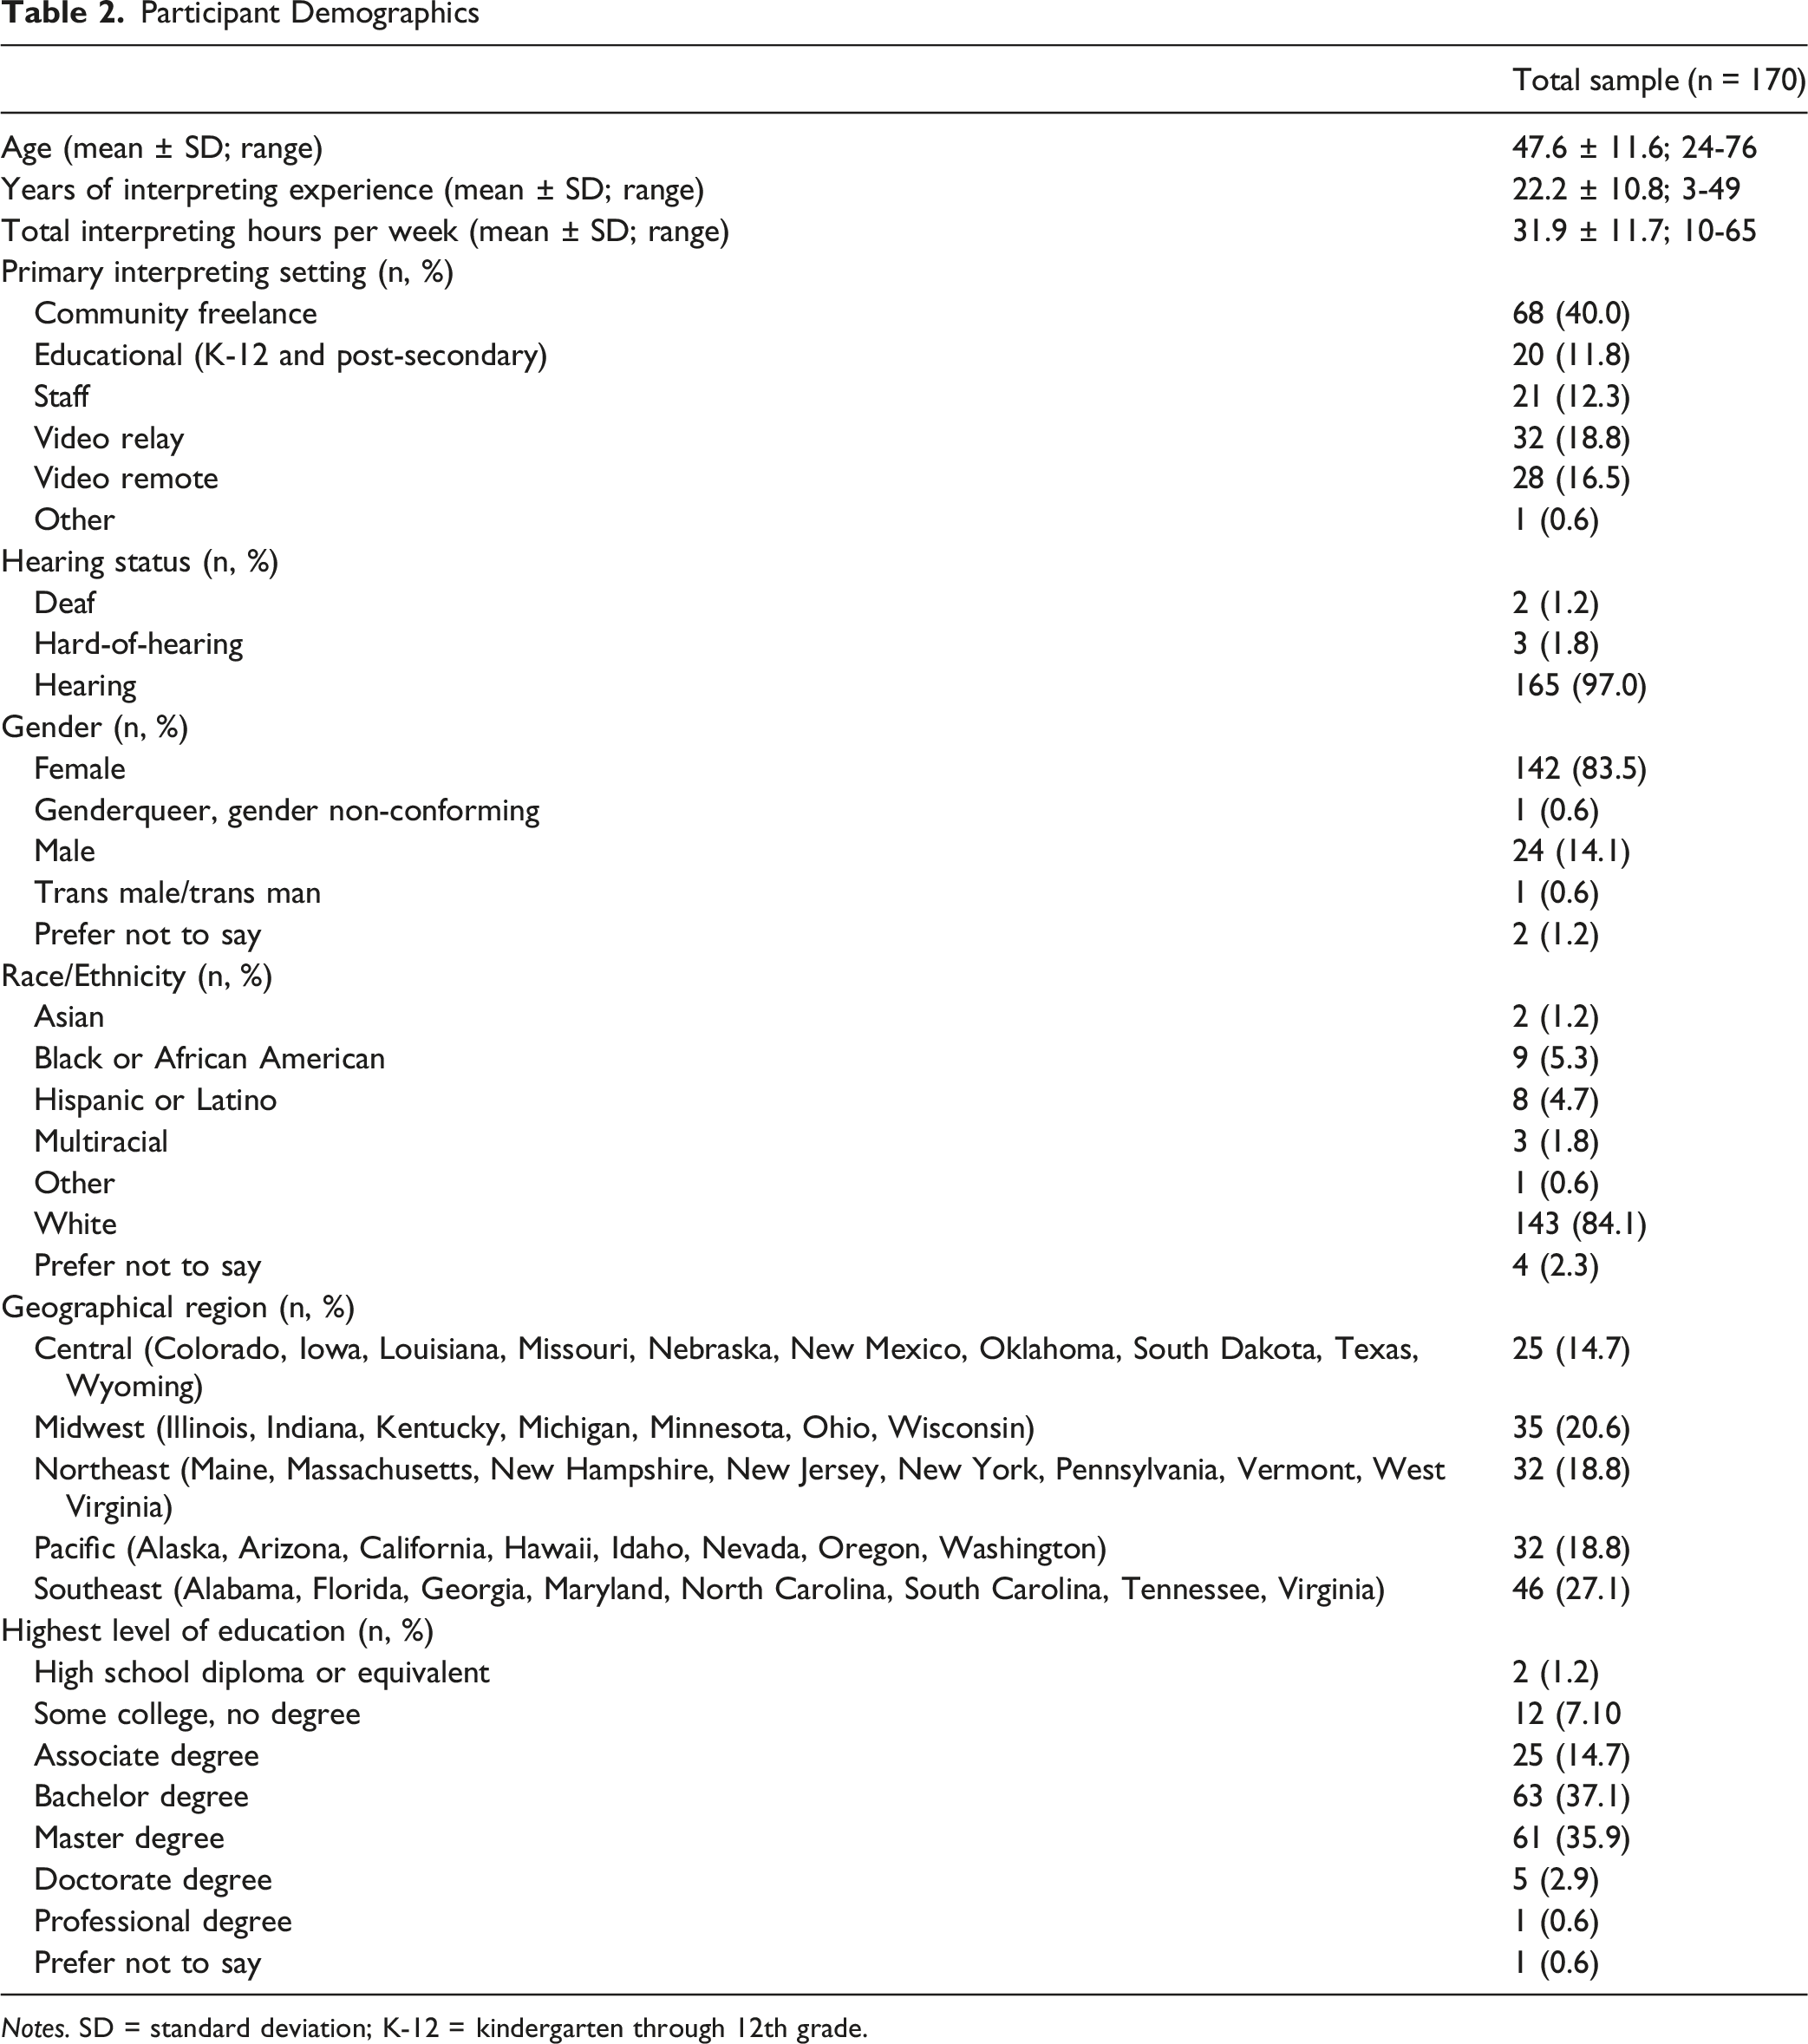
Notes. SD = standard deviation; K-12 = kindergarten through 12th grade.
Work Evaluation and Experience
The State of Well-Being Within the Field of Sign Language Interpreting
Workplace Policies and Culture
Interpreters “somewhat agreed” that there was a supportive culture at work (i.e., treated with respect, organization cares about their satisfaction and values their contributions; Table 3b). Interpreters “somewhat agreed” to “somewhat disagreed” about trusting the management of their organization and that there is a culture of health at work. 28% (n = 48) indicated that the 2 questions about health culture (i.e., whether their organization is committed to employee health and well-being) did not apply. Likewise, 42% (n = 72) and 68% (n = 115), respectively, responded “does not apply” to the availability of benefits and health programs at work. For those that it did apply, interpreters indicated 5.9 ± 3.7 of the 14 listed benefits and 1.4 ± 1.7 of the 7 health programs were offered by their employer. Interpreters reported that the demands of work interfered with their personal life “a few times a month” to “once a week” and that their personal life interfered with work between “once a month or less” to “a few times a month.” Interpreters “somewhat agreed” to “strongly agreed” that they have freedom to vary their schedules and work wherever is best of them.
Workplace Physical Environment and Safety Climate
Interpreters reported thinking their overall workplace is “somewhat safe” to “very safe” (Table 3c). 38% (n = 65) and 30% (n = 51) of interpreters, respectively, felt that items about workplace safety climate and satisfaction of their physical work environment did not apply. For those that it did apply, they “somewhat disagreed” to “somewhat agreed” with the 6 statements about safety practices at work (i.e., management reacting quickly when told about safety hazards and management providing all the equipment needed to do the job safely) and were “somewhat satisfied” to “very satisfied” with the environmental conditions, physical surroundings, pleasantness, and accommodations for special needs within the work environment. Interpreters “strongly disagreed” to “somewhat disagreed” that they felt discriminated against because of their age, race or ethnic origin, and gender, however, 5% (n = 9) indicated experiencing work-related sexual harassment, 13% (n = 22) indicated experiencing work-related physical violence, and 26% (n = 44) indicated experiencing work-related bullying. For those who experienced work-related bullying, 20% (n = 34) indicated being bullied, threatened, or harassed in other ways (separate from sexual harassment or physical violence) by anyone while on the job, 25% (n = 42) indicated being in a situation where supervisors or coworkers put them down, were condescending, made demeaning remarks or addressed them using unprofessional terms, and 11% (n = 19) indicated both.
Health Status
Although interpreters reported that their overall health was between “good” and “very good” (Table 3d), they shared that over the past 30 days their physical health was not good for 6.6 ± 9.3 days and their mental health was not good for 8.6 ± 9.1 days. In separate questions about stress and poor mental health over the last 2 weeks, interpreters reported experiencing stress “a few times a month” to “once a week” and having poor mental health (feeling down, depressed, or hopeless, having little interest or pleasure in doing things) ranging from “not at all” to “several days.” Of the 9 listed chronic health conditions, interpreters reported having 2.4 ± 1.4 chronic conditions and 35% (n = 60) reported having insomnia either “currently” or “in the past.” In a typical week, interpreters reported doing ≥20 minutes of vigorous-intensity physical activity for 1.8 ± 1.9 days and ≥30 minutes of moderate-intensity for 2.9 ± 2.1 days or an average of 2.4 ± 1.7 days across both levels of physical activity. 6% (n = 10) reported using a tobacco product on “some days” or “daily.” Interpreters consumed 2.1 ± 4.4 alcoholic beverages in a typical week. 6% (n = 10) reported having >14 drinks (if a biological male) or >7 drinks (if a biological female) in a typical week and 39% (n = 66) reported having >4 drinks (if a biological male) or >3 drinks (if a biological female) on any single day at least “once (1 day),” if not more (a few times [2 to 3 days] or often [more than 3 days]) within the past year. With 1 serving equating to 1 cup of raw leafy greens, ½ cup of other vegetables (cooked or raw), 1 medium piece of fruit, ½ cup of chopped, cooked, or canned fruit, or ¾ cup of vegetable or fruit juice, interpreters shared eating between 2 to 3 servings in a normal day. Regarding sleep health behaviors, interpreters “rarely” to “sometimes” felt sleepy while at work. 69% (n = 117) were usually getting 7 to 8 hours of sleep at night, while 31% (n = 53) were getting fewer than 6 or more than 9 hours. While interpreters, on average, expressed no difficulty at all to slight difficulty with cognitive functioning and felt no limitation at all to a slight limitation in the kind or amount of work they can do because of a physical, mental, or emotional problem, 57% (n = 97) responded with slight difficulty or greater (moderate or extreme) with concentrating, remembering, or making decisions and 42% (n = 72) responded with slight work limitation or greater (moderate or extreme) because of a physical, mental, or emotional problem in the functioning subdomain. For work productivity, interpreters “almost never (one time a month)” to “rarely (once a week of less)” felt they were not working as carefully as they should or got less done than other interpreters. In the past 12 months, 13% (n = 22) of the sample experienced a work-related injury and of those who were injured, 64% (n = 14) had a consequence from the injury, like needing to change job activities, lost time from work, or needing medical treatment.
Home, Community, and Society
Interpreters were “somewhat satisfied” to “very satisfied” with their lives (Table 3e). While, on average, they ranged from being “not too worried” to “moderately worried” about maintaining the standard of living they enjoy and paying their normal monthly bills, 43% (n = 73) were “moderately worried” to “very worried” about their financial insecurity. They “sometimes” to “always” received the social and emotional support from friends, family, or others outside of work. Finally, interpreters reported taking part in 4.7 ± 1.5 out of 7 activities outside of work, such as relaxation or planned solitary activities, training or education courses, and socializing.
Discussion
This cross-sectional study provides a generalized understanding of the state of well-being within the field of sign language interpreting and contributes to publicly available data that will allow for the development of industry-specific benchmarks. The NIOSH WellBQ is a valid measure that offered a comprehensive assessment of sign language interpreter well-being. Internal consistency was acceptable for all domains except for the home, community, and society. The Cronbach’s alpha was slightly lower than what is considered acceptable, likely, because of the lower number of items within that domain. Interpreters were marginally satisfied with their benefits and chances for advancement and neutral in their responses about management trust and a culture of health and safety practices at work. 5% were sexually harassed, 13% experienced work-related physical violence, 26% reported work-related bullying, and 13% experienced a work-related injury. Of those who were injured, 64% had a consequence from the injury. Half of all American adults have 1 or more chronic condition, 42% have 2 or more, and 12% have at least 5. 29 Interpreters shared having 2.4 ± 1.4 chronic conditions. In the past 30 days, interpreters had 7 days of poor physical health and 9 days of poor mental health. The physical activity guidelines for American adults recommend ≥150 minutes/week of moderate-intensity physical activity and ≥75 minutes/week of vigorous-intensity physical activity. 29 Interpreters shared doing ≥87 minutes/week and ≥36 minutes/week of each level of physical activity, respectively. The dietary guidelines for Americans recommend 4 to 5 servings of fruits and vegetables/day and ≤1 alcoholic beverage/day (≤7 drinks/week) for biological females and ≤2 drinks/day (≤14 drinks/week) for biological males. 30 Interpreters shared consuming between 2 to 3 servings of fruits and vegetables in a normal day and 2 drinks/week. However, the average drinks/week had a high variability and 39% reported risky drinking over the past year at least once. 57% responded with slight difficulty or greater with cognitive functioning and 42% had a slight work limitation or greater due to a physical, mental, or emotional condition.
In addition to contributing to normative values for this occupation within the services industry sector, the use of the WellBQ in this study highlighted areas of focus for future health promotion practice and research. However, there were some limitations to using the WellBQ as an outcome measure in research. It does not offer a composite score. The respective domains being measured by constructs within the subdomains was tricky. Most subdomains contain multiple constructs, each with separate scores. Subsequently, there are concerns with reporting the multiple constructs to regulatory entities and making multiple comparisons across timepoints with statistical analyses in subsequent work. Constructs are assessed by a single item or multiple items. Scoring varies and rating scales differ across the constructs (and even within some of the constructs) in some of the subdomains, which was challenging. There are items with 4-, 5-, or 7-point Likert scales. Items are both positively and negatively worded and there is a mix of not only ordinal data but scale and dichotomous data, as well. While these variations served as a form of attention checking to ensure authentic survey response, they made calculating the internal consistency of the domains and interpretation at a quick glance difficult. Regarding limitations of this research, the cross-sectional design limits our ability to detect causal inference. As with any survey research, there is a potential for selection bias – interpreters who self-selected to complete the survey versus those who did not. While a fairly representative sample of the sign language interpreting field was recruited across demographics, geographical regions, and practice settings, it’s important to note this sample only represented 1.6% of the number of certified interpreters within the national professional association for sign language interpreters. 24 Thus, the reader is cautioned about the generalizability of these findings.
To our knowledge, this is the first comprehensive quantitative assessment of occupational safety, health, and well-being within the sign language interpreting field. The conclusions reveal organizational and individual influences on sign language interpreter well-being. The Health Enhancement Research Organization (HERO) has created a clearinghouse to gather deidentified data from organizations using the WellBQ and those data will allow for the development of normative values across industry sections,
31
however, as far as we are aware, no normative values are available just yet to further aide in our interpretation of the findings from this study. In the absence of normative values for the services industry sector, particularly business and professional services, several constructs seemed to emerge as areas of concern warranting improvements in health promotion practice and further health promotion research. Interpreters were marginally satisfied with benefits and chances for advancement, health culture, and safety climate at work. The constructs of work-related incivility, days of poor physical and mental health, chronic health conditions, risky drinking, cognitive functioning limitations with subsequent work limitations, work-related injury with significant injury consequences, and financial insecurity were all high. Future program evaluations or investigations of interventions intended to impact any of these outcomes or a combination thereof have the potential to meaningfully advance sign language interpreter well-being.
While past research has investigated physical health concerns of sign language interpreters, there is growing evidence regarding other adverse health exposures warranting a more integrated approach.
To our knowledge, this is the first comprehensive quantitative assessment of occupational safety, health, and well-being within the sign language interpreting field.
Areas of focus for future health promotion practice and research with sign language interpreters include fostering a health culture and safety climate at work, addressing work-related incivility, and promoting physical, mental, emotional, cognitive, and financial health.So What? (Implications for Health Promotion Practitioners and Researchers)
What is Already Known About This Topic?
What Does This Article Add?
What are the Implications for Health Promotion Practice or Research?
Footnotes
Acknowledgement
The authors would like to thank the interpreters who participated in this study for their commitment to promoting sign language interpreter well-being.
Ethical Considerations
This study was reviewed by the University of Rochester’s Research Subjects Review Board (STUDY00008720) and was deemed exempt.
Consent to Participate
Due to its less-than-minimal risk, written informed consent was not required. Instead, an information sheet was reviewed with all participants in advance of beginning data collection.
Author Contributions
Conceptualization: GR; Data curation: GR; Formal analysis: GR and TL; Funding acquisition: GR, CD, RY-N, and TL; Investigation: GR; Methodology: GR, CD, RY-N, and TL; Project administration: GR; Supervision: CD, RY-N, and TL; Visualization: GR; Writing—original draft: GR; Writing—review and editing: GR, CD, RY-N, and TL.
Funding
The authors disclosed receipt of the following financial support for the research, authorship, and/or publication of this article: The project described in this publication was supported by a Mentored Research Scientist Development Award (K01 OH012441) from the National Institute for Occupational Safety and Health at the Centers for Disease Control and Prevention (Roman).
Declaration of Conflicting Interests
The authors declared no potential conflicts of interest with respect to the research, authorship, and/or publication of this article.
Data Availability Statement
Requests for access to the dataset should be directed to the corresponding author.
Appendix
Scales and Ratings, Number of Items, and Coding and Scoring for The National Institute for Occupational Safety and Health Worker Well-Being Questionnaire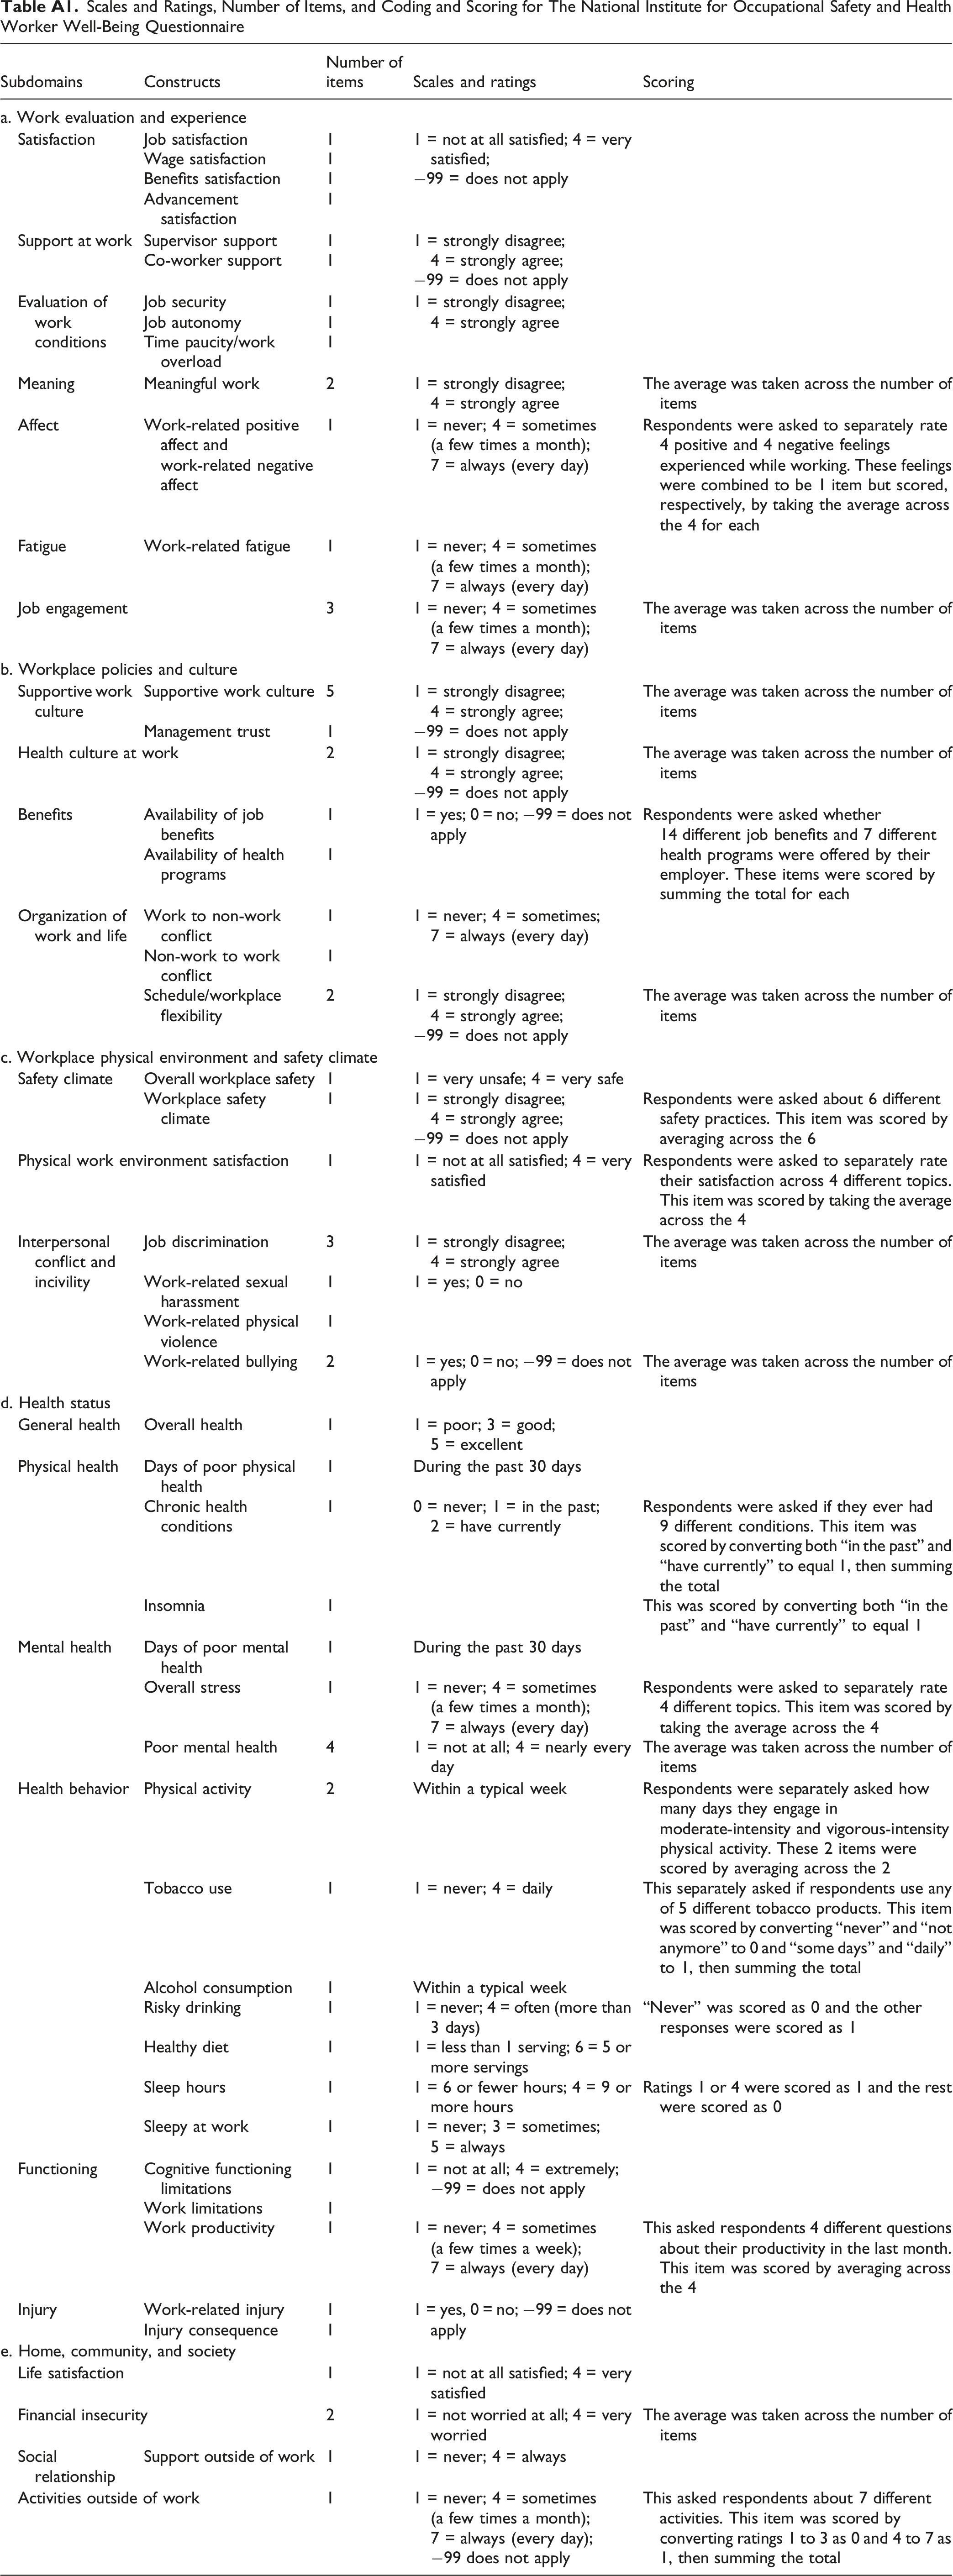
Subdomains
Constructs
Number of items
Scales and ratings
Scoring
a. Work evaluation and experience
Satisfaction
Job satisfaction
1
1 = not at all satisfied; 4 = very satisfied;
−99 = does not apply
Wage satisfaction
1
Benefits satisfaction
1
Advancement satisfaction
1
Support at work
Supervisor support
1
1 = strongly disagree; 4 = strongly agree;
−99 = does not apply
Co-worker support
1
Evaluation of work conditions
Job security
1
1 = strongly disagree; 4 = strongly agree
Job autonomy
1
Time paucity/work overload
1
Meaning
Meaningful work
2
1 = strongly disagree; 4 = strongly agree
The average was taken across the number of items
Affect
Work-related positive affect and work-related negative affect
1
1 = never; 4 = sometimes (a few times a month); 7 = always (every day)
Respondents were asked to separately rate 4 positive and 4 negative feelings experienced while working. These feelings were combined to be 1 item but scored, respectively, by taking the average across the 4 for each
Fatigue
Work-related fatigue
1
1 = never; 4 = sometimes (a few times a month); 7 = always (every day)
Job engagement
3
1 = never; 4 = sometimes (a few times a month); 7 = always (every day)
The average was taken across the number of items
b. Workplace policies and culture
Supportive work culture
Supportive work culture
5
1 = strongly disagree; 4 = strongly agree;
−99 = does not applyThe average was taken across the number of items
Management trust
1
Health culture at work
2
1 = strongly disagree; 4 = strongly agree;
−99 = does not applyThe average was taken across the number of items
Benefits
Availability of job benefits
1
1 = yes; 0 = no; −99 = does not apply
Respondents were asked whether 14 different job benefits and 7 different health programs were offered by their employer. These items were scored by summing the total for each
Availability of health programs
1
Organization of work and life
Work to non-work conflict
1
1 = never; 4 = sometimes; 7 = always (every day)
Non-work to work conflict
1
Schedule/workplace flexibility
2
1 = strongly disagree; 4 = strongly agree;
−99 = does not applyThe average was taken across the number of items
c. Workplace physical environment and safety climate
Safety climate
Overall workplace safety
1
1 = very unsafe; 4 = very safe
Workplace safety climate
1
1 = strongly disagree; 4 = strongly agree;
−99 = does not applyRespondents were asked about 6 different safety practices. This item was scored by averaging across the 6
Physical work environment satisfaction
1
1 = not at all satisfied; 4 = very satisfied
Respondents were asked to separately rate their satisfaction across 4 different topics. This item was scored by taking the average across the 4
Interpersonal conflict and incivility
Job discrimination
3
1 = strongly disagree; 4 = strongly agree
The average was taken across the number of items
Work-related sexual harassment
1
1 = yes; 0 = no
Work-related physical violence
1
Work-related bullying
2
1 = yes; 0 = no; −99 = does not apply
The average was taken across the number of items
d. Health status
General health
Overall health
1
1 = poor; 3 = good; 5 = excellent
Physical health
Days of poor physical health
1
During the past 30 days
Chronic health conditions
1
0 = never; 1 = in the past; 2 = have currently
Respondents were asked if they ever had 9 different conditions. This item was scored by converting both “in the past” and “have currently” to equal 1, then summing the total
Insomnia
1
This was scored by converting both “in the past” and “have currently” to equal 1
Mental health
Days of poor mental health
1
During the past 30 days
Overall stress
1
1 = never; 4 = sometimes (a few times a month); 7 = always (every day)
Respondents were asked to separately rate 4 different topics. This item was scored by taking the average across the 4
Poor mental health
4
1 = not at all; 4 = nearly every day
The average was taken across the number of items
Health behavior
Physical activity
2
Within a typical week
Respondents were separately asked how many days they engage in moderate-intensity and vigorous-intensity physical activity. These 2 items were scored by averaging across the 2
Tobacco use
1
1 = never; 4 = daily
This separately asked if respondents use any of 5 different tobacco products. This item was scored by converting “never” and “not anymore” to 0 and “some days” and “daily” to 1, then summing the total
Alcohol consumption
1
Within a typical week
Risky drinking
1
1 = never; 4 = often (more than 3 days)
“Never” was scored as 0 and the other responses were scored as 1
Healthy diet
1
1 = less than 1 serving; 6 = 5 or more servings
Sleep hours
1
1 = 6 or fewer hours; 4 = 9 or more hours
Ratings 1 or 4 were scored as 1 and the rest were scored as 0
Sleepy at work
1
1 = never; 3 = sometimes; 5 = always
Functioning
Cognitive functioning limitations
1
1 = not at all; 4 = extremely; −99 = does not apply
Work limitations
1
Work productivity
1
1 = never; 4 = sometimes (a few times a week); 7 = always (every day)
This asked respondents 4 different questions about their productivity in the last month. This item was scored by averaging across the 4
Injury
Work-related injury
1
1 = yes, 0 = no; −99 = does not apply
Injury consequence
1
e. Home, community, and society
Life satisfaction
1
1 = not at all satisfied; 4 = very satisfied
Financial insecurity
2
1 = not worried at all; 4 = very worried
The average was taken across the number of items
Social relationship
Support outside of work
1
1 = never; 4 = always
Activities outside of work
1
1 = never; 4 = sometimes (a few times a month); 7 = always (every day); −99 does not apply
This asked respondents about 7 different activities. This item was scored by converting ratings 1 to 3 as 0 and 4 to 7 as 1, then summing the total