
Abstract
Recent models of personality development have emphasized the role of the environment in terms of selection and socialization effects and their interaction. Our study provides partial evidence for these models and, crucially, extends these models by adding a person variable: Core beliefs, which are defined as mental representations of experiences that individuals have while pursuing need-fulfilling goals. Specifically, we report results from a longitudinal investigation of the development of trait greed across time. Based on data from the German Personality Panel, we analyzed data on 1,965 young adults on up to 4 occasions, spanning a period of more than 3 years. According to our results, negative core beliefs that have so far been proposed only in the clinical literature (e.g., being unloved or being insecure) contributed to the development of trait greed, indicating that striving for material goals might be a substitute for unmet needs in the past. Additionally, greedy individuals more often self-selected themselves into business-related environments, which presumably allow them to fulfill their greed-related need to earn a lot of money. Our results expose important mechanisms for trait greed development. Regarding personality development in general, core beliefs were identified as an important variable for future theory building.
Greed has been called the root of all evil—radix malorum est cupiditas. Defined as an insatiable, excessive desire for more, especially money, greedy individuals’ selfish striving often comes at the expense of others (Krekels & Pandelaere, 2015; Lambie & Haugen, 2019; Mussel & Hewig, 2016; Seuntjens, Zeelenberg, Breugelmans et al., 2015; Vohs et al., 2006; Webster, 2013). Real-life consequences of trait greed were discussed during the 2008 financial crisis, which was allegedly at least partially caused by the risky and reckless behavior of greedy investment bankers (Cohn et al., 2014; Sajko et al., 2021), and during the Covid-19 pandemic, when elected representatives in Germany abused their mandate to get rich through commission payments for the trading of surgical face masks. Thus, knowledge about trait greed, including possible antecedents or developmental covariates, is pivotally important not only for research but potentially also for society. However, studies shedding light on the development of trait greed are still largely unknown. In the present study, we report results from a longitudinal investigation of the development of trait greed in a sample of young adults during the transition from high school to work, presumably undergoing a period of intense changes in their social roles (e.g., starting university or first job, moving away). We investigated two potentially important variables that might underlie the development of trait greed: First, we postulate that features of the environment interact with trait greed in an ongoing interplay of selection and socialization. Second, we postulate that cognitive variables in the form of core beliefs (i.e., mental representations about the self and others) might explain the development of trait greed (Dweck, 2017).
Trait greed
Trait greed is a unique construct that is not fully represented in the Big Five but has been found to be most strongly associated with low levels of agreeableness (Mussel & Hewig, 2016; Veselka et al., 2014). Thus, trait greed has been shown to possess incremental predictive validity over and above the Big Five domains and aspects with regard to criteria that are theoretically related to greed such as selfish decisions in common goods and Ultimatum games, risky decisions when trading stocks, and positive and negative emotional reactions after winning and losing money, respectively (Mussel & Hewig, 2016). Regarding the HEXACO model (Ashton et al., 2014), trait greed is theoretically and empirically related to honesty-humility, especially the facet greed-avoidance (e.g., Mussel et al., 2018, report correlations between .57 and .75 for different greed measures). However, the latter rather reflects low levels of materialism, defined as the propensity to enjoy buying things beyond what is necessary and to appreciate one’s property and belongings (Richins & Dawson, 1992). Whereas wanting to buy things also pertains to trait greed and actually represents its major objective (Seuntjens, Zeelenberg, Breugelmans et al., 2015), greed is not limited to striving for money or material goods but may be directed toward various objects (e.g., food, recognition; see Lambie & Haugen, 2019). Additionally, greed-avoidance from the HEXACO model lacks the aspects of insatiability and excessiveness.
Regarding its nomological net, greed can be related to the constructs miserliness, stinginess, and envy (Hur et al., 2011; Smith et al., 1999), which all relate to striving for possessions. However, while miserliness and stinginess both refer to things which someone already possesses and does not want to lose, greed refers to accumulating more, thus far not obtained objects. Envy and greed share a motivation of obtaining certain goods, but only the former includes a social comparison with another person in terms of wishing to have something that someone else has (van de Ven et al., 2009). As greed is defined as selfish behavior that comes at the expense of others (Mussel & Hewig, 2016), it can be conceptually related to dark personality traits (Paulhus & Williams, 2002). Thus, it shares the core of the dark factor of personality in terms of maximizing one’s individual utility while disregarding, accepting, or malevolently provoking disutility for others (Moshagen et al., 2018). Moshagen, Zettler and Hilbig (2020) investigated items from two established greed scales along with eleven other dark traits (e.g., the dark triad; spitefulness; sadism). The authors found support for a single factor, the D-factor, accounting for the majority of the variance in the dark traits, on which greed loaded substantially (.53). Thus, greed can be expected to belong to the umbrella of dark traits (Moshagen, Zettler, Horsten et al., 2020). Also on conceptual considerations, trait greed can be related to the factor antagonism of the hierarchical taxonomy of psychopathology (Widiger et al., 2019). Antagonism is conceptualized as psychopathological manifestation of low levels of agreeableness and is characterized, among others, by callousness and a lack of concern for others or guilt (Sleep et al., 2021).
Regarding valence, economic theories have highlighted the beneficial effects that result from all agents in a market striving for their personal well-being (memorably summarized as “greed is good” by the character Gordon Gecko in the film “Wall Street”; Akhtar et al., 2013; Neumann & Morgenstern, 1944). However, psychological research has drawn a different picture. In line with the theological notion of a deadly sin, trait greed has been found to be related to psychopathy, especially meanness (Mussel & Hewig, 2016; Veselka et al., 2014). For example, individuals high on trait greed take more resources for themselves in common goods scenarios and take greater risks than individuals low on trait greed (Mussel et al., 2015; Seuntjens, Zeelenberg, Van de Ven et al., 2015; Yamagishi & Sato, 1986).
On the neural level, greedy individuals exhibit a diminished neural response to positive feedback compared with negative feedback, indicating that they may have trouble learning from experience and adjusting their behavior accordingly, similar to the pattern that has been found for sociopathic individuals (Mussel et al., 2015; Mussel & Hewig, 2019). To date, much less is known about the development of trait greed.
Personality development
Personality is characterized by both continuity and change throughout adulthood (Specht et al., 2014). For the Big Five, the rank-order stability in adulthood can go as high as .70 (Roberts & DelVecchio, 2000). At the same time, there are both normative mean-level changes and individual differences in change across time (Kandler et al., 2015; Lucas & Donnellan, 2011; Roberts & Mroczek, 2008). Regarding normative mean-level changes, an increase in emotional stability, agreeableness, and conscientiousness during adolescence and young adulthood was found and named the maturity principle, indicating that such changes might reflect the process by which individuals become productive members of society (Roberts et al., 2001). Similar patterns have been observed for the HEXACO model of personality, including an increase in honesty-humility during the life span (Ashton & Lee, 2016; Milojev & Sibley, 2017).
Changes often occur during life transitions, such as engaging in a new relationship, starting an apprenticeship, changing jobs, or moving to a different location (Bleidorn, 2012; Hutteman et al., 2015; Jackson et al., 2012; Wrzus & Neyer, 2016). The neo-socioanalytic theory (Roberts & Wood, 2006) provides a framework for explaining personality stability and change. Accordingly, the theory posits that personality may change in reaction to the environment throughout the life span in terms of socialization effects. Effects of the environment on personality occur as individuals take on and invest in new social roles (termed the social investment principle). In line with a bottom-up process of personality development (Roberts & Mroczek, 2008), changes in individuals’ social roles require changes in behavior. Recurrent changes in behavioral patterns are believed to reflect changes in personality over time (Baumert et al., 2017; Geukes et al., 2018; Roberts, 2018; Wrzus & Roberts, 2017). In addition, individuals select themselves into environments that match their personality. The interplay between selection and socialization effects has been referred to as the corresponsive principle (Caspi & Roberts, 2001; Jackson et al., 2012; Noftle & Fleeson, 2010; Roberts & Wood, 2006; Wrzus et al., 2016).
Regarding the development of trait greed, societal and environmental influences related to a capitalist economy may be relevant features of the environment. For example, a cross-sectional study found that economics students have higher scores on trait greed than students in other disciplines (Wang et al., 2011). Accordingly, spending a substantial amount of time focusing on topics such as money or stocks may impact attitudes and behavior and ultimately personality. In addition, according to selection effects, greedy individuals might self-select themselves into environments that match their personality. As greedy individuals pursue the goal of earning a lot of money to satisfy their greed, they might strive for jobs in the enterprising or financial domains, which are typically high paying (Frey & Meier, 2003). In line with this hypothesis, de Vries et al. (2016) proposed that individuals low on honesty-humility might more likely select situations which allow for exploitation of resources such as money, and McKay and Tokar (2012) found individual differences in honesty-humility to be negatively related to enterprising interests.
According to the reasoning above, we propose that individuals with higher compared with lower levels of trait greed should self-select into business-related occupations or educational programs (selection effects). We also propose that individuals in business-related occupations or enrolled in business-related educational programs should show larger increases or smaller decreases in trait greed (socialization effects). A well-accepted model categorizing occupations and educational programs is the RIASEC model (Holland, 1997). It postulates six domains: Realistic, Intellectual, Artistic, Social, Enterprising, and Conventional. Business-related occupations or educational programs that, on the one hand, are concerned with topics such as money or stocks and, on the other hand, allow people to earn a lot of money, are often found in the enterprising domain according to Holland (1997).
We investigate development of trait greed in a sample of young adults. As mentioned above, personality development primarily occurs in so-called critical time periods. Young adulthood is such a critical time period, characterized by mutually shared developmental tasks, such as starting an apprenticeship or going to university, moving out from one’s parents’ home, potentially to a different city, engaging in serious romantic relationships, or starting one’s first job. In line with this reasoning, research has shown that comparatively large and robust changes in personality take place in young adulthood (Grosz et al., 2019; Jackson et al., 2012; Ludtke et al., 2011; Specht et al., 2014).
Core beliefs
The interplay between personality and environmental factors may be only half the story. As a second principle, we propose that personal factors in the form of core beliefs may contribute to the development of trait greed. Core beliefs are mental representations individuals hold about themselves, others, and the world in general. The concept of core beliefs has been developed in different areas of psychology, especially clinical and social-cognitive psychology, and can be traced back to the early work by Alfred Adler (1913, 2010) and Eric Berne (1964). For example, Beck (1970) proposed that beliefs are central for explaining and modifying psychological malfunctioning in the context of cognitive therapy. Young et al. (2003) proposed a range of different core beliefs that are organized in schemas, such as schemas relating to emotional deprivation, abandonment, or social isolation (see Elliott & Lassen, 1997). Finally, in social-cognitive psychology, beliefs relating to locus of control or self-efficacy have been proposed (Bandura, 1993; Gist & Mitchell, 1992; Judge et al., 2002).
It is assumed that core beliefs are formed on the basis of an individual’s experiences when pursuing need-fulfilling goals (Dweck, 2017). For example, to fulfill the basic need for acceptance, a baby may cry until its parents care for it. If a child only sometimes experiences their parents responding with caretaking, they may form a core belief related to uncertainty or unpredictability. In yet another example, if a parent comes to check on a child but does not really engage in care, the child may form the core belief that they are unloved (Bowlby, 1969). Or, if a parent only engages with their baby when it is happy, the baby may form a belief of conditional self-worth (Bowlby, 1977). As these examples illustrate, beliefs may already form early in life in response to parental bonding (Ainsworth, 1989; Bakermans-Kranenburg et al., 2003; DeWolff & van Ijzendoorn, 1997; Young et al., 2003). For instance, Turner et al. (2005) found that in a group of overweight women, the perceived level of maternal care was negatively correlated with negative self-beliefs, such as fears of abandonment, subjugation, or insufficient self-control. Coates and Messman-Moore (2014) found that core beliefs mediated the relation between childhood psychological maltreatment and depression in emerging adult women. On the other hand, experiences shaping core beliefs are not restricted to childhood but may be experienced across the entire life span, and they are also not restricted to attachment but may result from all kinds of need-fulfilling striving (e.g., due to work-related experiences; Mencl et al., 2012; Platts et al., 2002).
The present research does not focus on how core beliefs emerge but rather on how they impact personality development after they have been established. Core beliefs have only recently been proposed as a variable that influences personality development (Dweck, 2017) and have rarely been investigated empirically (for an exception, see Mussel, 2019). The assumption underlying this process is that core beliefs influence the kind of goals individuals set and how these goals are approached, leading to altered actions and experiences. Personality is considered to reflect actions and experiences that are shown repeatedly across time. Thus, personality development occurs as core beliefs influence the actions and experiences that are shown repeatedly across time.
Regarding the influence of core beliefs on the development of trait greed, we propose that the excessive striving for money or material goods that characterizes individuals with high compared with low levels of trait greed may be a compensatory behavior resulting from negative core beliefs (Christopher et al., 2006; Cozzolino et al., 2004; Jonas et al., 2013; Sun et al., 2020). Negative core beliefs may be formed when individuals have negative experiences while pursuing need-fulfilling goals, as illustrated in the examples above. These negative core beliefs are thus mental representations from experiences in which a lack of security, control, autonomy, or affirmation was experienced. Individuals holding such beliefs may strive for money, luxury, or wealth as a substitute for obtaining the security, control, autonomy, or affirmation they may have lacked elsewhere at some point in their lives (Belsky et al., 1991; Chen, 2018). Ultimately, negative core beliefs might result in a larger increase or smaller decrease in trait greed.
Hypotheses
To sum up, we propose that (a) individuals with higher compared with lower levels of trait greed will self-select into business-related occupations and educational programs; that (b) individuals who are enrolled in business-related occupations and educational programs will show a larger increase or smaller decrease in trait greed compared with individuals in other occupations and educational programs; and (c) that individuals with higher compared with lower levels of negative core beliefs will show a larger increase or smaller decrease in trait greed. Before testing these hypotheses in Study 2, we report results from two studies (Studies 1a and 1b) that were aimed at identifying and assessing the negative core beliefs that might influence trait greed development.
Study 1: Identification, measurement, and validity of core beliefs
Study 1 is preparatory for the main Study 2. We identified core beliefs that may underlie trait greed development. Furthermore, we developed and validated a corresponding measure for assessing these core beliefs.
The starting point for identifying the core beliefs that are related to trait greed development was our hypothesis that the excessive striving for money and material goods might be a compensatory mechanism for unfulfilled needs in the past. In particular, we identified core beliefs that might reflect the experience of a lack of security, control, autonomy, or affirmation.
Our definition of core beliefs and their role in personality development was based on the work of Carol Dweck (2017). Accordingly, we define core beliefs as mental representations that individuals hold about themselves, others, and the world in general that develop as a result of experiences individuals have when pursuing need-fulfilling goals.
The literature on core beliefs, however, is scattered, non-exhaustive, and not well integrated. Prominent approaches stem from social-cognitive psychology, including the work by Rotter (1966) and Bandura (1977). Unnoticed by these approaches, a by far larger contribution to the field of core beliefs originates from clinical psychology, especially cognitive therapy, including the proposed schemas by Jeffrey Young (1994). Additionally, single, more specific core beliefs have been suggested in diverse contexts, such as the belief in a competitive jungle world (Duckitt et al., 2002) or the belief of personality traits as rather malleable or determined (labeled as mind set, Dweck, 2012). Finally, there are domain-specific approaches which assess beliefs in specific domains like ecology (Wolsink & Breukers, 2010), politics (Feldman, 1988), post-traumatic events (Cann et al., 2010), or religion (Batson et al., 1993), which might not be as central as other beliefs, at least for some individuals. Thus, to our knowledge, an integrated model of core beliefs does currently not exist.
Scale development
Therefore, we pursued a novel approach. Based on a literature review and preliminary studies (reported elsewhere), we identified core beliefs which may contribute to the development of trait greed according to the hypothesis outlined above. Specifically, core beliefs were considered when we assumed that they may reflect a lack of security, control, autonomy, or affirmation. A total of six core beliefs met this criterion: (a) being unloved, (b) being unworthy, (c) unpredictability, (d) alienation, (e) conditional self-worth, and (f) insecure attachment. Next, we developed a measure with 22 items to assess these beliefs. Thereby, each belief is assessed with three items, with the only exception of core beliefs that pertained to unpredictability, which consists of at least three related but distinct facets: low internal control (e.g., “I don’t think that I can actively control my future”), fatal beliefs (e.g., “What happens often depends on chance”), and powerful others (e.g., “Lots of things happening in my life depend on others”) (see Krampen, 1991; Levenson, 1972). To account for this heterogeneity, a total of seven (rather than three) items were used for core beliefs related to unpredictability, which were subsequently aggregated into three parcels using the item-to-construct balance method developed by Little et al. (2002). The resulting 22 items are included in the preregistration of Study 2 1 and are referred to as the Negative Core Belief Scale.
Study 1a: Item analysis
The items of the Negative Core Belief Scale were pretested regarding reliability and factor structure. 2 Therefore, the items were administered to a sample via the platform Clickworker.
Participants
A total of 260 participants were recruited via Clickworker and refunded with 50 Cents. Participants were on average 37 years of age (SD = 11.4); 121 (48%) indicated that they were female, 128 male, and 2 nonbinary or other (six respondents had missing data).
Measures
The 22 items of the Negative Core Belief Scale were presented with other core belief items. Items were scored on a 7-point rating scale, ranging from “does not apply at all” to “fully applies.” Item content for the Negative Core Belief Scale is available on OSF. 3
Careless responding
We used a self-report measure of response quality at the end of the test battery (“Did you work conscientiously on the test?”) for identifying potential careless responding. Participants were informed that their responses would not affect their financial compensation. Nine participants answered “No” and were excluded from further analyses.
Statistical analyses
As noted above, the seven items belonging to the core belief unpredictability were aggregated into three parcels using the item-to-construct balance method developed by Little et al. (2002). The reliability indices alpha and omega were estimated for the six negative core beliefs via the function reliability (R package semTools). Correlations between the six beliefs were estimated via the function cor (R package stats). Finally, we investigated the factor structure of the Negative Core Belief Scale via the function sem (R package lavaan) by proposing six latent correlated factors, each indicated by the corresponding items of a negative core belief, using the robust maximum likelihood estimator MLR. To investigate discriminant validity, the model is compared with a general factor model, which, additionally, assumes that all six dimensions load equally on a general higher order factor.
Results
Reliability estimates and intercorrelations of the six core beliefs in Study 1a.
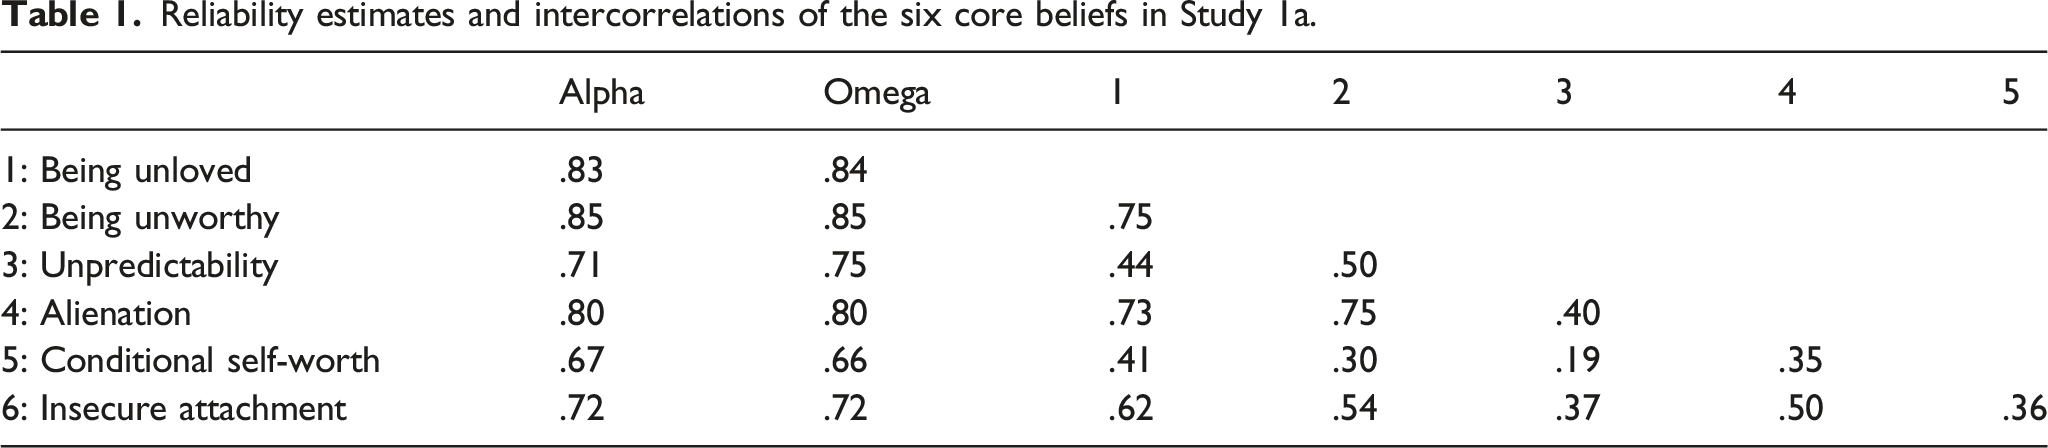
A confirmatory factor analysis with six latent variables for the six negative core beliefs, each indicated by the three corresponding indicator variables, exhibited a close fit (χ2 = 214, df = 120, CFI = .945, RMSEA = .06, GFI = .90, SRMR = .06). Model fit was considerably worse (χ2diff = 143, dfdiff = 14, p < .001) for a one-factorial model (χ2 = 357, df = 134, CFI = .869, RMSEA = .09, GFI = .84, SRMR = .23), providing further evidence of discriminant validity.
Study 1b: External validity
We investigated the nomologic net of the Negative Core Belief Scale by estimating convergent and discriminant external validity with regard to a range of theoretically related constructs. In particular, the following constructs were investigated: Competitive jungle world view (Duckitt et al., 2002); core self-evaluation (Judge et al., 2002); the domain disconnection/rejection (dimensions emotional deprivation, abandonment, mistrust/abused, social isolation, and defectiveness) from the Young Schema Questionnaire S3 (Young, 1994); and the facet depression from the domain neuroticism (Goldberg, 1992). Study 1b was preregistered.
4
The following hypotheses were tested: 1. The six dimensions of the Negative Core Belief Scale show discriminant validity: 1a. In a CFA, a model with correlated latent factors shows better fit than a model with a general factor (replicating results from Study 1a); 1b. The six dimensions differ in their correlation with related variables (competitive jungle world view, core self-evaluation; disconnection/rejection—with sub-dimensions emotional deprivation, abandonment, mistrust/abused, social isolation, and defectiveness—depression) according to the test by Meng et al. (1992). 2. Competitive jungle world view contains negative beliefs of others, which is conceptually related, yet distinct from negative beliefs of one-self. We expect all Negative Belief Scale dimensions to show positive correlations of .40 or above. 3. Core self-evaluations contain positive beliefs about one-self (self-esteem; generalized self-efficacy; internal locus of control, and emotional stability). We expect all Negative Belief Scale dimensions to show negative correlations of .40 or above. 4. Schemata related to disconnection/rejection are conceptually strongly related to negative core beliefs; however, schemata are broader than beliefs as they also assess behavior and emotions. We expect all Negative Belief Scale dimensions to show positive correlations of .50 or above with the domain disconnection/rejection. In addition, regarding the dimensions of this domain and according to conceptual overlap, we expect higher correlations for the following pairs of correlations, compared to the correlation with all other disconnection/rejection dimensions: 4a. being unloved with emotional deprivation, 4b. alienation with isolation, 4c. insecure attachment with abandonment, and 4d. being unworthy with defectiveness. 5. We expect the Negative Core Belief Scale dimensions to be positively correlated, yet non-identical, to depression, with correlations ranging between .40 < r < .80.
Participants
Data were collected via the panel platform Clickworker. Participants received 2 Euro for participation. An a priori power analysis for correlations of r = .30 with α = .05 and β = .95 revealed a sample size of N = 115. For the confirmatory factor analyses, a priory power analysis with df = 120, α = .05, β = .95, ε0 = .05; and εa = .08 (via the R package semTools) revealed a sample size of N = 172. The latter was our aimed at sample size with valid data. We aimed to collect data on an additional of 25% (N = 57) to account for expected dropout due to careless responding. In the end, 233 individuals with a mean age of 39 (SD = 12) participated, 92 (41%) female and 131 (59%) male (1 person did not report gender).
Measures
Items from all measures were scored on a 7-point rating scale, ranging from “does not apply at all” to “fully applies.” The following measures were used:
The newly developed Negative Core Belief Scale with 22 items. Item content is available on OSF. 5
The Competitive Jungle World View Scale by Duckitt et al. (2002), German translation by Schilling et al. (2020) with 8 items: The scale begins with the words “Most people…,” followed by the eight items (e.g., “ … think that it is important to have power”).
The Core Self Evaluation Scale by Judge et al. (2002), German translation by Heilmann and Jonas (2010) with 12 items: The scale has four sub-scales which are assessed with 3 items each: Locus of control, self-efficacy, self-esteem, and neuroticism. An example item is “I determine what will happen in my life.”
The domain disconnection/rejection from the Young Schema Questionnaire S3 (Young, 1994), German translation by Berbalk et al. (2006): The domain consists of the dimensions emotional deprivation, abandonment, mistrust/abused, social isolation, and defectiveness, which are assessed with 5 items each.
The facet depression from the domain Neuroticism according to the IPIP-240 (Goldberg, 1992), German translation by Schreiber and Iller (2017), with eight items: An example item is “Seldom feel blue.”
Careless responding
All participants had complete data on all study variables. We used a self-report measure of response quality at the end of the test battery (“Did you work conscientiously on the test?”) for identifying potential careless responding. Participants were informed that their responses would not affect their financial compensation. Only three participants answered “No” and were excluded from further analyses. Thus, a lower number of participants showed careless responding, compared to our assumptions outlined in the preregistration and, accordingly, the final sample size (N = 230) is larger than the aimed for sample size.
Statistical analyses
The seven items belonging to the core belief unpredictability were aggregated into three parcels using the item-to-construct balance method developed by Little et al. (2002), as in Study 1a. Reliability indices alpha and omega for the six negative core beliefs were estimated via the function reliability (R package semTools). Correlations between all study variables were estimated via the function cor (R package stats). The factor structure of the Negative Core Belief Scale was estimated via the function sem (R package lavaan) by proposing six latent correlated factors, each indicated by the corresponding items of a negative core belief, using the robust maximum likelihood estimator MLR. To investigate discriminant validity, the model is compared with a general factor model, which, additionally, assumes that all six dimensions load equally on a general higher order factor. Differences in correlations between the six negative core beliefs, on one hand, and the eleven validation scales were investigated by the test proposed by Meng et al. (1992) which compares two or more variables regarding their correlations with one criterion variable; significance indicates that the variables are differentially correlated with the criterion, thus indicating discriminant validity.
Results
Reliability estimates and intercorrelations of all study variables in Study 1b.
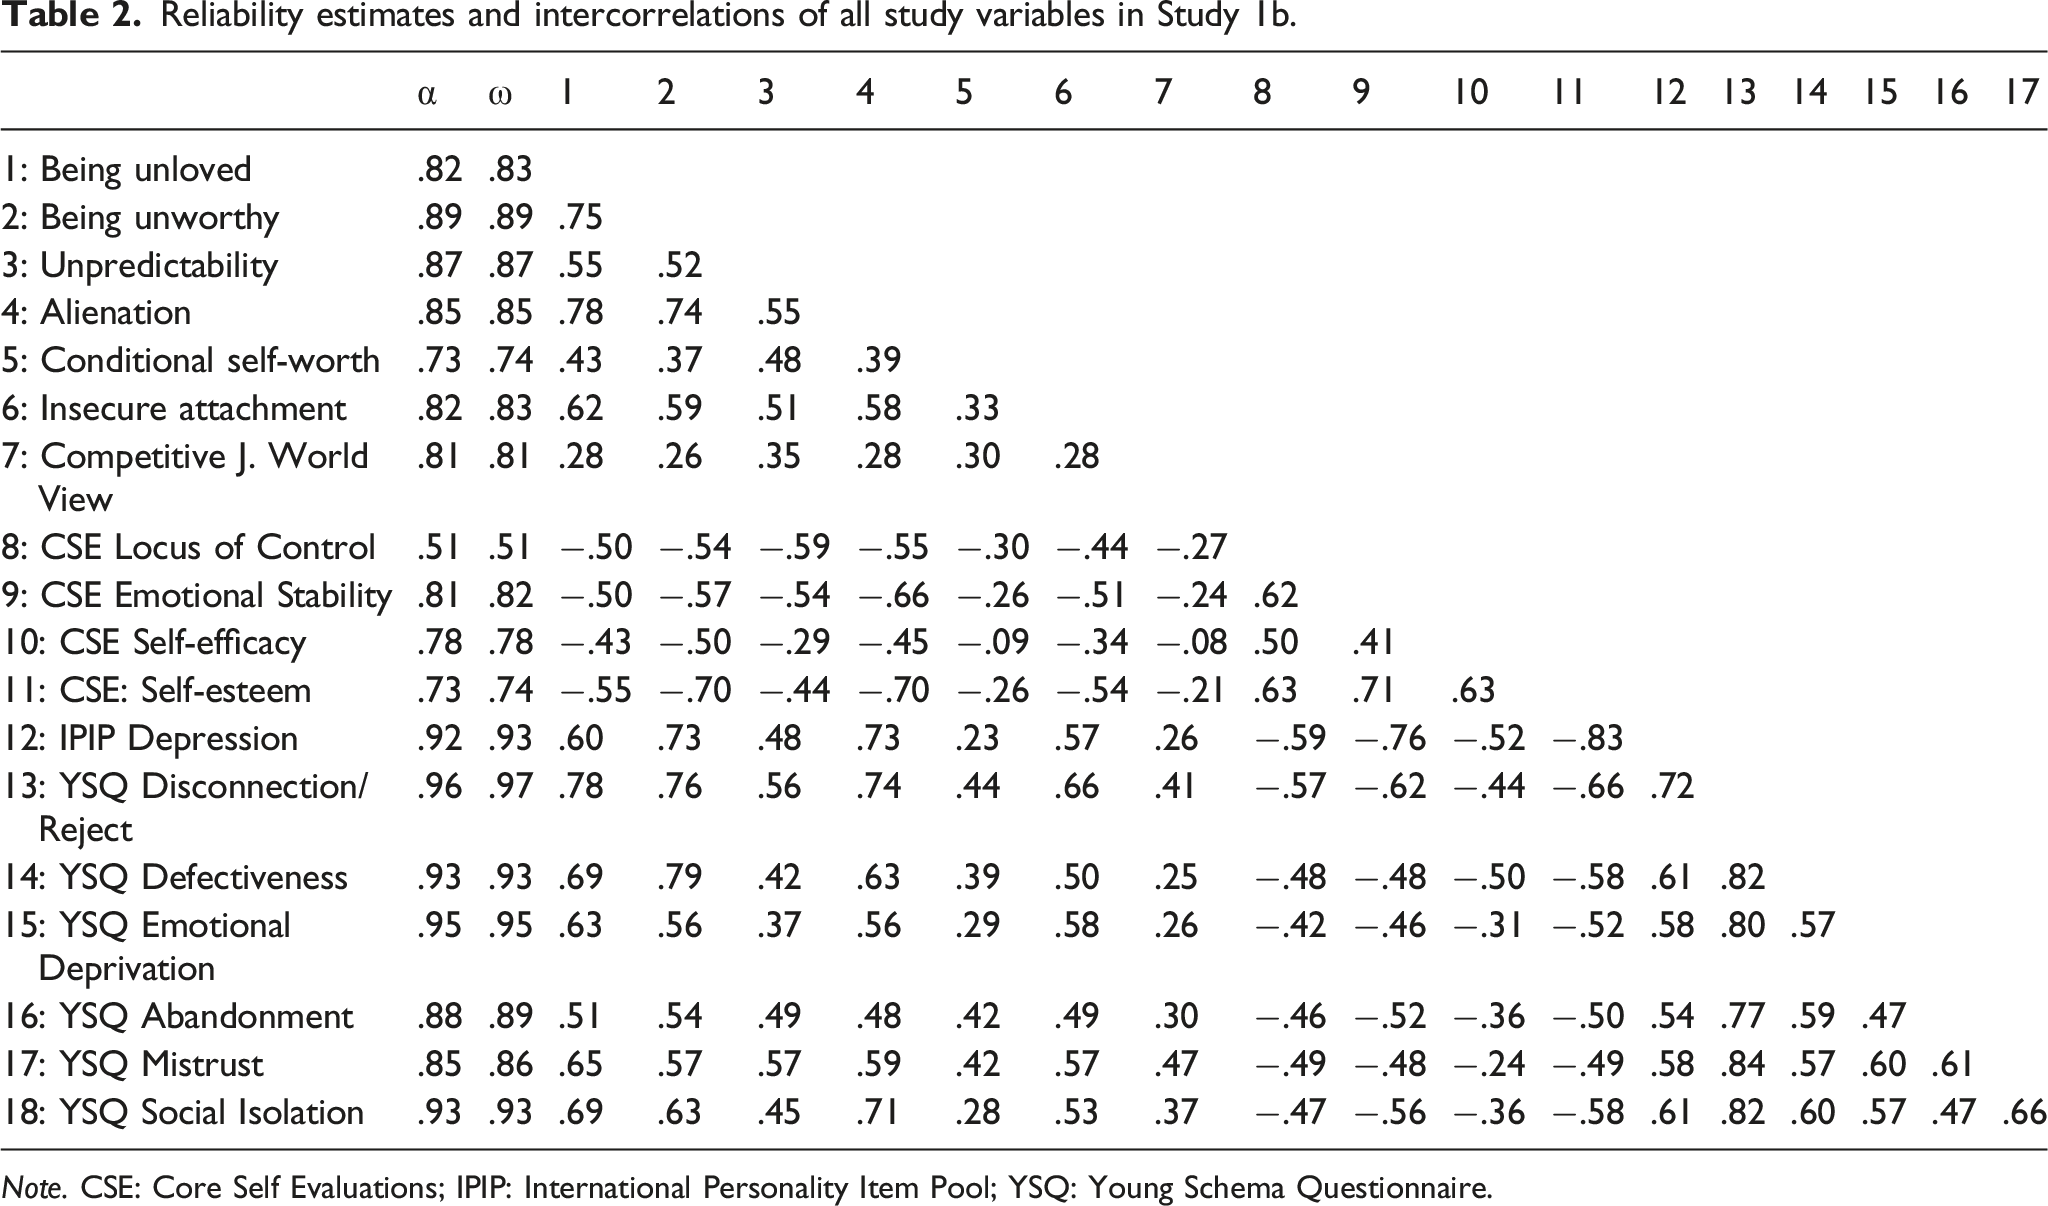
Note. CSE: Core Self Evaluations; IPIP: International Personality Item Pool; YSQ: Young Schema Questionnaire.
A confirmatory factor analysis replicated findings from Study 1a. A model with six latent variables for the six negative core beliefs, each indicated by the three corresponding indicator variables, exhibited a close fit (χ2 = 223, df = 120, CFI = .946, RMSEA = .07, GFI = .87, SRMR = .05). Model fit of a model assuming all latent variables to load on a single latent general factor (χ2 = 257, df = 134, CFI = .927, RMSEA = .08, GFI = .84, SRMR = .11) was significantly worse (χ2diff = 52, dfdiff = 14, p < .001). Latent correlations between the six core beliefs were on average .64. The lowest correlation was found between conditional self-worth and unsecure attachment (.41). Two out of 15 correlations were larger than .85 (being unloved with being unworthy and alienation, .88 and .94, respectively). Thus, regarding internal validity, evidence for discriminant validity from Study 1a could be replicated, thus confirming Hypothesis H1a.
Results for the Meng-test of differences in correlations between negative core beliefs on the one hand and eleven theoretically related scales (as depicted in column 1) on the other in Study 1b.

Note. CSE: Core Self Evaluations; IPIP: International Personality Item Pool; YSQ: Young Schema Questionnaire.
Hypothesis H2 predicted that competitive jungle world view shows positive correlations of .40 or above with all negative beliefs. While all correlations were positive, coefficients ranged from .26 to .35. Thus, H2 was not confirmed.
Hypothesis H3 predicted that all negative core beliefs show negative correlations of .40 or above with the Core Self Evaluation Scale dimensions self-esteem; generalized self-efficacy; internal locus of control, and emotional stability. The hypothesis was confirmed for five out of six negative core beliefs, which showed average correlations between r = −.46 and −.59. The exception were beliefs concerning conditional self-worth, with average correlations of r = −.23.
According to Hypothesis H4, we expected positive correlations between all six negative core beliefs and the domain disconnection/rejection of the Young Schema Questionnaire. The hypothesis was confirmed for five out of six negative beliefs, with correlations ranging from r = .56 to .78. The exception were beliefs regarding conditional self-worth, which correlated r = .44 with the domain disconnection/rejection and thus slightly missed our predicted level.
In addition, we tested four specific correlations (Hypotheses H4a to H4d) according to theoretical overlap between the negative core beliefs and dimensions from the Young Schema Questionnaire. Hypothesis 4a, predicting higher correlations between core beliefs relating to being unloved with emotional deprivation, as compared to the average of all other relations between negative beliefs and schemata, was confirmed (.63 vs. .53, p = .049). Hypothesis 4b predicting higher correlations between core beliefs relating to alienation with social isolation, as compared to all other relations, was confirmed (.71 vs. .53, p < .001). Hypothesis 4c predicting higher correlations between core beliefs relating to insecure attachment with abandonment, as compared to all other relations, was not confirmed (.49 vs. .54, p = .24). Hypothesis 4d predicting higher correlations between core beliefs relating to being unworthy with defectiveness, as compared to all other relations, was confirmed (.79 vs. .53, p < .001).
According to Hypothesis H5, we expect the Negative Core Belief Scale dimensions to be correlated with IPIP depression in the range .40 < r < .80. The hypothesis was confirmed for five out of six negative core beliefs, with correlations ranging from .48 to .73. The exception was beliefs relating to conditional self-worth, which correlated .23 with depression.
Additional exploratory analysis
The analyses regarding discriminant validity investigated all six negative beliefs simultaneously. However, three of them—being unloved, being unworthy, and alienation—had particularly high correlations. We investigated their uniqueness according to the Hypotheses H4a, H4b, and H4d by comparing the convergent validity (i.e., the three correlations as hypothesized, e.g., alienation and social isolation) with discriminant validities (i.e., the six remaining correlations between the three negative core beliefs and the three schemata defectiveness, emotional deprivation, and social isolation). Each of the three schemata showed the highest correlation with the predicted negative belief. On average, convergent validities (.71) were significantly higher compared to discriminant validities (.63, p = .048).
Interim discussion
The purpose of Study 1 was to develop a measure assessing negative core beliefs that are theoretically related to trait greed development, particularly to the excessive striving for money and material goods as a compensatory mechanism for unfulfilled needs in the past. Six core beliefs which satisfied this condition were identified (being unloved, being unworthy, unpredictability, alienation, conditional self-worth, and insecure attachment). Accordingly, we developed a 22-item measure to assess these beliefs and validated it in two samples, investigating reliability, factor structure, discriminant validity, and, along the lines of four preregistered hypotheses, external validity against eleven theoretically related variables.
In relation to the shortness of the scale with only three indicators per belief, reliability was acceptable. Additionally, the expected factor structure was confirmed. A model with six correlated latent variables showed also superior fit compared to a model with an additional general factor, thus providing evidence for discriminant validity. However, some of the negative core beliefs (especially being unloved, being unworthy, and alienation) were strongly correlated. While positive correlations between these beliefs are to be expected due to conceptual overlap, the size of the correlation questions their uniqueness. However, relations with theoretically related external variables indicate that each of these beliefs shows a unique and expected pattern of correlations. Particularly, preregistered hypotheses for all three beliefs with theoretically related dimensions from the Young Schema Questionnaire were confirmed, even when analyzed separately for these three beliefs.
Hypotheses H2, proposing correlations above .40 between negative core beliefs and competitive jungle world view, was not confirmed. While correlations were significant and in the expected direction, they were lower than expected. In light of the pattern of correlations with all investigated variables, it can be assumed that the focus on self versus others diminished the correlations stronger than expected. Thus, while a negative view of the self is related to a negative view of others, these two different views can be clearly separated.
Construct validity with the remaining scales, as investigated in Hypotheses H3, H4, and H5, were largely confirmed, with two exceptions. First, the specific hypothesis for insecure attachment (H4c) was not confirmed. While insecure attachment showed a large correlation of .49 with the schema abandonment, this relation was not higher than non-predicted relations. The lower than predicted relation may be due to bandwidth and fidelity of the two scales. Particularly, the fear of being left by others (i.e., abandonment) is only one aspect of insecure attachment (and reflected in only one of the items of the Negative Core Belief Scale). Other aspects include a fearful attachment style that is associated with worrying about being hurt by others (Bartholomew & Horowitz, 1991), which is not reflected in the dimension abandonment.
Second, hypotheses were not confirmed for conditional self-worth. While all predicted relations were significant and in the expected direction, they were lower than hypothesized. The lower than expected correlation can be traced back to the distinction between core and conditional beliefs according to Beck and Freeman (1990). While core beliefs refer to unconditional assumptions about the self or others in general, conditional core beliefs have an if-then structure. In the present study, conditional self-worth is the only conditional belief. The pattern of correlations shows that conditional self-worth is significantly related with all other variables, yet correlations are somewhat lower (Δr ≈ .20). Given the labels introduced by Beck and Freeman, it is important to note that conditional beliefs still suffice the definition of core beliefs as outlined in the introduction. Thus, they can be described as a distinct, specific form of core beliefs that might have been learned in interactions with others taking advantage of the individual.
In sum, while not all hypotheses have been confirmed, the results generally speak to the utility of the newly developed Negative Core Belief Scale, even though further evidence of its validity would be desirable. Its shortness with regard to the number of items, as well as the length of the items, compared to existing scales, makes it a suitable measure for longitudinal panel studies.
Study 2: Main study
In Study 2, we tested our main hypotheses regarding reciprocal effects of person- and environment-related variables and developmental trajectories in trait greed in a longitudinal study.
Method
Panel and design
The sample used in the present study consisted of participants from the German Personality Panel (GePP, Mussel, 2021). We established the panel by contacting individuals who formerly (in 2016 or 2017) participated in an online career counseling test (berufsprofiling.de). The counseling is free of charge, and participants agreed to be contacted later. According to the scope of the counseling, most individuals had presumably already chosen their first career by that time. Individuals were offered to participate in a research panel. In September 2018, we invited them to participate in a research panel study. Individuals who agreed took an online test that lasted about 35 min. In return, they received feedback on their test results and an Amazon voucher worth € 5.00. From 11,816 individuals who were contacted via email, a total of 1,680 people participated in the study. We refer to this measurement occasion as Time 1 (T1).
The present study was planned in 2019 and preregistered on September 10, 2019. Starting on September 25, 2019, we contacted individuals again (including those who had not participated at T1) to take an online test, similar to T1. A total of 1,089 individuals agreed. Of those, 804 had also participated at T1, whereas 285 were participating for the first time. We refer to this measurement occasion as Time 2 (T2).
In 2020, we decided to extend the study by adding two additional measurement occasions (Time 3, T3, and Time 4, T4). This allowed us to investigate developmental patterns across a prolonged period of time and to disentangle reciprocal effects between trait greed and the proposed covariates (as all variables except greed had otherwise only been measured at one time point). 6 Data for T3 were collected in June 2020 from a total of 481 individuals who had also participated at T1, T2, or both. Data for T4 was obtained in November 2021 from a total of 461 individuals who had participated at T1, T2, or both. Thus, the total sample consisted of 1,965 individuals.
Attrition and careless responding
We excluded participants with missing data (N = 153 at T1; N = 6 at T3; and N = 27 at T4). Additionally, we used a self-report measure of response quality at the end of the test battery (“Did you work conscientiously on the test?”) at T1, T2, and T4. Participants were informed that their responses would not affect their financial compensation. At T1, T2, and T4, 41 (3%), 27 (2%), and 4 (1%) participants, respectively, answered “No” and were, correspondingly, excluded from further analyses. Thus, the final sample consisted of 1,792 individuals (T1: 1485; T2: 1062; T3: 475; T4: 432).
According to the preregistration, we aimed to have a minimal sample size of N = 1,434 (for a latent change score model with df = 43, α = .05, (1 − β) = .80, ε0 = .05, and εa = .08, according to MacCallum et al., 1996); thus, we consider the sample size to be sufficiently large. Post hoc power for the latent bivariate change score model for an unstandardized target effect of .08 of the latent moderator on change in latent greed was estimated to ß = 1.00 according to the procedure implemented in the R-app pwrSEM (Wang & Rhemtulla, 2021).
The test of homoscedasticity for trait greed across the three measurement occasions according to Jamshidian and Jalal (2010) using the R-package MissMech was significant for the Hawkins test of normality and homoscedasticity (p < .001), but not for the nonparametric test of homoscedasticity (p = .54), indicating that there was no evidence that data were not missing completely at random. Similarly, the probabilities of missingness at T2, T3, and T4 were only marginally related to levels of greed at T1 (−.12, −.05, and −.06, respectively), the probability of missingness at T3 and T4 were unrelated to levels of greed at T2 (.01 and −.04), and the probability of missingness at T4 was unrelated to levels of greed at T3 (−.04). Regarding gender, there was a slight shift toward a larger proportion of female participants (67%, 69%, 68%, and 70% for T1, T2, T3, and T4, respectively). Given that the gender distribution was equal among all contacted individuals, the slight shift toward a higher percentage of female respondents could be attributed to self-selection to voluntarily participate in a research study. Additionally, at T2 (74%) and T4 (86%), a larger number of participants had a university entrance degree compared with T1 (57%; highest school degree was not available at T3). However, in addition to attrition, this might also be due to individuals obtaining their university entrance degree in 2019, 2020, or 2021 (i.e., between T1 and T4). Indeed, among those who participated at both T1 and T2 (i.e., no attrition), the percentage of participants with a university entrance degree rose from 59% to 77%, whereas those who had not yet obtained a school degree dropped from 12% to 5%. The same was true when comparing the variable highest degree for participants who did not drop out from T1 to T4: here, the percentage of individuals with a university entrance degree rose from 63% to 87% and those who had not yet obtained a school degree dropped from 12% to 0%. From those who dropped out of the study after T1, 53% had a university entrance degree.
Demographic variables
At T1, the average age of participants was 19.1 (SD = 2.4), and 67% were female. In terms of level of education, 57% held a university entrance qualification, 32% held another form of secondary school completion certificate, and 12% had not yet finished school.
The university ethics committee approved the study protocol. Written informed consent was obtained for all participants. They were informed about possible consequences, and their rights were protected.
Measures
The GR€€D scale (Mussel & Hewig, 2016) is a 12-item self-report measure. Items were scored on a 7-point rating scale, ranging from “does not apply at all” to “fully applies.” The GR€€D scales’ score has been found to have a one-dimensional structure, high internal consistency, high convergent validity with other greed measures and the greed-avoidance score of the HEXACO (Lee & Ashton, 2004), and high criterion-related validity with respect to theoretically linked criteria (Mussel et al., 2018). In the present study, the scale had a reliability coefficient ω of .88 to .89 across the four measurement occasions, and retest correlations ranged between r tt = .68 and .77. In line with major definitions of greed (Webster, 2013), other greed measures (Seuntjens, Zeelenberg, Van de Ven et al., 2015; Veselka et al., 2014), and lay conceptions of greed (Seuntjens, Zeelenberg, Breugelmans et al., 2015), the scale does include but is not limited to the striving for money and material goods in addition to the generic striving for more, thus offering a good correspondence with the conceptualization of greed in the present study. We obtained data on the GR€€D scale at all four measurement occasions. For latent change score models, items were assigned to one of three parcels in accordance with the Item-to-Construct Balance method by Little et al. (2002). Whereas the use of parcels instead of items as indicators in the latent variable models might have covered up noninvariance across time for specific items, it allowed us to obtain error-corrected change information on the latent variable level.
Core beliefs were assessed via the Negative Core Belief Scale, as described in Study 1. The measure has 22 items which assesses the following six dimensions: (a) being unloved (e.g., “I am unloved”; ω = .76/.82/.79 for T2/T3/T4, r tt = .68 to .74); (b) being unworthy (e.g., “I am worthless”; ω = .87/.88/.89, r tt = .70 to .77); (c) unpredictability (e.g., “Whether I achieve my goals depends on my luck”; ω = .72/.79/.78, r tt = .50 to .58); (d) alienation (“Something is wrong with me”; ω = .76/.80/.80, r tt = .66 to .72); (e) conditional self-worth (e.g., “I am more valuable if I achieve more”; ω = .61/.69/.65, r tt = .58 to .60); and (f) insecure attachment (“If you love someone, you will get hurt”; ω = .76/.81/.79, r tt = .59 to .66). All scales consist of three items except for unpredictability, which, according to construct breadth, was assessed with seven items, which were subsequently aggregated into three parcels. Data for core beliefs were collected at T2, T3, and T4. Items were scored on a 7-point rating scale, ranging from “does not apply at all” to “fully applies.”
Self-reported current occupational or further educational activities were assessed with a multiple-choice question. The item was based on the RIASEC model (Holland, 1997), which, on the one hand, describes interindividual differences in occupational preferences and, on the other, classifies occupations and educational programs according to their characteristics. Here, we used the model to classify job characteristics. RIASEC is the acronym for six domains that the model postulates: realistic, investigative, artistic, social, enterprising, and conventional. For the assessment of current occupational or further educational activities, the name of the domain was given, followed by typical examples of occupations and educational programs (e.g., insurance agent, manager, or self-employed for the enterprising domain; early childhood educator, teacher, or geriatric nurse for the social domain). Participants indicated which of the six domains best described their current occupation or educational program. The self-reported current occupational or further educational activities were collected at T2, T3, and T4. At T2, 106 individuals (10%), at T3, 70 individuals (15%), and at T4, 45 individuals (11%) indicated that their current activities fell within the enterprising domain and were subsequently coded as business-related activities (e.g., enterprising, economic, and financial-analytical). All other responses (N = 956 at T2, 405 at T3, and 374 at T4) were coded as “other.” For those with full data at both T2 and T3 (N = 402), 10% (N = 41) underwent status changes from business-related to other activities or vice versa. From T3 to T4, 13% (N = 48) underwent a status change.
Item content for all measures can be found at https://osf.io/bv2h9/.
Statistical analyses, including measurement invariance analyses
All data analyses were conducted in R-Studio 2021.09.1 on R 4.1.2 using the packages psych (Revelle, 2018), lavaan (Rosseel, 2012), and ggplot2 (Wickham, 2016). The main analyses were conducted using a bivariate latent change score model (Horn & McArdle, 1992; Mund & Nestler, 2019; Newsom, 2017), as depicted in Figure 1, with robust maximum likelihood estimator MLR (Li, 2016) using the full information maximum likelihood (FIML) estimation for missing data (Enders & Bandalos, 2001) and reporting robust/scaled model fit indices. Latent change score models have been described as superior to cross-lagged panel models as they make less strict assumptions and allow between-person differences in change to be considered (Berry & Willoughby, 2017). Compared with autoregressive latent trajectory models with structured residuals, latent change score models can be applied to longitudinal data with less than four points of measurement (Mund & Nestler, 2019). Schematic of the latent bivariate change score model. Note. The lower part of the figure constitutes the measurement model for greed (G), the upper part the one for the covariate (C). Straight arrows depict loadings and regression coefficients, whereas curved arrows depict covariances. g13 refers to the third indicator of greed (parceled items from the GR€€D scale) assessed at T1. The latent covariate is indicated by three manifest variables (in the case of core beliefs) or a single manifest variable (in the case of business-related activities). Δ captures change from T1 to T2 or T2 to T3. Latent regressions of ΔG2→3 on Cov T2 reflect the influence of the covariate on the development of greed. Latent regression of ΔC2→3 on Greed T2 reflects the change in the covariate produced by greed. The dotted lines were included for the extended latent bivariate change score model, representing correlated change.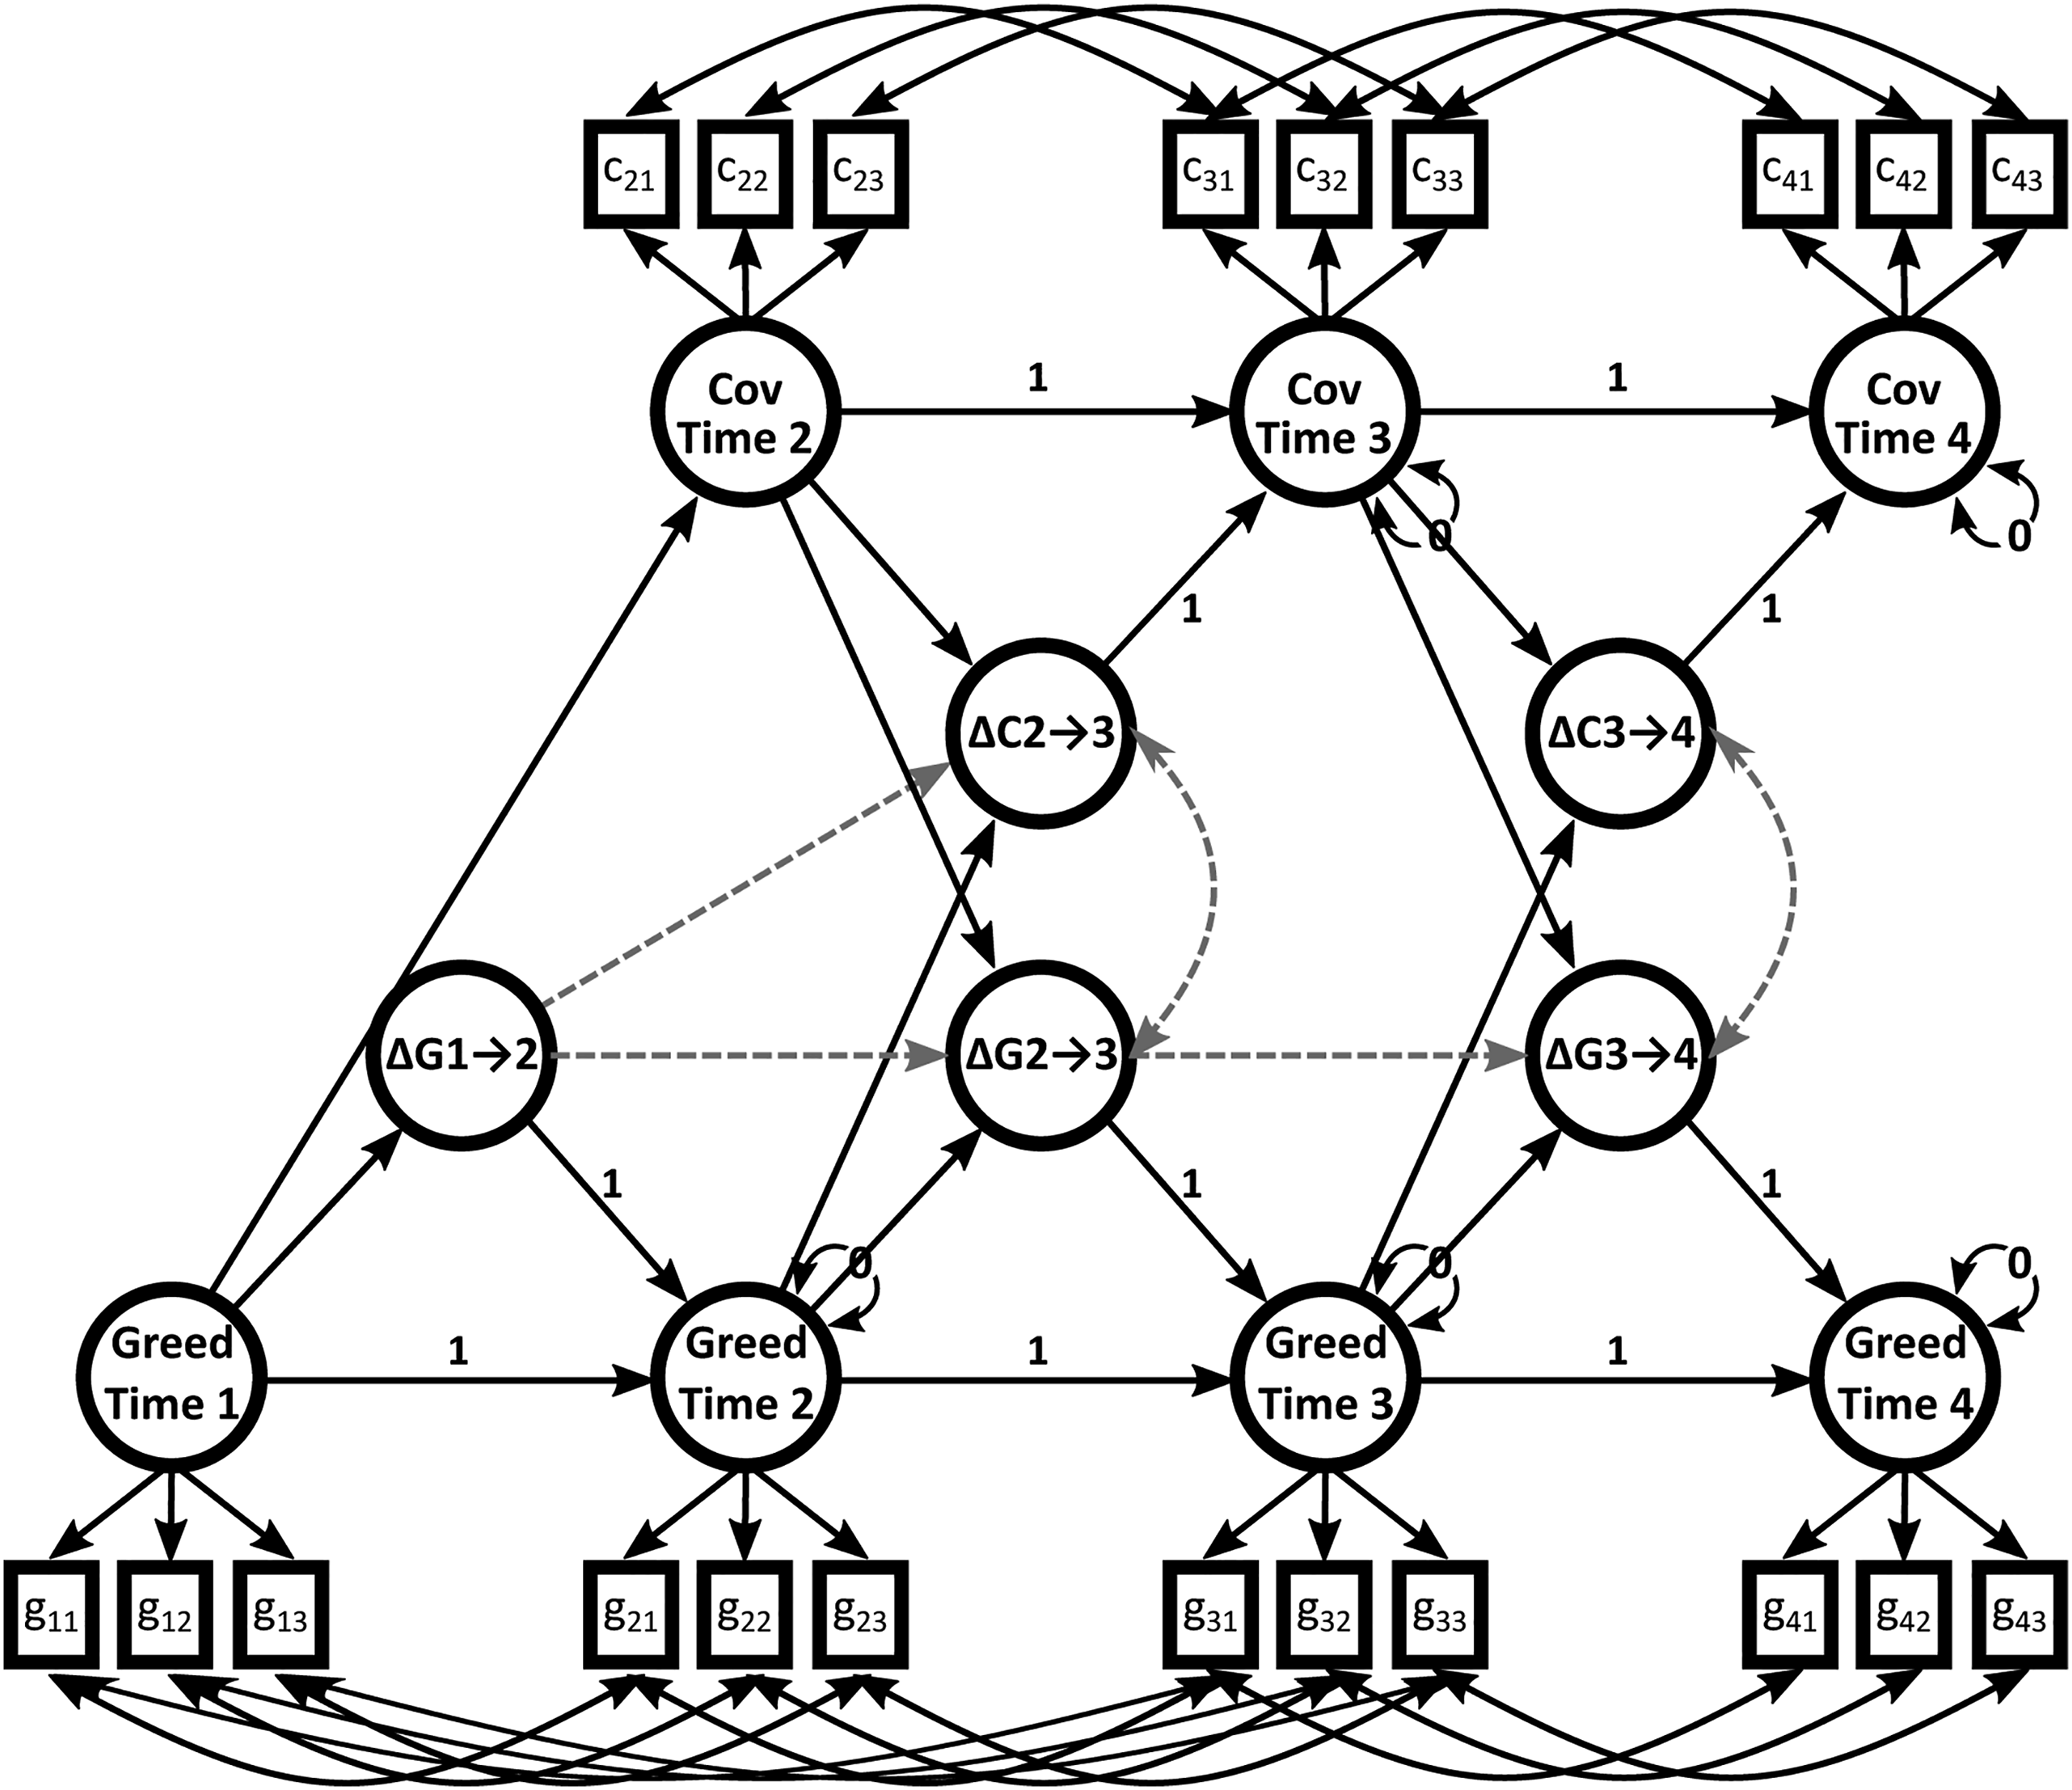
We performed measurement invariance testing for the GR€€D scale with a total of three successive models (Coertjens et al., 2012). First, the configural model was specified by modeling three latent correlated variables for greed at T1, T2, T3, and T4, respectively. The three parcels, computed from the items on the GR€€D scale, served as indicators for each latent variable. The variance of the latent variables was fixed to 1 to achieve identifiability. Additionally, we allowed correlated error variances for the same items across measurement occasions to model method variance (e.g., a correlation between the error of Item 1 at T1 and the error of Item 1 at T2).
Second, the model for weak measurement invariance was specified by additionally fixing the loadings to be equal across measurement occasions. Third, the model for strong measurement invariance was specified by additionally fixing the intercepts to be equal across measurement occasions. To ensure identifiability, the mean of latent greed at T1 was fixed to zero.
The latent change score model was specified by additionally including the latent change variable delta. To account for change in greed from T1 to T2, the regression weight for regressing latent greed at T2 on latent greed at T1 was fixed to one. A latent variable for change (ΔG1→2) was included, and the loading of latent ΔG1→2 on latent greed at T2 was fixed to one. Additionally, the mean and residual variance for latent greed at T2 were fixed to zero. The regression weight of latent greed at T1 on ΔG1→2 was freely estimated. Change in greed from T2 to T3 (ΔG2→3) and from T3 to T4 (ΔG3→4) were modeled analogously.
For each of the six core beliefs, we used the three items or parcels as indicators of the latent covariate. Measurement equivalence was tested analogously to the test for the measurement equivalence of greed, as described above. After establishing measurement equivalence, a latent change variable delta was specified to account for change in the covariate from T2 to T3 (ΔC2→3) and from T3 to T4 (ΔC3→4), following the procedure described above.
For business-related activities, a single-indicator latent variable was included at T2, T3, and T4, respectively. Compared with the inclusion of a manifest covariate, the single-indicator latent variable accounted for an estimate of unreliability and thus provided relations with other latent-level variables that were comparable to those from the models for core beliefs. Therefore, one single-indicator variable was used per measurement occasion. This indicator variable coded business-related activities as one and other activities as zero and was standardized at T2 prior to its inclusion in the model. Its error variance was set to .10 (which corresponds to an estimated reliability of .90; Petrescu, 2013). A latent variable was included for each measurement occasion, and the loading of the indicator variable on the latent covariate was fixed to one. The latent change score variables ΔC2→3 and ΔC3→4 were included analogously as described above.
For the final bivariate change score model, the change score model for greed and the change score model for each covariate (one at the time) were combined. The latent covariate at T2 was regressed on latent greed at T1, indicating a baseline relation between greed and the covariate. Next, a latent regression of ΔG2→3 on the latent covariate at T2 and of ΔG3→4 on the latent covariate at T3 was included, indicating the socialization effect of the covariate regarding change in greed. The regression parameter was fixed to equality across measurement time. Alternatively, a latent regression of ΔC2→3 on latent greed at T2 and of ΔC3→4 on latent greed at T3 was included, indicating the influence of trait greed on change in the covariate. Again, regression parameter was fixed to equality across measurement time. In the case of business-related activities, this can be interpreted as a selection effect (i.e., a change in the environment according to levels of trait greed). Finally, a full bivariate change score model with both latent regressions was tested. The latent regressions and corresponding change in model fit were interpreted as tests of our hypotheses.
In addition to these hypothesis-testing models, we ran alternative models to exploratorily test for correlated change and average change across all measurement occasions. First, we tested an extended bivariate change score model (Grimm et al., 2012) by additionally regressing ΔC2→3 on ΔG1→2 and ΔC3→4 on ΔG2→3 and allowing a covariance between ΔC2→3 and ΔG2→3 and ΔC3→4 and ΔG3→4, thereby testing for correlated change (i.e., associations between the two processes; see the dashed gray scale paths in Figure 1). Second, we tested a bivariate dual change score model. Compared with the bivariate change score model, we included a general change score for greed. Therefore, we fixed the mean and variance of ΔG1→2, ΔG2→3, and ΔG3→4 to zero and regressed these three variables on the general change score. Therefore, the latter reflected average change across all three measurement occasions.
Results
Means, standard deviations, bivariate correlations, and reliabilities for all study variables in Study 2.
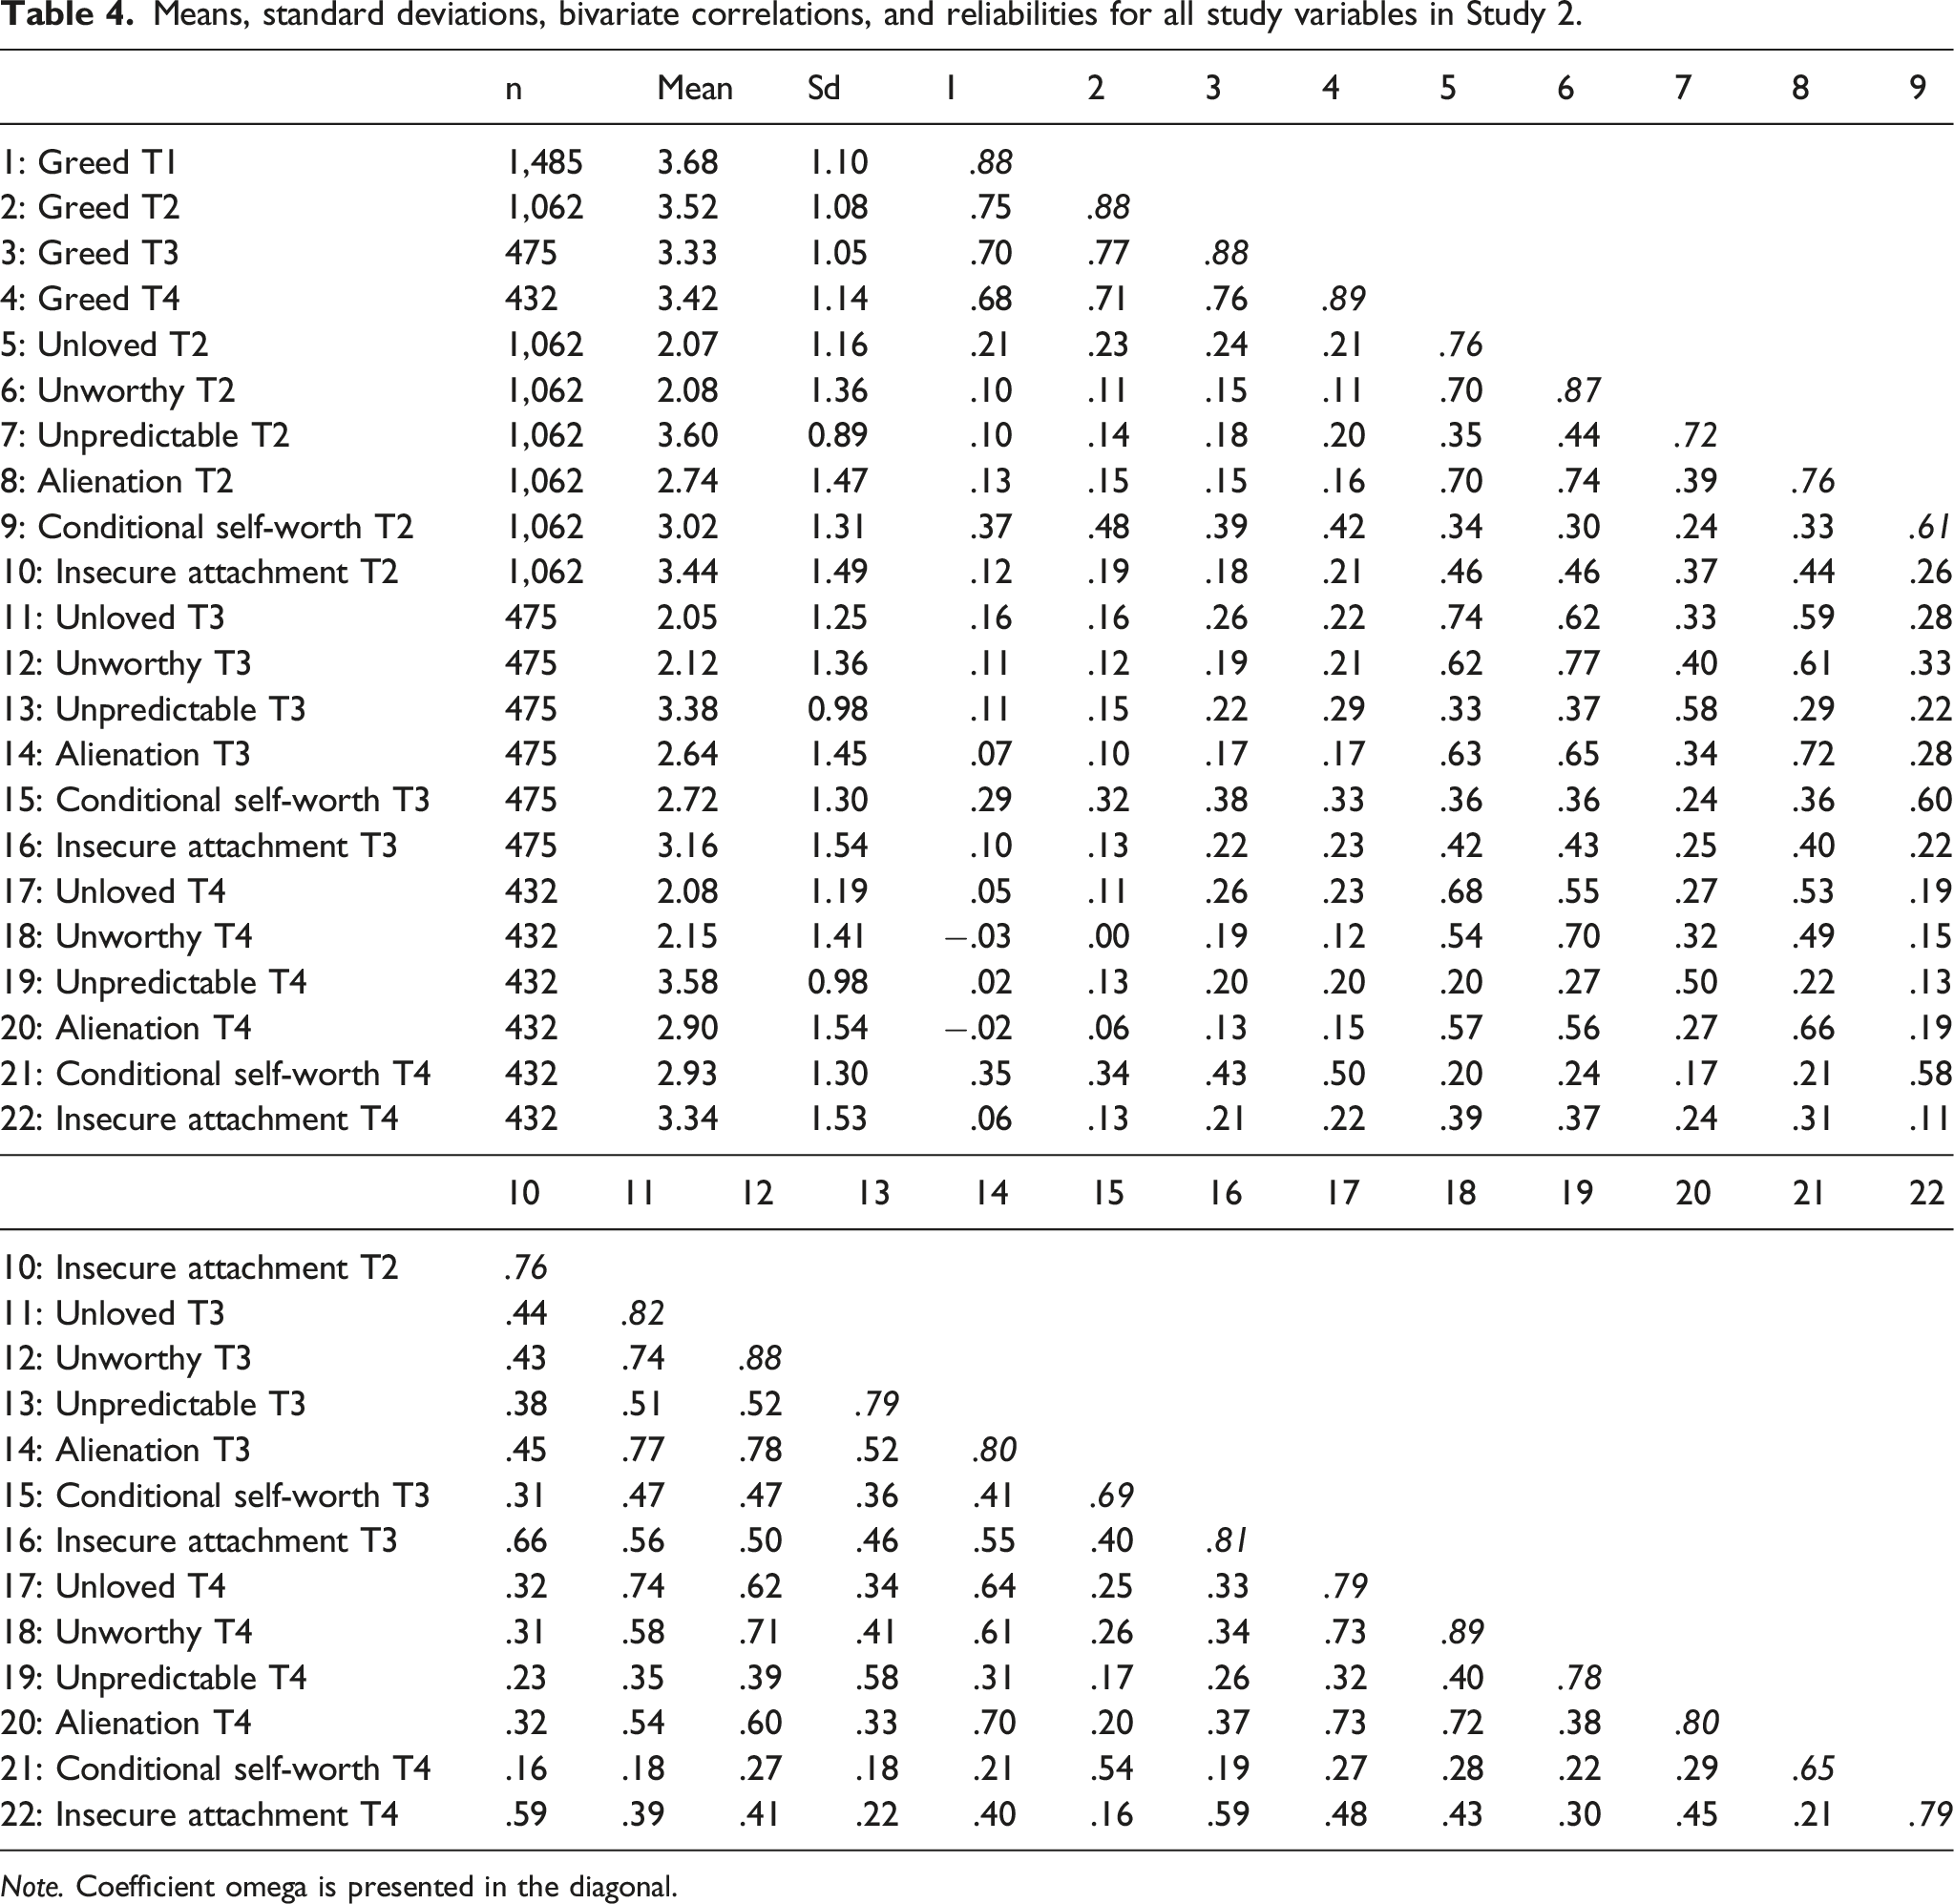
Note. Coefficient omega is presented in the diagonal.
Measurement equivalence
The configural model for trait greed showed a good fit (χ2 = 66, df = 45, CFI = .997, RMSEA = .02, GFI = .98, AGFI = .95, SRMR = .02). The model reflecting strong measurement invariance revealed a similar fit (χ2 = 130, df = 60, CFI = .990, RMSEA = .03, GFI = .96, AGFI = .95, SRMR = .04). Additionally, the changes in the fit parameters were within acceptable boundaries (ΔCFI ≤ .01; Cheung & Rensvold, 2002). Therefore, strong measurement invariance across measurement occasion could be assumed. Strong measurement equivalence could also be assumed for four of the six core beliefs. For the other two (being unworthy, conditional self-worth), partial strong measurement equivalence was achieved. Therefore, the mean of one of the three indicators was freed for one of the measurement occasions. Subsequently, the model fit was good (χ2 = 30 to 43, df = 24, CFI = .985 to .998, RMSEA = .02 to .03, GFI = .97 to .98, AGFI = .94 to .96, SRMR = .04 to .05) and only marginally worse (ΔCFI < .01) than weak measurement equivalence.
Model fit indices for testing measurement equivalence.
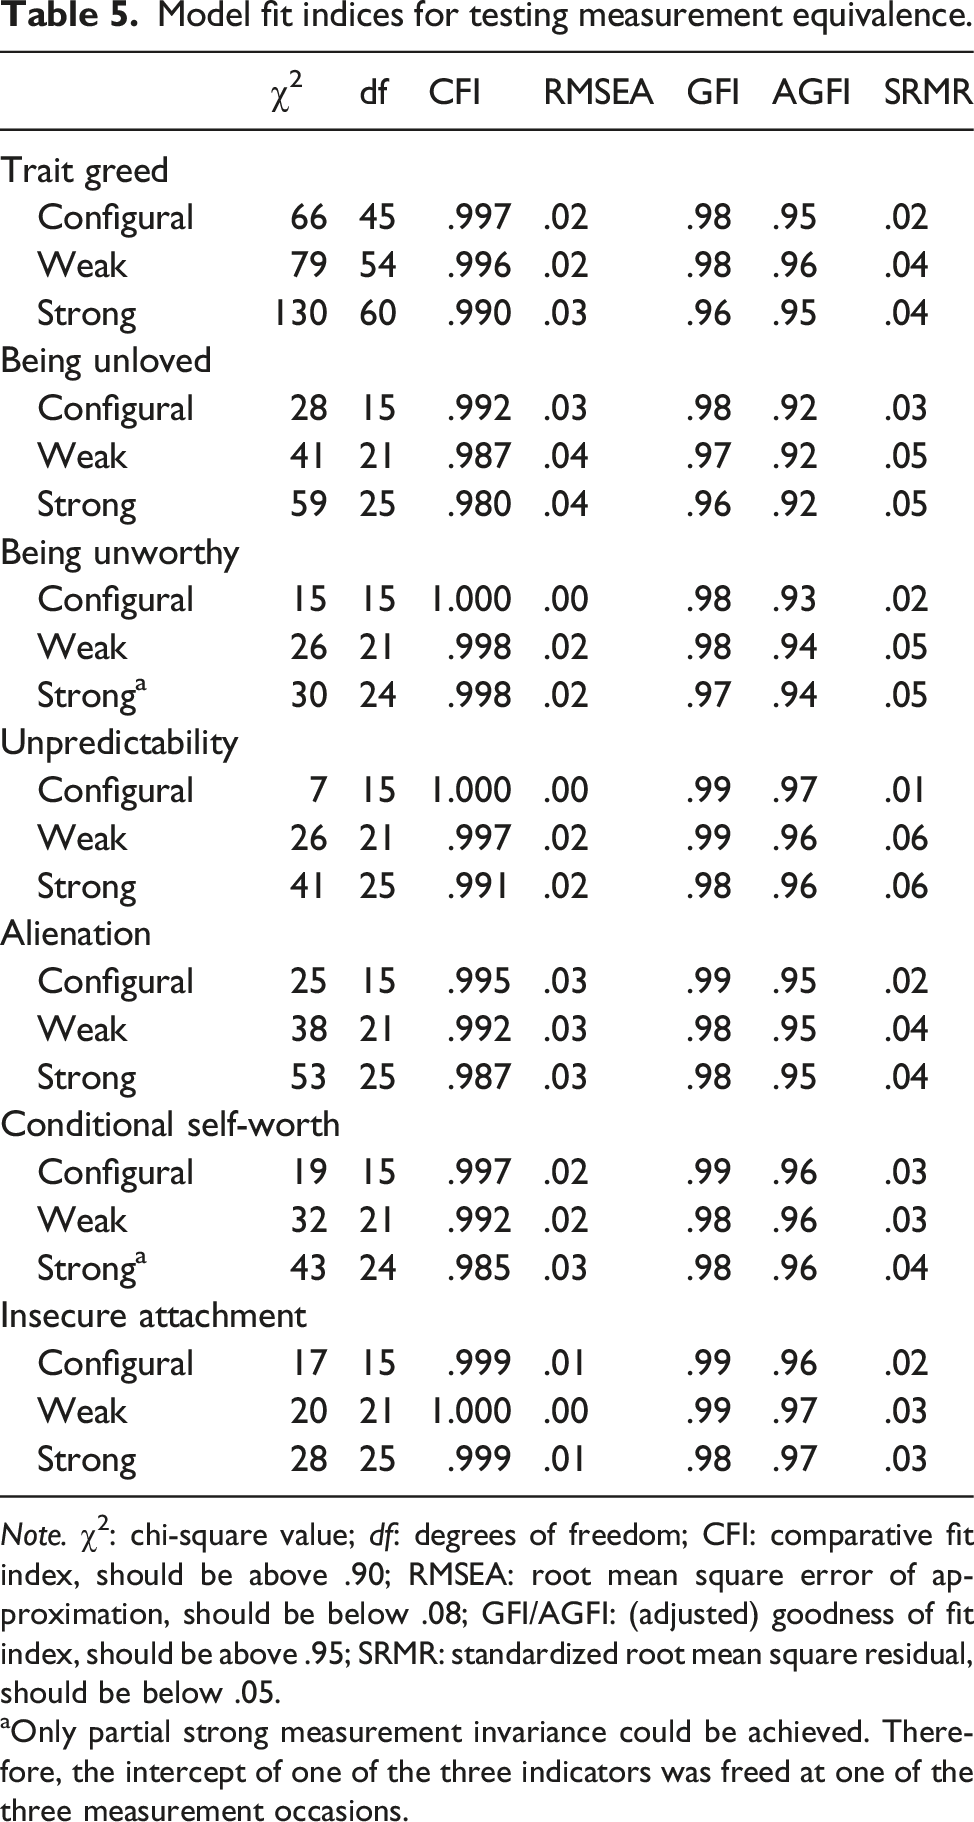
Note. χ2: chi-square value; df: degrees of freedom; CFI: comparative fit index, should be above .90; RMSEA: root mean square error of approximation, should be below .08; GFI/AGFI: (adjusted) goodness of fit index, should be above .95; SRMR: standardized root mean square residual, should be below .05.
aOnly partial strong measurement invariance could be achieved. Therefore, the intercept of one of the three indicators was freed at one of the three measurement occasions.
Hypothesis testing
The bivariate change score model for business-related activities revealed a close fit (χ2 = 238, df = 99, CFI = .981, RMSEA = .03, GFI = .95, AGFI = .93, SRMR = .07). On average, trait greed decreased from T1 to T2 (standardized intercept of ΔG1→2: −.19, p < .001) and from T2 to T3 (−.45, p < .001); from T3 to T4, the decrease tendentially reversed (.11, p = .10). Latent greed at T1 predicted latent business-related activities at T2 (standardized estimate of .23, p ≤ .001). Thus, individuals with higher levels of trait greed were more likely to pursue business-related activities. To illustrate, Figure 2a shows a histogram of the greed scores at T1 separately for individuals with business-related versus other activities at T2. Selection effects for economic versus other activities. Note. (a): Histogram greed scores according to the 7-point GR€€D scale at T1, separately for individuals with business-related versus other activities at T2. (b): Probability of engaging in business-related versus other activities at T3/T4 according to trait greed at T2/T3 (raw values on the 7-point scale).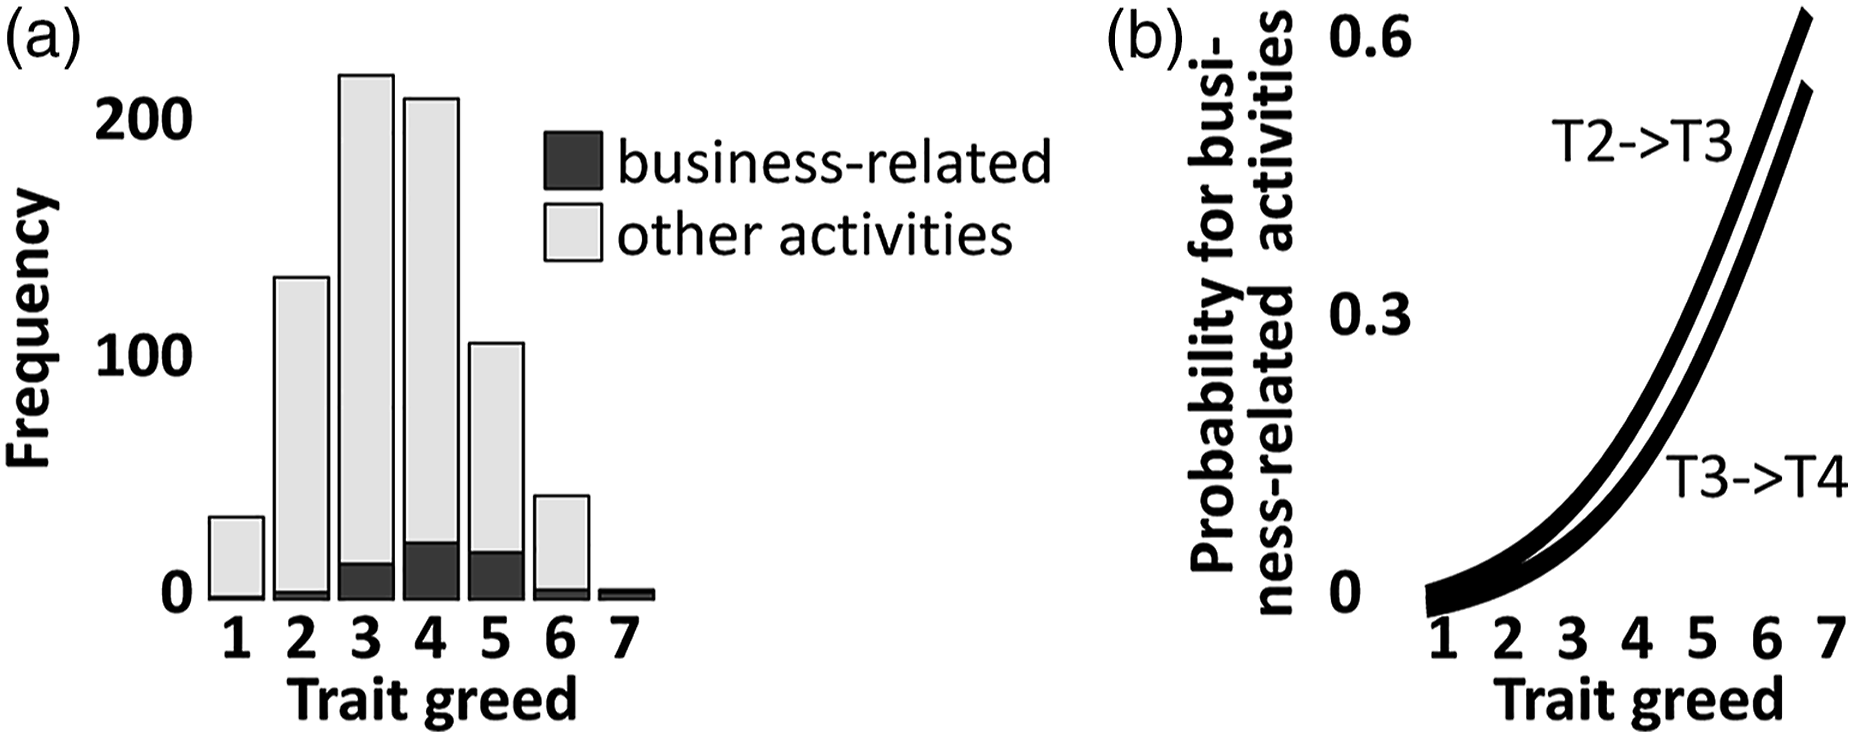
Model fit parameters and estimates for the latent standardized regressions and latent correlations for the latent bivariate change score model (see Figure 1).
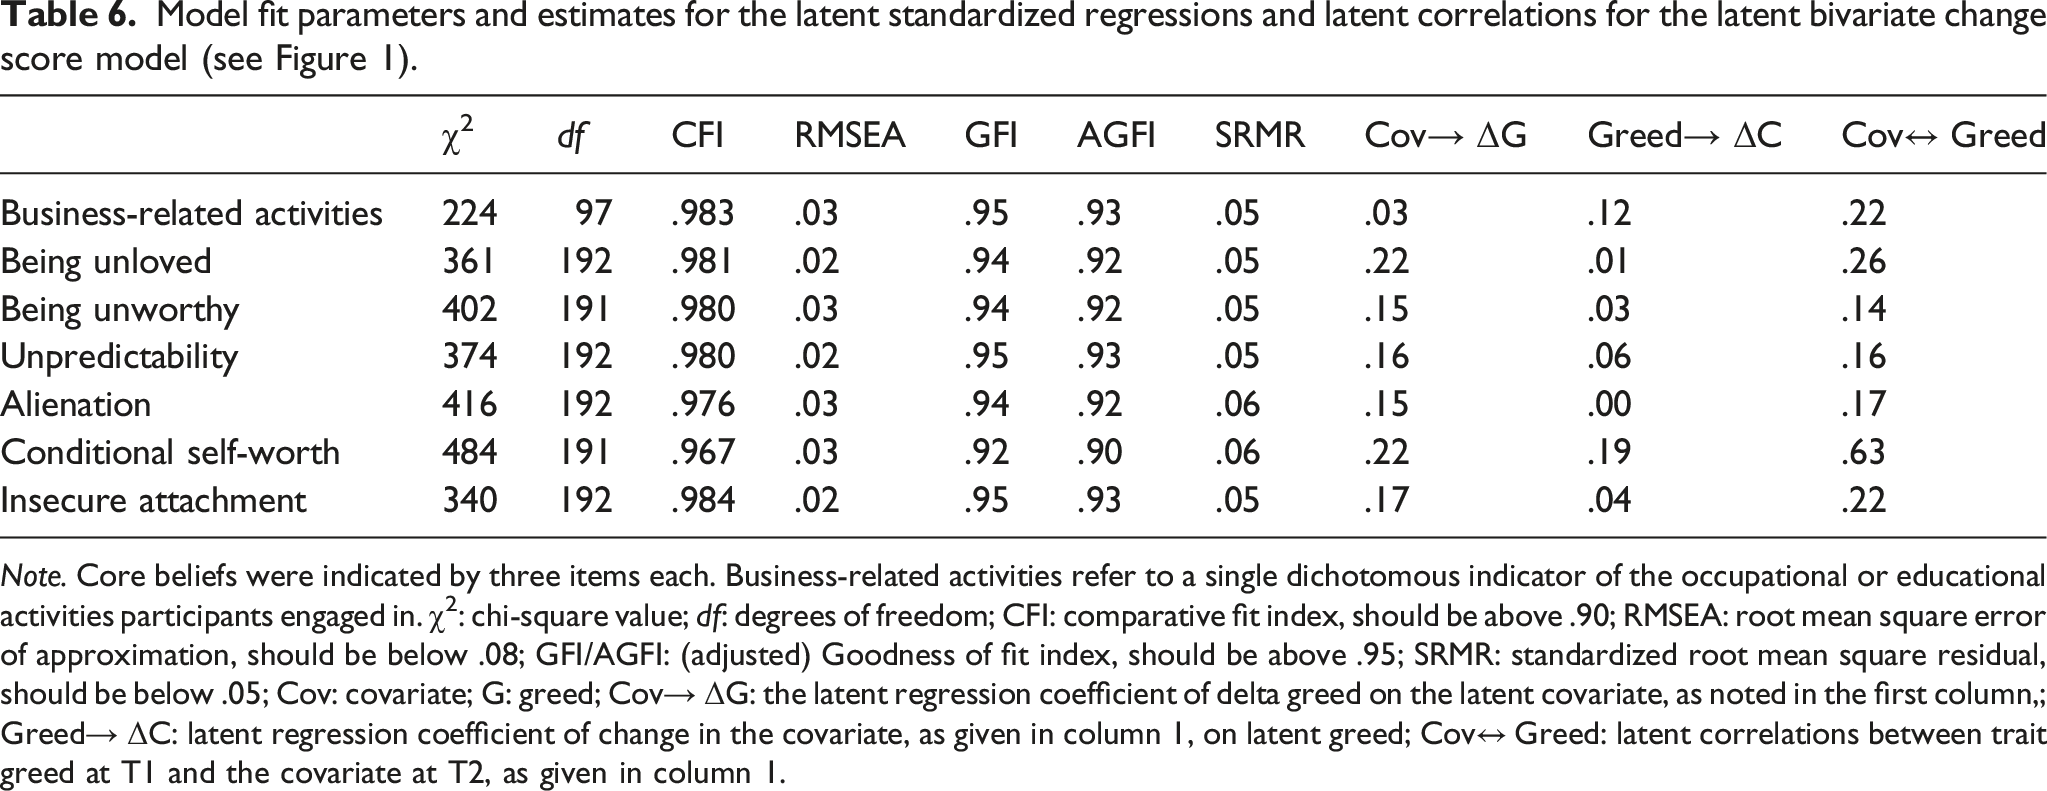
Note. Core beliefs were indicated by three items each. Business-related activities refer to a single dichotomous indicator of the occupational or educational activities participants engaged in. χ2: chi-square value; df: degrees of freedom; CFI: comparative fit index, should be above .90; RMSEA: root mean square error of approximation, should be below .08; GFI/AGFI: (adjusted) Goodness of fit index, should be above .95; SRMR: standardized root mean square residual, should be below .05; Cov: covariate; G: greed; Cov→ ΔG: the latent regression coefficient of delta greed on the latent covariate, as noted in the first column,; Greed→ ΔC: latent regression coefficient of change in the covariate, as given in column 1, on latent greed; Cov↔ Greed: latent correlations between trait greed at T1 and the covariate at T2, as given in column 1.
To illustrate the selection effect, we used a logistic regression analysis to predict business-related activities at T3 from trait greed at T2 (AIC = 315; D-squared = .071). We found a significant regression effect (β = 0.64, p < .001). The same effect was found when predicting business-related activities at T4 from trait greed at T3 (AIC = 141; D-squared = .065, β = 0.67, p < .001). Predicted probabilities are depicted in Figure 2b. The odds ratio of pursuing business-related activities at T3 was almost three times higher for individuals scoring one standard deviation above compared with one standard deviation below the mean of trait greed at T2 (0.06 vs. 0.17). Odds ratio at T4, according to trait greed at T3, were similar (.04 vs. .12).
The bivariate change score models for the six beliefs revealed good fit (χ2 = 355 to 311, df = 193 to 194, CFI = .964 to .983, RMSEA = .02 to .03, GFI = .92 to .95, AGFI = .90 to .93, SRMR = .07 to .08). Latent greed at T1 predicted the latent belief at T2 for all six beliefs (standardized regression weights of .15 to .64, all ps ≤ .001), indicating that higher levels of trait greed were associated with higher levels of negative core beliefs.
Including a regression of latent change in greed (ΔG2→3) on the latent belief at T2 improved the model fit for all six beliefs (Δχ2 = 12 to 24, df = 1, p < .001). Correspondingly, the latent regression was significant (standardized λ = .15 to .26, p < .001). Thus, higher levels on each of these negative beliefs at T2 (T3) predicted a diminished decrease or increase in trait greed from T2 to T3 (T3 to T4). Figure 3 illustrates these trajectories: Trait greed slightly decreased from T2 to T4 for individuals with average values on negative core beliefs; values below the average on negative core beliefs resulted in a greater decrease, whereas values above the average lessened or even reversed the decrease. Heatmaps of trait greed as a function of the standardized value of the covariate and time. Note. Each panel shows the effect of a different covariate; trait greed is plotted in the range of ±0.7 SD around the mean, corresponding to a medium-to-large-sized effect of d = 0.7. Data are smoothed from Time T2 (0 month) to Time T4 (26 month).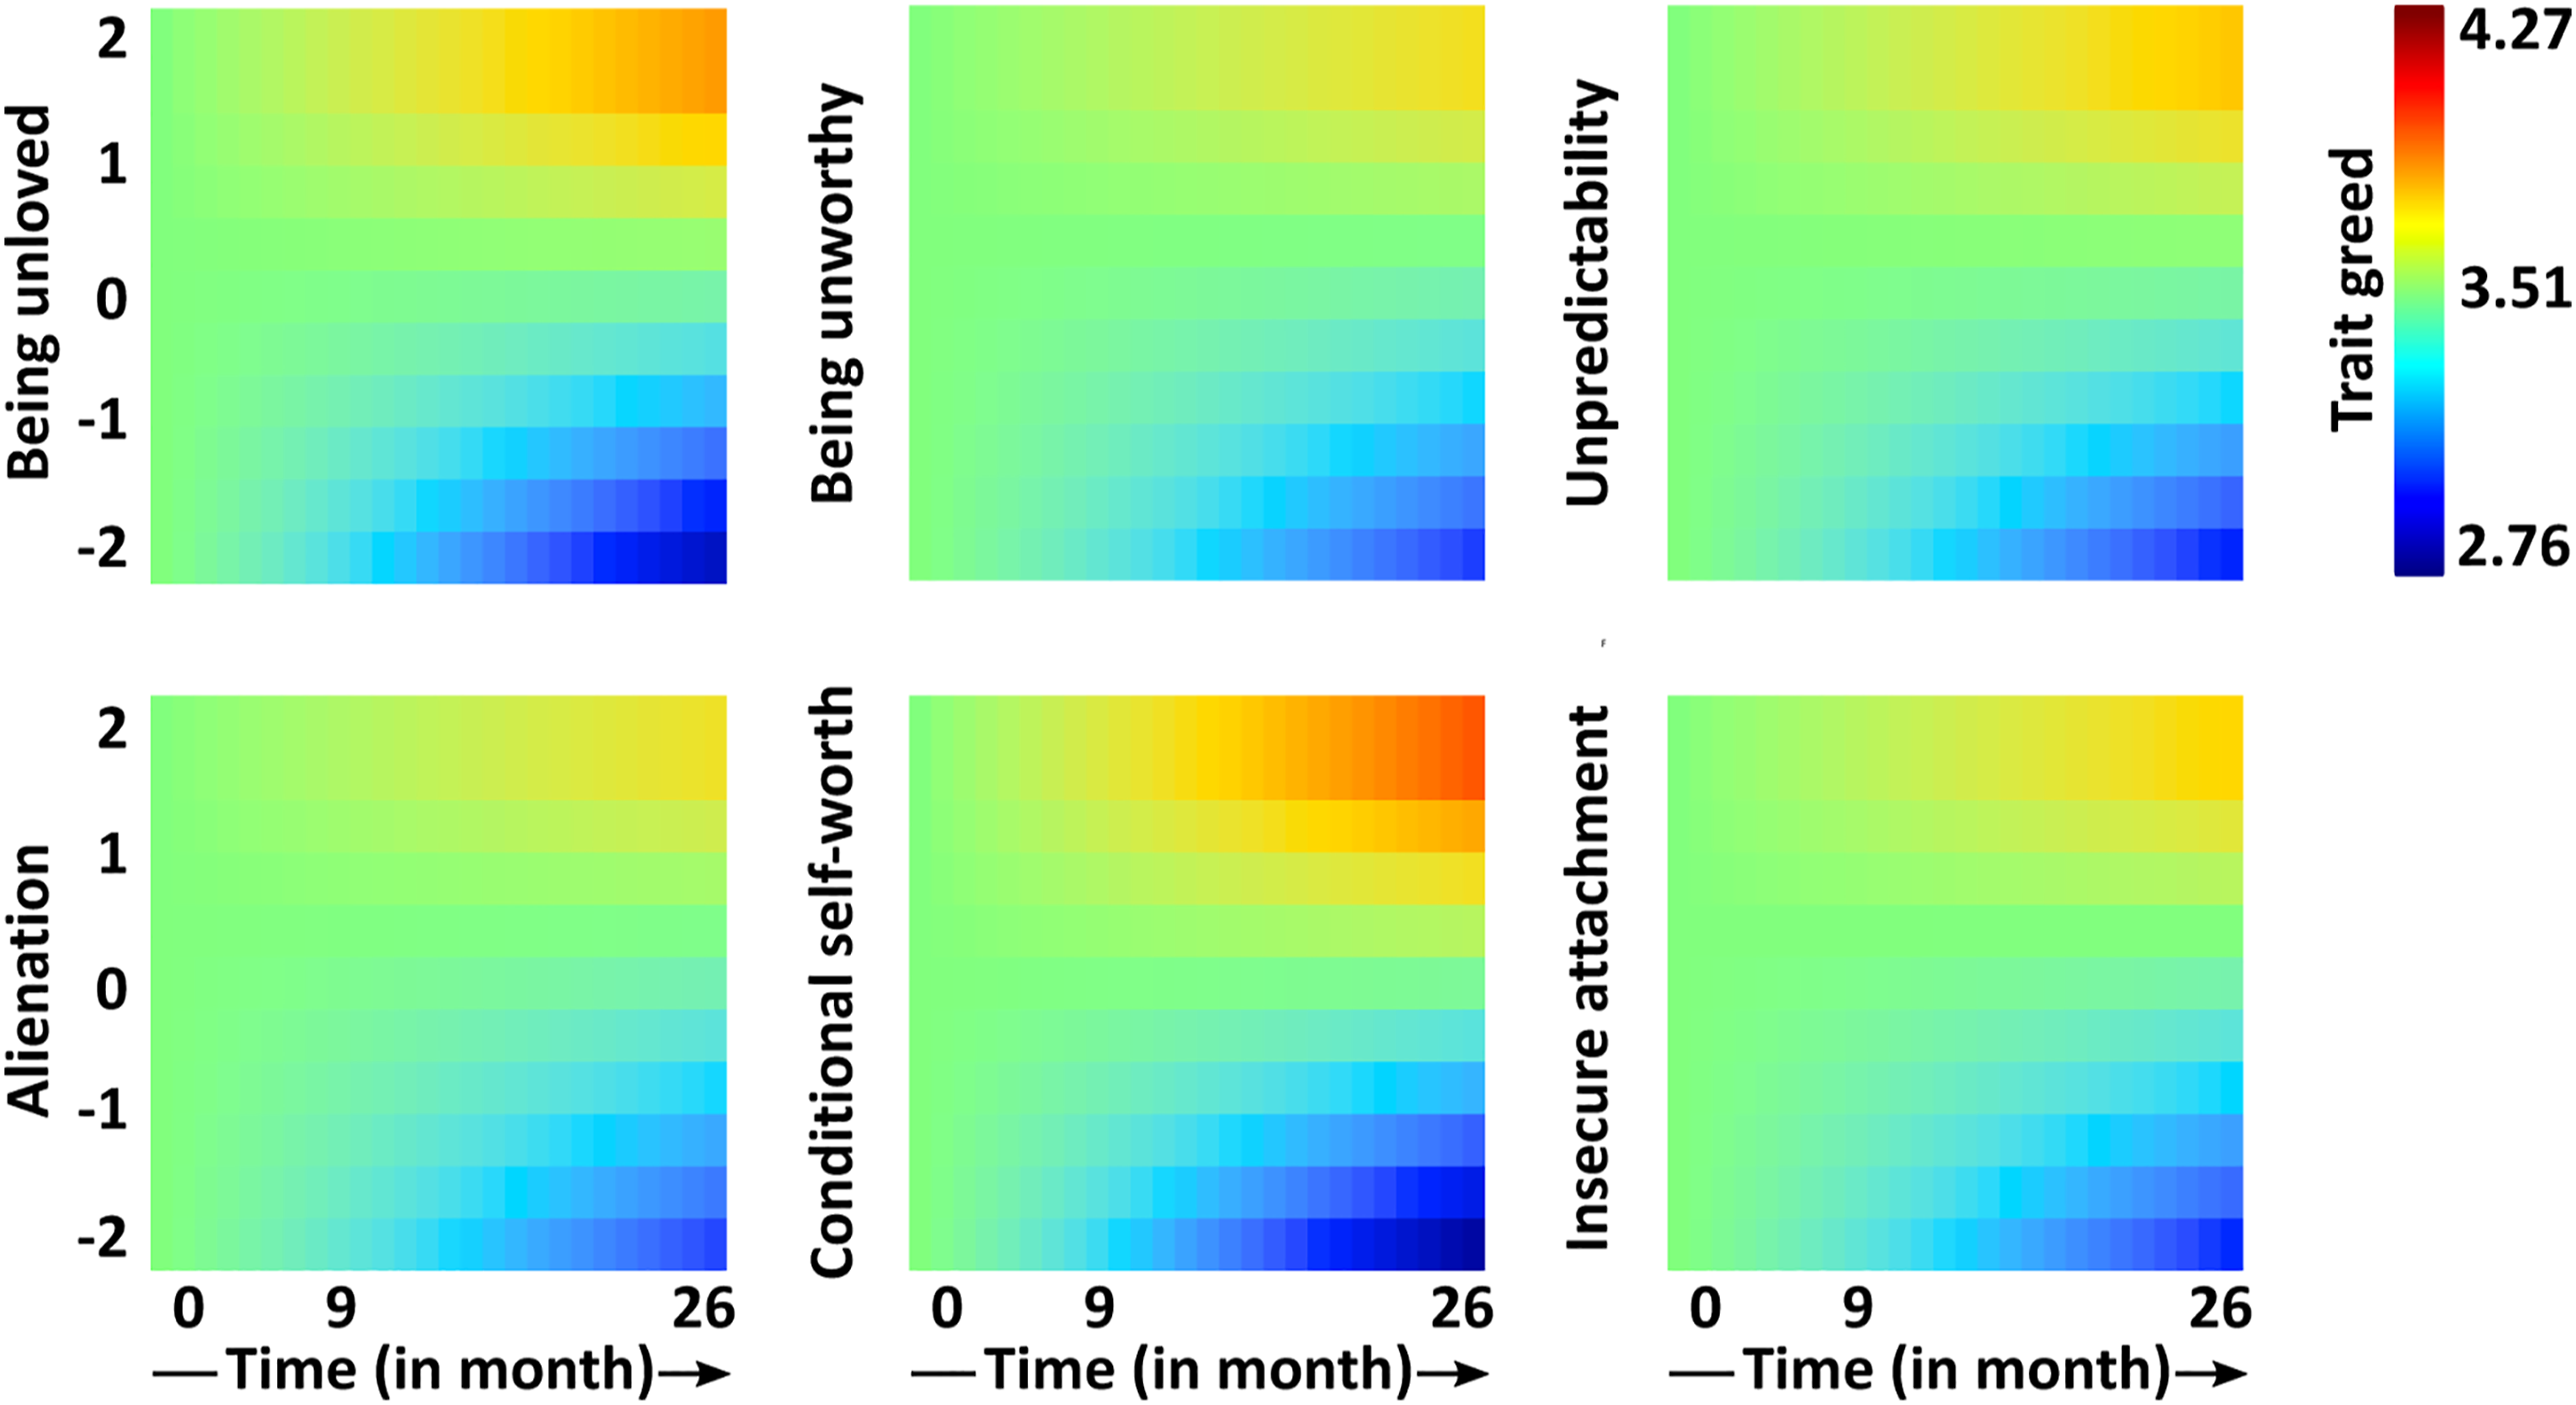
When including a regression of change in the covariate ΔC2→3 on trait greed at T2 and of ΔC3→4 on trait greed at T3 instead, the model fit did not improve for five out of six core beliefs (Δχ2 = 0 to 2.8, df = 1, p = .09 to .83). The only exception are beliefs regarding conditional self-worth (Δχ2 = 14.9, df = 1, p < .001). Here, the latent regression was significant (standardized λ = .25, p < .001), indicating that higher compared to lower levels on trait greed predicted subsequent increases in conditional self-worth. Results for the full bivariate change score model mirrored those reported above, with significant effects of all latent beliefs on change in greed but only a significant effect of greed on change in conditional self-worth (see Table 6).
Additional exploratory analyses
We exploratorily ran two additional models. First, we implemented an extended bivariate change score model to test for correlated change. Therefore, compared with the model above, we additionally included latent regressions and covariances between the change score variables, as depicted with dashed gray lines in Figure 1. For business-related activities (χ2 = 185, df = 93, CFI = .987, RMSEA = .03, GFI = .95, AGFI = .93, SRMR = .04), we found no significant relation between change in greed and change in the covariate. For core beliefs (χ2 = 288 to 399, df = 187 to 188, CFI = .976 to 990, RMSEA = .02 to .03, GFI = .93 to .95, AGFI = .91 to .93, SRMR = .04 to .05), we found no evidence that changes in greed predicted subsequent changes in core beliefs or vice versa. However, in five out of six core beliefs (except being unworthy), we found correlated change (standardized λ = .18 to .48, p < .05). For conditional self-worth, the formerly significant regression of latent change in greed (ΔG2→3/ΔG3→4) on the latent belief at T2/T3 vanished after we included correlated change.
Second, we implemented a bivariate dual latent change score model. Therefore, compared with the bivariate latent change score model, as outlined above, we included a general latent change score variable to account for linear change in trait greed across all four measurement occasions. The model showed poor fit to the data (χ2 = 669, df = 66, CFI = .915, RMSEA = .07, GFI = .83, AGFI = .77, SRMR = .09), and thus, results should be interpreted with caution. On average, trait greed decreased from T1 to T4 (standardized intercept −.171, p < .001). When adding core beliefs as covariate, we found levels of core beliefs at T2 to significantly predict change in greed across T1 to T4 (standardized λ = .07 to .20, p < .01). Although the covariates were not assessed prior to T2 in our study, scores obtained at T2 might, due to stability in the covariates, also reflect levels prior to T2. All other results were identical to the bivariate latent change score model, except that we now found a significant effect of trait greed on changes in core beliefs relating to unpredictability (standardized λ = .09, p = .04).
General discussion
Personality psychology is currently experiencing a shift from a mere description of behavioral patterns to a deeper understanding of underlying mechanisms, processes, and development (Baumert et al., 2017; Wagner et al., 2020). In response, models of personality development have emphasized the role of the environment in terms of selection and socialization effects and their interaction. Our study provides evidence for the utility of these models and, crucially, extends these models by including person variables: core beliefs, defined as mental representations of experiences that individuals have while pursuing need-fulfilling goals. In this way, change is modeled as being driven by aspects both within and outside the individual.
We provide the first longitudinal study of the development of trait greed. In a large sample of young adults, we found that trait greed decreased over a period of more than 3 years. Attributes of the environment in terms of business-related (e.g., from the enterprising, economic, or financial-analytical domains) as compared with other occupational or educational activities changed according to levels of trait greed, indicating a selection effect. Extending prior efforts to shed light on personality development, we included negative core beliefs as predictors in addition to environment variables. These person attributes accounted for trait-level changes in greed across time.
The concept of core beliefs has been proposed in various domains, especially social-cognitive psychology (Bandura, 1993; Gist & Mitchell, 1992; Judge et al., 2002) and clinical psychology (Beck, 1963; Bowlby, 1969; Young et al., 2003). As a novelty of the present study, we conceptually and empirically transferred this concept to the domain of personality development. Our results suggest that individuals who hold negative core beliefs show smaller decreases in trait greed. We predicted the influence of negative core beliefs according to the reasoning that greedy behavior serves as a substitute for things that have been missing elsewhere in a person’s life. A potential mechanism behind this relation might be that money provides autonomy and security (Vohs et al., 2006). Whereas greed is not limited to but is primarily focused on the acquisition of money, the excessive striving for more that characterizes individuals with high levels of trait greed might be driven by an attempt to deal with feelings of insecurity or fear.
This reasoning might explain an additional feature of trait greed—insatiability—which describes an inability to be satisfied, a striving without an end (Lambie & Haugen, 2019). Let us assume that greedy individuals do not strive for a desired object because they want to have it but rather do so to deal with negative experiences that are reflected in negative core beliefs. Then, the receipt of the desired object will not be reinforcing because the negative core beliefs, the source of their striving, will still be there, which might result in an ongoing striving for even more. From this perspective, trait greed becomes insatiable because the things that are really missing are never actually obtained.
Core beliefs may result from any experience individuals have at any age. Representations from these experiences are stored as internal models of how the world works and how others behave and react and thus influence future behavior in terms of what individuals do to achieve their goals and fulfill their needs (Dweck, 2017). Such patterns of experiences and behavior, when repeatedly shown over time, constitute the personality of an individual. According to this reasoning, core beliefs impact the development of personality traits. On the other hand, core beliefs are themselves malleable because of new experiences that individuals have, which makes them a potential starting point for intended personality change, interventions, or therapy.
Our extended bivariate change score models showed correlated change for some but not all of the six core beliefs. In addition, for one of the core beliefs, the regression of change in greed on levels of the core belief vanished when we included correlated change in the model. Correlated change might indicate that factors other than those measured in the present study might have contributed to the developmental trajectories of both trait greed and negative core beliefs. Possible examples of such factors might be negatively experienced events, such as the break-up of a relationship or a feeling of loneliness due to a change of residence. Thus, such experiences might have, on the one hand, increased levels of negative core beliefs (e.g., “I am unloved”) and, on the other, increased striving for money and material goods to compensate for negative emotionality, which, over time, manifested in increased levels of trait greed. According to the pattern of our results, with correlated change for some but not all core beliefs, it can be inferred that our results may be partly but not fully explained by such yet to be identified factors.
Our study was focused on a narrow personality trait rather than on broad domains, such as the Big Five. This allowed us to deduce theory-driven hypotheses from the definition of the personality trait regarding features of the environment as well as person variables that may alter personality traits. Whereas the specific features (e.g., business-related occupations or negative beliefs) may be specific to the variable under investigation (i.e., trait greed), we believe that the general domains, with features of occupation or education on the one hand and core beliefs on the other, are relevant to all personality traits. For example, changes in agreeableness may be positively influenced by the belief that the world is good or negatively influenced by the belief that others cannot be trusted. Future research may test such theory-driven hypotheses for other personality traits beyond greed.
On average, trait greed decreased over time. Even though this pattern was not expected, it could be related to the maturity principle (Roberts et al., 2001). Research on the Big Five has indicated an increase in emotional stability, agreeableness, and conscientiousness during young adulthood, which was interpreted as reflecting the process by which one becomes a productive member of society. Additionally, honesty-humility shows increases over the life span (Ashton & Lee, 2016). As trait greed is negatively correlated with both agreeableness and honesty-humility, our results are in line with the maturity principle. Whereas the time span of our study is relatively small (3 years and 2 months), effects of maturation might still be observed as our participants were in a critical time period (shifting from school to education and work) in which such changes typically occur. Similar decreases have also been reported on other aversive traits like Machiavellianism (Grosz et al., 2019) or the dark factor of personality (Zettler et al., 2021).
We found confirming evidence for a selection effect of trait greed regarding business-related environments but not for a socialization effect of the environment on the development of trait greed. Such results are in line with a study reporting a reduced willingness to donate money among students in business economics in comparison with others when just entering university (freshmen) but no additional socialization effect in later semesters (Frey & Meier, 2003). A similar pattern was found for narcissism among celebrities compared with the general population (Young & Pinsky, 2006). Whereas levels among celebrities were elevated, no effect of years of experience was found, which the authors interpreted as an indication that celebrities had narcissistic tendencies before entering the entertainment industry. The significant selection effect in our study may point toward a potentially bright consequence of greedy behavior: As business-related jobs often have socially desirable attributes, such as high income, greedy individuals may tend to obtain a higher socioeconomic status. As a limitation, 87 to 90% of our sample did not show changes in status, leaving only a small sample of individuals with variance in change over time, which calls for future research with larger samples that are studied for prolonged periods of time. Regarding the lack of a socialization effect, future research might also benefit from longer periods and from disentangling the elements of the objective and perceived elements of the environment that influence socialization (Rauthmann et al., 2015). For example, working in a green-economy start-up may be perceived as either a contribution to a sustainable future or as an opportunity for entrepreneurial growth. Such perceptions of the individual may be more relevant for personality development compared with the objective cues of the environment.
We investigated the development of trait greed in young adulthood, a critical time period for personality change. However, as a limitation of the present study, our results might not generalize to other critical time periods (e.g., retirement) or other age groups in general (e.g., middle-aged adults). As a second limitation, women, and highly educated individuals (in terms of highest school degree) were overrepresented in our sample. Third, all study variables were obtained via self-reports, which allows for method bias (Podsakoff et al., 2003). Fourth, the Negative Core Belief Scale is thus far unpublished, even though validity evidence provided in Studies 1a and 1b is generally in favor of the scale’s psychometric attributes. Fifth, the covariates were only assessed on three out of four measurement occasions.
In sum, our results draw a picture of negative core beliefs shaping levels of trait greed, which subsequently influence the selection of business-related environments. On a theoretical level, these results are in line with selection and socialization effects, and thus, core beliefs can be added as a central variable for understanding personality development.
Supplemental Material
sj-pdf-1-erp-10.1177_08902070221090101 – Supplemental Material for The development of trait greed during young adulthood: A simultaneous investigation of environmental effects and negative core beliefs
Supplemental Material, sj-pdf-1-erp-10.1177_08902070221090101 for The development of trait greed during young adulthood: A simultaneous investigation of environmental effects and negative core beliefs by Patrick Mussel, Jantje de Vries, Maik Spengler, Andreas Frintrup, Matthias Ziegler and Johannes Hewig in European Journal of Personality
Footnotes
Declaration of conflicting interests
The author(s) declared no potential conflicts of interest with respect to the research, authorship, and/or publication of this article.
Funding
The author(s) disclosed receipt of the following financial support for the research, authorship, and/or publication of this article: This research was funded by a research grant to P.M. by the Deutsche Forschungsgemeinschaft (Mu3045/6-1).
Ethics statement
The present research was conducted in compliance with the ethical principles of the Declaration of Helsinki. Ethical approval was obtained from the Julius Maximilians University Würzburg.
Data accessibility statement
This article earned Open Data, Preregistered, and Open Materials badges through Open Practices Disclosure from the Center for Open Science: This study was preregistered prior to data collection at Time 2 under https://osf.io/uk4xb/?view_only=aa94628ae9f64ec1bc9da654d4548541. Pre-Study 1b was preregistered under https://aspredicted.org/1B3_7HV. Data and code availability: All data, code, and materials are available at ![]() .
.
Supplemental Material
Supplemental material for this article is available online.
Notes
References
Supplementary Material
Please find the following supplemental material available below.
For Open Access articles published under a Creative Commons License, all supplemental material carries the same license as the article it is associated with.
For non-Open Access articles published, all supplemental material carries a non-exclusive license, and permission requests for re-use of supplemental material or any part of supplemental material shall be sent directly to the copyright owner as specified in the copyright notice associated with the article.