
Abstract
Establishing the generalizability of empirical findings is essential for a cumulative science. Kiendl, Wenzel et al. (2025) recently examined sources of variability in goal dimensions, as well as three different ways of calculating variability and the specific personality traits (conscientiousness, neuroticism, and trait self-control) that predict them. We replicate their analyses on two independent datasets with different populations (Canadian university students, N = 401; working adults, N = 343), timeframes (biweekly vs. monthly assessments), number of goals (2–3), and goal dimensions. Across all studies, person-level variance was consistently lowest—goal dimensions vary more across goals and time than across individuals. Results were more similar than different when comparing similar dimensions across studies on variability indices, with notable exceptions. Results for personality predictors (conscientiousness, neuroticism, and trait self-control) of variability somewhat diverged; whereas Kiendl et al. found all examined traits to be predictive of two variability indices each, we found less robust relationships (trait self-control predicted dispersion and instability in study 1; neuroticism predicted dispersion in study 2). These discrepancies may reflect methodological differences including assessment frequency and the specific dimensions measured. Our findings corroborate past research in pointing to the importance of considering person, goal, and time levels in goal research.
Plain Language Summary
We tested whether findings from a previous study would hold up with new participants and different methods. We looked at how people's perceptions of their personal goals—like how important or achievable a goal seems—shift depending on the goal they are asked about, when they are asked, and who they are. Feelings about goals different most goal-to-goal and from one time to the next, and to a lesser degree person to person. Whether personality traits predicted these fluctuations was inconsistent. Inconsistences in findings across studies seemed to depend on small design choices like which questions were asked or how much time passed between check-ins. Future research should test these choices more deliberately to understand what's driving the differences.
Science is built on cumulative knowledge. Replication plays a critical role in this process by verifying the reliability and robustness of empirical findings (Nosek et al., 2022). Although most of the past research on replication has focused on directly replicating tests of specific hypotheses (e.g., Open Science Collaboration, 2015), replications are also important when describing new phenomena, to ensure generalizability (Yarkoni, 2022). Generalizability refers to whether past results extend to other participants, stimuli, and measures. When we are at the start of understanding new phenomena, we want to know the extent of the generalizability, and the range of possible values in different contexts, so that we can build better theories and design better studies to capture this range of values. In a recent paper, Kiendl et al., 2025a examined sources of variability in multiple goal dimensions; here we repeat their analyses with two different datasets collected from different participants, over different time frames, and with different goals. This represents an extension of their work, allowing us to examine generalizability of their findings and determine a possible range (rather than point estimate) for likely values for variability over time and goals for multiple goal dimensions.
Goal Pursuit and Variability Over Time and Goals
People set and pursue a variety of goals in their daily lives. From lofty new year’s resolutions (‘lose 20 lbs’) to day-to-day goals (‘finish a report for work this week’), our lives are filled with goals big and small, pursued in different spheres of our lives. Research on goal pursuit frequently asks participants to report their personal goals, and then rate these goals on a variety of dimensions such as difficulty, importance, and motivation (e.g., Koestner et al., 2002; Little et al., 1992; Werner et al., 2016). When considering the multiple goals that a person can pursue, it is not surprising that these goals vary widely on most dimensions. Indeed, research finds that most of the variance in people’s ratings of goal dimensions is across goals, ranging from 60 to 80% (Holding et al., 2017; Milyavskaya et al., 2015; Nurmi et al., 2009; Werner et al., 2016; for a review, see Milyavskaya & Werner, 2018). In addition to varying across goals, however, people’s judgments of their goals could also vary across time. For example, Jack may view his goal to get an A as easy at the beginning of the term, but as more difficult a month in, after completing the midterm. Compared to differences between goals, potential variability in goal dimensions across time has not been explored until very recently. Leduc-Cummings, Milyavskaya, Howard, and Drapeau (2024) report that 34–55% of the variance (across 4 goal dimensions) was over time (6 assessments over 10 weeks). Similarly, Benita and colleagues (2021) report that 39–45% of the variance in progress, effort, and goal-related depressed mood was across measurement occasions (3 or 4 measurements, 2 weeks apart). This research, however, either only focused on one goal (Benita et al., 2021), or examined goals separately (Leduc-Cummings et al., 2024).
One recent study considered variability in goal dimensions across both goals and time (Kiendl et al., 2025a). In this study, participants reported 1–2 goals, across 4 times points separated by approximately a month. They considered nine different goal dimensions: commitment, demand, enjoyment, expectancy, external motivation, facilitation, progress, support, and value. For each dimension, researchers partitioned the variance into that accounted by the goal level, the time-level, and the person level. Although there were large differences across dimensions, for six out of nine dimensions ‘most variance was accounted for by the goal-level (ranging from 47%–69%), followed by the time-level (26%–42%), and the person-level (3.4%–24%)’ (Kiendl et al., 2025, p. 218). The dimensions of support, facilitation, and value all followed somewhat different patterns (see Kiendl et al., 2025a, for full details). These descriptive results pave the way for a better understanding of goal pursuit processes and help researchers target the ‘best’ level to investigate when aiming to understand the predictors of specific goal-related dimensions. For example, Kiendl’s results suggest that focusing on contextual variables related to time would be more fruitful when striving to understand goal value (70% of the variance explained by time) rather than goal enjoyment (26% of the variance explained by time). However, for researchers to best use these results in the future we need to have confidence in the generalizability of these estimates. The original paper already reported on a number of characteristics, finding important differences amongst them. Would a different number of goals, or a different time frame, similarly change estimates? And what about estimates for other different dimensions not assessed by Kiendl and colleagues? By conducting the same analyses with other datasets where we can similarly partition variability into these three sources, we can contribute to a more precise range of estimates and ensure the generalizability of the results.
Predicting Variability Over Time
An additional contribution of Kiendl and colleagues was their focus on quantifying and predicting the variability across time and goals—that is, answering the question of ‘why some people show more variation in how they think and feel about their goals than other people’ (Kiendl et al., 2025, p.1). Cybernetic Big Five Theory (DeYoung, 2015) incorporates the big five aspects of personality into the goal pursuit process, such that they act as calibrators that can bias our reactions and perceptions during goal striving. The theory identifies two meta-traits—stability and flexibility. Conscientiousness (and by conceptual overlap trait self-control) fall under stability, in that they bias someone towards more organized, disciplined, and persistent goal behavior and perceptions. Neuroticism is inversely related to stability, reflecting a tendency to be more reactive especially to threats to goal progress. Kiendl showed that trait self-control and conscientiousness were both related to lower variability, and neuroticism related to higher variability, but that those results were dependent on the metric of variability that was calculated (2025). They also found that the results were consistent across goal dimensions for trait self-control and conscientiousness, but that there were some differences across goal dimensions for neuroticism. That is, although neuroticism related to greater variability (across all goal dimensions), the effects were much stronger for goal progress (compared to the other dimensions). Given the general consistency across the nine dimensions they examined, would these results replicate across different sets of dimensions? On one hand, a different set of dimensions may have more or less variability, which may yield different relations between these aspects of personality and variability. Alternatively, perhaps the specific dimensions matter less, and these adaptive/maladaptive personality aspects generally relate to greater/lower stability regardless of the specific dimensions (or goals) examined. Replicating these analyses in data with different goals and goal dimensions would thus demonstrate the generalizability (or lack thereof) of these prior findings.
Present Research
To test the generalizability of Kiendl et al.’s findings, we used existing data from two previously collected data sets (Leduc-Cummings et al., 2024; Milyavskaya et al., 2025; see more details for both on their respective OSF links). Sample size for each study was determined based on that study’s requirements and is detailed on the respective OSF pages. As our aim was to replicate the analyses of Kiendl et al., 2025a, we did not preregister any hypotheses. Study 1 was a 10-week study with university students, who set two goals (academic and social) and reported on goal dimensions 6 times (every 2 weeks). Study 2 was a 6-month study conducted on prolific with working adults, where participants set 3 goals (work, leisure, relationship) and reported on select goal dimensions every month. In both studies, the designs allowed us to separate the variability in ratings of goal dimensions to variability due to goals, time, and person. Replicating the analyses conducted by Kiendl et al. on their data, we examine different populations, number of goals, timeframe, number of time points, and goal dimensions, thereby extending their results. Seven (in study 1) and three (in study 2) goal dimensions were similar to Kiendl et al.; some of these were theoretically distinct despite conceptual similarities (e.g., self-efficacy and expectancy), while others were theoretically similar but assessed with different items (e.g., goal commitment). Further, study 2 used single item versions of constructs used in study 1, which tend to be higher in variability (Allen et al., 2022). From a generalizability perspective, this allows us to see whether differences emerge between similar constructs as well as different ways of assessing the same goal dimension.
Methods
Participants and Procedure
Study 1
List of all Dimensions and Items Used Across Studies and Notes on Differences
Note. All items measured on a 1–7 (Strongly disagree to Strongly agree) scale unless otherwise specified. Items for all the study 1 constructs were taken from Leduc-Cummings (2023) (https://escholarship.mcgill.ca/concern/theses/jd473274g), where construct validity and all item sources are reported. Sources appear in the table for items not reported there. α = Cronbach’s Alpha; ω = omega total. Kiend et al.’s items taken from https://osf.io/4htcw/files/egsj4 and validated in Kiendl et al., 2025a. Intercorrelations across all dimensions available in supplementary materials on OSF. In the spirit of investigating various methodological decisions, we kept the 7-point and 10-point progress separate, as these scale ranges and their anchors differed and thus may impact results.
Study 2
Participants (N = 362) were recruited on Prolific for a 6-month study. As part of the study they reported three goals that they were pursuing: a work-related goal, a leisure goal, and a relationship goal. Participants completed a baseline survey (conscientiousness, neuroticism, and trait self-control were assess the same way as study 1), as well as six follow-up monthly surveys. For each follow-up survey, they were first asked about their effort, progress, obstacles, and action crises experienced over the past month (see Table 1 for exact items). They were then asked about their status on that goal (options were abandoned, changed, achieved, still pursuing, put on hold, or unsure). If they indicated that they abandoned, changed, or achieved their goal, they were asked for a new goal and were not asked any subsequent questions about the original goal (data from any subsequent times points was treated as missing); otherwise, they reported on commitment and self-efficacy for the original goal.
Analyses
Following Kiendl et al., 2025a, we separated our analyses into two parts. Part 1 focused on determining how much variability lies at the level of time, goals, and people, for each goal dimension. To do this, we specified multilevel models where time (level 1) was nested in goals (level 2) nested in persons (level 3). We ran null models with each goal dimension as the outcome to obtain the intraclass correlation coefficient for each level and took the proportion out of the total to get the percent of variability attributed to each level. This was carried out in R Studio (R Core Team, 2023) using the lme4 package V 1.1-37 (Bates et al., 2015).
In part two, we replicated two main analyses conducted by Kiendl et al. (2025) describing three different ways of indexing variability in goal dimensions, and testing how specific personality traits (conscientiousness, neuroticism, and trait self-control) predict them. We calculated 3 indices of variability. Dispersion is the within-person standard deviation (how a characteristic fluctuates around a person’s mean over time). Instability is the magnitude (absolute value) of change across consecutive time points. In other words, larger jumps from time point to time point (e.g., 1, 4, 1, 5) create more instability than smaller jumps (e.g., 5, 4, 1, 1). Inertia reflects the autoregressive correlation for a goal dimension. In other words, how much does a dimension at time 1 relate to the same dimension at time 2, and how much does the value at time 2 related to the value at time 3. If inertia is a positive value and large, it means the direction of change is strong and stable (e.g., 1, 2, 3, 4 or 4, 3, 2, 1). If inertia is negative, it means the direction of change is unstable or oscillating (e.g., 2, 3, 2.5, 3.5). Inertia is calculated by getting the slope coefficient from a multilevel model predicting goal dimension values at T by T-1, where goal dimensions (level two) is nested in goals (level three) which is nested in persons (level four) with a random slope on the level of goal dimension. Table 4 from Kiendl et al., 2025a overviews these variability indices and offers their equations. The first analysis we replicated is the simple main effects of goal dimension on each variability index (to test whether/how variability differed across dimensions). For the second analysis we tested the effects of the specific personality traits on the three variability indices. In both cases, we followed the exact protocols from Kiendl et al., 2025, including conducting analyses in Stata (StataCorp. 2025) and removing outliers (+/− 3 SD) from the mean on indices of goal dimension variability before conducting the part 2 analyses.
Results
Data Cleaning
When collecting our data, we asked participants whether they changed their goals (and then tracked goal dimensions for the new goals). We thus excluded all data from time points where the goal had changed. For example, if someone changed their goal at time point 3, then we kept data from time points 1 and 2, and removed data from 3 onwards (except for certain variables such as goal progress that asked about the previous goal first). Following this, we removed any person-goal-dimension case that only had one observation (since at least 2 observations are needed to calculate variability). This left us with 3260 person-goal-time cases within 401 participants in data set 1, and 4478 person-goal-time cases for 343 participants in data set 2. The complete breakdown of goal reported and changed at each time point is available on OSF (https://osf.io/2yp37/overview).
Part 1: Variance Partitioning
Figures showing the means and confidence intervals for each goal dimension across each time point for both studies, as well as the full correlational matrices for both studies, for both aggregated and unaggregated data, are available online on OSF (https://osf.io/2yp37/overview). Using three-level models with repeated measures nested in goals nested in people, we ran null models (i.e., models with one outcome and no predictors) for each goal dimension and computed the proportion of variance accounted for at each level. Figures 1 and 2 illustrate this division across the three levels for each goal dimension across both studies. In study 1, approximately 30% of the variance (across all 12 characteristics) was due to the person (ranging from 12 to 55%). The goal was responsible for 36% (range: 15–54%), and time for 34% (range: 25–43%). Despite similar values across the three levels on average, there were some discrepancies across dimensions. The variability for three dimensions (autonomous motivation, plans, specificity) was primarily accounted by the goal. The variability in avoidance motivation and in conflict were primarily accounted for by the person. And variability in approach motivation and progress were primarily accounted for by time. For five other goal dimensions (controlled motivation, competence, difficulty, self-efficacy, and support), variability was similarly accounted by two or more of the levels. Results were somewhat different in study 2, where 51.22% of the variance (across all dimensions; range 45–57) was due to time. The goal itself account for 32.64% of the variance (range: 23–45%), and the person level accounted for only 16.15% (range 7–25). Variability decomposition for goal dimensions in study 1 Variability decomposition for goal dimensions in study 2
Part II: Variability at the Individual Level—Goal Dimension Variability and Traits as Predictors
Simple Main Effects of Goal Dimensions on Variability Indices
Note. all values are significantly different from 0, at p < .001, except for
aFor additional comparisons across studies and with results from Kiendl et al., see OSF.
Association Between Conscientiousness, Neuroticism, and Trait Self-Control and Indices of Variability
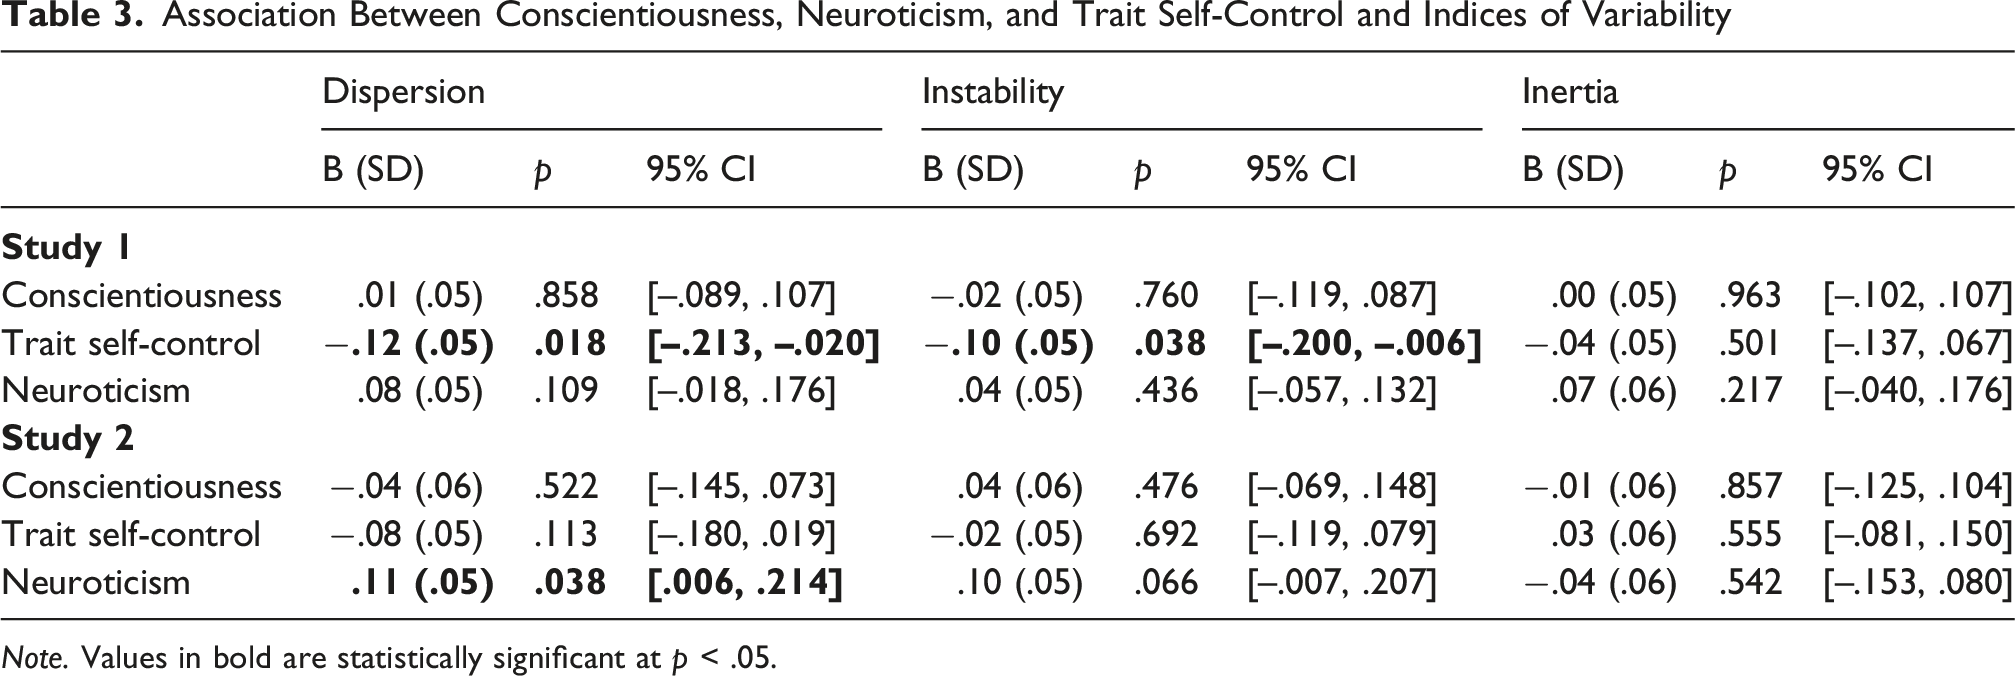
Note. Values in bold are statistically significant at p < .05.
Discussion
In the present paper we aimed to reproduce recent findings describing variability in people’s perceptions of their goals over time (Kiendl et al., 2025a), to ascertain generalizability across different sets of goal dimensions and different methodological decisions (number of goals, follow-ups, and time-lags). In our first study, we assessed seven conceptually similar goal dimensions (out of nine) from Kiendl et al. An additional five dimensions were also assessed. In this study, we also had 2 goals (similarly to Kiendl, who had 1–2 goals per participant), although the time scale was every 2 weeks (instead of every month), and we had 6 measurement occasions (instead of 4 in Kiendl et al., 2025). In our second study, we assessed seven dimensions, and only 3 were conceptually similar with either Kiendl or study 1. In this study participants reported 3 goals, and there were 7 measurement occasions separated by 1 month each. Although some of our results were consistent across studies and with results from Kiendl et al., many others showed important differences, highlighting the critical role of methodological differences.
Partitioning Variance
Part one of our analysis investigates the breakdown of the variance in ratings of goal dimensions across time, goals, and people, to compare across studies and with past results from Kiendl et al., 2025a. Kiendl and colleagues found that much of the variability in characteristics was at the level of goals, then time, and then person. In our first dataset, we found that the goal and the time levels explained approximately the same amount of variability, with only slightly less (on average) explained by the person. In the second dataset a large majority of variance was at the level of time, then goal, then person (with some interesting exceptions). Generally, our data is aligned (both across the two studies, and compared to Kiendl’s results). The person level contributes the least amount of variability in goal dimensions, although the proportion (above 30% in some cases) suggests that individual differences in goal dimensions are not negligible. This aligns with cybernetic big five theory (DeYoung., 2015), which suggests that traits act to calibrate people’s sensitivities and perceptions to goal-related information. Despite this, ratings of dimensions predominantly vary across time and goals, and while the variability in goal dimensions across goals is well-established in past research (Milyavskaya & Werner, 2018), less research has examined shifts in dimensions across time (but see Benita et al., 2024; Thorne et al., 2025). Together with Kiendl’s results, our research shows that people’s perceptions of their goals often shift over time, and can vary greatly goal by goal. This further drives home a strong methodological case for repeatedly measuring goal dimensions over time, and not averaging across goals.
The specifics of the variance partitioning for each given variable, however, differed between the three studies (Kiendl’s study and the two studies in this paper). Conducting the same analyses with data from multiple data sets allowed us to compare the variability breakdown ascertained from different measurement time points, and different number of goals. In study 1, data was collected bi-weekly; in study 2 it was collected monthly (similarly to Kiendl et al., 2025). These two datasets with monthly data collection showed much lower person level variability, whereas the biweekly one showed much larger values, perhaps due to having less time to shift or be influenced (e.g., by setbacks). Additionally, participants in study 1 reported on only two goals, while those in study 2 reported on 3 goals; Kiendl’s participants reported between 1 and 2 goals. Given these differences, we may have expected more variability at the goal level in our study 2 (compared to study 1 and to Kiendl), but this was not the case.
We did find, however, in study 1 that controlled motivation, avoidance motivation, and goal conflict varied the most at the person level, and Kiendl found facilitation also varied the most at the person level, but did not find this was the case for external motivation. This is interesting because it adds complementary evidence that certain individuals may be quite predisposed—perhaps skillful—at creating conditions where goals facilitate one another, while others are predisposed to conditions where goals conflict with each other. At the same time, the differences in external/controlled motivation remind us that claims made about variability decomposition in one study may not generalize to another for certain constructs, and this could be due to methodology, differences in item choice or number, or resultant of the natural variability of the phenomenon.
Predicting Variability
By Goal Dimension
In part two, we calculated different ways of indexing variability, and a) compared them across goal dimensions and b) predicted them from conscientiousness, neuroticism, and trait self-control. In both datasets we found meaningful (non-zero) variability across all dimensions for each of the three indexes of variability (except for inertia for one measure of goal progress in study 2, which was not different from 0). Both data sets also aligned on the direction of inertia, showing that perceptions of characteristics fluctuate around a central tendency (instead of building or decreasing in a certain direction over time). In terms of values, at a first glance study 1 most closely resembles Kiendl’s findings, with dispersion and instability values showing relatively more similar means and CIs on average. However, upon investigating whether the confidence intervals for each conceptually similar dimension overlapped between studies, we noted some differences. Comparing study 1 to Kiendl, study 1 showed higher dispersion and instability for demand, and higher dispersion for external motivation. Study 2 showed higher instability for commitment, expectancy, and progress than Kiendl. Comparing studies 1 and 2, study 2 showed higher dispersion and instability for commitment, expectancy, and progress, yet study 1 showed higher (more negative) inertia for progress. These differences across the studies/datasets may be due to the methodological differences between each study (see generalizability section below for more details), or could represent natural variation in a possibly wide distribution of plausible values.
One interesting and somewhat counterintuitive finding, however, is the tendency to not find positive inertia with goal progress, as prior progress predicts future progress (Szumowska et al., 2025) and thus we might think people would generally show a more linear pattern in their progress (increasing, decreasing, or at least remaining flat), over oscillating back and forth. At the between person level, progress trajectories over multiple months have been found to be flat or quadratic (rising, plateauing, then falling; Milyavskaya et al., 2025). So while on average people seem to follow more stable trajectories, each individual’s own trajectory is much more variable, even in cases where progress does eventually increase over time, illustrating the common saying ‘success isn’t linear’.
By Conscientiousness, Neuroticism, and Trait Self-Control
When it came to predicting variability indices from conscientiousness, neuroticism, and trait self-control, our results diverge somewhat from Kiendl et al. (2025), and across the two studies. Cybernetic big five theory (DeYoung, 2015) suggests big five traits may bias perceptions of goal dimensions. Those high in neuroticism, due to heightened sensitivity to negative stimuli (e.g., uncertainty about goal success), may experience larger deviations in goal dimensions (e.g., commitment and self-efficacy). Indeed, Kiendl et al. found neuroticism predicted greater overall spread and variability between subsequent measurement occasions. We, however, only found neuroticism predicted greater dispersion in study 2. Despite differences in the significance of some of the results, in some cases the magnitude of the effects were similar (e.g., in Study 1 Neuroticism was not significant, but the average effect was within the confidence intervals of both study 2 and Kiendl’s data). Conversely, those higher in conscientiousness, and by conceptual overlap trait self-control (r = 0.65 study 1; r = 0.70 study 2), may be more biased to stability, due to prioritizing long terms goals and enacting adaptive strategies when faced with stressors or setbacks (DeYoung, 2015). Kiendl et al. found that both conscientiousness and trait self-control predicted inertia (temporal consistency) and lower instability. While we did not find effects with inertia in either study, we did see trait self-control negatively predict dispersion and instability in study 1 (but not in study 2) and there were no effects of conscientiousness despite the conceptual overlap with trait self-control. Both conscientiousness and trait self-control include items about organization and productivity/goal directedness; conscientiousness also measures reliability, whereas trait self-control focuses on the ability to resist temptation. Temptations can represent an obstacle to goal pursuit and signal threats to goal success (Milyavskaya & Werner, 2026). Trait self-control, then, more purely captures the ability to resist a major source of instability in goal pursuit (DeYoung, 2015), which may explain the stronger negative association with variability.
Generally, the effects of conscientiousness, neuroticism, and trait self-control on variability indices were not moderated by goal dimensions, with some exceptions. Taken together, our combined findings show mixed evidence for direct and dimension-specific effects of these specific personality traits on variability in goal dimensions. When findings did occur, they were partially consistent with the idea that conscientiousness and trait self-control align with stability while neuroticism aligns with instability (DeYoung, 2015). These tenuous relationships may result from the natural variability between these aspects of personality and goal dimensions, but methodologically, there were subtle differences in our measurement of traits. We used the English versions of scales while Kiendl used validated German versions. We used the same 13-item scale for trait self-control, but while we used the 30-item big five inventory with 6-items per factor, Kiendl used the 15-item ultra-short version with 3-items per factor. On the one hand, fewer items lowers reliability and thus makes it difficult to capture a stable individual difference for which to predict longitudinal variability in goal dimensions. On the other, it also allows for greater variability and context sensitivity, in which recent personality states (e.g., high neuroticism) predicts fluctuation better in the coming weeks, although this is only speculative.
Generalizability in Psychological Research
These differences in findings both between our two studies and with Kiendl et al.’s results highlight the challenges in generalizing findings across different research methodologies (Bauer, 2023; Yarkoni, 2022). Our studies tested the same general questions with the same statistical procedures but with different methods, as well as conceptually similar but slightly different measures for certain goal dimensions. As such, we would not expect exactly the same results, as variability is normal and expected given all the methodological differences. In this case, results for both the partitioning of variability and the relation of the variability to traits varied somewhat across studies, and across dimensions. These variabilities could be due to the specific dimension examined, to the sample itself (student vs. non-student; German vs. Canadian), the number or content of goals, the frequency and time-lag of the follow-ups, the number and wording of items, as well as to other potential methodological differences that we have not even specifically considered (e.g., time of year when the data was collected). Conversely, finding similar results across the three studies (e.g., that the smallest amount of variability is at the person level) highlights findings that are robust. Compiling data from studies using different operationalizations and research methods provides a broader range for possible effects beyond those due to the specific methodological decisions of one study. This allows researchers to calibrate their expectations, for example when conducting power analyses for future studies. We hope that others continue to build on these findings so that we may better zero-in on a plausible range of effect sizes.
Conclusions
Across 2 studies with different timescales, number of goals, and goal dimensions, we found different results both for the breakdown of variance across person, goal, and time levels, and for the effects of select personality traits (conscientiousness, neuroticism, and trait self-control) on variability. This highlights the importance of such methodological considerations for any definitive conclusions about the role of personality, and the descriptive variability of goal dimensions. Across the three studies, one broad takeaway is that ratings of goal dimensions vary across person, goal, and time, and research needs to consider all three levels when designing studies that try to understand these dimensions. As our studies differed on many different aspects of the method, future research needs to better understand whether certain aspects of the design systematically drive differences. For example, perhaps student populations have goals that are more or less similar to each other, or perhaps academic goals are less likely to change over time compared to other goals. Overall conclusions should be derived from a broad body of evidence, comprising many different methodologies, rather than any one study.
Footnotes
Ethical Considerations
Studies used in this paper were approved by the Carleton University Research Ethics Committee.
Funding
The authors disclosed receipt of the following financial support for the research, authorship, and/or publication of this article: This work was funded by grants from the Social Sciences and Humanities Research Council of Canada and the Canadian Foundation for Innovation to Marina Milyavskaya.
Declaration of Conflicting Interests
The authors declared no potential conflicts of interest with respect to the research, authorship, and/or publication of this article.
Open Science Statement
As our aim was to replicate the analyses of Kiendl et al. (2025), we did not preregister any hypotheses. Sample size for each study was determined based on that study’s requirements and is detailed on the respective OSF pages. For all analyses we report basic descriptive statistics, effect sizes, exact p-values, and 95% confidence intervals. Raw and processed data, outputs, code, and syntax are available on OSF (![]() ).
).