






Abstract
Background:
Breastfeeding initiation rates vary considerably across racial and ethnic groups, maternal age, and education level, yet there are limited data concerning the influence of geography on community rates of breastfeeding initiation.
Objective:
This study aimed to describe how community rates of breastfeeding initiation vary in geographic space, highlighting “hot spots” and “cool spots” of initiation and exploring the potential connections between race, socioeconomic status, and urbanization levels on these patterns.
Methods:
Birth certificate data from the Kentucky Department of Health for 2004-2010 were combined with county-level geographic base files, Census 2010 demographic and socioeconomic data, and Rural-Urban Continuum Codes to conduct a spatial statistical analysis of community rates of breastfeeding initiation.
Results:
Between 2004 and 2010, the average rate of breastfeeding initiation for Kentucky increased from 43.84% to 49.22%. Simultaneously, the number of counties identified as breastfeeding initiation hot spots also increased, displaying a systematic geographic pattern in doing so. Cool spots of breastfeeding initiation persisted in rural, Appalachian Kentucky. Spatial regression results suggested that unemployment, income, race, education, location, and the availability of International Board Certified Lactation Consultants are connected to breastfeeding initiation.
Conclusion:
Not only do spatial analytics facilitate the identification of breastfeeding initiation hot spots and cool spots, but they can be used to better understand the landscape of breastfeeding initiation and help target breastfeeding education and/or support efforts.
Well Established
Breastfeeding initiation rates are lower for mothers residing in rural areas of the United States, but it is unclear how local geographic context may contribute to variations in these rates.
Newly Expressed
Breastfeeding initiation rates improved from 2004 to 2010 in Kentucky but these improvements clustered in urban and semi-urban counties. Although rural regions did show improvement, their rates continue to lag relative to others in Kentucky.
Background
Exclusive breastfeeding for at least 6 months without supplementation from other sources such as formula, rice cereal, or water confers significant health benefits to both children and mothers.1-4 However, in 2013, the Centers for Disease Control and Prevention reported that only 49% of children in the United States were breastfeeding at 6 months and only 16.4% were exclusively breastfed. 5 The state of Kentucky displayed rates far below the national average for 2013, with only 32.5% breastfeeding at 6 months and 14.4% doing so exclusively. 5
A variety of factors can influence breastfeeding initiation, ranging from hospital practices, socioeconomic status, education levels, marital status, ethnic background, and participation in the Special Supplemental Nutrition Program for Woman, Infants, and Children (WIC).6-12 Recent work has also suggested that breastfeeding initiation and continuation are strongly associated with residential location, indicating that mothers living in rural areas are less likely to initiate and continue breastfeeding.13-17 The lack of access to obstetric and pediatric health professionals, education programs (eg, hospital breastfeeding classes, International Board Certified Lactation Consultants [IBCLCs]), and/or support groups such as La Leche League (LLL) may serve as barriers to understanding the benefits of breastfeeding and, ultimately, its initiation. In Kentucky, for example, there are only 35 registered IBCLCs, with the bulk of them working in the larger metropolitan regions (eg, Lexington, Louisville, Bowling Green, etc).
Social context is equally important to consider. 18 The norms that govern breastfeeding behaviors in social environments and the workplace can affect a mother’s choice to breastfeed.13,18 These norms are also influenced by state laws and regulations. For example, as of 2015, only 29 states exempt breastfeeding from public indecency laws. 19 This includes Kentucky, which, as of 2006, protects the rights of mothers to breastfeed in any location, public or private. 20 Seven states (Arizona, California, Delaware, Mississippi, North Carolina, Texas, and Vermont) have specific laws protecting onsite breastfeeding or time and/or place to express breast milk for mothers in the workplace. Twelve states and Puerto Rico allow breastfeeding mothers to skip jury duty. Finally, mothers in the state of Virginia are allowed to breastfeed on any land or property owned by the state.
In short, place and associated geographic context are extremely important factors that contribute to the social and workplace environments that shape breastfeeding norms and a mother’s decision to initiate. However, there are challenges associated with uncovering these connections. As detailed in previous work, place is often treated as the leftover, residual influence after individual-level characteristics have been accounted for in modeling health outcomes. 21 This lack of specificity regarding geographic context is problematic for exploratory and confirmatory modeling because place includes the physical characteristics of a location (eg, climate, topography), local cultures, institutions, traditions, lifestyles, and governing policies to which people are exposed on a daily basis.22-25 This place-based exposure can influence health behavior.25,26 It is unfortunate that current literature does not offer clear evidence of an association between place and community rates of breastfeeding initiation, aside from tabulating the basic differences between urban and rural locales.
For the purposes of this analysis, the state of Kentucky (Figure 1) provides an interesting backdrop for exploring community rates of breastfeeding initiation and the effects of place. Kentucky is an eclectic mix of Southern, Midwestern, and Appalachian culture. Estimates suggest that approximately 41% of the state’s residents (~1.8 million) live in rural areas. 27 The racial composition of Kentucky is majority white (88.3%), with a black population of approximately 8%. 27 Black residents are primarily concentrated in the Louisville metropolitan area (~22% of the local population) and parts of Fayette County (Lexington), but concentrations can also be found in many of the rural mining communities in Southeastern Kentucky. Nearly 19% of Kentucky residents live in poverty, which is significantly higher than the national average of 14.5%. The overall population of Kentucky is also undereducated when compared to national averages, with only 21.5% of its residents 25 years or older with a bachelor’s degree or higher, 7.3 percentage points below the national average. 27 Finally, 56 of Kentucky’s 120 counties are considered “Appalachian Kentucky,” an area targeted by federal and state government partnerships seeking to improve/promote economic development, strengthen health care services, enhance infrastructure, and build local and regional capacity. 28

The Commonwealth of Kentucky.
The purpose of this research is to deepen our understanding of place and geography as it relates to breastfeeding initiation. Urban and rural differences are detailed, as are the connections between race and socioeconomic status. Specifically, this research asks the following questions:
Are there any systematic geographic patterns associated with breastfeeding initiation at the county level in Kentucky?
If these patterns exist, how did they change over time?
Are factors such as unemployment, income, demographic composition, education levels, the presence of lactation consultants, and community location associated with breastfeeding initiation?
Methods
Design
This study is structured as a retrospective, exploratory analysis of how community breastfeeding initiation rates vary in geographic space, highlighting “hot spots” and “cool spots” of initiation for Kentucky. The study sample consists of a cross-sectional, birth certificate database of breastfeeding initiation by the mother’s county of residence between 2004 and 2010 and was provided by the Kentucky Department of Health via its Cabinet for Health and Family Services. Data were aggregated to the county level (n = 120) for each year by the state of Kentucky, prior to release. As a result, all individual demographic characteristics of mothers (eg, race) are masked. Between 2004 and 2010, the average number of live births in Kentucky was 57 224 per year. However, because of reporting constraints and the delays in receiving and processing birth certificates of Kentucky residents who had children out of state, portions of the data used for this analysis (2008-2010) were preliminary. Use of these publicly available data did not require ethical approval.
Measures
A geographic base file for all counties in the state of Kentucky was obtained from the US Census Bureau (n = 120). The dependent variable, which was average breastfeeding initiation rates for each county, was linked to this base file, as were the independent variables used for confirmatory spatial regressions (Table 1). Rural and urban status of counties was determined using the US Department of Agriculture’s 2013 Rural-Urban Continuum Codes (RUCC). The RUCC categorize counties by the population size of their associated metropolitan area.17,29,30 For the purposes of this article, counties are categorized as metropolitan (RUCC 1,2,3) or nonmetropolitan (RUCC 4,5,6,7,8,9) and operationalized as a binary (1,0) variable. Community organizations that support breastfeeding efforts of mothers and provide associated education resources (eg, La Leche League of Kentucky and the Lactation Improvement Network of Kentucky [LINK] 31 ) were identified, and their presence or absence (1,0) in each county was accounted for.31,32 LINK is Kentucky’s branch of the US Breastfeeding Coalition, which seeks to foster a community culture where support for breastfeeding is the norm. 33 Finally, the number of IBCLCs in each county was also accounted for and operationalized as a per-capita measure.31,34,35
Independent Variables.

Statistical Analysis
This study used a combination of exploratory and cross-sectional confirmatory spatial statistical methods to address the questions concerning breastfeeding initiation for Kentucky. Specifically, exploratory spatial data analysis (ESDA) was used for identifying patterns in data and forming new hypotheses. It emphasized description rather than formal hypothesis testing.35-37 In addition to basic geovisualization of breastfeeding initiation rates, both global and local measures of spatial autocorrelation38,39 were used to identify the geographic composition of breastfeeding initiation clusters and any outliers using the following typology:
High-high: counties displaying high levels of breastfeeding initiation that are surrounded by counties with similarly high levels.
Low-low: counties displaying low levels of breastfeeding initiation that are surrounded by counties with similarly low levels.
Low-high: counties displaying low levels of breastfeeding initiation that are surrounded by counties with relatively higher values.
High-low: counties displaying relatively high levels of breastfeeding initiation that are surrounded by counties with relatively lower values.
The values of the local and global Moran’s I tests are interpreted like a correlation coefficient. As I approaches 1, positive spatial autocorrelation is present. As values for I approach −1, negative spatial autocorrelation is present. A variety of spatial weight matrices, wij, were tested for sensitivity, including neighborhoods defined by contiguity, distance, and nearest neighbors. For this article, both a k = 4 nearest neighbor matrix and a queen’s contiguity matrix were ultimately selected for use. Their specific uses are detailed below, but both represent relatively compact, yet meaningful areas from which to assess spatial interaction between communities and access to health care and for maintaining salient local context in the exploration of breastfeeding initiation.
Although logistic regression models are frequently used with individual-level data to identify associations between breastfeeding initiation and maternal characteristics,11,12,40-42 the dependent variable for this study corresponds to a geographic rate, not individual-level data. Thus, a multivariate spatial regression model was implemented, using a queen’s contiguity matrix to help capture local geographic context. Unlike ordinary least squares regression, the use of a spatial autoregressive term for the response variable helps account for the underlying spatial dependence in geographic data.43-45 In short, because local geographic processes in 1 area can influence the processes in other areas, the ability to model spatial dependence of breastfeeding initiation rates between Kentucky counties helps us account for the geographic spillover and/or spatial effects of prevailing breastfeeding initiation practices and community norms.
Results
Question 1: Are there any systematic geographic patterns associated with breastfeeding initiation at the county level in Kentucky?
Figure 2 illustrates breastfeeding initiation rates, by county, for 2010. There are several patterns worth noting. First, the bulk of counties with high rates are located in metropolitan areas. This includes Louisville, Lexington, Bowling Green, and Covington. In several of these counties, breastfeeding initiation rates exceed 70%, approaching the initial benchmark value of 75% set by the US Department of Health and Human Services’ Healthy People 2020 program. 46 The benchmark has subsequently been revised to 81.9%. 46 However, counties located in rural Eastern (Appalachian) Kentucky display much lower initiation rates, with many locales at less than 35%.

Breastfeeding Initiation Rates by County, Kentucky 2010.
Given the varied spatial distribution of initiation rates displayed in Figure 2, are there any statistically significant differences between metropolitan and nonmetropolitan counties in Kentucky? Results of the independent t test show that breastfeeding initiation rates differ between metropolitan counties (mean [SD] = 57.88% [11.30], n = 35) and nonmetropolitan counties (mean [SD] = 43.72% [12.58], n = 85) at the .05 level of significance (t = 4.95, df = 118, P < .05, 95% confidence interval [CI] for mean difference, 7.29-17.01). On average, women in metropolitan counties are more likely to initiate breastfeeding when compared to women in nonmetropolitan or rural counties. These findings support much of the previous work concerning urban/rural differences in breastfeeding initiation.13-17,47,48
Question 2: How did the systematic geographic patterns of breastfeeding in Kentucky change over time?
Figure 3 highlights a time-series analysis of spatial autocorrelation (hot spots and cool spots) in breastfeeding initiation rates for 2004-2010 using a k = 4 nearest neighbor weights matrix. Local Moran’s I values are italicized for Figure 3 and all are significant at the .05 level. This type of analysis is important because rather than simply acknowledging that metropolitan areas surpass nonmetropolitan areas for community initiation rates, Figure 3 highlights the systematic spatial statistical patterns associated with these rates and allows one to track changes over time. In all 7 years, community rates of breastfeeding initiation displayed positive spatial autocorrelation throughout the state of Kentucky. It is not surprising that the urbanized Interstate 64 corridor between Louisville and Lexington is a somewhat persistent hot spot of relatively high rates (highlighted in red). Similarly, rural Eastern Kentucky (highlighted in blue) is a relatively persistent cool spot of breastfeeding initiation. Table 2 details the descriptive statistics of the hot spots and cool spots over time. Although average initiation rates for high-high counties are steadily increasing, the average rates for low-low counties display a touch of variability. Returning for a moment to Figure 3, perhaps its most interesting characteristic is the gradual morphological shift in the hot spot. Between 2004 and 2010, not only is there noticeable growth in counties classified as hot spots (+31.25%), but there is significant infill of high-high counties along the Interstate 65 corridor, extending from Louisville to Bowling Green. There is also a modest reduction in the number of counties classified as cool spots (–8.69%), but their overall pattern remained relatively static.

Breastfeeding Initiation in Kentucky: Hot Spots and Cool Spots, 2004-2010.
Mean (SD) of Breastfeeding Initiation Rates for Hot Spots and Cool Spots (N = 120).
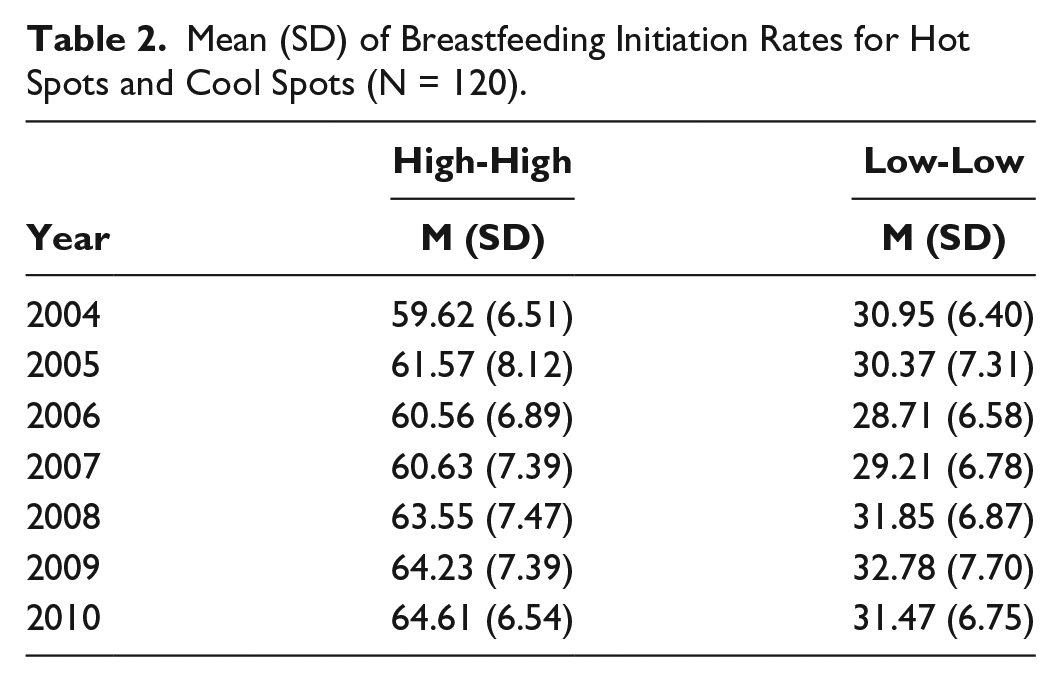
Figure 4 presents an alternative geovisualization of changes in community breastfeeding initialization rates, displaying levels of growth and decline for each county over the 7-year period. Counties highlighted in yellow-to-red experienced a growth in rates, whereas those in light blue-to-dark blue were relatively stable or experienced a decline. It is clear that several regions, including the area in/around Bowling Green, displayed a relatively strong level of growth.

Change in Breastfeeding Initiation Rates in Kentucky, 2004-2010.
Question 3: Are factors such as unemployment, income, demographic composition, education levels, and community location associated with breastfeeding initiation?
Table 3 displays the results of the spatial regression model. A spatially lagged measure of community breastfeeding initiation rates for 2010 served as the dependent variable and a queen’s contiguity matrix was used for defining the spatial relationships between counties. Several clear associations are observed in the model. Confirming much of the existing work regarding breastfeeding initiation at the individual level,40-42 educational achievement appears to have a strong, positive association with community levels of breastfeeding initiation. In this particular instance, counties with higher populations of residents with bachelor’s or graduate degrees were strongly linked to breastfeeding initiation. There is also a modest, statistically significant, and positive association between the presence of IBCLCs and breastfeeding initiation at the county level. Where local demographic characteristics are concerned, black, white, and Hispanic populations displayed a negative association with breastfeeding initiation in Kentucky. In addition, the percentage of renter-occupied housing units was significant and negatively associated with breastfeeding initiation. Metropolitan status and local unemployment rates were not significantly associated with breastfeeding initiation. Last, several models that included the variable for community breastfeeding support groups (eg, LLL) were specified, but the results suggested that the presence of these groups was not a statistically significant factor on breastfeeding initiation in Kentucky counties.
Spatial Regression Model Results for the Relationship between Breastfeeding Initiation Rates and County-Level Socioeconomic and Demographic Characteristics. a
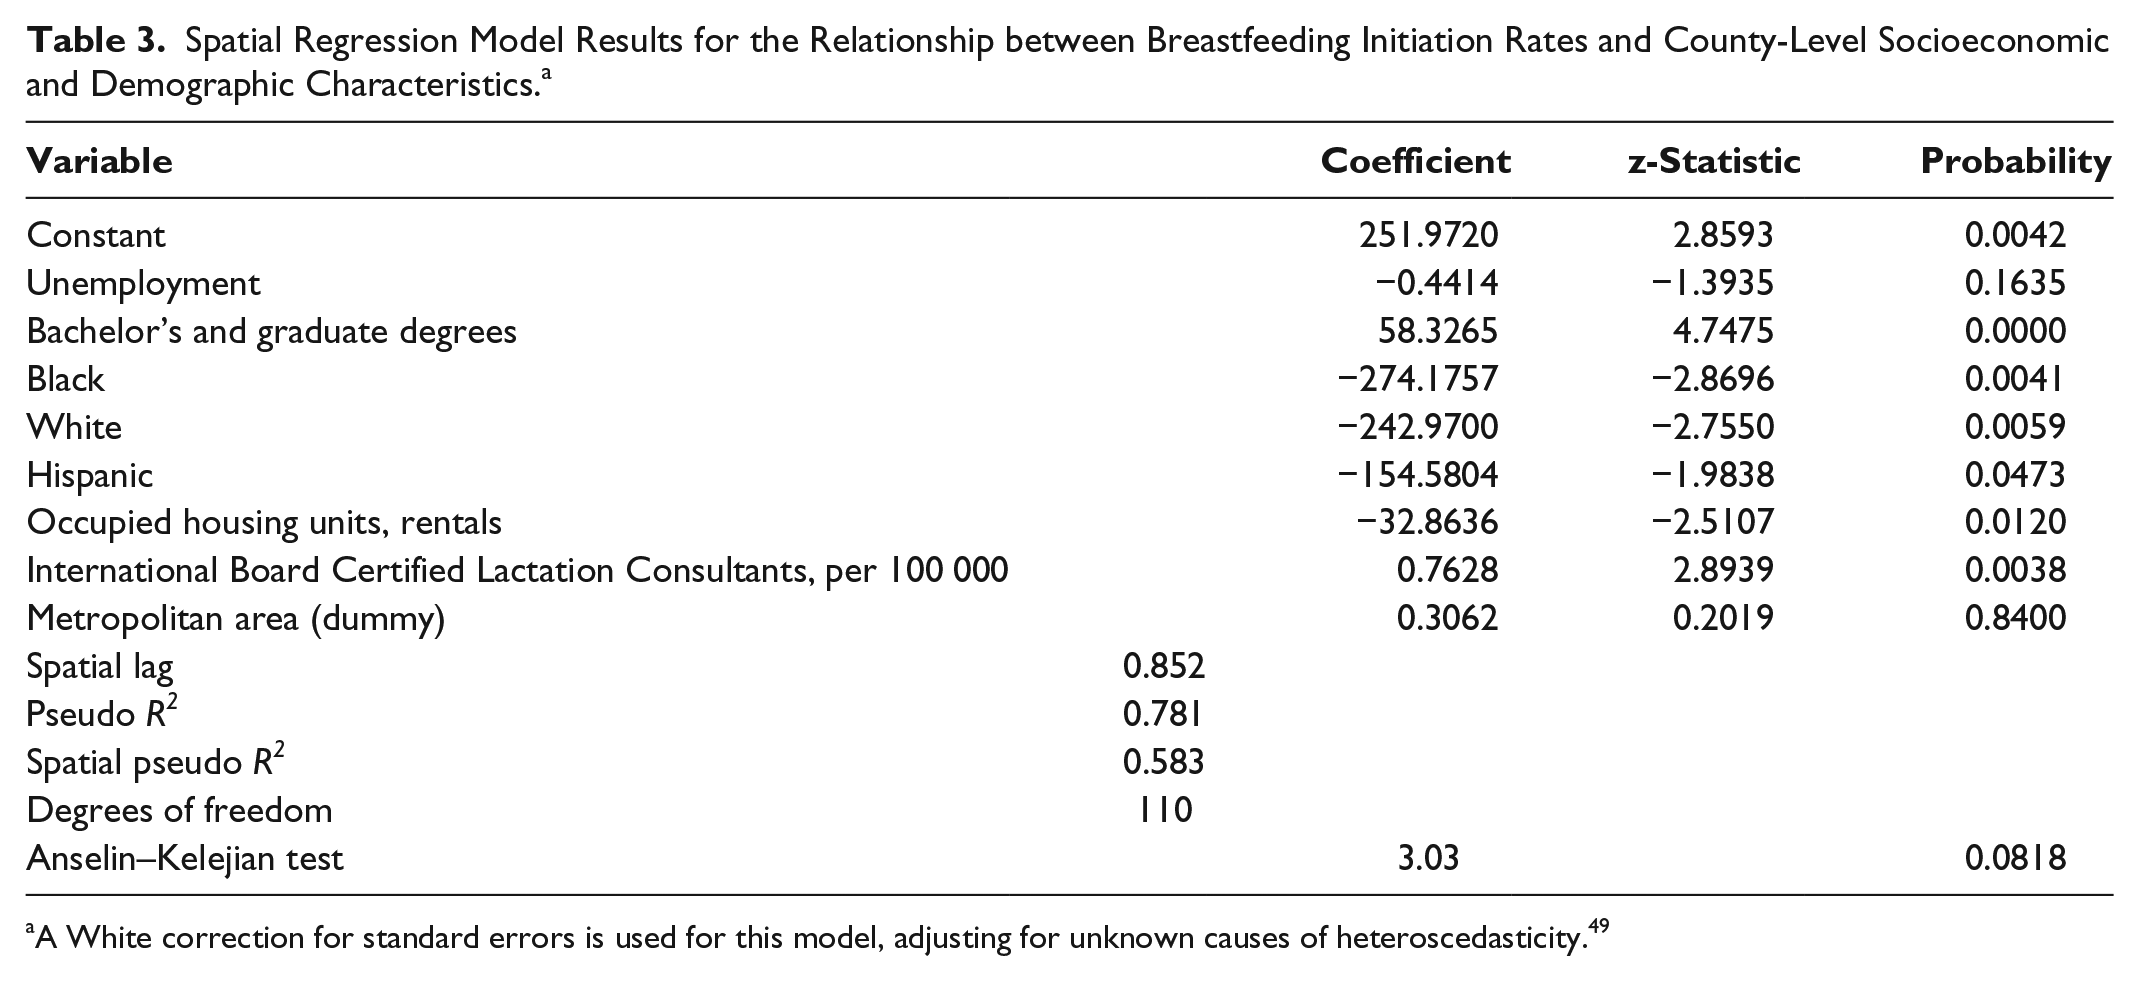
A White correction for standard errors is used for this model, adjusting for unknown causes of heteroscedasticity. 49
Discussion
There are several facets of the results that merit additional discussion. First, although breastfeeding initiation rates gradually improved between 2004 and 2010 in Kentucky, the locations of its cool spots remained relatively persistent. This was especially true in Eastern Kentucky, which is a region plagued by significant social and economic challenges, including entrenched poverty, high levels of unemployment, poor access to basic services (including health), and low educational achievement. This presents a challenging environment for promoting the health benefits of breastfeeding, and it is clear from our results that community levels of breastfeeding initiation in Appalachian Kentucky are much lower than the remainder of the state.
Second, one plausible explanation for this is geographic isolation. Reconsider Figure 3, which highlights the hot and cool spots of breastfeeding initiation for 2010 with the interstate highway system overlaid on the counties. It is clear that there is a strong visual correlation between interstate access and breastfeeding initiation hot spots. Of note is that the core hot spot for Kentucky expanded along the I-65 corridor between 2004 and 2010. This is not to say that interstate access is a prerequisite for higher levels of breastfeeding initiation, but it does suggest that geographic access and accessibility might play a role. Again, this may manifest in many different ways, such as access to education resources, higher levels of maternal mobility (which can be influenced by transport options, education, income, etc), and access to community support groups, health care, or Baby-Friendly hospitals.
Third, the spatial regression model suggests that race and ethnicity are significant predictors for community levels of breastfeeding initiation but that white, black, and Hispanic populations in Kentucky are negatively associated with community initiation rates. Although this represents a modest departure from the existing literature, which suggests that whites are more strongly associated with breastfeeding initiation than blacks or Hispanics,9,42,50 it is important to remember that breastfeeding initiation rates throughout the entire state of Kentucky are extremely depressed when compared to the US national average, transcending race and ethnicity. However, the presence of IBCLCs within a community was positively associated with breastfeeding initiation, strongly supporting previous work that suggests that women who gave birth at hospitals that employed IBCLCs 51 or facilitated peer counselors with access to IBCLC expertise 52 were more likely to initiate breastfeeding.
Finally, subsequent statistical testing (not reported) suggested that community resources for breastfeeding education, such as LLL, were not significantly associated with breastfeeding initiation. This is not surprising because mothers often find these resources some weeks after the birth has occurred, when they are looking for breastfeeding support. In this context, it is important to note that LLL is formally defined as a mother-to-mother support group for breastfeeding and not prenatal education. Thus, although LLL does encourage expecting mothers to attend meetings, the effect of LLL support manifests during the postpartum period.
There are, of course, several limitations to the results reported in this study. Because of its focus on community levels of breastfeeding, and the use of aggregate breastfeeding initiation rate data from birth certificates, information concerning the actual demographic and socioeconomic characteristics of mothers and their individual decision to breastfeed is obscured. This is one of the primary reasons that the regression model suggests that both black and white populations are negatively associated with breastfeeding initiation. Simply put, this is an issue of scale (individual vs county). Second, this analysis could benefit from additional information on hospitals and/or birthing options throughout the state. As detailed by Allen et al, 17 local institutional support for breastfeeding at hospitals can vary. Finally, future research in this domain would benefit from the fusion of individual-level data on breastfeeding choices with the types of spatial data detailed and used in this article. We are particularly optimistic that multilevel modeling efforts and detailed evaluations of access and accessibility to breastfeeding resources would provide fruitful avenues for additional research.
Conclusion
The results of this study suggest that community levels of breastfeeding initiation display a systematic spatial pattern in the state of Kentucky. Both hot spots and cool spots exist and are associated with measures of race, education, and housing status. The use of ESDA and confirmatory spatial statistics provides a unique overview of initiation rates, helping capture changes through time and identifying variation in community breastfeeding profiles. This type of geospatial intelligence can provide public health officials and educators with a useful tool for geographically targeting interventions and preemptive breastfeeding education efforts. In this instance, Appalachian Kentucky appears ripe for such interventions.
Footnotes
Declaration of Conflicting Interests
The authors declared no potential conflicts of interest with respect to the research, authorship, and/or publication of this article.
Funding
The authors received no financial support for the research, authorship, and/or publication of this article.