
Abstract
Using an aggregate production function, the impact of runways at commercial airports on several measures of metropolitan statistical areas’ economic welfare in combination with labor, private capital, and public-sector capital is estimated. By focusing on runways at commercial airports, we estimate the impact of reducing congestion that sets in and takeoffs and landings as air activity nears the technical limit for safe operations. Both the number of runways and the maximum length of runway available at a given airport correlate positively with real gross metropolitan product with a negative cross product between the two, suggesting a trade-off between the number of flights possible and the size of the aircraft that can use the airport. Additional analysis examines the impact of additional runways on other measures of economic activity.
Keywords
Introduction
President Obama’s stimulus package and discussions on an “infrastructure bank” have highlighted the economic development and job creation impacts that policymakers attribute to infrastructure investment. The American Recovery and Reinvestment Act (ARRA) of 2009 included $275 billion for job creation under federal contracts, grants, and loans, including $1.1 billion for the Federal Aviation Administration (FAA) for airport grants-in-aid (Bilotkach, 2010). This perspective argues that a nation’s infrastructure is a productive input, interacting with labor and private capital to generate increases in output and income, reflected in various measures of a nation’s growth and development.
The focus in this analysis is the metropolitan area, and an aggregate production function provides a useful framework for thinking about metropolitan output as a function of labor, private capital, and public-sector capital. Within this context, public-sector capital or infrastructure (e.g., highways, water systems, public universities) is a factor of production that contributes to metropolitan growth and economic development. In contrast to most existing literature, this study focuses on airport infrastructure, and in particular, runways at commercial airports, which has received relatively little attention in the literature. Adding to the infrastructure and metropolitan growth literatures, this study develops and estimates models that analyze the impact that airport runways have on economic development in metropolitan areas.
Commercial airport runways are an input into a metropolitan area’s production function that interacts with labor, capital, and other factors to generate metropolitan output. In reducing airport costs per passenger, managers can increase air traffic volumes that facilitate metropolitan development and growth. Constraining traffic growth and an airport’s impact on metropolitan development is the number of runways at an airport, fixed in the short run and slow to change in the longer run. Runway usage is subject to initial low marginal costs that then begin to rise as congestion sets in and as takeoffs and landings near the technical limit for safe operations. Once takeoffs and landings reach this limit, the resource costs of additional throughput becomes a choke point whose sustained effects can retard metropolitan growth and economic development.
For this study, we use real gross metropolitan product (GMP) to measure the level of economic activity in a metropolitan area. Gross output at the metropolitan level is particularly relevant for this study since the largest development effects of airport infrastructure are expected to occur in those geographic locales, the metropolitan areas, where the airport is located.
Review of Literature
Since the 1980s, there have been an increasing number of articles analyzing the impact of public capital on economic growth and exploring the extent to which public capital affects total factor productivity and economic growth (Aschauer, 1989). Throughout the literature, researchers use two main approaches to analyze the relationship between the stock of and infrastructure investment on both the aggregate and private output: (a) an aggregate production function to estimate the impact of capital, labor, and public capital on economic growth and (b) a cost function to estimate the effect of public capital on costs of private production.
da Silva Costa, Ellson, and Martin (1987) estimate the impact of public capital on regional output at the state level using a translog production function. Defining public capital as outlays of state and local governments, the study finds that public capital experiences diminishing returns with respect to gross value of production, and the results support the inference that labor and public capital are complements.
Aschauer (1989) considers the relationship between aggregate productivity and the stock of government expenditures on public infrastructure over the period from 1949 to 1985. Aschauer presents a statistically significant private return to public capital where a 1% increase in the ratio of public to private capital stocks raises total factor productivity by 0.39%.
Munnell (1990a), building on Aschauer’s findings, explores whether changes in the amount of public capital combine with the growth of private capital and labor to explain the productivity slowdown in the 1970s. Assuming that services are proportional to the public-sector capital stock and under constant returns to scale, Munnell finds that a 1% increase in public capital increases labor productivity by 0.31% to 0.39% for total nonmilitary public capital and core infrastructure, respectively. 1
In related work, Munnell (1990b) uses a translog production function approach to estimate the impact of public capital on gross state product (GSP) at the state and regional levels. Since no observations on the stock of either private or public capital values are available on a state-by-state basis, Munnell segregates the national totals based on input category. 2 In that study, Munnell estimates an elasticity of 0.15 on public capital, less than half the value found in Aschauer (1989) and Munnell (1990a).
In further analysis, Munnell analyzes the impact of various components of public capital on output and finds that highways (0.06) and water and sewer systems (0.12) provide the major impact on output (Munnell, 1990b). And in a regional analysis, Munnell reports uniformly positive but varying elasticities of the productivity of public capital: 0.07 for the Northeast, 0.12 for North Central states, 0.36 for the South, and 0.08 for the West (Eisner, 1991).
Eisner (1991) uses the same data set as Munnell (1990b) and replicates the calculations using pooled time series, pooled cross-section, and first difference regression equations to explore the disparity between the national-level and state-level results. Eisner’s time series analysis approach does not yield a statistically significant estimate for the elasticity of public capital under the assumption of constant return to scale. His cross-section analysis, however, estimates the elasticity of public capital with respect to GSP at 0.165 (Eisner, 1991). These results suggest that more public capital generates a larger GSP.
Tatom (1991) presents a theoretical argument critical of the existing public capital hypothesis and reviews the claims made by proponents of the infrastructure deficit view. Tatom argues that most of the previous literature does not account for nonstationarity in the time series, ignores the trend or broken trend of productivity, and overlooks the impact of changing energy prices. Accounting for these reduces conventional estimates of elasticity of private capital output to public capital by 30% to 40% to 0.13% for a 1% change in public capital.
Holtz-Eakin (1994) argues that refined empirical methodology reconciles the differences between those who support the hypothesis that public-sector capital affects the private-sector output and those who do not. Estimates of production function that control for unobserved, state-specific characteristics reveal no role for public capital in affecting private-sector productivity (Holtz-Eakin, 1994). Only estimates of state production functions that do not include such controls find substantial productivity impacts (Holtz-Eakin, 1994).
Garcia-Mila, McGuire, and Porter (1996) analyze the effect of public capital on GSP in state-level production function using observations for the 48 contiguous states from 1970-1983. This study tests for random effects, fixed effects, nonstationarity, endogeneity of the private inputs, and measurement error. The systematic investigation leads the authors to choose the first difference with fixed-state effects as the preferred specification. In the presence of a statistically significant estimate for private capital and the absence of a statistically significant estimate for public capital, Garcia-Mila et al. (1996) conclude that only private capital affects private output within the framework of an aggregate production function. This result is consistent with Holtz-Eakin (1994).
A number of recent studies focus explicitly on airports and economic development. Exploring air passenger travel and urban development, Goetz (1992) finds a positive correlation between increases in per capita passenger flows and past and future urban growth, consistent with the notion that air travel affects economic development. Hakfoort, Poot, and Rietveld (2001) and Brueckner (2003) study the impact that airports have on metropolitan employment. Using an input–output framework to analyze the effects on the Greater Amsterdam region from an expansion at Amsterdam’s Schiphol Airport, Hakfoort et al. find a one-to-one relationship, a one-job increase at Schiphol producing one job from indirect and induced effects. Exploring linkages between employment and air traffic in the Chicago metropolitan area, Brueckner (2003) finds that a 1% increase in passenger enplanements increases employment in service-related industries 0.1%. This has important implications for metropolitan development from airport expansions. Brueckner’s results indicate that expanding Chicago O’Hare International Airport would generate 185,000 service-related jobs.
Green (2007) uses various measures of airport passenger and cargo activity to analyze the relationship between airports and metropolitan growth. After controlling for various factors, Green finds that passenger activity is a strong predictor of population and employment growth.
Fullerton, Licerio, and Wangmo (2010) estimate the impacts of education, presence of a commercial airport, and roadway capital on county per capita incomes in Arkansas. The study finds no evidence that an interstate highway within the county or an increase in the network of other types of highways affects per capita income. The study does find, however, that per capita incomes in counties with commercial airports are higher in comparison with the counties without commercial airports, and the effect is statistically significant.
The present analysis adds to the literature on the productivity of public capital and, in particular, airports and runway capacity. Furthermore, in focusing on metropolitan growth and development, this study adds to the developing literature on the role of airports in metropolitan growth and will have implications for regional, metropolitan, and local policymakers.
Empirical Methodology
Our analysis adopts a Cobb–Douglas aggregate production function. A Cobb–Douglas production function is multiplicative in inputs and generates a double-log empirical specification. Including public capital (Rit) as a factor of production gives the following Cobb–Douglas specification:

where Ai is a constant (reflects fixed effects), α2, α3, and α4 are parameters to be estimated, and ϵ it is a stochastic term. Taking the logarithm of both sides gives
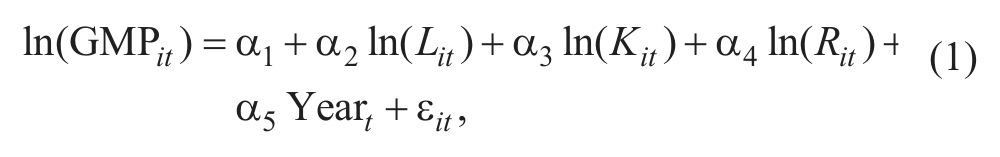
where α i = ln(Ai) and is a fixed effect for cross-section i, Year t is a variable trend variable that reflects technological and other unobserved factors that change over time, and ϵ it is an error term.
Data and Descriptive Analysis
Particularly during the economic downturns, state and metropolitan policymakers seek help from the federal government to allay the effects of the downturn on metropolitan growth and development. Obama’s 2009 ARRA stimulus package served this purpose. Although the primary target of the 2009 ARRA was employment growth, seeking to offset the significant employment losses that occurred during the recession, the 2009 ARRA served the dual purpose of infrastructure investment. The act directed substantial resources to “shovel ready” transport infrastructure projects. “Shovel ready” projects highlight the expected immediate employment effects, and infrastructure projects highlight a major role that governments at all levels have in building and maintaining the nation’s transport infrastructure.
This study analyzes the relationship between runway capacity at a commercial airport in a metropolitan statistical area (MSA) and various economic indicators. These results provide guidance to policymakers on the impacts that additional runway capacity will have on metropolitan growth and development. If the airport is suffering from congestion effects, such as increasing delays or the inability to increase volume through additional flights given the length of their runways, business opportunities may be missed. By increasing the number of runways, firms within the MSA can exploit those otherwise lost opportunities and increase real GMP.
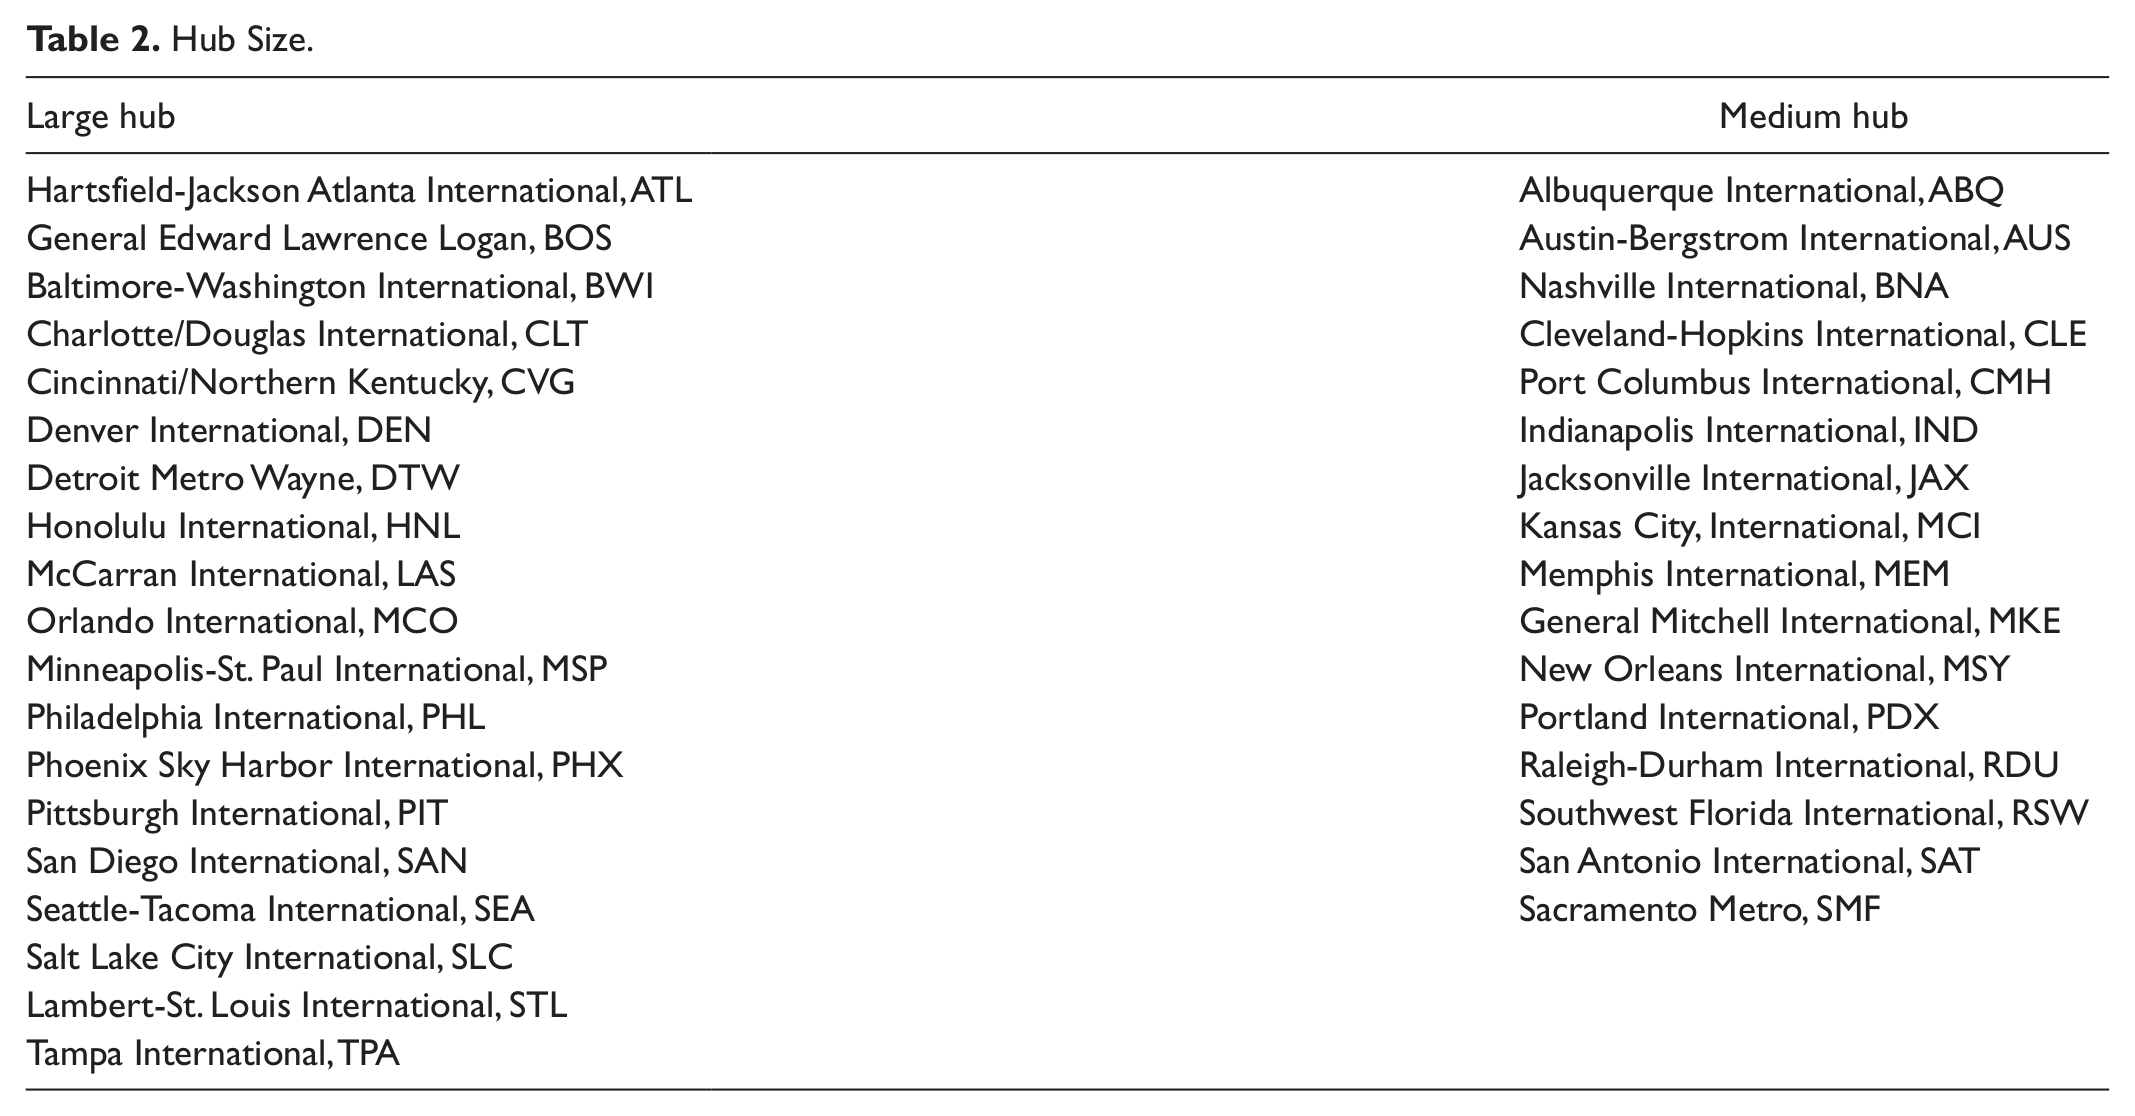
Data for this study are a panel of 35 MSAs, each of which has only one commercial airport that the FAA identifies as a large hub (an airport with 1% or more of U.S. enplanements) or medium hub (an airport with less than 1%, but more than 0.25% of U.S. enplanements). Since isolating the effects of an airport’s operations and infrastructure on economic development is more difficult when a MSA supports multiple airports, this analysis includes only MSAs with a single commercial airport.
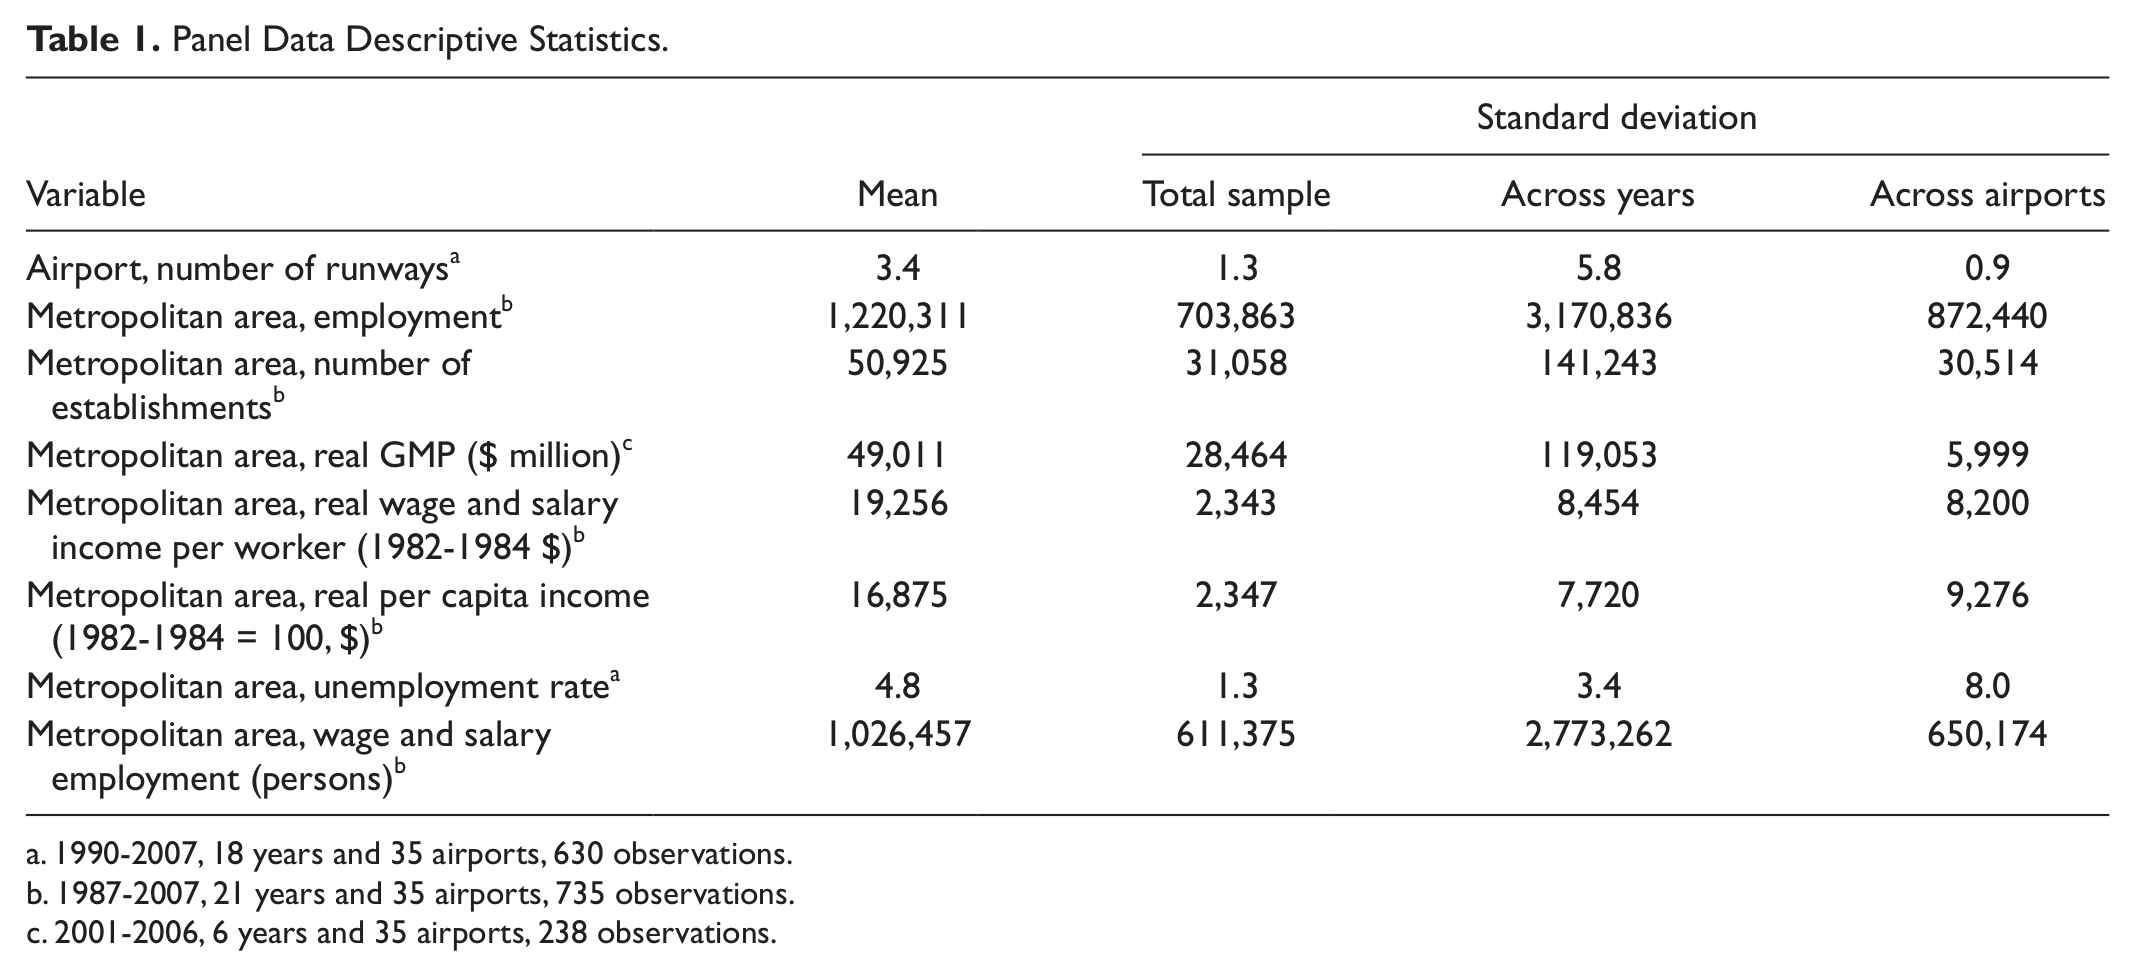
For the panel of 35 MSAs and corresponding airports, Table 1 provides airport and metropolitan descriptive statistics for three groups, the Full Sample group, the Over Airports group (summing across years), and the Over Years group (summing across airport cross-sections). As seen in Table 1, depending on the series, the availability of some variables ranges from 21 years to 18 years to 6 years. Entries in the table that list the current year give information as of 2007 (e.g., airport land area).
Panel Data Descriptive Statistics.
1990-2007, 18 years and 35 airports, 630 observations.
1987-2007, 21 years and 35 airports, 735 observations.
2001-2006, 6 years and 35 airports, 238 observations.
For each group in Table 1, the variables’ means are the same, but the variances differ. There are an average of 105,000 domestic annual departures and 4,182 annual international departures. An average of 8.2 million passengers flew on nonstop, unlinked segments per airport per year and airlines carried, on average, 127 million pounds of freight per year. In 2009, an average airport covered more than 5,500 acres and had 3.4 runways per airport. The FAA classified 19 airports as large hubs and 16 as medium-sized hubs.
The full panel of 35 MSAs during the 18- to 21-year period averaged a population of just more than 2 million persons with 1.22 million workers, of which 1.03 million are wage and salary workers. The average annual real-wage and salary disbursement per worker is $19,256 and annual average real per capita income is $16,875. The average unemployment rate over all MSAs and observed years is 4.8%, and there are just fewer than 51,000 annual establishments on average.
Starting in 2001, the Bureau of Economic Analysis reported GMP. From Table 1 for the period 2001-2007, annual real GMP averaged $49.0 billion, which reflects an average real annual per capita GMP of $41,995. On average, for the sample period, annual GMP represents 40% of GSP.
Observations by subgroups display greater heterogeneity between the cross-section units than when measuring across time, as is often the case with panel data. Generally, the standard deviation for all variables is greater, and at times considerably greater, across airports and MSAs than across years.
The two primary exceptions to this pattern of variance between time and cross-sectional units are real per capita income and the unemployment rate. This deviation from the pattern is expected since dividing income by population adjusts for size differences across MSAs. As a result, real per capita income across MSAs is less heterogeneous than across time, with an observed standard deviation of $9,276 versus $7,720. And, because economic cycles tend to affect all geographic areas to a similar degree, unemployment rates exhibit less heterogeneity across MSAs than across time, with an observed standard deviation of 8% over time versus 3.4% over MSAs.
Table 2 identifies the sampled airports in the MSA analysis and the airport’s hub status. There are 19 large hub airports and 16 medium hub airports in the panel data set.
Hub Size.
Empirical Considerations
This analysis includes four variables to capture the effects of airport public capital. First, to explore the relationship between changes in the number of runways and economic development is of primary interest, so we use the total number of runways at an airport. It is expected that adding an additional runway increases real GMP, all else constant. Second, we include maximum runway length. The longer the runway, the larger the plane a runway can accommodate and this enables the airport to serve more passengers and ship more freight, all else constant. Third, the marginal effect of an additional runway, all else constant, is expected to be less than the longer the existing runways, since longer runways can accommodate a larger aircraft. To capture this effect, we include a cross-product term between the number of runways and maximum runway length. A priori, the sign of this variable is expected to be negative. And fourth, systemic runway congestion reduces the quality of runways and potentially constrains the extent to which an MSA can sustain economic development.
This study captures an airport’s congestion effects directly and indirectly. To capture the direct effect, we include average flight delay in minutes. All else constant, an increase in average flight delays is expected to decrease real GMP. In addition, recognizing that various external factors, including private and other commercial airports in the MSA, may contribute to a given commercial airport’s congestion, we limit the study to include only MSAs with one commercial airport; this controls for the interacting effects that multiple commercial airports in an MSA have on each airport’s operations.
After exploring alternative measures of highway public capital, we found that freeway and arterial mileage and an index for road congestion provided good fits as a proxy for the quantity of highway infrastructure and highway infrastructure productivity, respectively. An increase in the number of freeway and arterial lane miles is expected to reduce travel time and resource costs, and increase metropolitan output. All else constant, greater congestions imply higher time costs, which hinder productivity. At the same time, there is a positive relationship between economic activity and congestion, with growing and expanding cities experiencing greater congestion. The net effect of these forces is unclear and, a priori, the sign on this variable is unknown.
The dependent variable for this analysis is GMP. The Bureau of Labor Statistics does not provide observations for the Jacksonville, Florida MSA and runway information was missing for the Charlotte/Douglas International Airport. In the analysis that follows, we omit Jacksonville (JAX) and Charlotte/Douglas (CLT) International Airports.
Metropolitan Statistical Area Estimation Results
Gross Metropolitan Product Results
Equation (2) identifies the double-log empirical specification for the base model for GMP
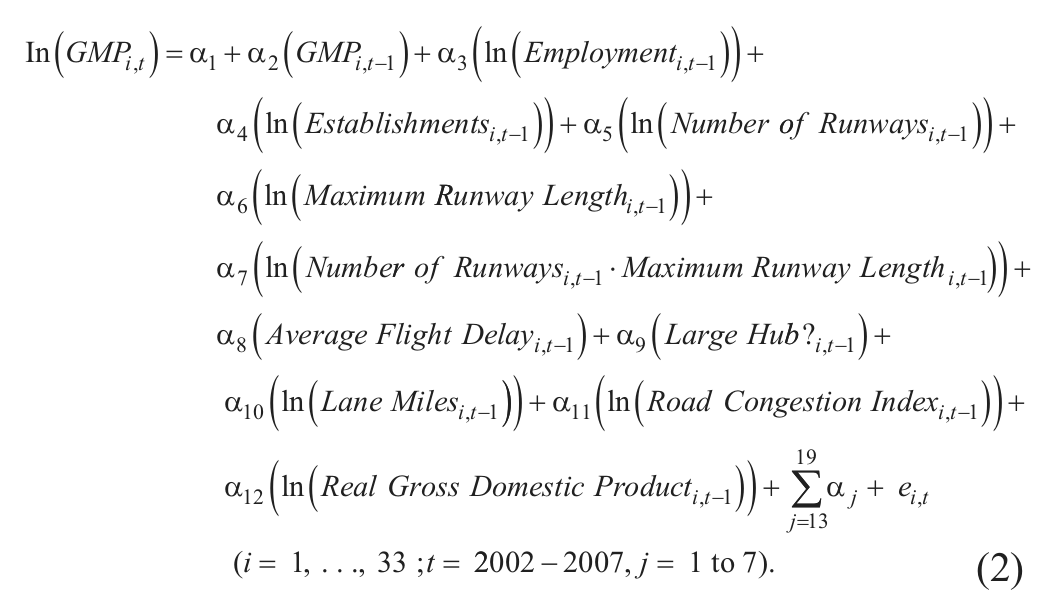
Equation (2) includes lagged gross metropolitan product, GMPt − 1 to account for serial correlation in the error terms. Exploratory analyses found that serial correlation coefficients ranged from a low of .33 to a high of .99. Theoretically, assuming that GMP only partially adjusts to changes in the explanatory variables in the given time period motivates a dynamic version of Equation (1) (Ramanathan, 1995). Lagged values for employment, establishments, the number of runways, average flight delay, and arterial streets daily miles of travel, are included as instruments to address concerns with endogeneity. We measure aggregate labor using metropolitan area employment and the number of MSA establishments is a proxy for the level of private capital. Real GDP serves as a measure of overall economic activity.
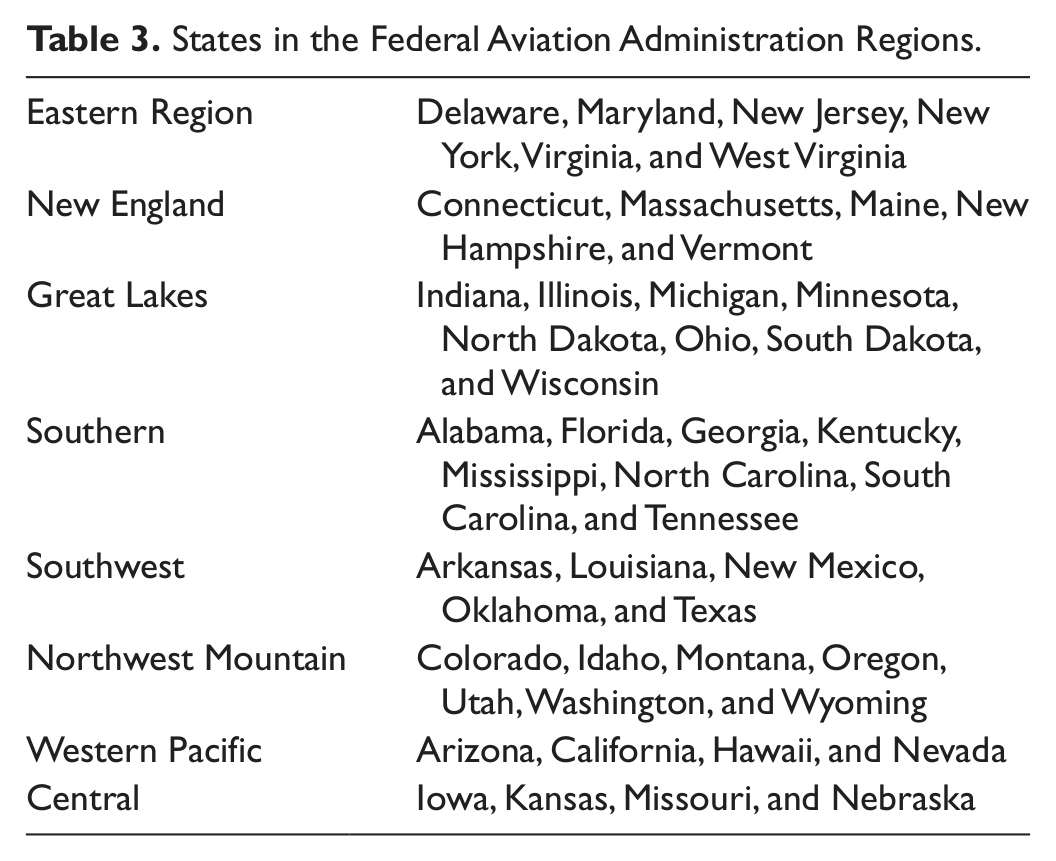
Preliminary estimations with a full set of airport fixed effects led to problems with multicollinearity. To avoid multicollinearity and account for cross-section heterogeneity across airports and MSAs from unobserved or omitted variables, the reported model included a set of FAA regional dummy variables to account. The eight FAA regions are Eastern, Great Lakes, New England, Northwest Mountain, Southern, Southwest, Western Pacific, and Central (Table 3). The reference (omitted) region is FAA’s Central region.
States in the Federal Aviation Administration Regions.
We also investigated a number of alternative specifications, including (a) the replacement of the log of the 1-year lag of the number of runways with two variables, the log of the current number of runways, and a dummy variable that indicated the presence of a runway added during the observed period (2001-2007); (b) replacing the log of the real GDP with a linear trend variable; and (c) including lagged values for up to 4 years of either the number of runways or the dummy variable for the presence of a new runway. In every case, the estimated coefficients were robust. Also, the lagged variables were not consistently significant and in the presence of the log or real GDP, did not show significance at all.
Table 4 reports the estimation results that fit the data well. The adjusted R2 is .9988 and the reported estimates were robust to alternative specifications. Standard errors for all parameter estimates are robust to departures from a constant variance assumption.
Gross Metropolitan Product (GMP) Estimation Results, 2002–2007.
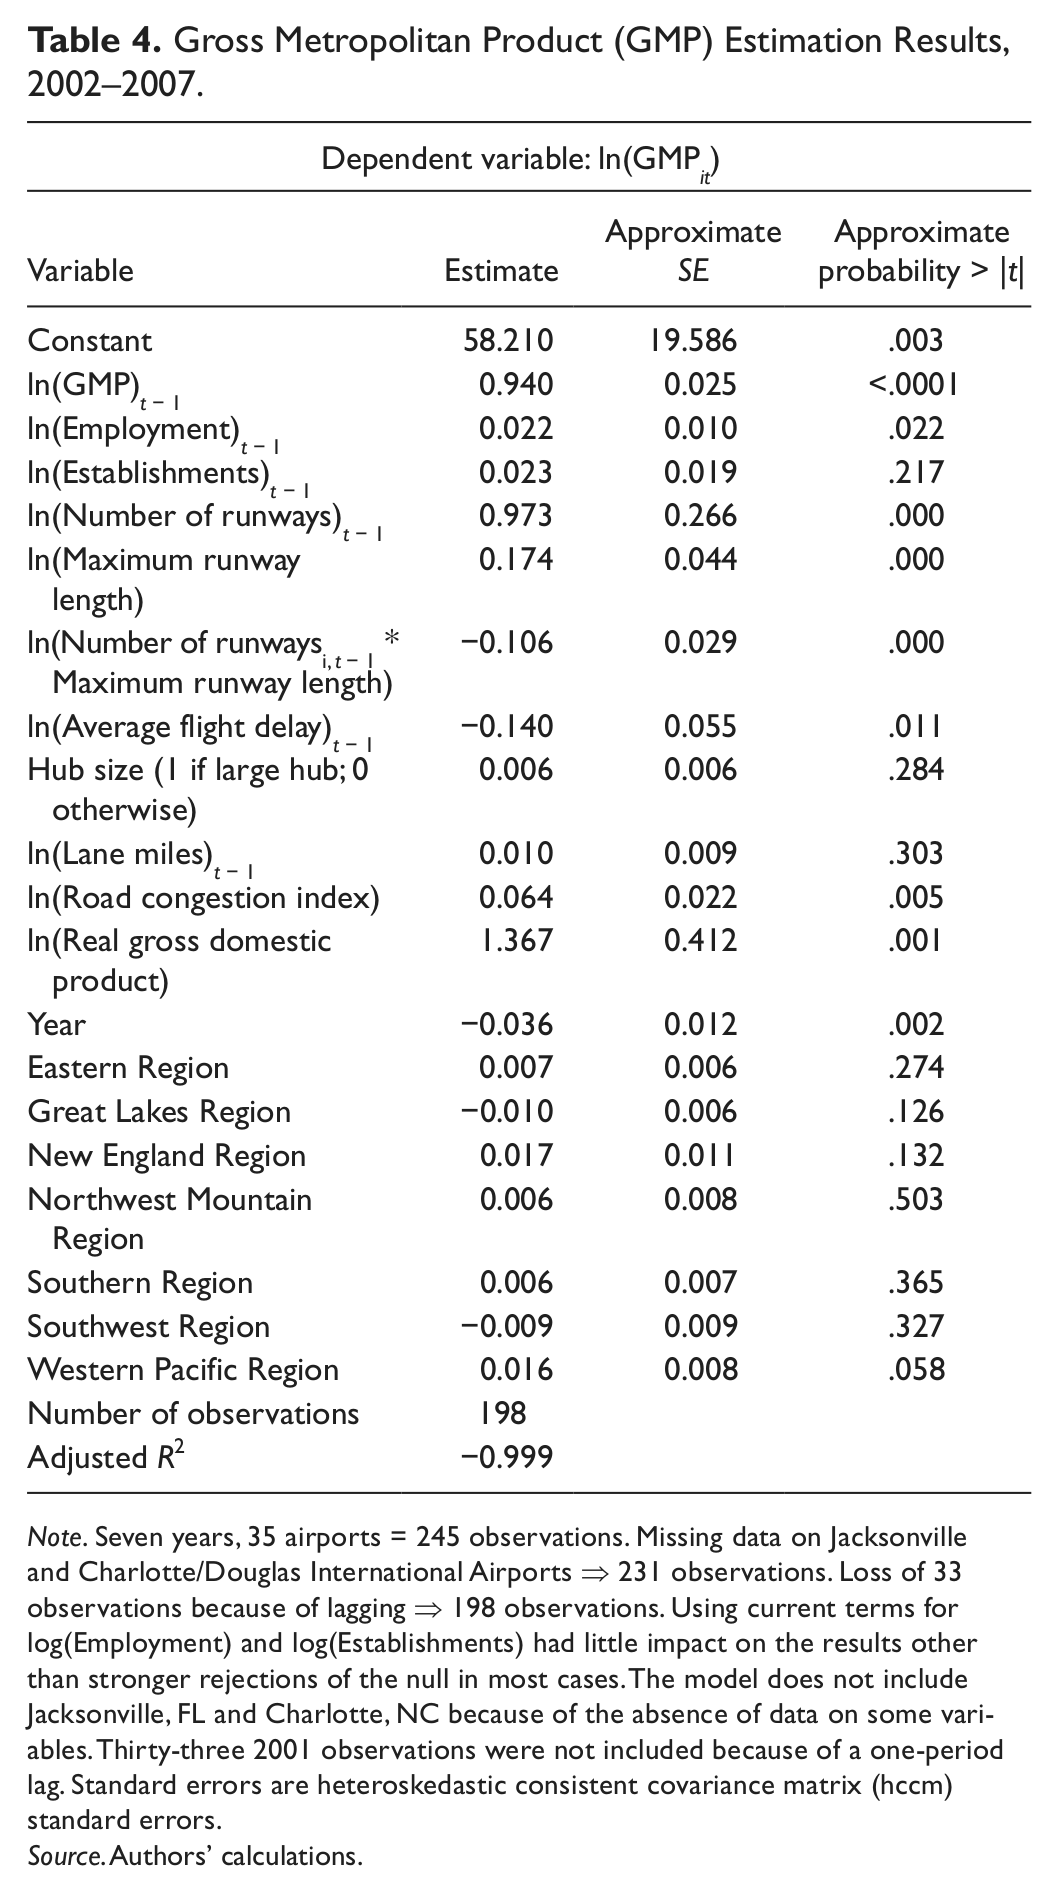
Note. Seven years, 35 airports = 245 observations. Missing data on Jacksonville and Charlotte/Douglas International Airports ⇒ 231 observations. Loss of 33 observations because of lagging ⇒ 198 observations. Using current terms for log(Employment) and log(Establishments) had little impact on the results other than stronger rejections of the null in most cases. The model does not include Jacksonville, FL and Charlotte, NC because of the absence of data on some variables. Thirty-three 2001 observations were not included because of a one-period lag. Standard errors are heteroskedastic consistent covariance matrix (hccm) standard errors.
Source. Authors’ calculations.
As expected, lagged GMP is a strong determinant of current GMP. Furthermore, increases in lagged employment increase GMP, where a 1% increase in lagged employment, all else constant, increases real GMP in the current period 0.02% or $10.9 million based on the sample average real GMP of $49.0 billion. As a proxy for private capital, Establishments has the expected positive sign and is statistically significant, where a 1% increase in the number of establishments raises real GMP 0.02% or $11.4 million on average, all else constant. Also, an increase in the economic health of the overall economy has an expected positive impact on GMP. A 1% increase in the lagged real GDP leads to a 1.37% increase in real GMP.
To explore the potential effects of endogeneity, we regressed the log of real GDP against the log of real GMP. The R2 was .09 and the p value for the estimated coefficient was .24, which suggests that endogeneity is not a serious problem between these two variables.
The variables of most interest for this analysis are the number of runways, maximum runway length, the cross-product of those two variables, and average flight delay. Adding a new runway increases real GMP. We obtained this length by resolving the equation:
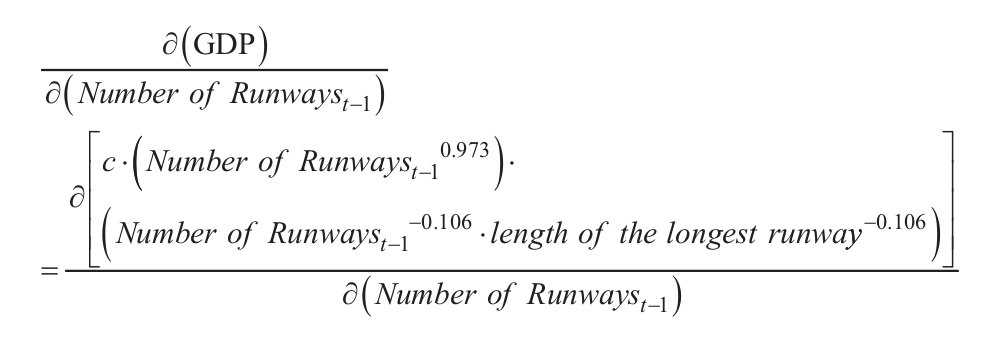
Here, c comprises all the remaining variables and their coefficients whose product is positive.
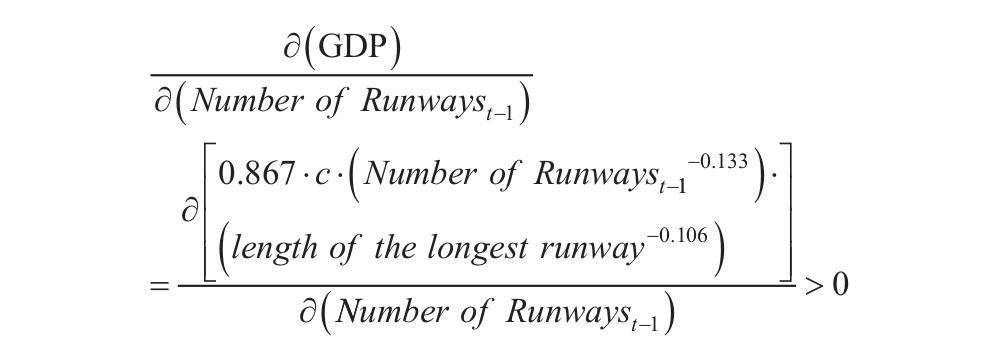
The positive but declining marginal productivity of an additional runway is significant at less than the .01 level for the number of runways and the cross-product term. Also, as expected, extending the length of runways increases real GMP, which is statistically significant at less than the .01 level for both the maximum length of the runways and the cross-product effect. As expected, the negative sign on the cross-product term indicates that, all else constant, the marginal effect of an additional runway is smaller; the larger is the maximum length of existing runways.
Consistent with expectations, average flight delay has a negative impact on economic development. All else constant, the results in Table 5 indicate that a 1% increase in average flight delays decreases annual real GMP by 0.14% or $68.5 million, on average.
Gross Metropolitan Product (GMP) Estimation Results, 2001 to 2007.
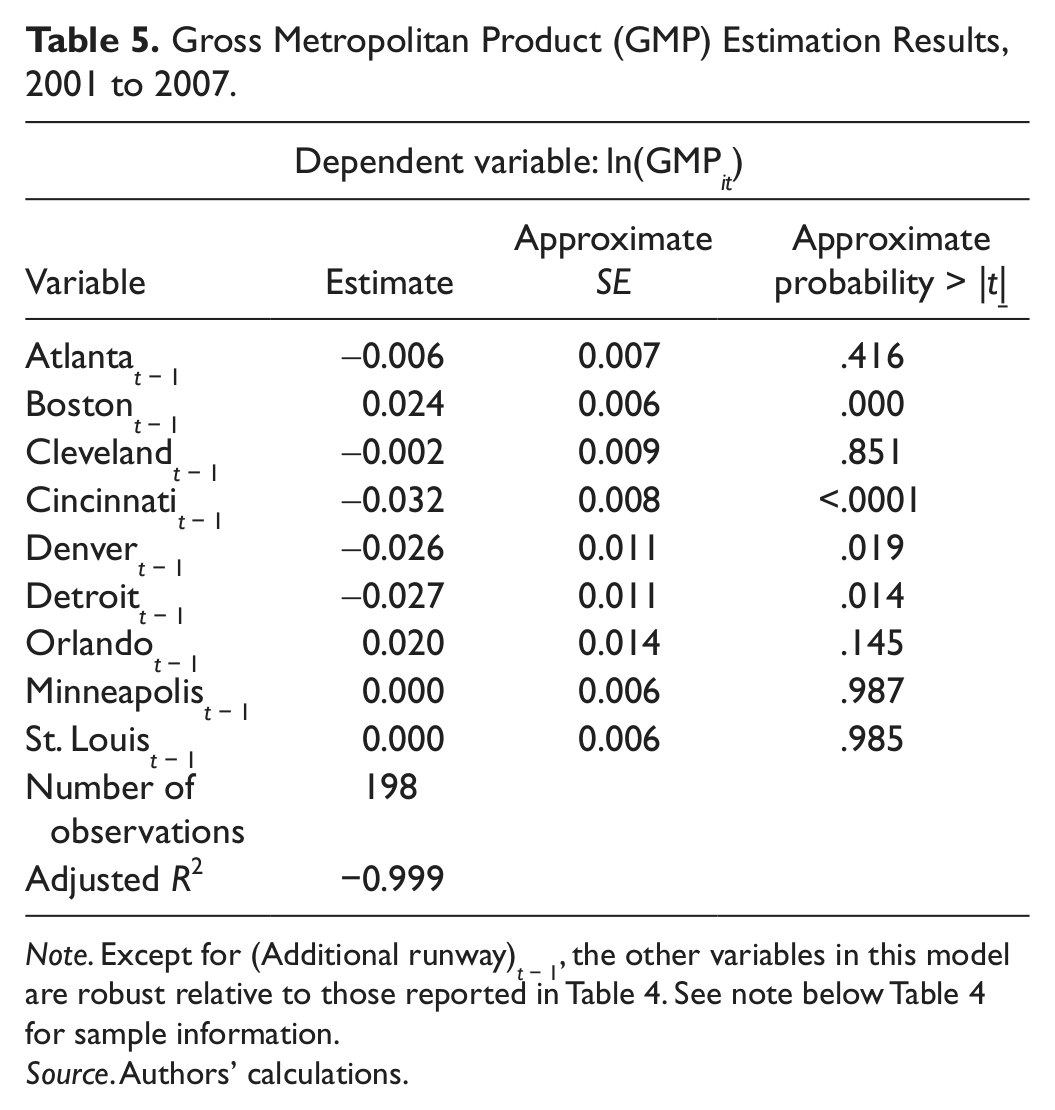
Note. Except for (Additional runway)t − 1, the other variables in this model are robust relative to those reported in Table 4. See note below Table 4 for sample information.
Source. Authors’ calculations.
As proxy for the quantity and productivity of metropolitan highway infrastructure, the road congestion index has the expected signs, and tests as statistically significant at the .01 level. The sign and statistical significance of the road congestion index indicates that the economic benefits flowing from a thriving community more than offsets one of the major externalities in metropolitan areas, highway congestion.
Further Analysis of Runway Effects
Table 5 presents estimates of the model replacing the ln(Number of Runways) variable with a set of dummy variables associated with the airports that added an additional runway. This formulation enables us to determine whether an additional runway increased GMP for all MSAs or whether there were differential effects across the MSAs. Because the results for the other variables are qualitatively similar to those reported in Table 4, we present only the airport-specific variables in Table 5.
From the results in Table 5, nine airports added runways during the 2001-2007 period and the results indicate that the effect of an additional runway was not uniform across airports. Although the average effect in Table 4 indicated that adding an additional runway increased real GMP, all else constant, the more detailed results in Table 5 indicate that the effect on real GMP was specific to the airport and varied from a significant negative effect to no effect to a significant positive effect.
Boston experienced positive and statistically significant GMP effects, amounting to a 0.024% increase in GMP from an additional runway. The additional runways added in Atlanta, Cleveland, Minneapolis, Orlando, and St. Louis, on the other hand, had neither an appreciable positive nor negative effect on GMP. In each of these cases, we could not reject the null hypothesis, at any reasonable level of significance, that the additional runway substantively affected GMP. For Cincinnati, Denver, and Detroit, however, the effect of the additional runway was negative and statistically significant and whose effect ranged between −0.032% and −0.026%. Excepting Boston, the absence of an effect or the weaker negative effect of an additional runway was not sufficient to offset the estimated positive sign reported in Table 4.
There are two salient implications from these results. First, the magnitude of the negative effects is sufficiently small that the net effect of runway capacity continues to be positive. Second, the mixed results are consistent with the notion that airport capacity is more constraining in those areas (e.g., Boston) with a strong positive effect and less constraining in those areas with a strong negative effect (e.g., Cincinnati).
Average Product of Labor Estimates
Table 6 reports the results of a dynamic metropolitan production function that included labor, a proxy for private capital, and various measures of airport public capital. In addition to determining the importance of these variables to real GMP, it is also useful to analyze whether the same variables are important determinants of a metropolitan area’s labor productivity, output per labor (defined here as the real GMP/employment). Table 7 reports the estimation results for a dynamic metropolitan labor productivity model. Overall, the data fit the model well, explaining 99.7% of the variance in the dependent variable, and the results are generally consistent with expectations.
Metropolitan Average Product of Labor (APL) Estimation Results.
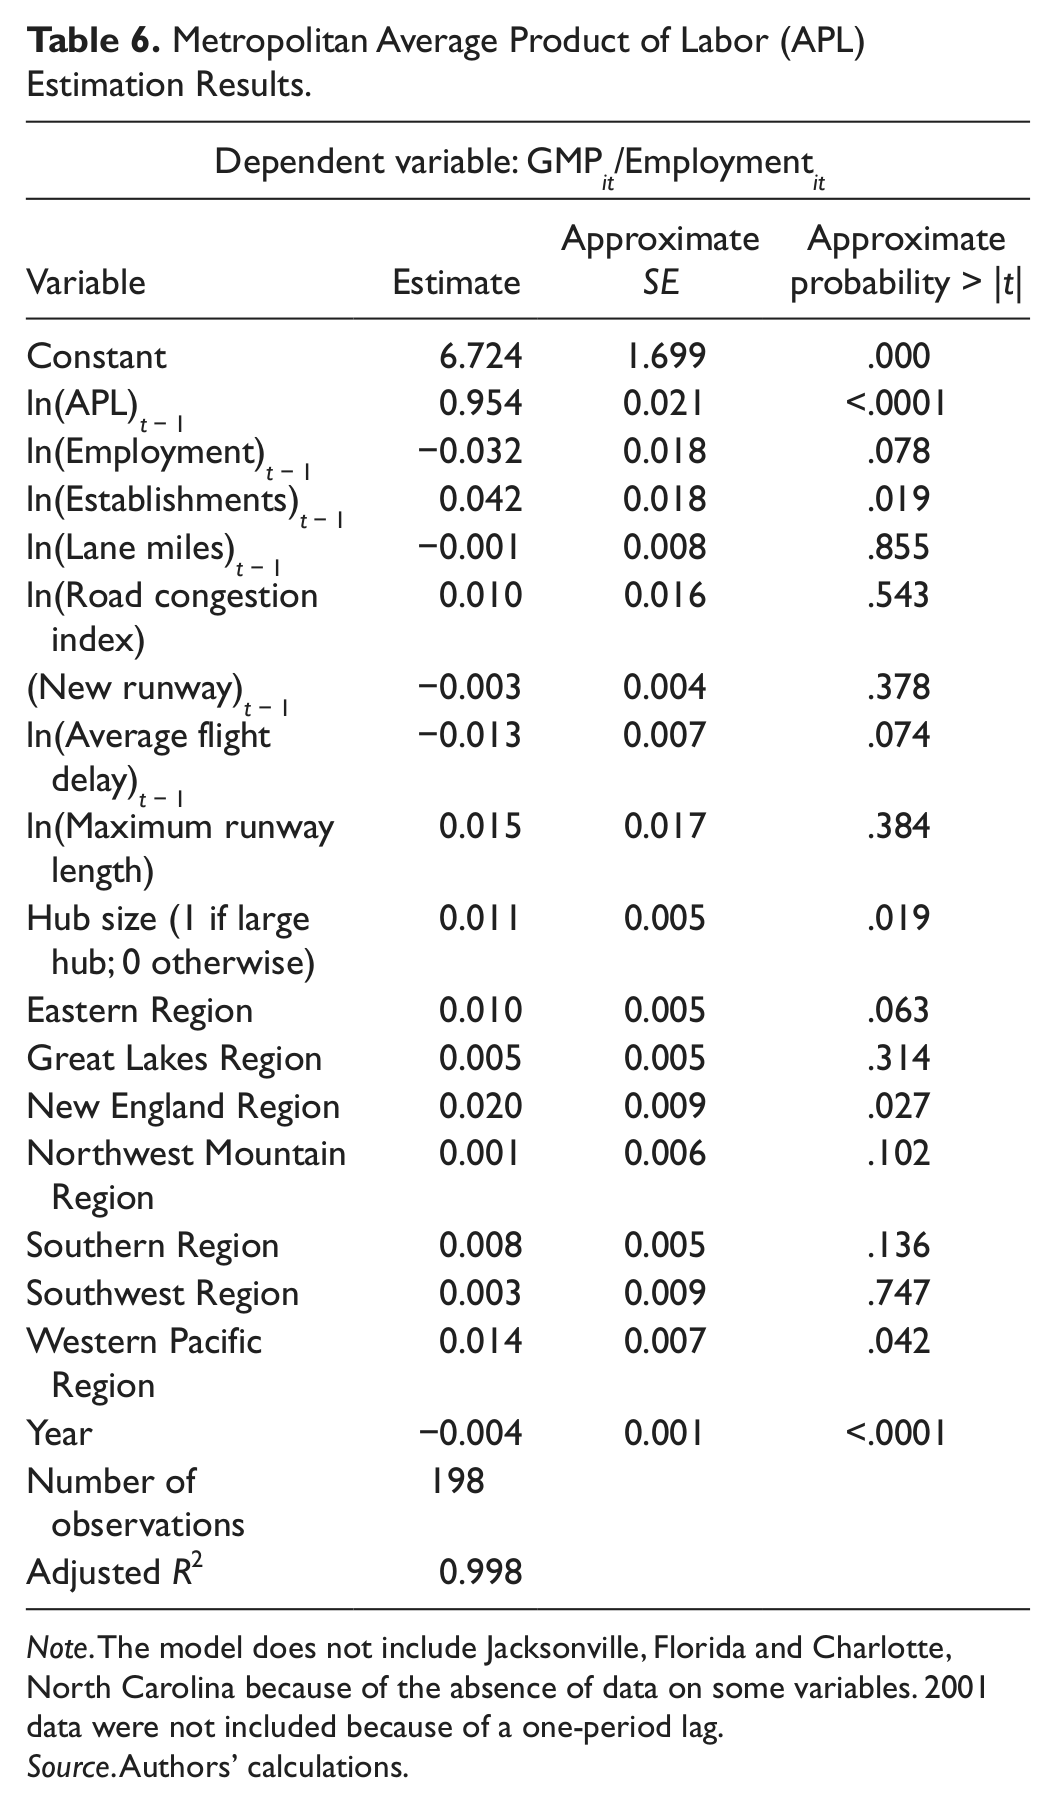
Note. The model does not include Jacksonville, Florida and Charlotte, North Carolina because of the absence of data on some variables. 2001 data were not included because of a one-period lag.
Source. Authors’ calculations.
Other Economic Development Measures, 1992 to 2007.
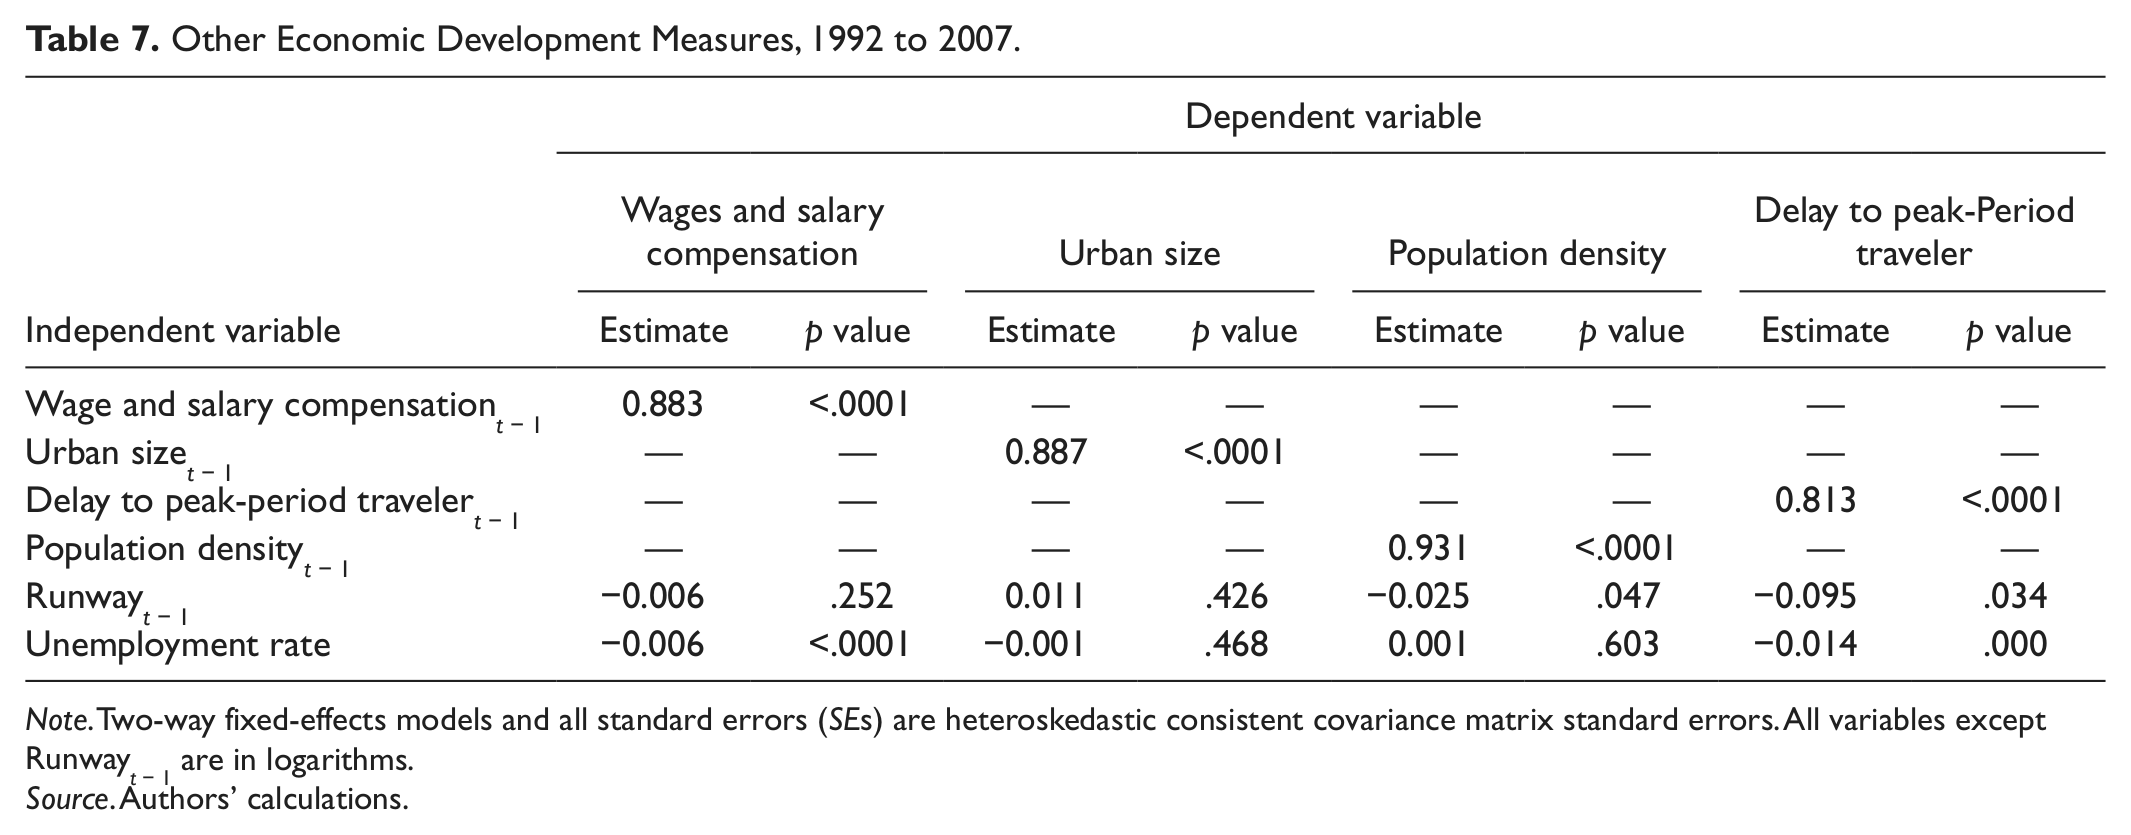
Note. Two-way fixed-effects models and all standard errors (SEs) are heteroskedastic consistent covariance matrix standard errors. All variables except Runwayt − 1 are in logarithms.
Source. Authors’ calculations.
Past labor productivity is a strong predictor of current productivity and, all else constant, increases in employment decrease labor productivity, which is consistent with profit maximizing behavior. Furthermore, to the extent that the number of establishments is a proxy for private capital, the positive and statistically significant coefficient is consistent with expectations that increases in private capital, all else constant, increases labor productivity. Lane miles and the road congestion index have no impact on labor productivity. Also, during the sample period, labor productivity in these single airport metropolitan areas decreased, on average, by 0.0035%.
Turning to the airport-related variables, the results in Table 6 indicate that neither an additional runway nor runway length has a direct effect on labor productivity; however, consistent with expectations, average flight delay significantly reduces labor productivity.
All else constant, a 1% increase in average delay reduces labor productivity by 0.013%. Given an average product of labor equal to $78,557, average delays reduce productivity by $102. To understand this result, we must distinguish large hubs from small hubs. Labor productivity in MSAs with large hubs, relative to MSAs with medium hubs, is significantly increased (0.0011% or $86). This suggests that two effects are occurring. In large hubs, reduced delays result in increased productivity. In medium hubs, increased economic activity leads to increased employment, which, all else constant, leads to a reduction in average labor productivity while total productivity increases.
These results suggest that traffic delays generate work-related coordination inefficiencies that are revealed in lower labor productivity in the metropolitan area. In time-sensitive business-related activities, for example, even small delays can compound to produce large productivity effects. Also, the stochastic nature of air traffic delays makes it difficult for firms to systemically adapt their operations to internalize the delays.
Other Economic Measures
Based on a metropolitan production function framework, the primary focus of previous sections has been on the effect that the number of runways has had on metropolitan output. There are other measures of economic development, and this section summarizes additional estimation results that explore the extent to which airport runway capacity affects alternative measures of development.
Specifically, we focus four attributes of economic development: wage and salary compensation, urban size, population density, and delay to the peak-period traveler. Panel data for this analysis include the same cross-sections as in previous analyses, but extends the sample back to 1992. Table 7 presents the two-way fixed-effects dynamic model estimation results. In addition to a lagged dependent variable, the model includes two explanatory variables, the number of the number of runways in the previous period, and the unemployment rate.The model fits the data well with all R2s more than .97. From these exploratory results, the unemployment rate does not have an impact on the spatial form of a city. We cannot reject the null hypothesis that its coefficient in the urban size and population density equations equals 0. The unemployment rate, however, does affect the economic character of a metropolitan area. The coefficient for unemployment is statistically significant in the wage and salary compensation and delay to peak-period travel equations. In each of these cases, the coefficient for unemployment is statistically significant and has the expected sign, with increasing unemployment rates decreasing wages and compensation and decreasing travel delays during peak periods.
Turning to the number of runways, Table 7 presents mixed results. Increasing the number of runways has no impact on labor compensation or on urban size; however, it does have an effect on population density and traveler delays during the peak period. All else constant, an additional runway reduces population density 0.025% and peak-period delays more than 0.09%. These results are intriguing and reinforce the notion that runway capacity has a number of direct and indirect effects on metropolitan areas that are not well understood.
Concluding Considerations
This study explored the economic impact that additional runway capacity has on a metropolitan growth and economic development. To better establish the link between economic development and runway capacity, the sample for this study included MSAs with only one medium or large hub airport. Depending on the specific analysis, the sample period was 2001-2007 or a longer period from 1992-2007.
Based on a metropolitan production function framework, a panel data analysis of 33 airports over the 7-year period of 2001-2007 found that increasing maximum runway length increased real GMP. In addition, adding a new runway corresponds to an increase in real GMP. In the cases of airports with longer runways capable of servicing larger aircraft, it is likely that those airports are better served by increasing the average size of aircraft rather than the number of aircraft they can handle without incurring delays. Average flight delays were an important determinant of economic development, decreasing GMP.
A more detailed analysis revealed that an additional runway had differential effects. A new runway increased GMP in Boston and Orlando; had no appreciable effect in Atlanta, Cleveland, Minneapolis, and St. Louis; and decreased GMP in Cincinnati, Denver, and Detroit. In an analysis of labor productivity, adding a new runway significantly increased productivity in Boston but reduced productivity in Atlanta, Cincinnati, and Denver. These results suggest that the addition of a runway may have unintended consequences whose net effect may hinder rather than spur economic development.
Many of the results in this analysis are new and suggestive of the effects that public infrastructures in the form of airports and, specifically runways, have on MSA economic development. Yet there needs to be considerably more research to better understand the linkages that exist between airport capacity and economic development. The finding that a new runway significantly increases GMP and labor productivity in some areas, significantly decreases these measures in other areas, and has no effect on yet other areas, indicates that airports and runway capacity are having diverse effects on metropolitan areas that are not at all well understood.
Footnotes
Declaration of Conflicting Interests
The authors declared no potential conflicts of interest with respect to the research, authorship, and/or publication of this article.
Funding
The authors disclosed receipt of the following financial support for the research, authorship, and/or publication of this article: The research reported here was performed under contract with the Federal Aviation Administration, Contract No. DTFAWA-09-A-80021.