
Abstract
Does business ownership reduce the wealth disparity between Black and White households? The author uses Panel Study of Income Dynamics (PSID) data on family wealth in 1999 through 2009 to examine the levels of wealth and changes in wealth of entrepreneurs and workers among Black and White families. Black entrepreneurs (self-employed) have higher wealth levels and more upward wealth mobility than do Black workers. The upward wealth mobility of Black entrepreneurs is equivalent to that of White entrepreneurs, while the wealth mobility of White entrepreneurs is greater than that of White workers. These findings are consistent with Black entrepreneurship reducing the wealth disparity between Black and White families.
Keywords
Introduction
Consider family wealth (or net worth) the sum of the family’s assets less its debts. This study links data on family wealth accumulation and the decision of individuals to start or run their own firms (i.e., engage in entrepreneurship). It is well-known that the mean and median wealth of Black families are much lower than those of White families in the United States (Altonji & Doraszelski, 2005; Altonji, Doraszelski, & Segal, 2000; Blau & Graham, 1990; Gittleman & Wolff, 2004; Oliver & Shapiro, 1990; Wolff, 1998) and at the end of the 20th century, the movement toward wealth equality was slow at best (Bradford, 2000). Racial disparities in economic status have been associated with racial differences in morbidity, mortality, crime rates, and family formation (Conley, 1999; Duncan & Brooks-Gunn, 1997; Shapiro, 2004; T. R. Williams, 2004). This lack of parity has been described as an endemic problem in the United States (Cotton, 1998). Related to the wealth disparity is the participation of ethnic minorities in entrepreneurship, particularly the relatively low rate of entrepreneurship among Blacks in the United States (e.g., Bates, 1997; Fairlie, 1999; Fairlie & Meyer, 2000; Hout & Rosen, 2000).
Numerous writers have promoted the engagement of Blacks in entrepreneurship as one of the ways to reduce the wealth disparity between Black and White Americans (e.g., Boston, 1999; Butler, 1991; Wallace, 1993). This idea goes at least as far back as the early 1900s (Harmon, Lindsay, & Woodson, 1929). This study examines the extent to which entrepreneurship among Black Americans has been associated with gains in the relative wealth of Black families in the United States. Does business ownership reduce the wealth disparity between Black and White households? I use wealth and demographic data from the nationally representative Panel Study of Income Dynamics (PSID) covering 1999 through 2009 to investigate this issue. I first identify the employment status of heads of Black and White households in the PSID, with which heads of households can be categorized into self-employed (entrepreneurs), workers, retired, and unemployed. I compare the wealth and wealth mobility of Black and White families by employment status between 1999 and 2009.
The results of this study are summarized as follows. First, both Black and White entrepreneurs hold higher fractions of wealth relative to their fraction of the population in their racial groups. But, Black entrepreneurs hold a lower fraction of Black family wealth than White entrepreneurs hold of White family wealth. The reason is the lower rate of entrepreneurship among Black families rather than a lower relative wealth advantage of Black entrepreneurs over Black workers. Most of the analyses in this article focus on wealth mobility. I trace the changes in wealth for entrepreneurs and workers over 2001-2005 and 2005-2009. The resulting transition matrices show that both Black and White continuing entrepreneurs have more upward mobility and less downward mobility in the wealth distribution than continuing workers in their respective race group; but, transition matrices do not control for variables other than work category. I use logistic regressions that control for variables such as education, age, and receipt of a gift or inheritance. I find that for the combined Black and White families and individually for Black and White families, entrepreneurs have higher upward wealth mobility than do workers, while downward wealth mobility is not found to differ between entrepreneurs and workers. The upward and downward wealth mobility of Black entrepreneurs and White entrepreneurs are not found to differ. Finally, the regressions show that Black workers have less upward mobility and more downward wealth mobility than do White workers. These results are similar to those in Bradford (2003), who analyzed wealth transitions of Black and White entrepreneurs from 1984 to 1994, although more extensive models are used in this study. If new Black entrepreneurs achieve the same performance in relative wealth mobility as achieved by Black entrepreneurs in 1999-2009, then increasing the rate of Black entrepreneurship will reduce the wealth disparity between Black and White families.
The remainder of this article is organized as follows. The next section discusses background on wealth and entrepreneurship. This is followed by statistical analyses on wealth holdings and wealth transitions of entrepreneurs in comparison with workers. The final section makes observations and discusses public and private policy implications of the study.
Background
Public Policy, Entrepreneurship, and the Economic Status of Black Americans
A major role of government is to maximize the economic well-being of its citizens. United States federal government expenditures include support for the creation and operation of business firms. In particular, the Small Business Administration (SBA) focuses on the creation and growth of new businesses, but SBA expenditures—including programs designed to assist business ownership among minorities—declined relative to government expenditures in 2000-2008 (U.S. Office of Management and Budget, 2012). President Obama raised the status of the SBA Administrator to Cabinet level and increased the budget of the SBA, which indicates a greater emphasis on support for the entrepreneurial sector. Concurrently, Black businesses are an increasing proportion of the entrepreneurial sector (U.S. Minority Business Development Agency, 2012). To what extent does a greater emphasis on assistance to entrepreneurial firms result in a rise in the relative economic status of Black families? To answer this question, one must at least understand how entrepreneurship has affected relative economic status. That is the goal of this article.
Various studies have compared the earnings of the entrepreneurs with wage/salary workers (e.g., Aronson, 1991; Devine, 1994; Ferber & Waldfogel, 1998; Hamilton, 2000). Some studies have found that wage/salary earnings exceed those of the entrepreneurs in the United States, while others have found the reverse (Carter, 2011). One problem with these studies is that the entrepreneurs tend to underreport earnings to reduce tax liabilities (Kesselman, 1989; C. C. Williams, 2005). There has been little research on how underreporting varies according to the differing characteristics of the entrepreneurs. Another problem is the proper adjustment to earnings for certain benefits (e.g., health) that more wage/salary workers receive than do the entrepreneurs (Carter, 2011). Wealth accumulation is an obvious alternative to earnings. To the extent that underreported income and the net impact of benefits show up in personal assets, then wealth is better than earnings as a measure of the economic impact of entrepreneurship. Quadrini (1999, 2000) and Gentry and Hubbard (2004) show that entrepreneurs are more upwardly mobile in the wealth distribution and achieve higher wealth levels than workers. Bradford (2003) extended these analyses to consider Black and White entrepreneurs; however, his data go only through 1994. In his multivariate analyses, he did not separately compare the wealth mobility of Black entrepreneurs to that of Black workers and Black entrepreneurs to White entrepreneurs. These are important comparisons in making conclusions about relative wealth mobility. In addition, his analysis of interaction terms in logit regressions that estimate the wealth mobility of Black entrepreneurs may be misleading, based on subsequent work on correctly interpreting the coefficients of logit interaction terms (Norton, Wang, & Ai, 2004). Thus, this article modifies and extends Bradford’s analysis of the wealth mobility of Black entrepreneurs using the more recent 1999-2009 wealth data.
Black Entrepreneurship and the Black–White Wealth Gap: Hypothesis
What conditions justify the hypothesis that Black entrepreneurship reduces the Black–White wealth gap? The first condition follows from theories on the returns to entrepreneurship. According to Murphy, Shleifer, and Vishny (1991), a country’s most talented people typically organize production by others, so they can spread the ability advantage over a larger scale. When they start firms, they innovate and foster growth, undertaking opportunities that exhibit increasing returns to ability because increasing returns allow “superstars” to earn extraordinary returns on their talent (Rosen, 1981). Entrepreneurship is a major path by which these higher returns can be realized. Entrepreneurs bring new and better products to markets, restore allocative efficiency through arbitrage, and reinvest their profits. Similarly, Lucas (1978) portrays entrepreneurial ability as a seemingly innate trait: Some have what it takes to be an entrepreneur and some do not. Assuming individuals to be wealth maximizers, various theories attempt to predict and explain economic incomes derived from entrepreneurship. Matching and learning models (Carruth, Collier, & Dickerson, 2004; Jovanovic, 1982) suggest that individuals have often unobserved, sector-specific skills and select sectors that offer relative advantage. Human capital investment models also typically predict entrepreneurial earnings to be higher (Hartog, Van Praag, &Van Der Sluis, 2010; Lazear, 2005). Second, entrepreneurial households have a greater incentive than employee households to save to reduce the need for costly external finance (Gentry & Hubbard, 2004; Parker, Belghitar, & Barmby, 2005; Quadrini, 1999). A third condition specific to Black entrepreneurs is the decline in barriers to Black entrepreneurship from the effects of discrimination in the labor and capital markets (e.g., Bates, 1997; Boston, 1999; Butler, 1991; Wallace, 1993). The restrictions and impediments to potential business talent have inhibited the potential of Black entrepreneurship. Related to increases in educational attainment is the expansion of opportunities into areas that minorities were formally or informally restricted in entry (Bates, 1997). For example, the number of African Americans earning bachelor’s degrees in business increased by 316.6% between 1976 and 2008, whereas the number of African Americans earning MBAs increased by 1,399%, from 1,549 to 23,220 (Bradford, 2012). These changes have allowed more properly educated and talented Black entrepreneurs to enter and successfully compete in mainstream business markets (Bates, 1997, 2006).
In contrast, Hamilton (2000) cites the well-known concept (e.g., Demsetz, 1983) that entrepreneurs may trade lower earnings for the nonpecuniary benefits of business ownership. Entrepreneurship offers greater freedom and control in the workplace and workers may choose self-employment despite self-employment earnings below their paid employment alternative. Here, the earnings and wealth of entrepreneurs may not be higher than those of workers. In addition, an alternative view of human capital investment theory predicts higher incomes for workers (Astebro & Thompson, 2011). Rather than entrepreneurs with generalist skills having higher incomes, Astebro and Thompson (2011) predict lower incomes for entrepreneurs accruing from their more varied skills and work experience. Another aspect found to be negatively associated with postentry earnings is the degree of overoptimism among entrepreneurs (Cassar, 2010; Cooper, Woo, & Dunkelberg, 1988; Dawson, De Meza, Henley, & Reza Arabsheibani, 2012). To the extent that Black entrepreneurs are systematically overly optimistic about their talents, then business entry will not have the positive effects on wealth that they were expecting. In conclusion, the returns to innovation, higher savings rates, and increased access to business entry in mainstream markets by talented Black entrepreneurs justify a hypothesis of entrepreneurship reducing the Black–White wealth gap. The tradeoff of employment earnings for the nonpecuniary benefits of entrepreneurship, lower gains to human capital to entrepreneurs than workers, and systematic overoptimism among Black entrepreneurs can lead to the alternate hypothesis of entrepreneurship not reducing the Black–White wealth gap.
Empirical Results on Employment Status and Wealth
Wealth Accumulation and Employment Status for Black and White Families
In this research, longitudinal data from the nationally representative PSID are used to observe and follow changes in the wealth of families over time. The appendix discusses in detail the components of family wealth in the PSID data. With regard to the measures of entrepreneurship, there is no consensus on the definition of entrepreneurship (Gartner, 1988; Gartner & Shane, 1995; Luger & Koo, 2005). According to Schumpeter (1947), the entrepreneur is responsible for “the doing of new things or the doing of things that are already being done in a new way” (p. 151). In the business literature, a popular view of the entrepreneur is someone who “perceives an opportunity, and creates an organization to pursue it” (Bygrave & Hofer, 1991, p. 14). Self-employment is the most widely used proxy for entrepreneurship (Blanchflower & Oswald, 1998; Glaeser, 2007), particularly for economic development research (Iversen, Jorgensen, & Malchow-Moeller, 2008). Also, see Hamilton (2000) for an influential example and Van der Sluis, Van Praag, and Vijverberg (2008) for a recent survey. In the PSID survey, the head of household was asked, “Do you work for someone else, yourself, or what?” Those who answered as working for themselves (in any form of business) were then asked, “Is that an unincorporated business or a corporation?” I use the broad definition of entrepreneurship in that I include all who answer yes to the first question, regardless of the answer to the second question. This provides flexibility to the form of organization in which the self-employment occurs. This measure satisfies the basic characteristic of entrepreneurs: owner-management and risk bearing (Henderson, Low, & Weiler, 2007). Furthermore, self-employment distinctly captures movement out of the formal wage and salary job market into entrepreneurship, the two being exclusive of each other.
Table 1 shows the means and medians of family wealth in 1999, 2003, 2007, and 2009. Figures are in 2009 dollars. The wealth statistics are weighted cross-section snapshots of the families’ assets less liabilities. Table 1 includes wealth statistics of families categorized by the employment status of the head of household at the time of the survey: entrepreneurs (self-employed), workers, retired, and unemployed. The appendix discusses how the employment status is specified for each family. For each year, the mean, median, and standard deviation of family wealth of the entire group (for Black and White families separately) and the mean, median, and standard deviation of the families categorized by employment status of the head of household are included. Also in Table 1 are the subgroup to group wealth ratios for mean and medians, and the Black/White wealth ratio of the entire group and each employment subgroup. Levels of statistical significance are included for tests between groups of families as specified.
Family Wealth, White and Black Families, by Employment Status (2009 Dollars).
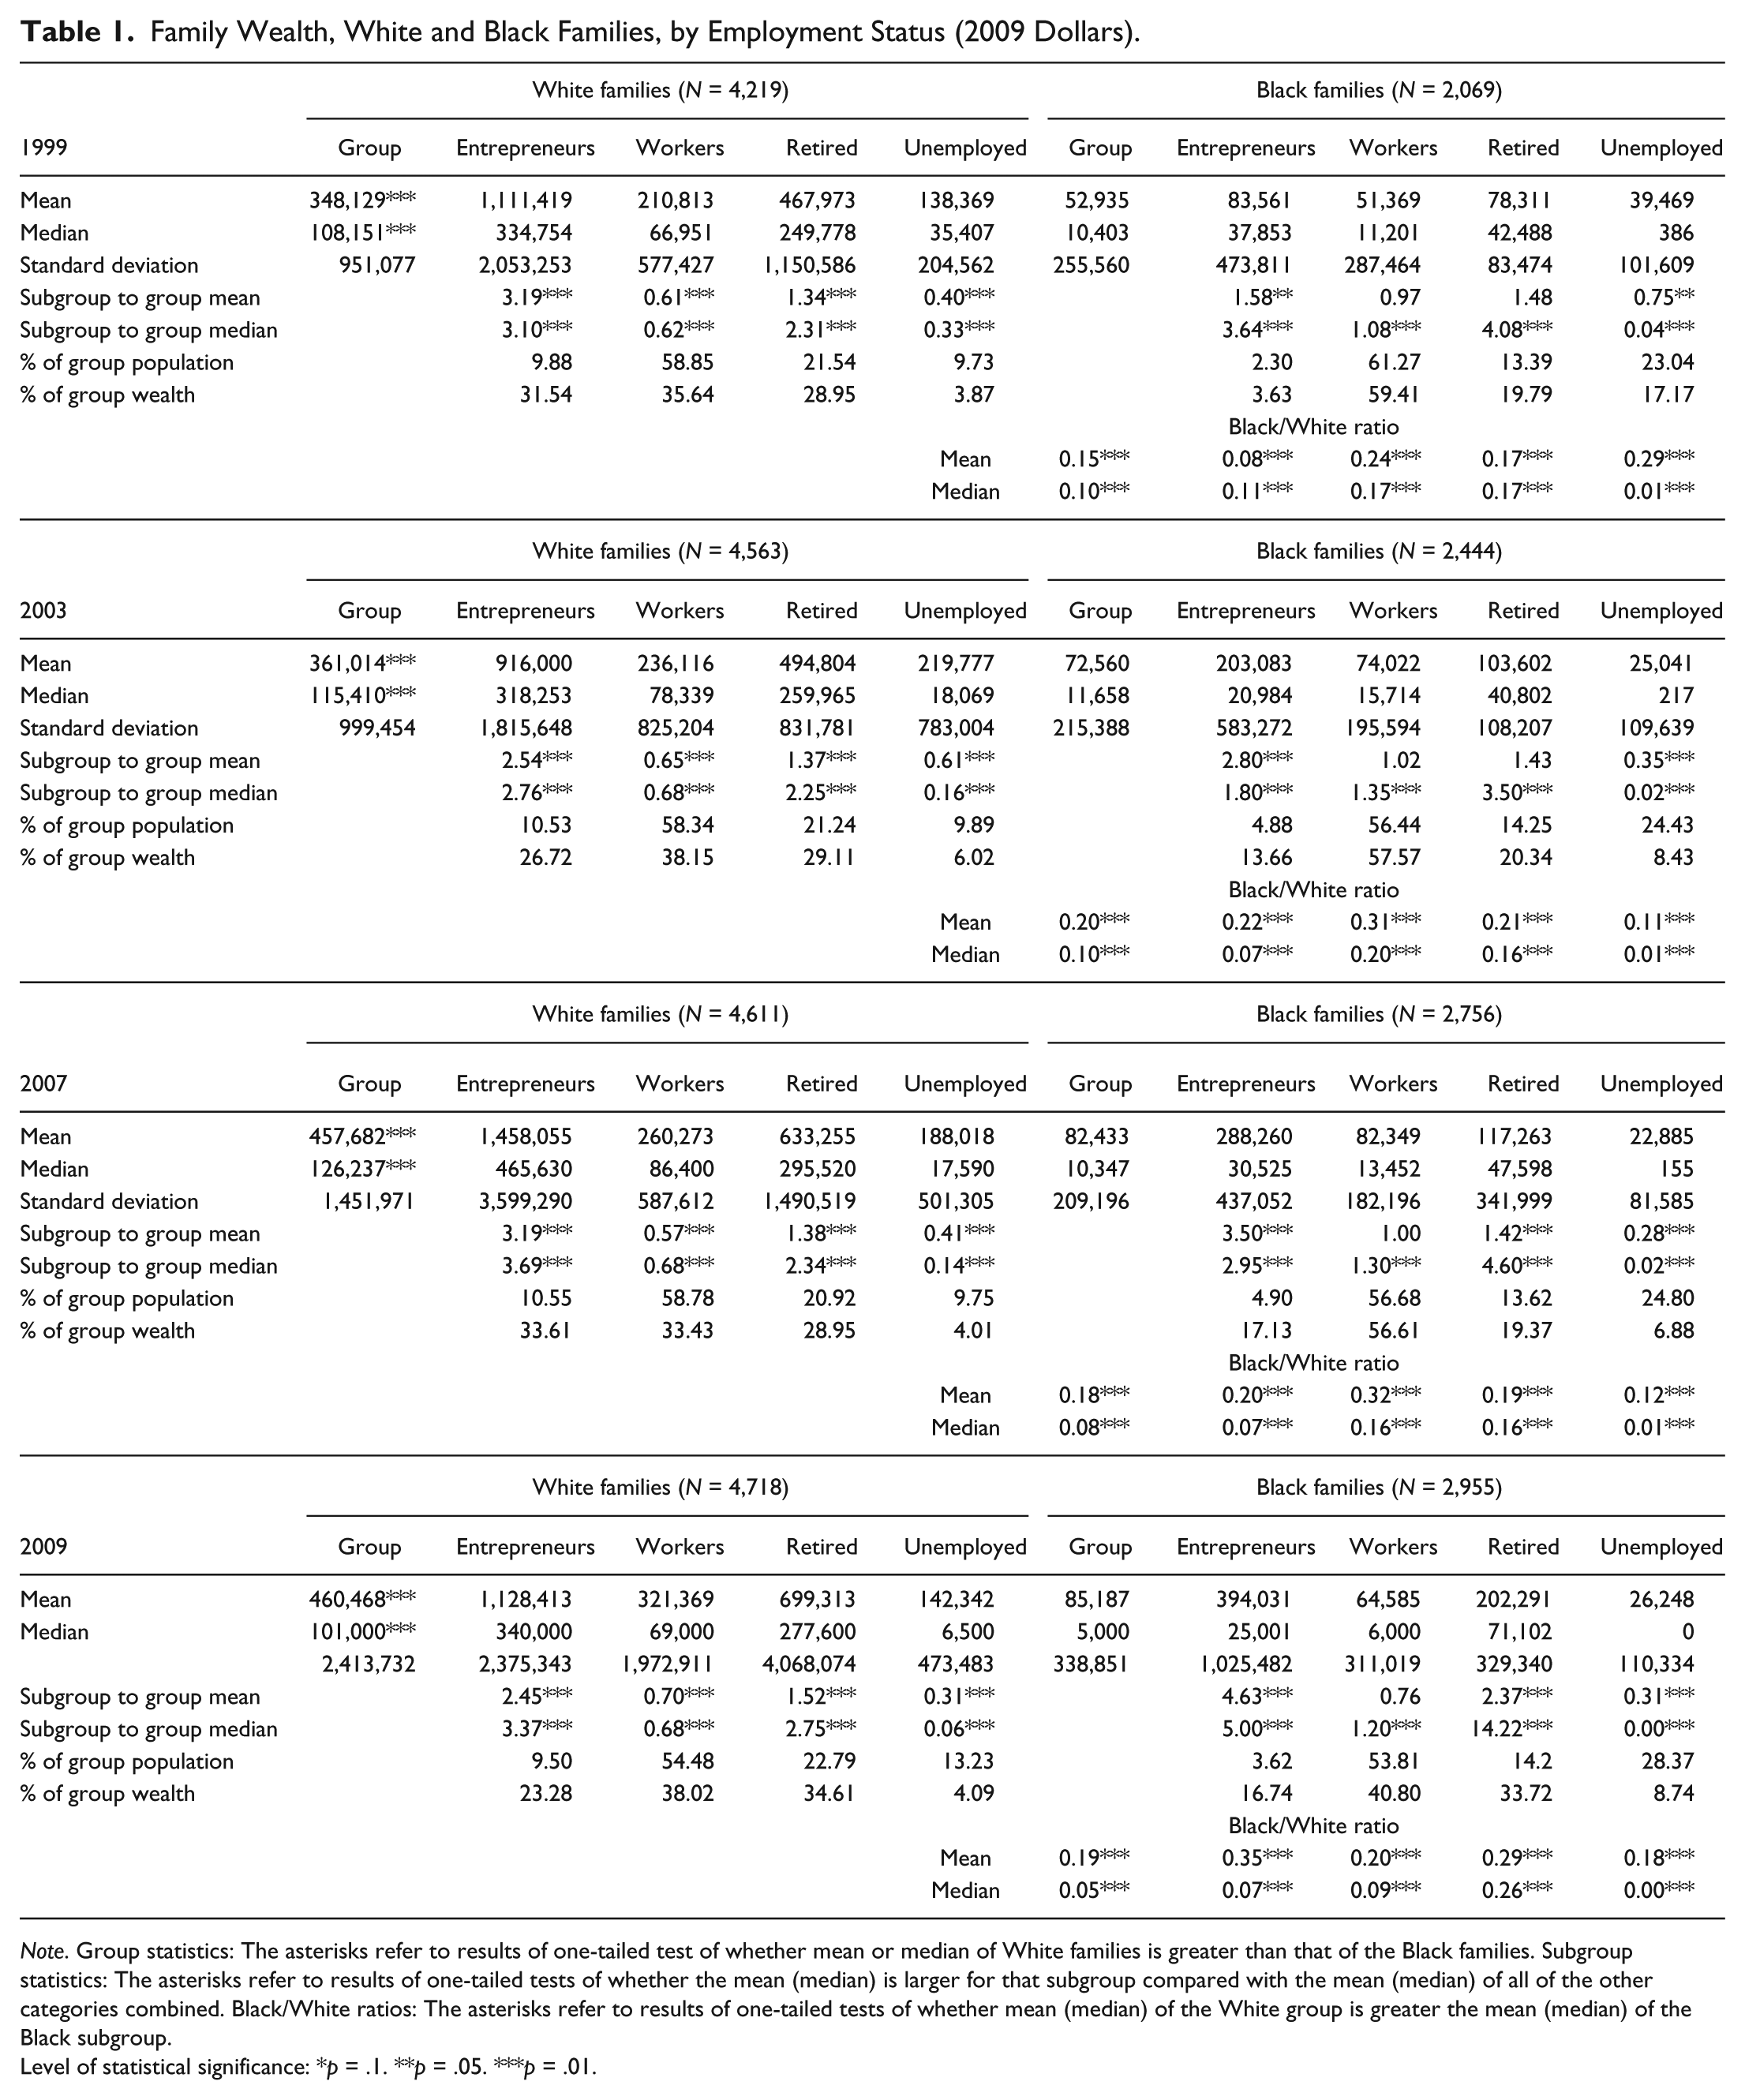
Note. Group statistics: The asterisks refer to results of one-tailed test of whether mean or median of White families is greater than that of the Black families. Subgroup statistics: The asterisks refer to results of one-tailed tests of whether the mean (median) is larger for that subgroup compared with the mean (median) of all of the other categories combined. Black/White ratios: The asterisks refer to results of one-tailed tests of whether mean (median) of the White group is greater the mean (median) of the Black subgroup.
Level of statistical significance: *p = .1. **p = .05. ***p = .01.
First, with regard to the wealth levels of entrepreneurs compared with the other employment categories, the mean family wealth of both the Black and White entrepreneurs is larger than any of the other employment categories in their racial groups in each year observed. Indeed, the mean and median wealth of Black and White entrepreneurs are at least 50% higher than the overall mean of their racial groups. For both Black and White families, the ranking in mean wealth by employment status from highest to lowest is entrepreneurs, retired, workers, and unemployed. With regard to median family wealth, this same ranking occurs for White families. For Black families, families with retired heads of household have higher median family wealth than do families with entrepreneur heads of household.
Second, in comparing the mean and median wealth of Black entrepreneurs with those of White entrepreneurs, these measures are higher for White entrepreneurs in each year observed. For example, the Black/White ratios for the mean and median wealth of entrepreneurs are 0.35 and 0.07, respectively, in 2009. For entrepreneurs, the Black/White ratio for the mean family wealth has been increasing, whereas the Black/White ratio for the median family wealth has been stable but lower in 2009 (0.07) than in 1999 (0.11). Thus, the direction of changes in these measures is mixed. Third, comparing entrepreneurs with workers, the Black/White wealth ratios for entrepreneurs are typically lower than those for workers. The wealth holdings of Black workers relative to their White counterparts are higher than Black entrepreneurs compared with their White counterparts. Fourth, entrepreneurs are a lower fraction of the Black families than of White families. In 2009, for example, the Black entrepreneurs were 3.6% of Black families compared with 9.8% for White families. This reflects the lower rate of business ownership among Black families observed and analyzed in previous studies (e.g., Bates, 2011). Fifth, the Black entrepreneurs hold a lower percentage of total Black family wealth than the White entrepreneurs hold of total White family wealth. While Black entrepreneurs hold 16.7% of Black family wealth, White entrepreneurs hold 23.3% of White family wealth. In 2009, the lower ratio of wealth for Black entrepreneurs results primarily from the lower percentage of Black entrepreneurs among Black families. That is, in 2009 both the mean and median subgroup to group ratios for Black entrepreneurs (4.6 and 5.0, respectively) are higher than those of White entrepreneurs (2.5 and 3.4, respectively).
Wealth Mobility and Employment Status
Transition Matrices
The focus of this section is whether entrepreneurs achieve more favorable wealth mobility than workers. The theoretical influences leading to higher or lower wealth changes for entrepreneurs compared with those for workers are discussed above.. Conceptually, in seeking the best outcome, a person will stay a worker or entrepreneur, or subject to barriers, switch to the other status. The empirical outcomes of these choices are examined by using the PSID data to follow the employment status and changes in wealth of entrepreneurs and workers over the 2001-2005 and 2005-2009 periods. 1
The PSID wealth data come from a long-term panel survey with annual reinterview rates in the range of 97% to 98%. Thus, wealth changes for individual families can be directly examined over an extended period. Two analyses are conducted. First, I derive transition matrices, as does Quadrini (1999), except that I separate entrepreneurs and workers into the Black and White categories. Second, I proceed in a more theoretically sound manner than Quadrini by using logistic regressions to observe the wealth transitions of entrepreneurs and workers while controlling for other variables that effect changes in wealth.
Table 2 reports the wealth transition matrices of four subgroups of both the Black and White entrepreneurs and workers. “Entrepreneurs staying” (“workers staying”) started and ended the 4-year period as entrepreneurs (workers); “entrepreneurs to workers” (“workers to entrepreneurs”) moved from worker (entrepreneur) to entrepreneur (worker) over the period.
Four-Year Transition Matrices for Changes in Family Wealth Position Combined Results for 2001-2005 and 2005-2009.
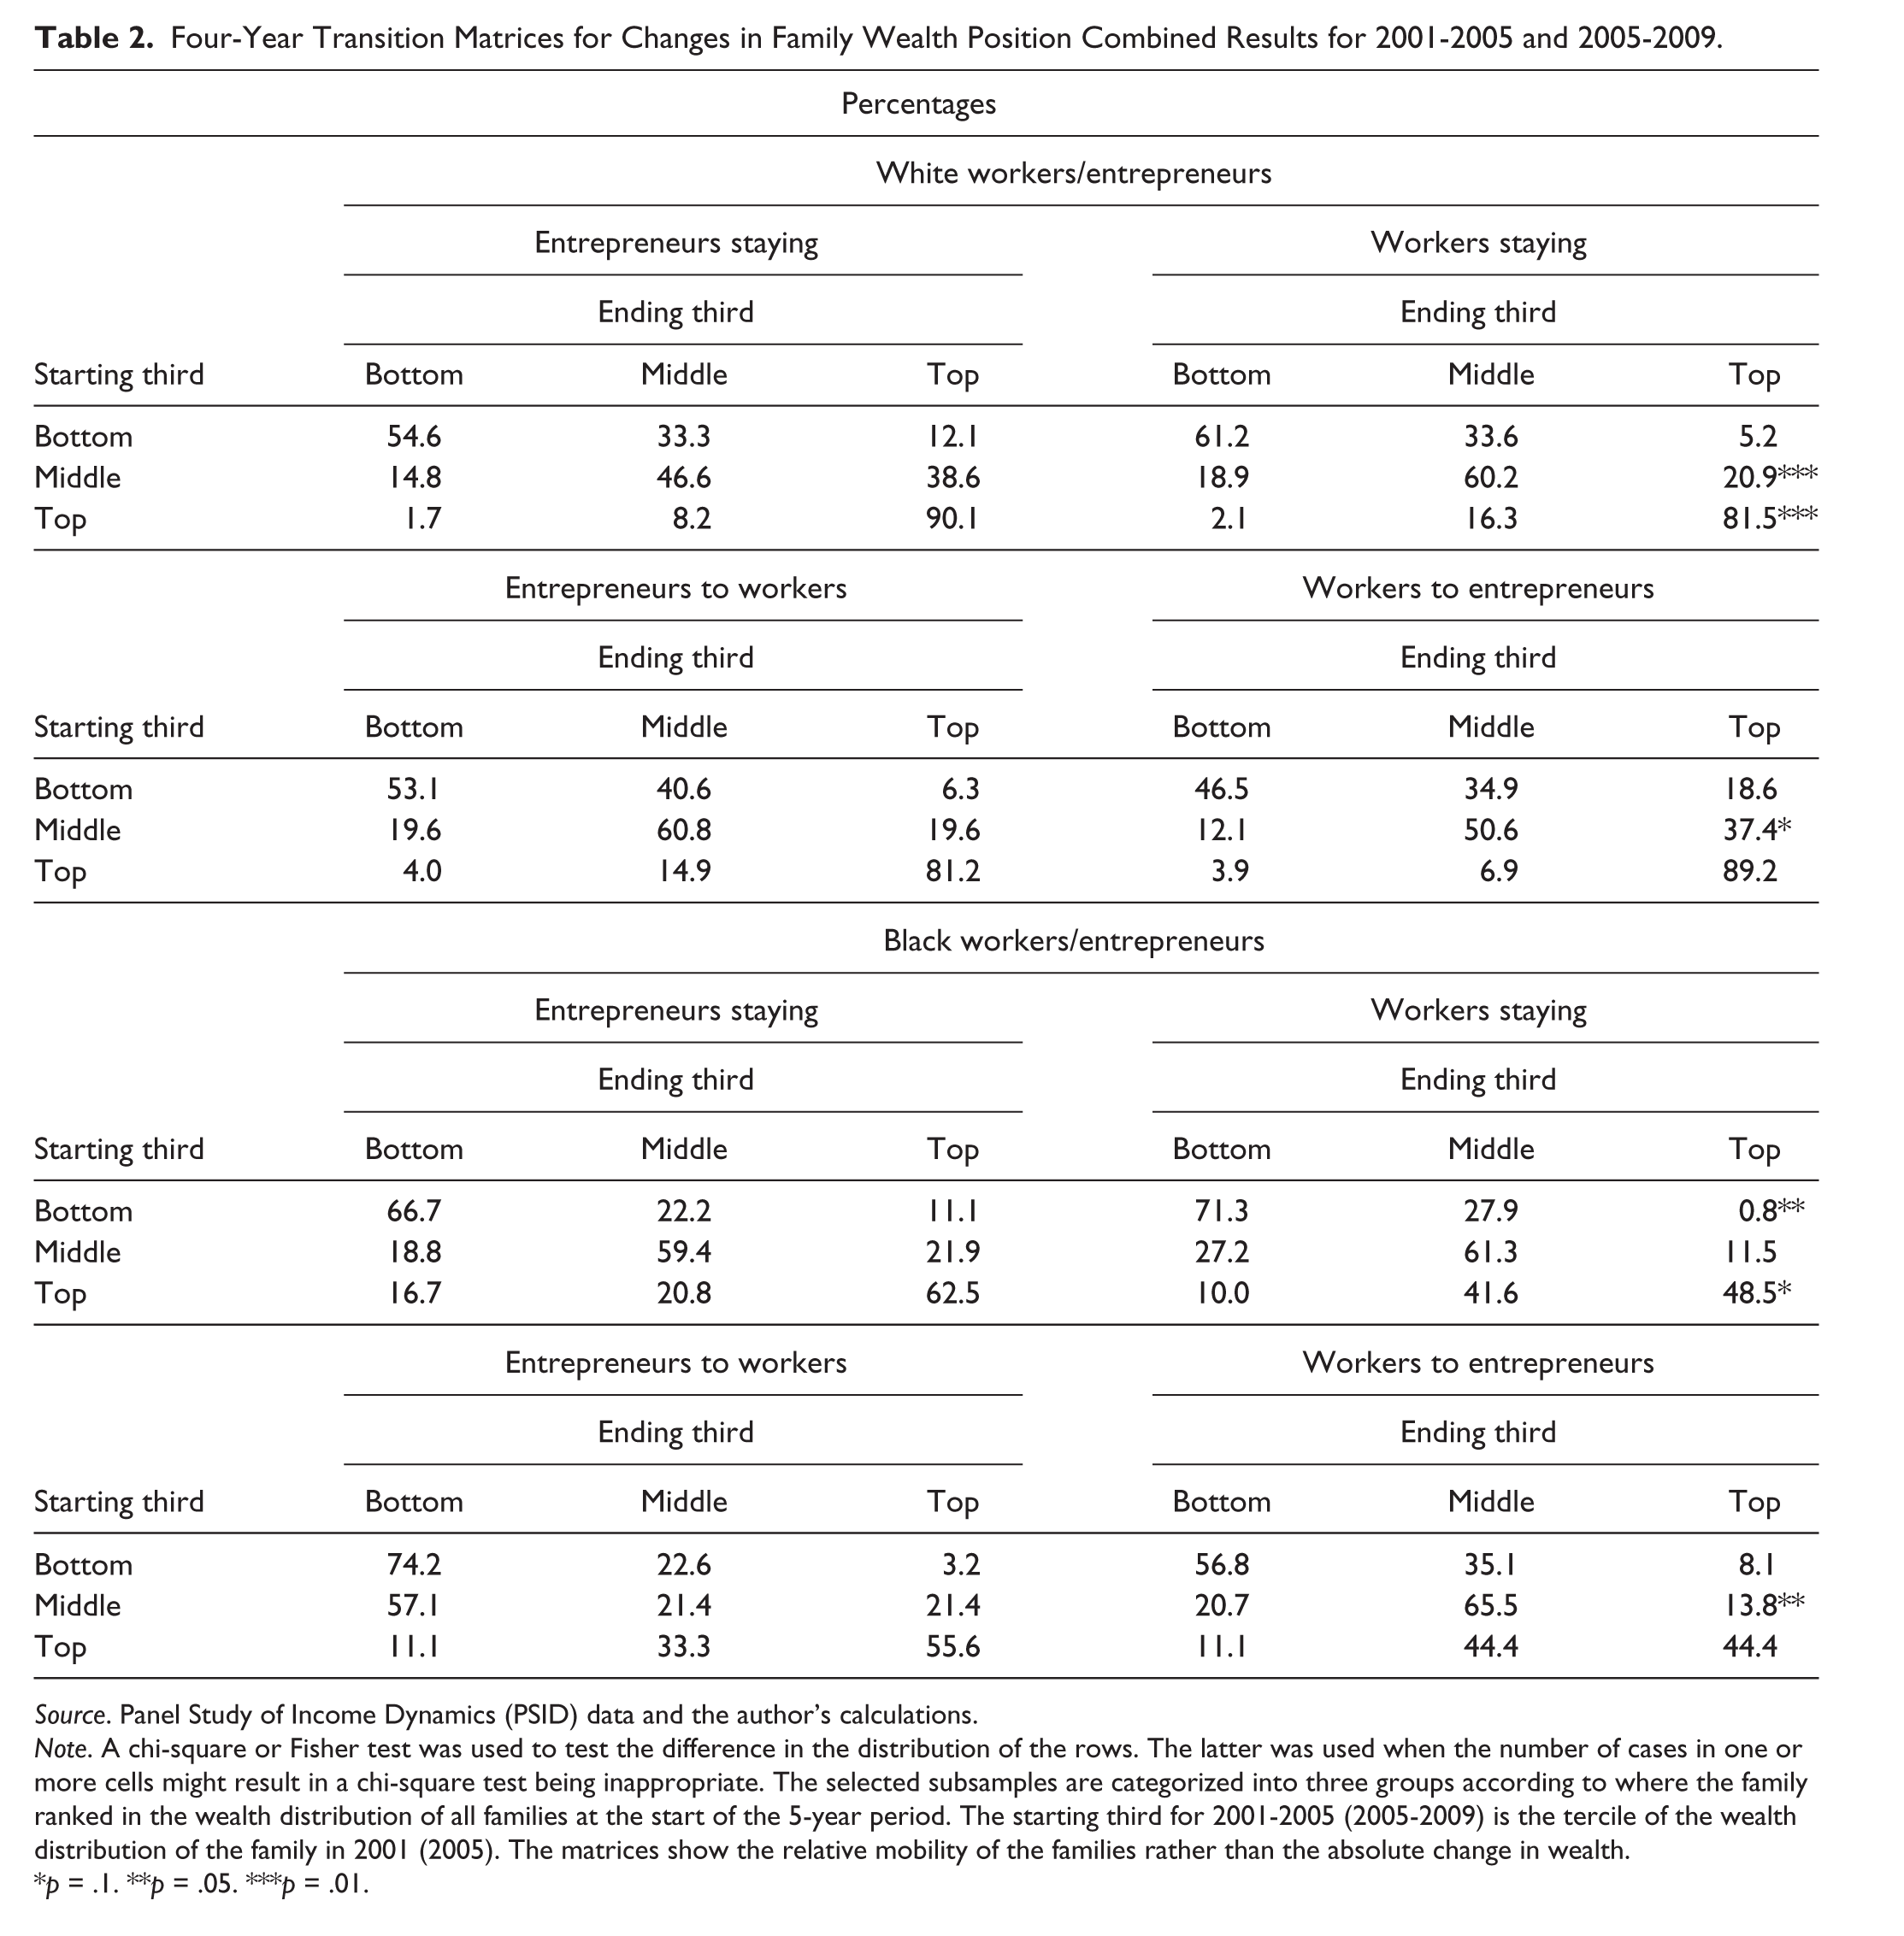
Source. Panel Study of Income Dynamics (PSID) data and the author’s calculations.
Note. A chi-square or Fisher test was used to test the difference in the distribution of the rows. The latter was used when the number of cases in one or more cells might result in a chi-square test being inappropriate. The selected subsamples are categorized into three groups according to where the family ranked in the wealth distribution of all families at the start of the 5-year period. The starting third for 2001-2005 (2005-2009) is the tercile of the wealth distribution of the family in 2001 (2005). The matrices show the relative mobility of the families rather than the absolute change in wealth.
p = .1. **p = .05. ***p = .01.
These matrices report whether entrepreneurs or workers—in light of transitions within the groups—perform better in wealth mobility after controlling for relevant variables, and if the results are consistent for both Black and White entrepreneurs and workers.
The families of the four employment groups have been divided according to the families’ wealth ranks at the start and end of each 4-year period. A family may start or end in the top third, middle third, or bottom third of the entire wealth distribution. The wealth ranks reported are based on all families, not just workers and entrepreneurs. Each employment category (e.g., workers staying) has three rows that refer to the families in that category that started in the bottom, middle, and top third. The three columns represent the percent of the families that started in that row (e.g., bottom third) that ended the 4-year period in the bottom third, middle third, or top third. A chi-square or a Fisher test was used to test the difference in the distribution of rows; for example, the difference in the distribution of the bottom third row for entrepreneurs staying compare to workers staying. With regard to heads of household who remained entrepreneurs or workers, we can compare entrepreneurs staying versus workers staying. For both the Black and White groups, there is greater upward mobility and less downward mobility for entrepreneurs staying compared with workers staying. For White entrepreneurs, the row differences are statistically significant for families starting in the middle and top thirds of the wealth distribution. For Black entrepreneurs, the row differences are statistically significant for families starting in the top and bottom thirds of the wealth distribution. For White families whose head of household switched from worker to entrepreneur or vice versa, workers shifting to entrepreneurship tended to have more favorable wealth mobility than entrepreneurs shifting to workers. The differences, however, are statistically significant only for those starting in the middle third of the wealth distribution. For Black families, the differences in outcome between entrepreneurs shifting and workers shifting are less clear. These results indicate that for both Black and White families, there is relatively favorable wealth mobility for permanent entrepreneurs compared with permanent workers.
Wealth Mobility Among Combined Black and White Families
One should determine the extent that these relationships hold when controlling for variables that ordinarily effect wealth transition. To test the statistical significance of the effect of race and entrepreneurship on wealth mobility, a logistic model estimate that controls for other traits and factors that affect changes in wealth is used. Two sets of models are estimated: L(1) = Log odds (family below the top tier moves into the top tier) = F (race, entrepreneurship, control variables); and L(2) = log odds (family above the bottom tier falls into the bottom tier) = F (race, entrepreneurship, control variables). The independent variables include the race of the family, its involvement in entrepreneurship, and control variables: education, age, family type (single male, single female, married couple), number of children, own home (yes/no), received a gift/inheritance, and period (2001-2005 or 2005-2009). Table 3 reports descriptive statistics of these variables for the combined families and separately for the White and Black families.
Family Traits Combined 2001-2005 and 2005-2009.
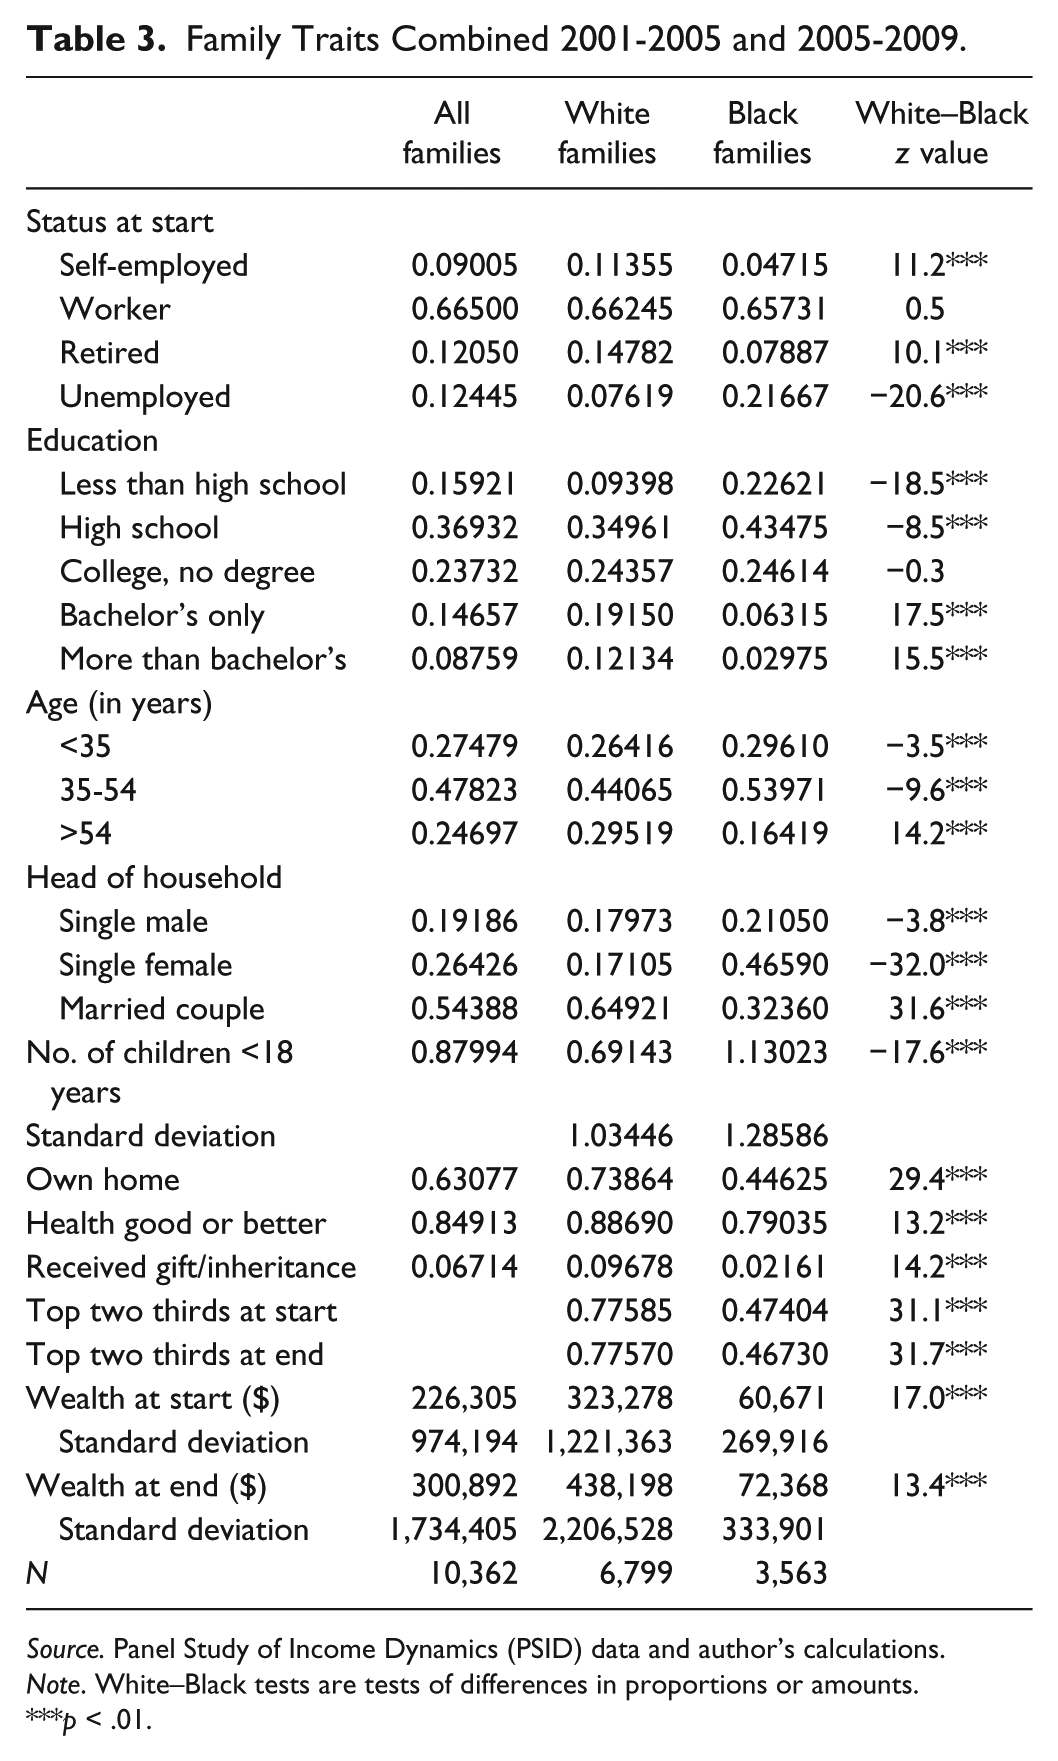
Source. Panel Study of Income Dynamics (PSID) data and author’s calculations.
Note. White–Black tests are tests of differences in proportions or amounts.
p < .01.
It also reports the statistical significance of the differences between the White and Black families in these variables. A lower fraction of the Black families are entrepreneurs, while a higher fraction of the Black families are unemployed. Compared with the White families, the Black families are less educated, younger, fewer married couples, more children, lower home ownership, less healthy, and receive fewer inheritances. A lower fraction of Black families are located in the top two thirds of the wealth distribution than are the White families. These traits indicate that Black families have less affluent economic traits compared with White families.
Table 4 shows the logistic regressions of the PSID families for 2001-2005 and 2005-2009, combined. These regressions control for the family traits in Table 3. The regression coefficients reported in Table 4 are marginal effects, which for indicator variables expresses the change in the probability of the outcome if that indicator variable is 1 (instead of 0). Robust standard errors clustered by family are used in the analyses.
Logit Regressions Predicting Family Transitions in the Wealth Distribution Combined 4-Year Periods 2001-2005 and 2005-2009. Dependent Variable: Family Rises Into the Top Third from Below the Top Third (Yes = 1. No = 0).
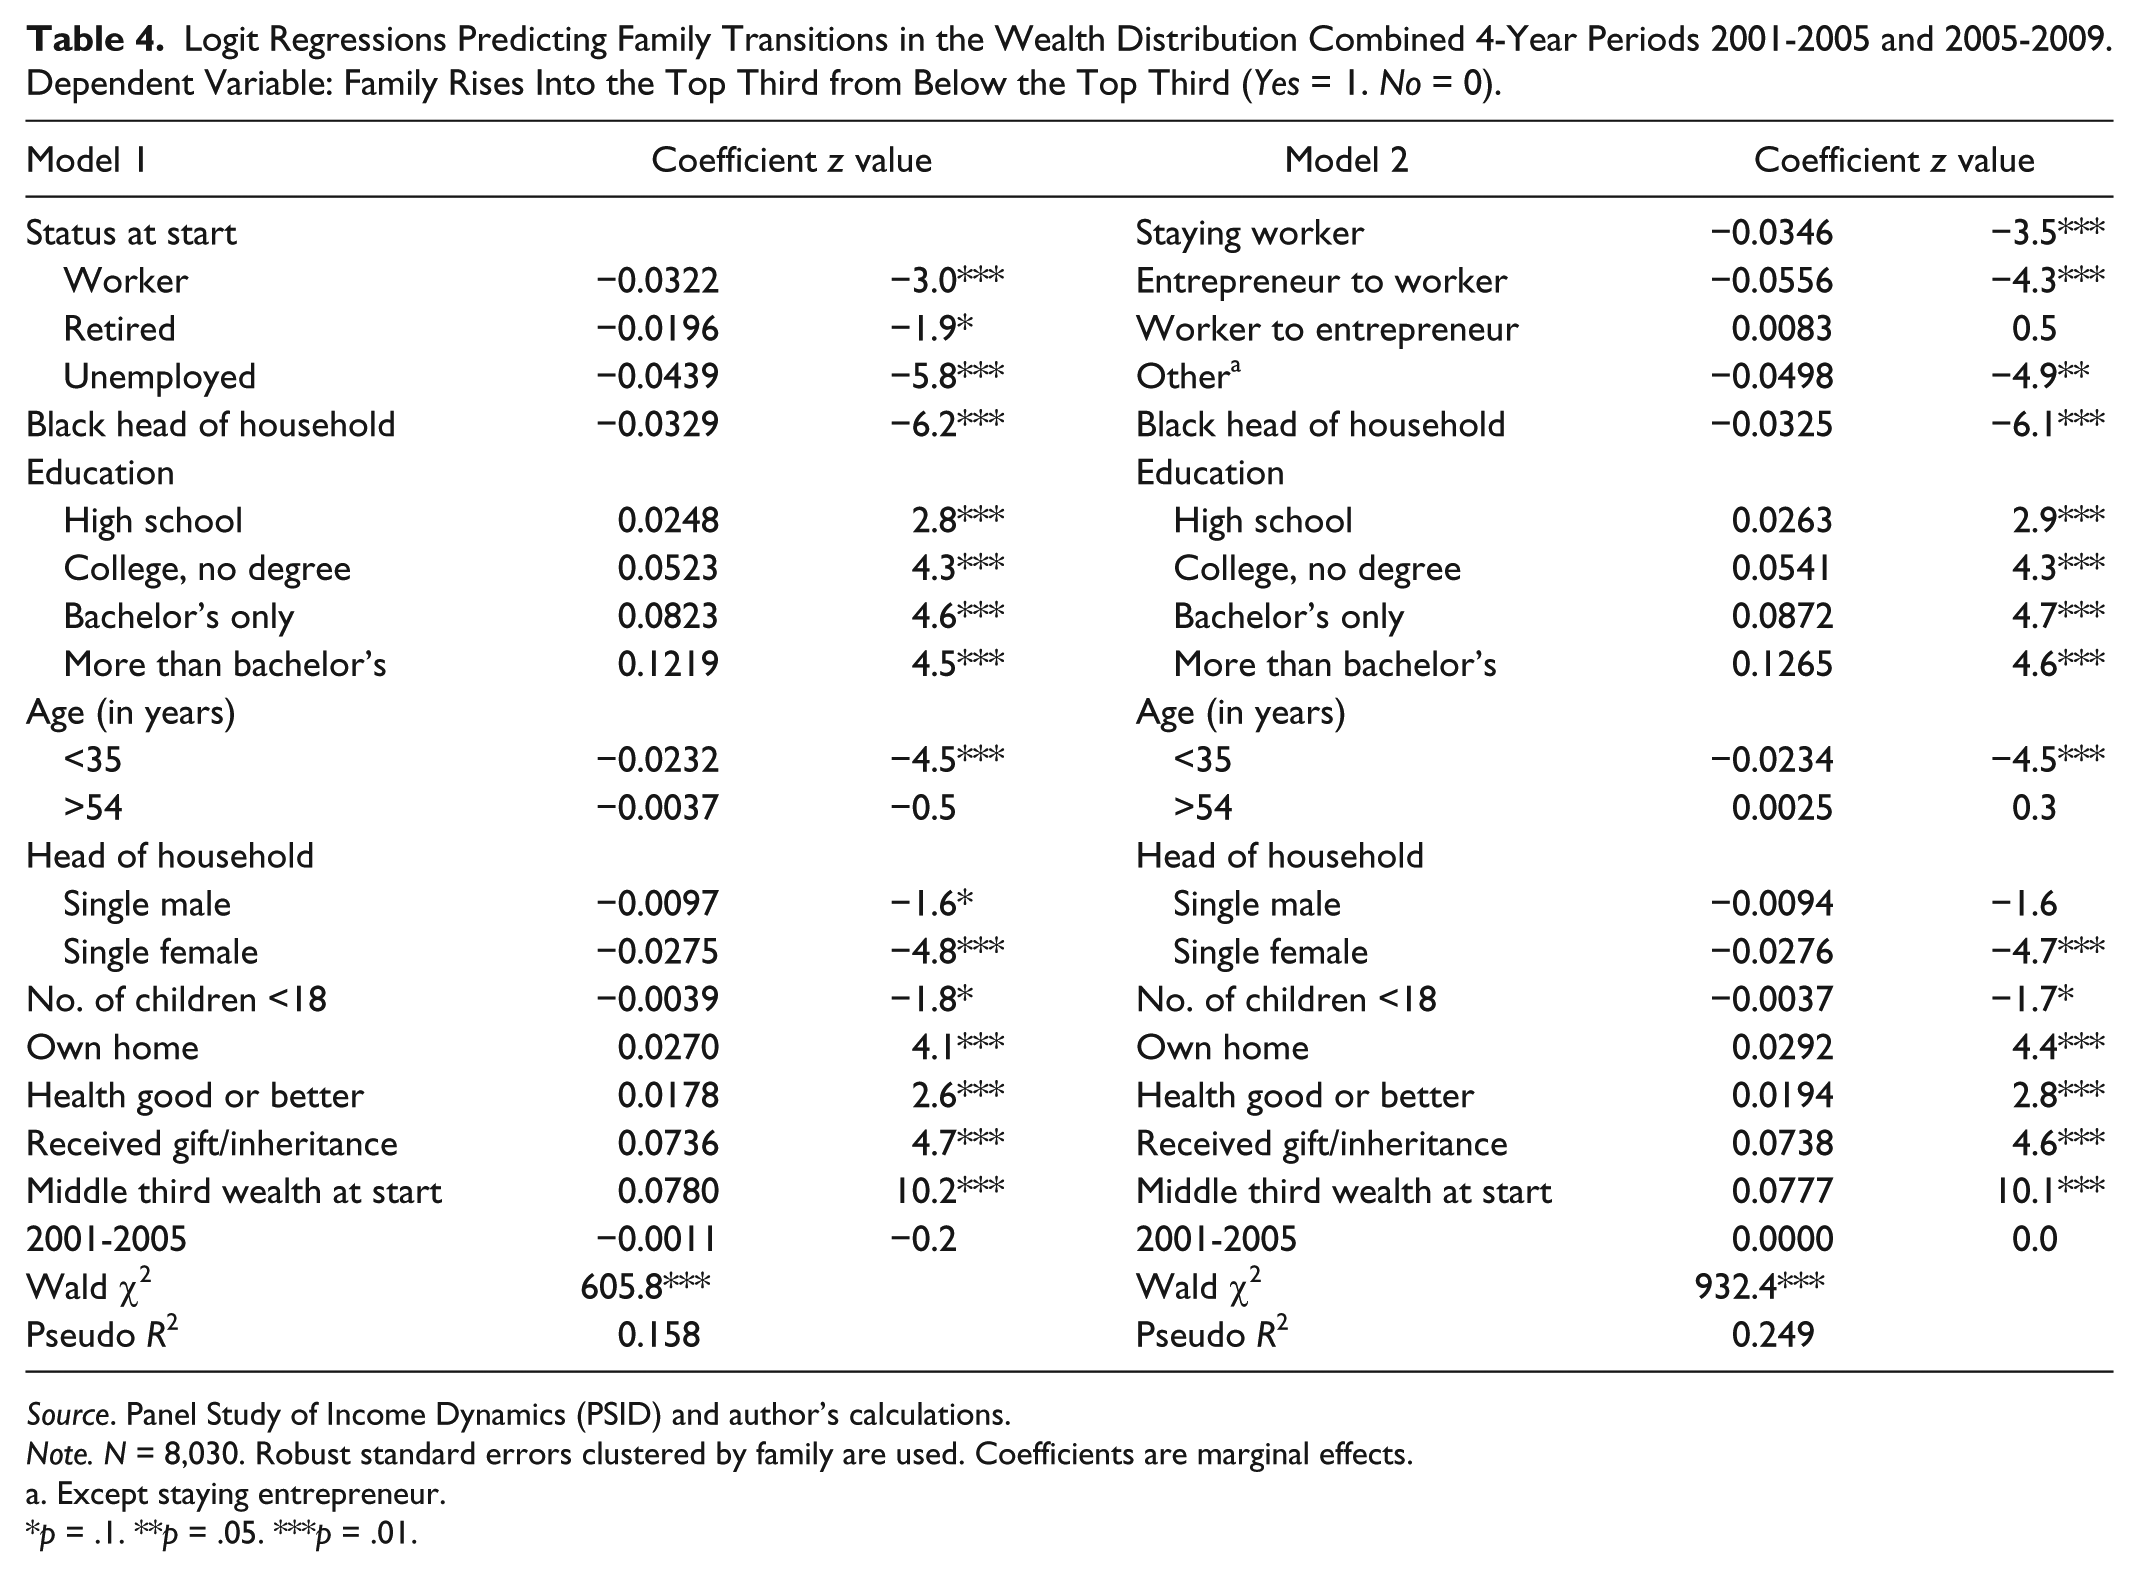
Source. Panel Study of Income Dynamics (PSID) and author’s calculations.
Note. N = 8,030. Robust standard errors clustered by family are used. Coefficients are marginal effects.
Except staying entrepreneur.
p = .1. **p = .05. ***p = .01.
We start with L(1) models in Table 4. A positive (negative) coefficient for an indicator variable means that the probability of rising into the top third is higher (lower) for families that have the indicator variable as 1. Since marginal effects as coefficients are reported, the probability is higher by the magnitude of the coefficient. My concern is how the employment status and race of the head of household relates to the probability that his/her family’s wealth rises from the bottom two thirds to the top third of the wealth distribution. Model 1 in Table 4 considers the employment status of the head of household at the start of each 4-year period. Since the decision on employment positions is not modeled, the findings on wealth mobility are conditional on the employment position at the start of the time observed. The employment status indicator variables are worker, retired, and unemployed; entrepreneur is the reference status. Here, the coefficients reflecting the nonentrepreneur categories are negative, indicating that relative to entrepreneurs, being in these other categories reduces the probability of the family moving into the top third of the wealth distribution. For example, for worker status the probability of movement into the top third of the wealth distribution is lower than that of entrepreneur status by .032. The coefficient for Black is negative and a statistically significant .033. Thus, when controlling for the other variables in the model, entrepreneur status is positively associated with upward movement in the wealth distribution, while Black is negatively associated with upward movement in the wealth distribution.
Model 2 in Table 4 considers the transitions that might occur between worker status and entrepreneurship status over each 4-year period. The employment status indicator variables in Model 2 are staying worker, entrepreneur to worker, worker to entrepreneur, and other. The “other” category excludes staying entrepreneurs, which is the reference status. Model 2 in Table 4 reports that relative to staying entrepreneurs, staying workers have .035 lower probability of moving into the top third of the wealth distribution. The other L(1) regression coefficients in Table 4 generally show the expected signs: more education, higher age (older than 35 years), married, good health, home ownership, and receipt of a gift/inheritance increase the probability of the family’s wealth rising into the top tier of the wealth distribution. Having more children and the single female status (compared with the married couple reference and to single male) decrease the probability of the family’s wealth rising into the top tier.
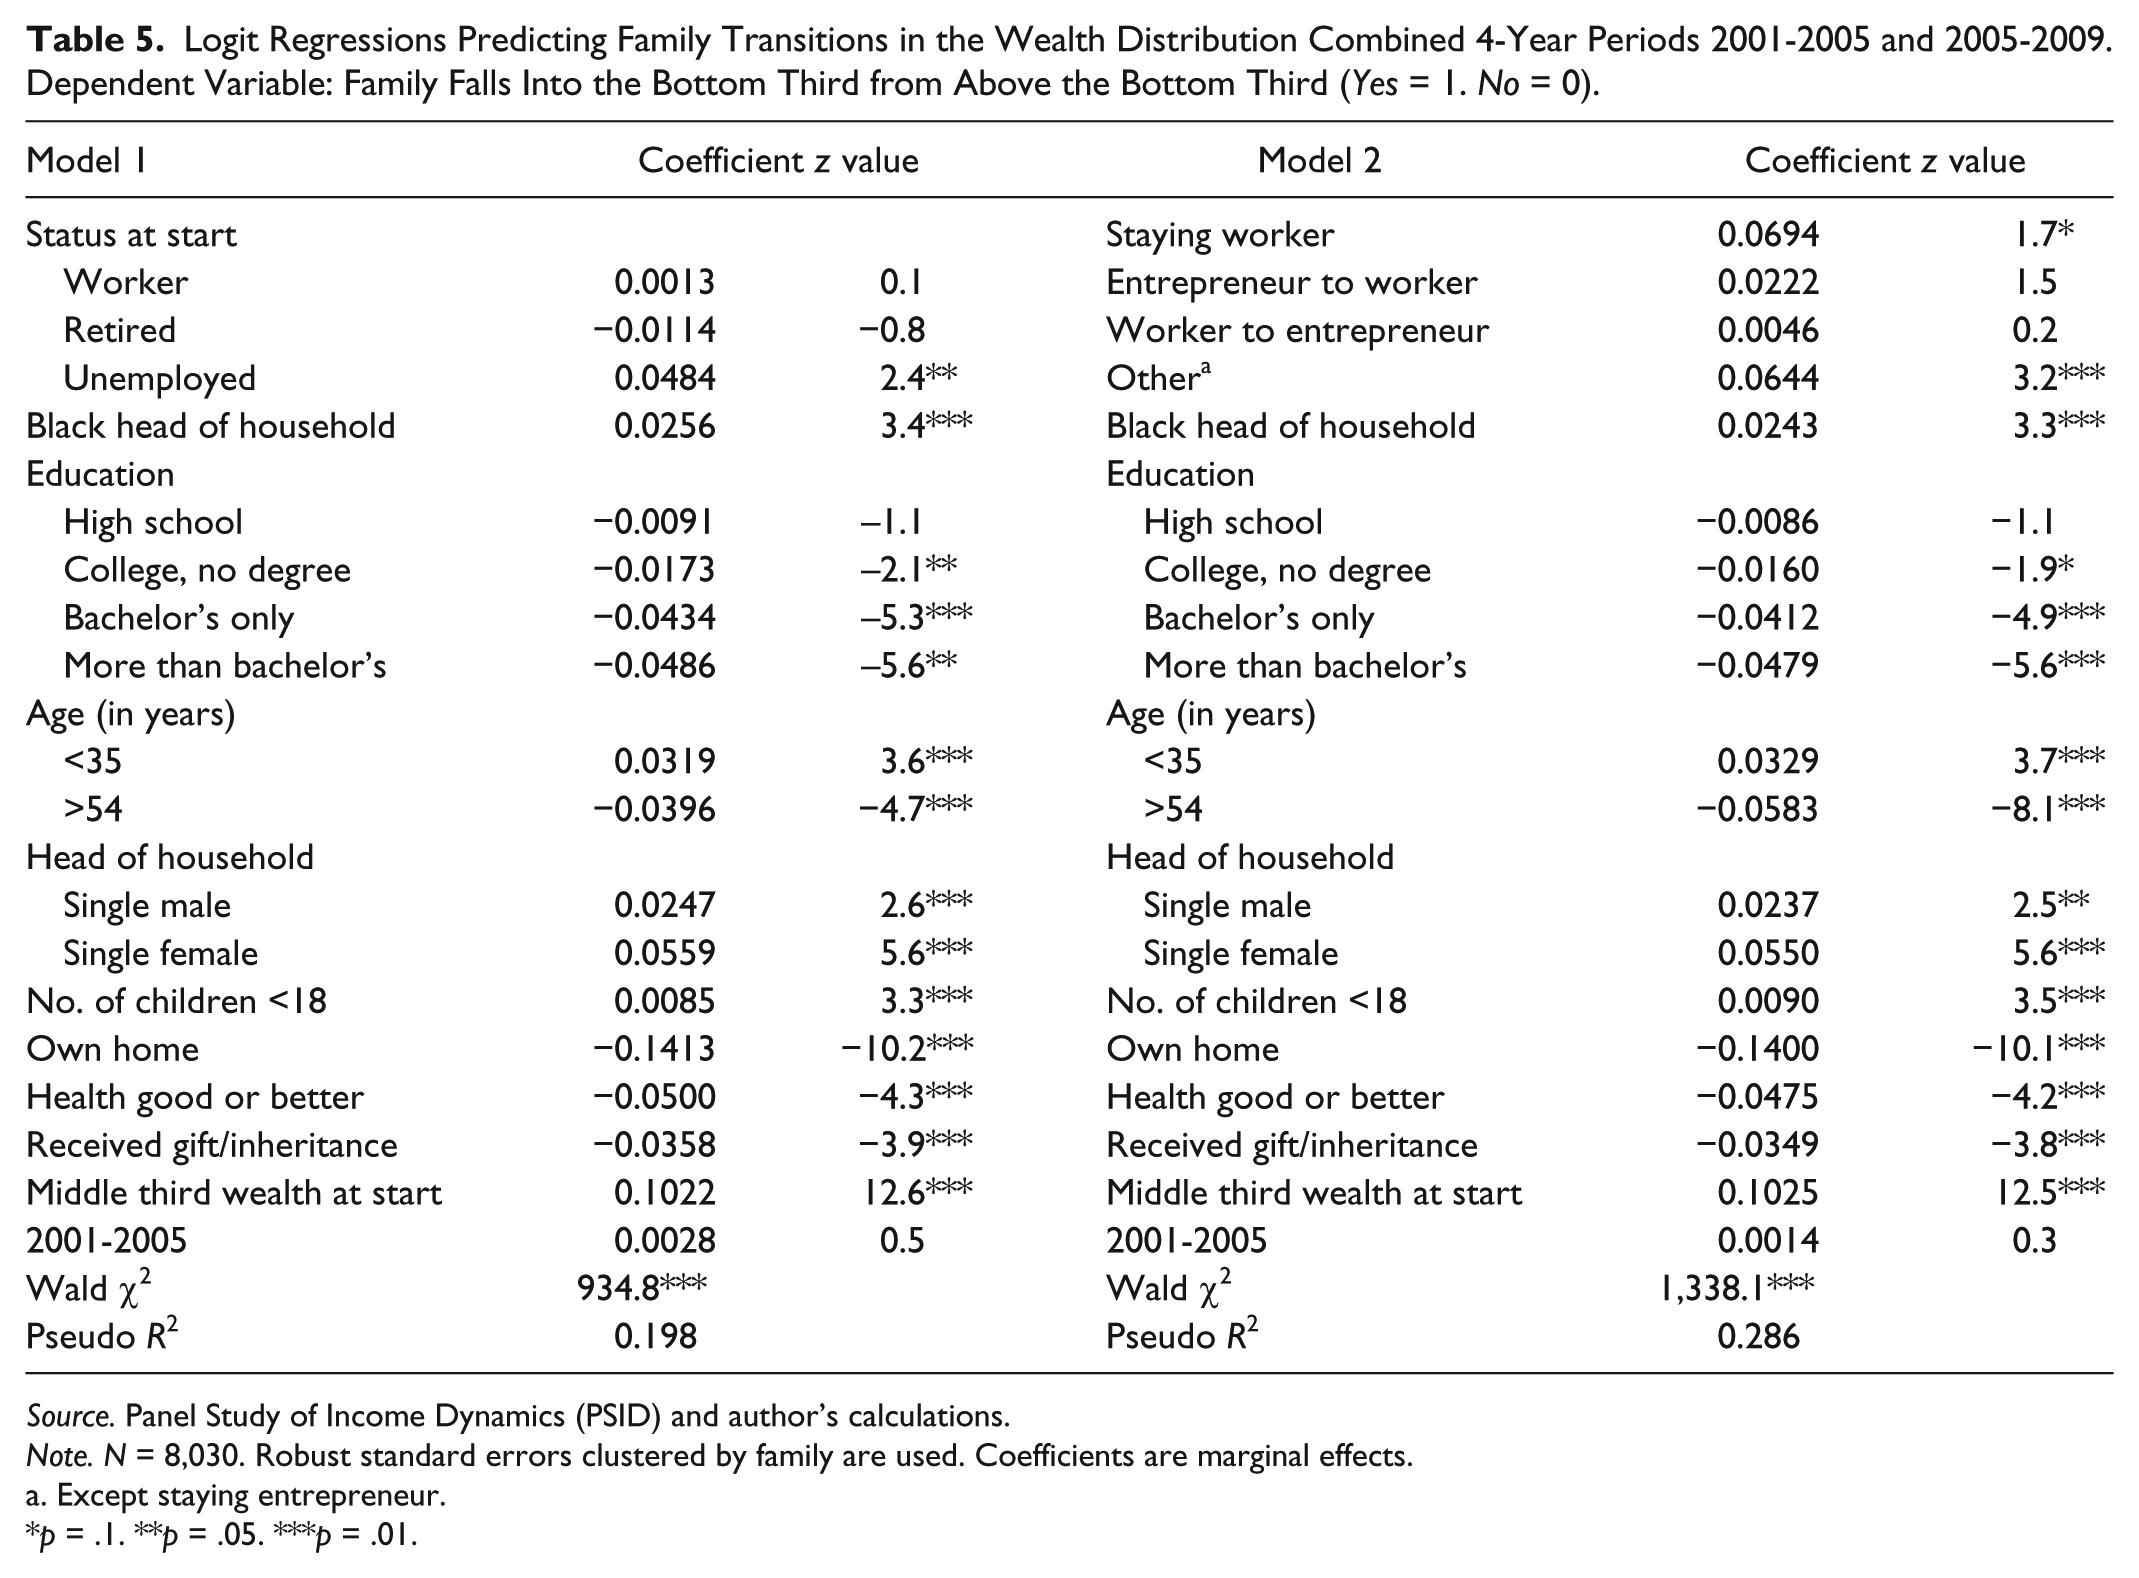
Table 5 contains L(2) models that predict downward wealth mobility falling into the bottom third from the top two thirds of the wealth distribution. Thus, a positive (negative) coefficient for an indicator variable means that the probability of falling into the bottom third of the wealth distribution is higher (lower) for families that have the indicator variable as 1. Model 1 in Table 5 considers the employment status of the head of household at the start of each 4-year period. Here, the coefficients reflecting worker and retired categories compared with the reference entrepreneur category are not statistically significant, while the coefficient for unemployed is a positive and statistically significant .048. Thus, unemployed relative to entrepreneur has a .048 higher probability of falling into the bottom third of the wealth distribution. Model 2 in Table 5 considers the transitions that might occur between worker status and entrepreneurship status over each 4-year period. The “other” category excludes staying entrepreneurs, which is the reference status. Model 2 in Table 5 reports that relative to staying entrepreneurs, staying workers have .069 higher probability than a staying entrepreneur of falling into the bottom third of the wealth distribution.
Logit Regressions Predicting Family Transitions in the Wealth Distribution Combined 4-Year Periods 2001-2005 and 2005-2009. Dependent Variable: Family Falls Into the Bottom Third from Above the Bottom Third (Yes = 1. No = 0).
Source. Panel Study of Income Dynamics (PSID) and author’s calculations.
Note. N = 8,030. Robust standard errors clustered by family are used. Coefficients are marginal effects.
Except staying entrepreneur.
p = .1. **p = .05. ***p = .01.
Both Models 1 and 2 in Table 5 report that Black heads of household are more likely than White counterparts to fall into the bottom tier, by .026 and .024, respectively. The other L(2) regression coefficients in Table 5 generally show the expected signs: more education, older age, married couple, good health, home ownership, and receipt of a gift/inheritance decrease the probability of the family’s wealth falling into the bottom tier of the wealth distribution. Having more children increases the probability of the family’s wealth falling into the bottom tier. I observe that Model 2 in Tables 4 and 5 do not consider whether those remaining in their positions are based on serial persistence or on “spurious” state dependence, where current participation does not structurally affect the future propensity to participate (Chay & Hyslop, 2001, p. 1). These transitions are not modeled, thus the possibility of misspecification. The results of these two transition models are consistent with those of Model 1, however, which consider employment position at a fixed point. A useful extension of this analysis would model these transitions to be more assured of the dynamic relationships.
Thus, when controlling for the other variables in the model, entrepreneur status is positively associated with upward movement in the wealth distribution compared with worker status, whereas Black is negatively associated with upward movement in the wealth distribution. The focus for this research is the wealth mobility of Black entrepreneurs. Thus, two additional considerations emerge, first, by race, the wealth mobility of entrepreneurs compared with that of workers and second, the wealth mobility of Black entrepreneurs compared with that of White entrepreneurs.
Wealth Mobility of Entrepreneurs Among Black and White Families Separately
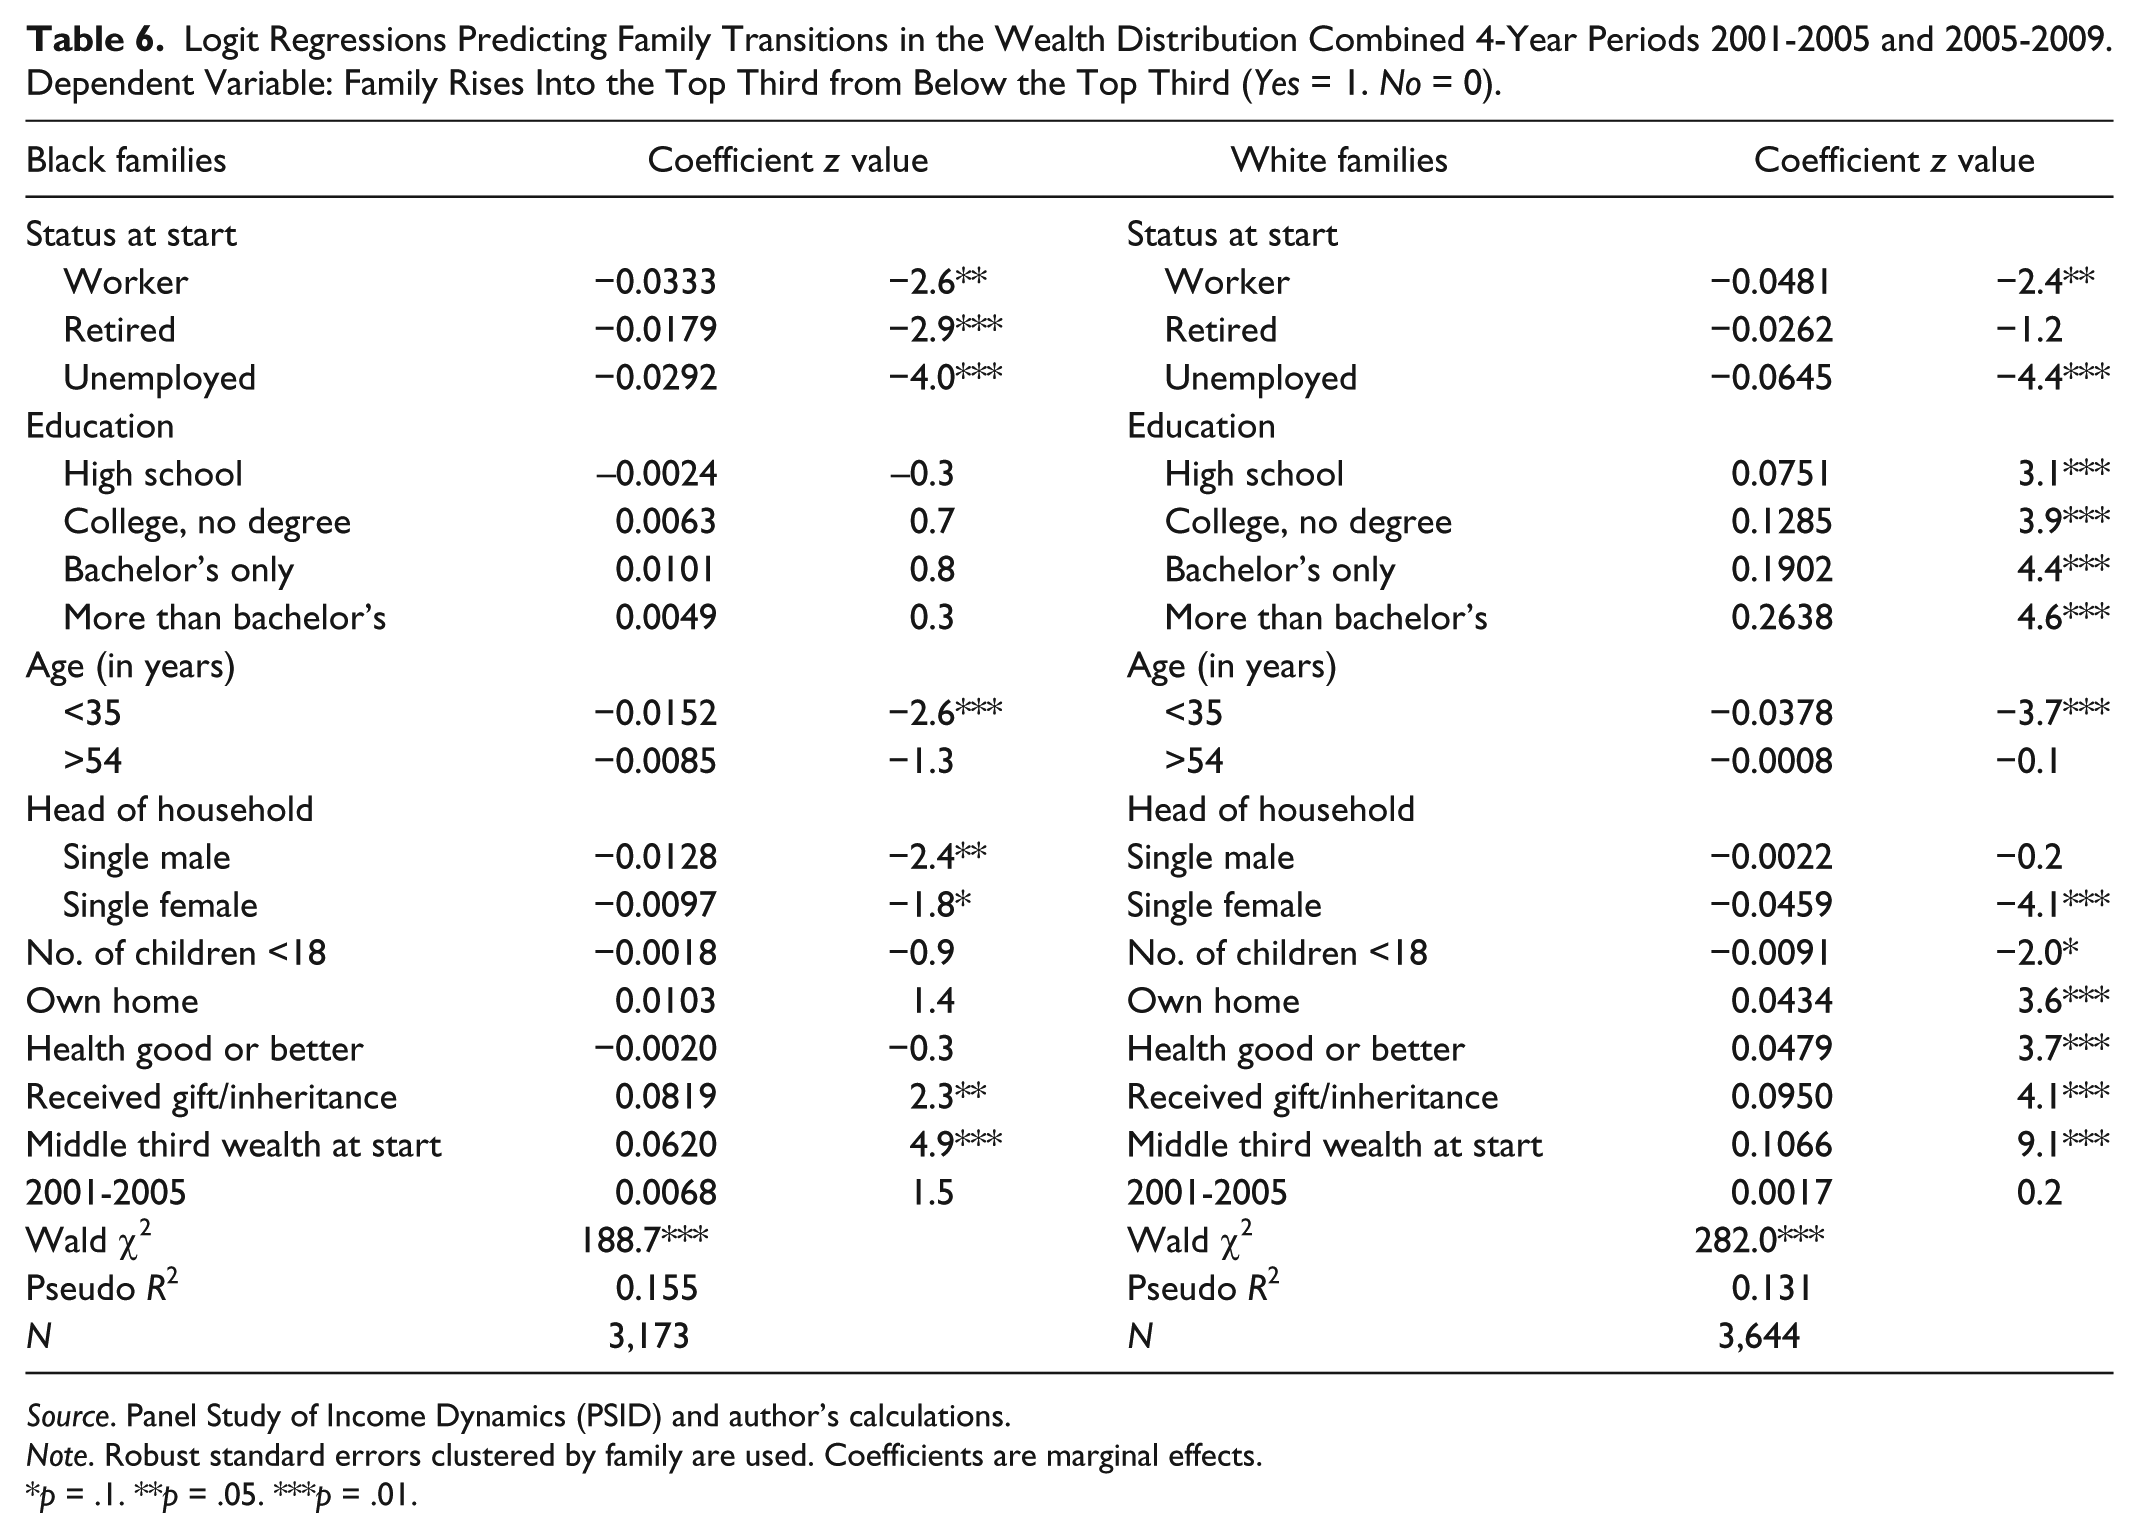
Among Black and White families separately, how does the wealth mobility of entrepreneurs compare with that of workers and other employment categories? Tables 6 and 7 contain separate logistic regressions for Black families and White families. Table 6 reports L(1) models that predict the log odds of rising into the top tier of the wealth distribution from a lower tier. Table 7 reports L(2) models that predict the log odds of falling into the bottom tier of the wealth distribution from a higher tier. I use Model 1 regressions for the family analyses; that is, the employment indicator variables in the regressions are the status at the start of each 4-year period, and the categories are worker, retired, unemployed, and entrepreneur. Entrepreneur is the reference status in these regressions. Table 6 reports that for both Black and White families, worker status has a lower probability of moving into the top third (statistically significant), and the drop is .033 and .048 for the Black and White families, respectively. Interestingly, education is not statistically significant for the Black families while it is highly significant for the White families. The coefficient for children younger than 18 years is not statistically significant for Black families but it is for White families. Owning a home is not statistically significant in improving the wealth status of Black families but it is for White families.
Logit Regressions Predicting Family Transitions in the Wealth Distribution Combined 4-Year Periods 2001-2005 and 2005-2009. Dependent Variable: Family Rises Into the Top Third from Below the Top Third (Yes = 1. No = 0).
Source. Panel Study of Income Dynamics (PSID) and author’s calculations.
Note. Robust standard errors clustered by family are used. Coefficients are marginal effects.
p = .1. **p = .05. ***p = .01.
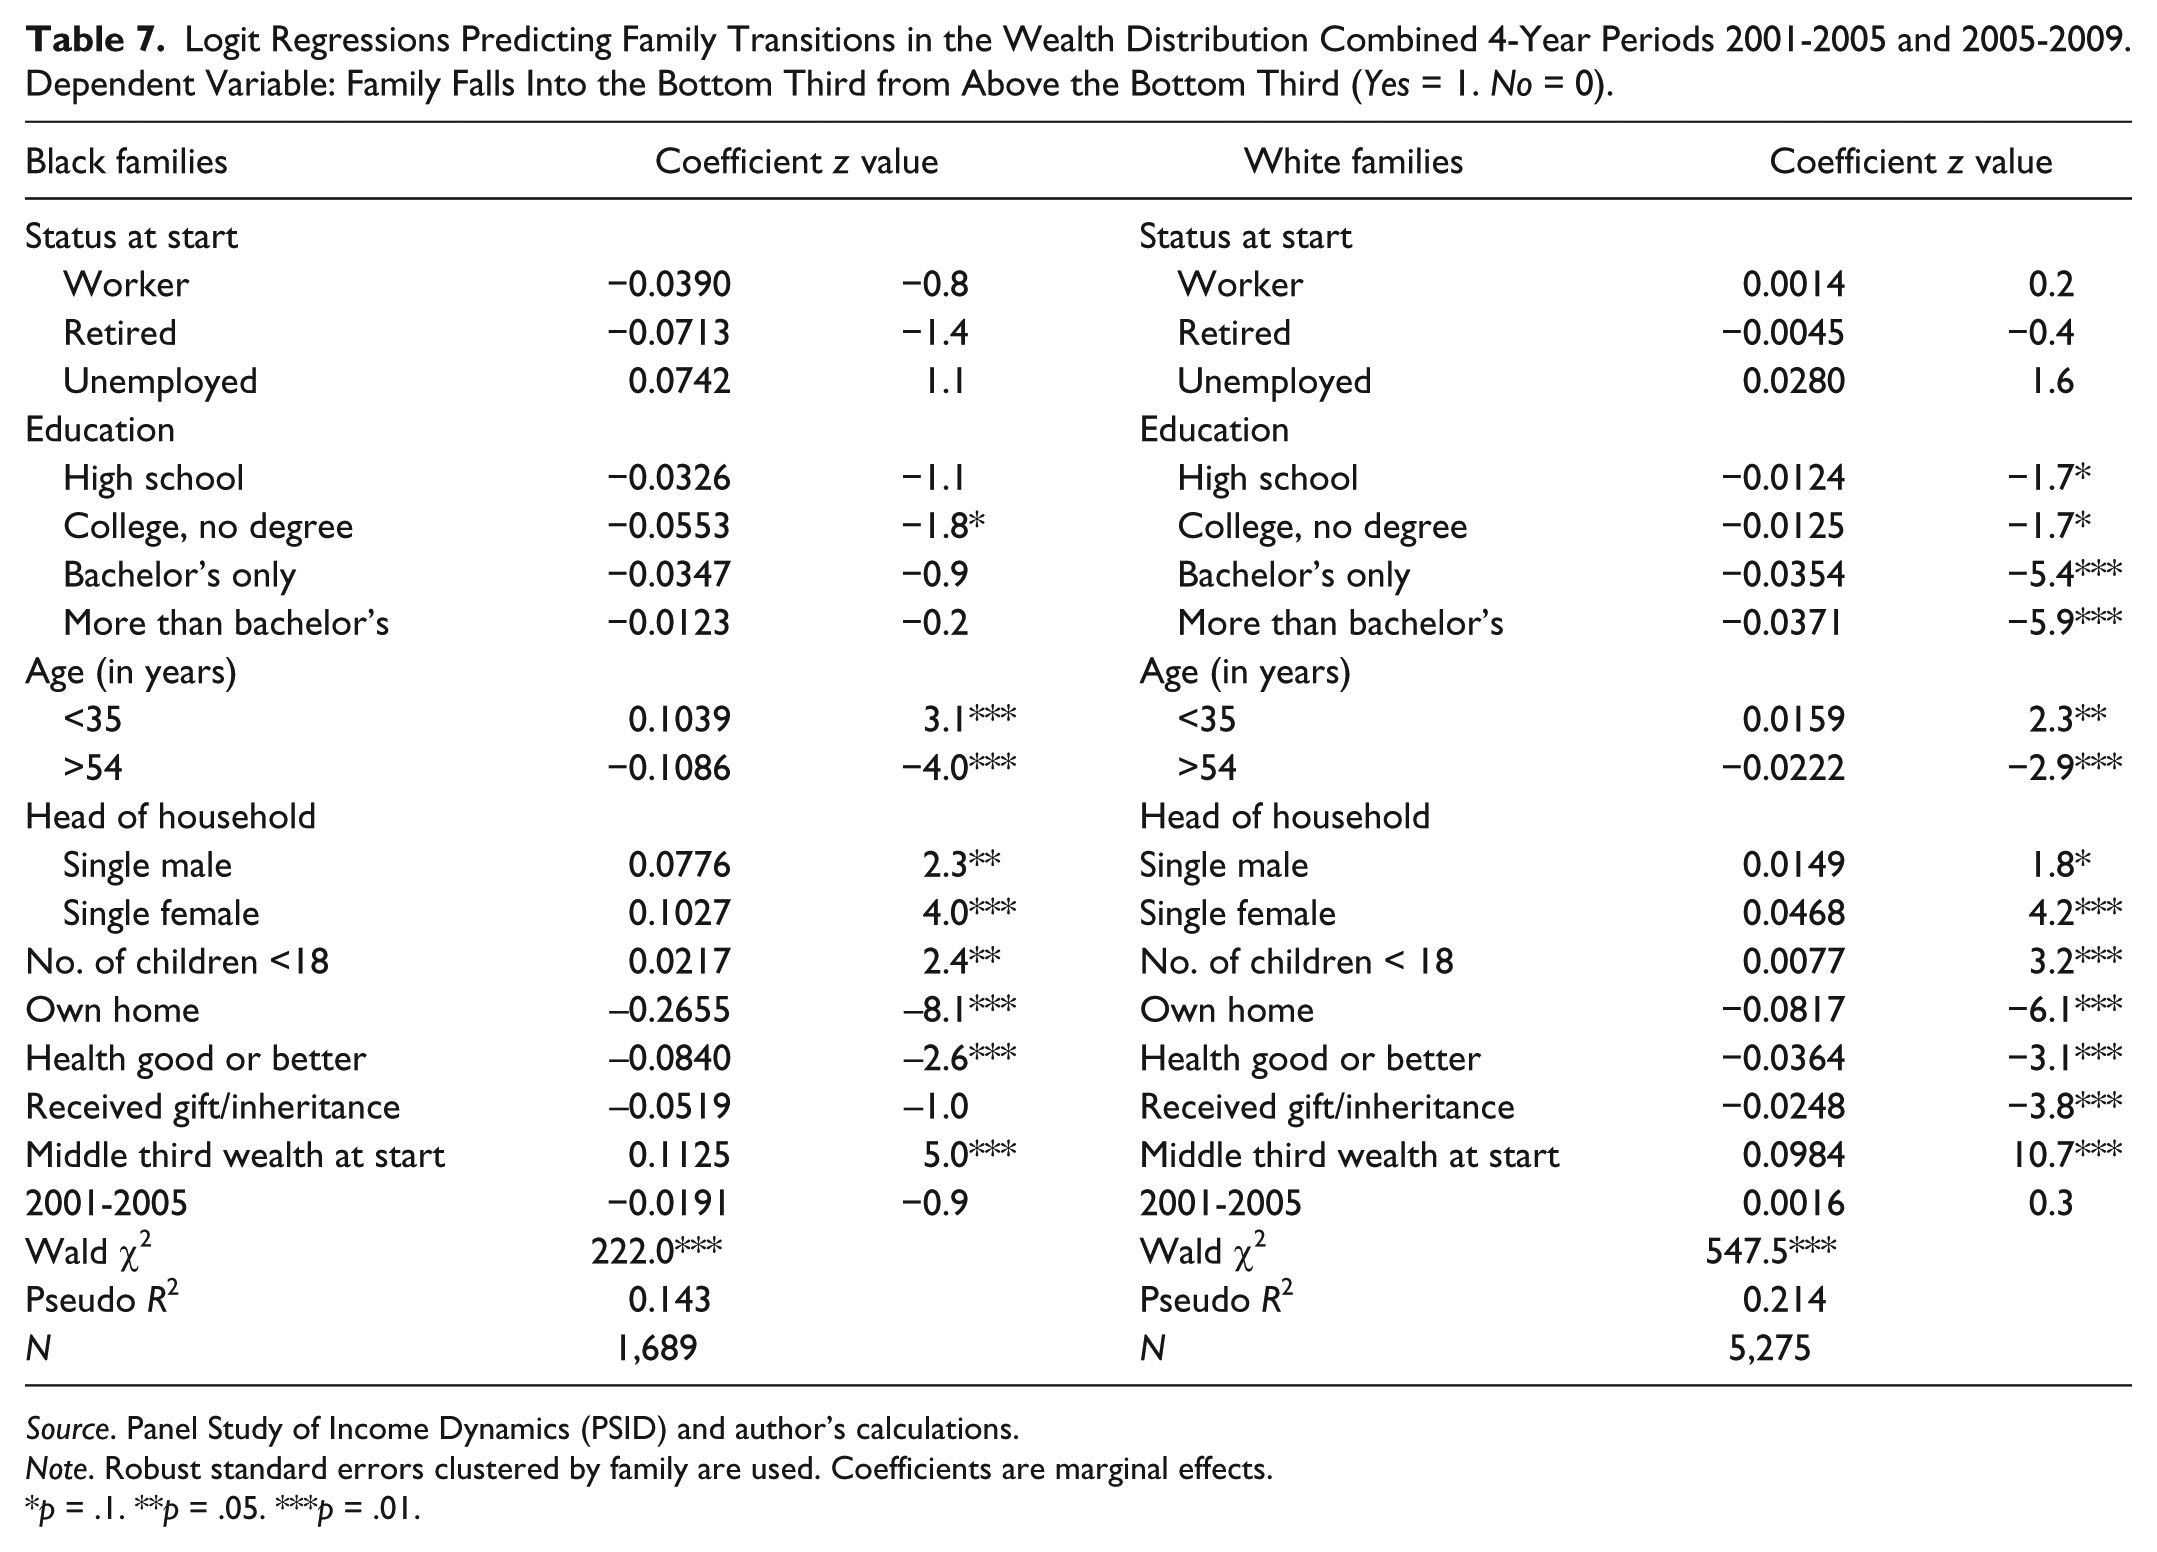
Logit Regressions Predicting Family Transitions in the Wealth Distribution Combined 4-Year Periods 2001-2005 and 2005-2009. Dependent Variable: Family Falls Into the Bottom Third from Above the Bottom Third (Yes = 1. No = 0).
Source. Panel Study of Income Dynamics (PSID) and author’s calculations.
Note. Robust standard errors clustered by family are used. Coefficients are marginal effects.
p = .1. **p = .05. ***p = .01.
Table 7 reports for both Black and White families no statistically significant difference between worker status and entrepreneur status in the probability of falling into the bottom tier of the wealth distribution. Similar to the outcomes in Table 6, education is a weaker variable in predicting wealth transitions for Black families than for White families. In addition, Table 7 reports that the receipt of inheritance is not statistically significant for Black families, while it is for White families. Interestingly, Table 7 shows that for Black families, while owning a home is not statistically significant in upward movements in the wealth distribution, it is statistically significant in reducing the probability of downward movements.
Wealth Mobility of Entrepreneurs and Workers Separately
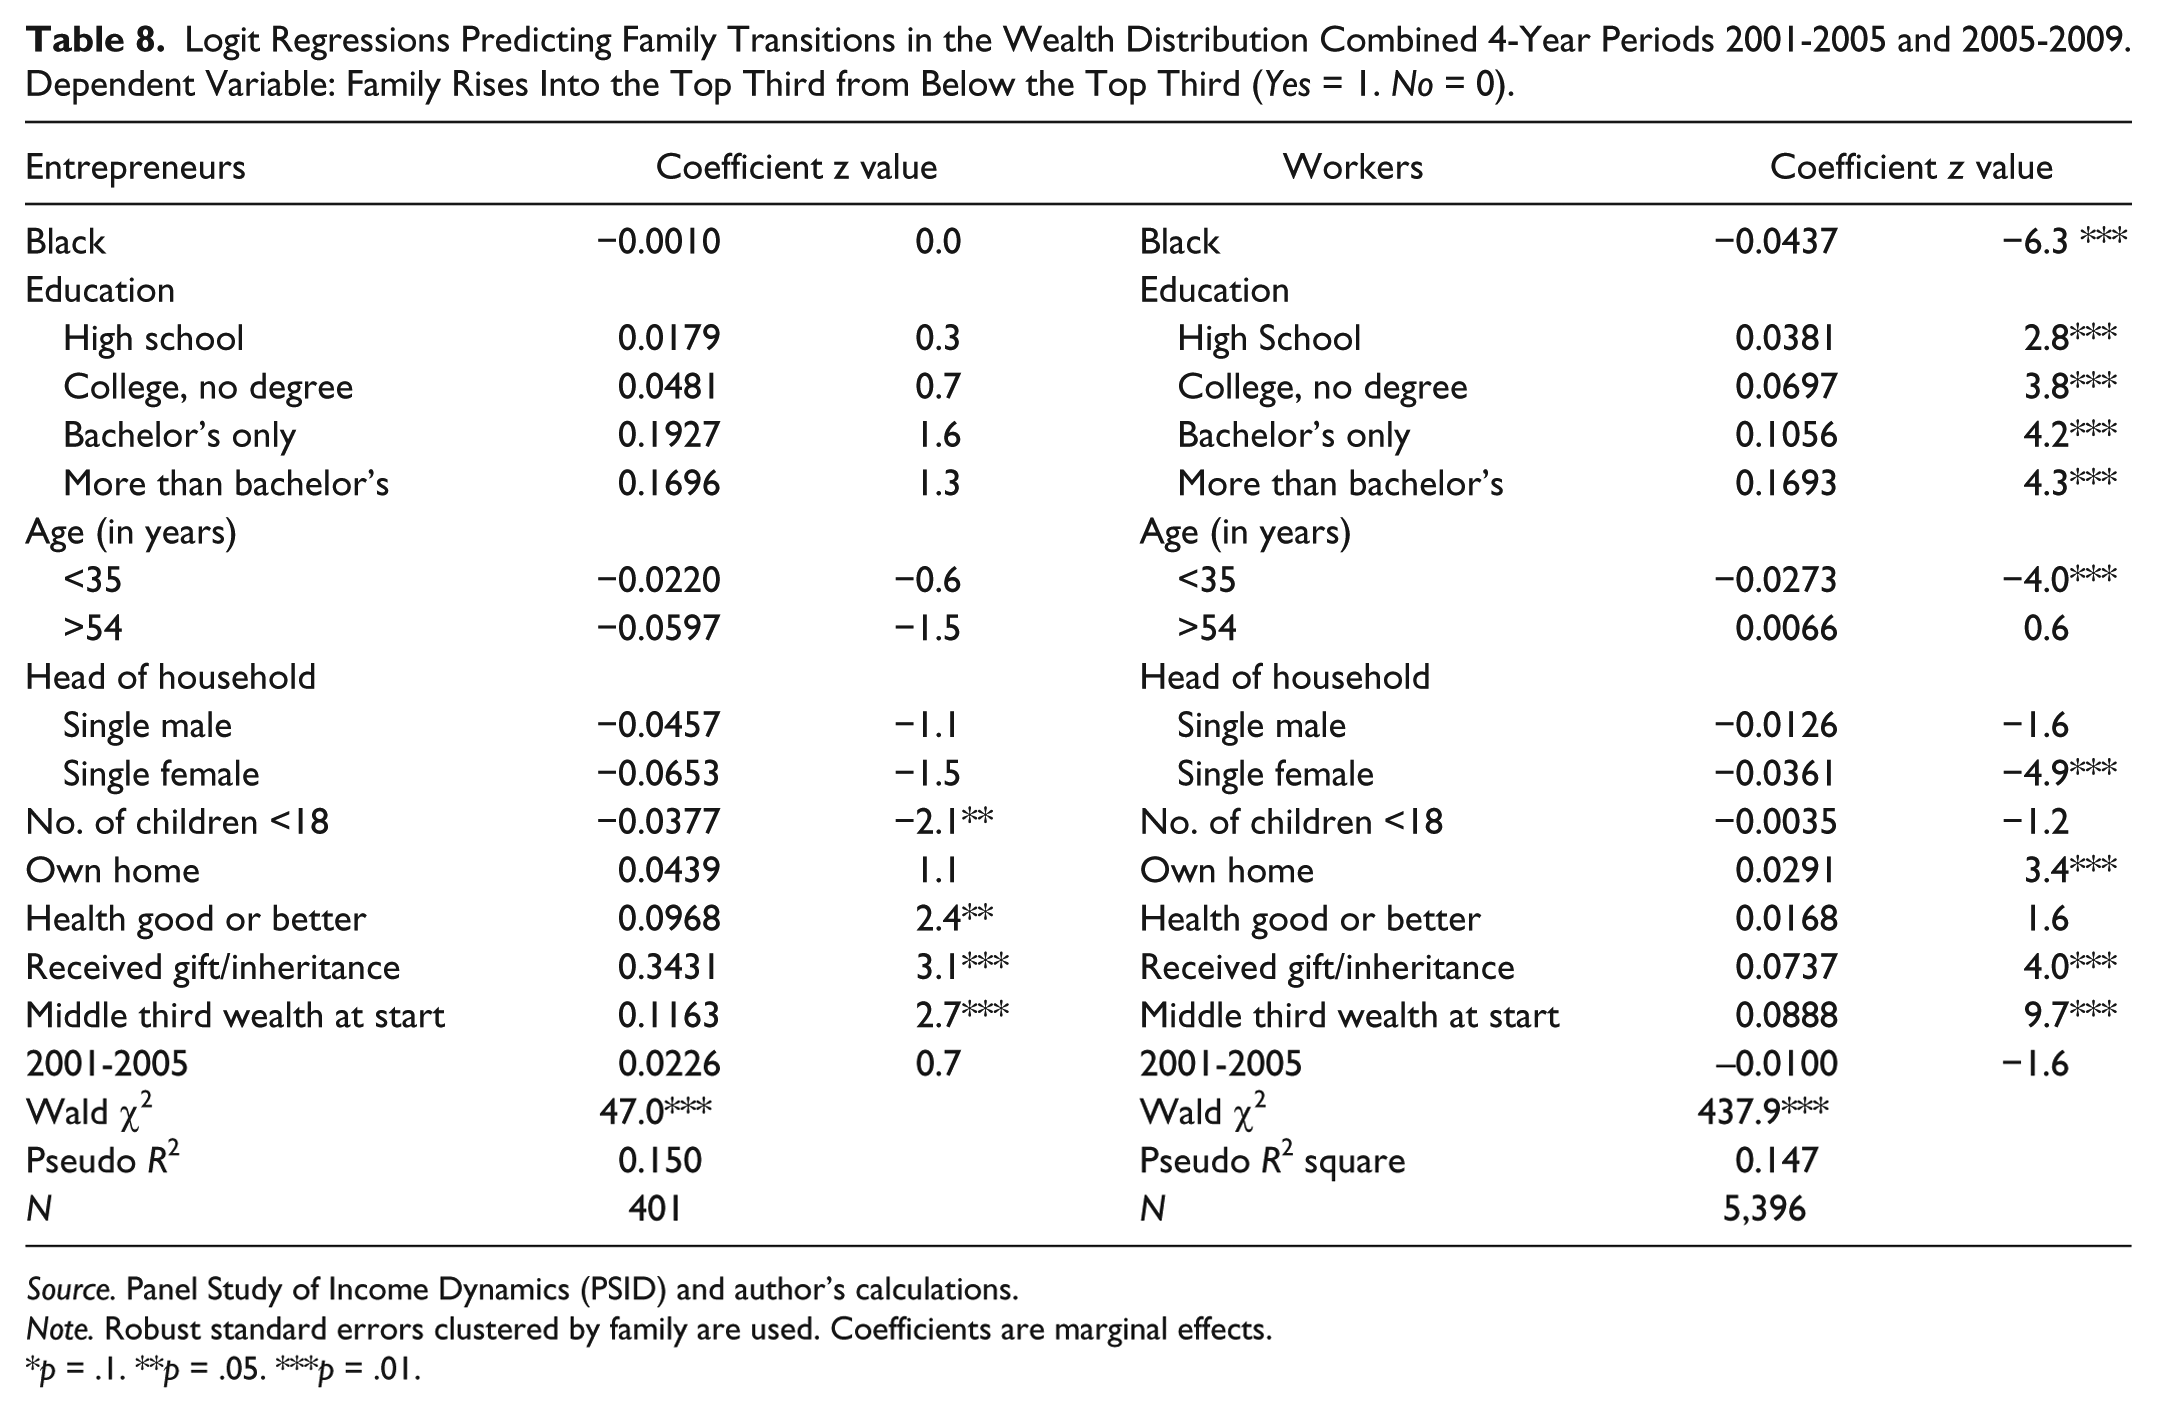
Among entrepreneurs and workers separately, how does the wealth mobility differ by race? Tables 8 and 9 report separate logistic regressions for entrepreneurs and workers. Table 8 reports L(1) models that predict the log odds of rising into the top tier of the wealth distribution from a lower tier. Table 9 reports L(2) models that predict the log odds of falling into the bottom tier of the wealth distribution from a higher tier. Model 1 regressions are used for the analyses of entrepreneurs and workers. These models consider the employment status at the start of the 4-year period. Table 8 reports that race is not statistically significant in predicting movement to the top tier of the wealth distribution for entrepreneurs, while for workers, the probability of Black workers moving into the top tier of the wealth distribution is .044 less than that of White workers, controlling for the other variables in the regression. Similarly, Table 9, which predicts downward movement in the wealth distribution, shows that for entrepreneurs race is not statistically significant in families falling into the bottom third, while for workers the probability of a Black worker moving into the bottom third is .03 higher than that of a White worker, after controlling for the other variables. Thus, the negative and positive coefficients for Black families in Tables 4 and 5, respectively, which indicate less favorable results for Black families, reflect the less favorable wealth mobility of Black workers rather than of Black entrepreneurs. Education is not statistically significant for entrepreneurs in predicting upward movement in the wealth distribution, while it is statistically significant for workers. Age is not statistically significant in predicting upward wealth mobility for entrepreneurs, but for workers, younger workers are less likely to achieve upward wealth mobility compared with older workers.
Logit Regressions Predicting Family Transitions in the Wealth Distribution Combined 4-Year Periods 2001-2005 and 2005-2009. Dependent Variable: Family Rises Into the Top Third from Below the Top Third (Yes = 1. No = 0).
Source. Panel Study of Income Dynamics (PSID) and author’s calculations.
Note. Robust standard errors clustered by family are used. Coefficients are marginal effects.
p = .1. **p = .05. ***p = .01.
Logit Regressions Predicting Family Transitions in the Wealth Distribution Combined 4-Year Periods 2001-2005 and 2005-2009. Dependent Variable: Family Falls Into the Bottom Third from Above the Bottom Third (Yes = 1. No = 0).

Source. Panel Study of Income Dynamics (PSID) and author’s calculations.
Note. Robust standard errors clustered by family are used. Coefficients are marginal effects.
p = .1. **p = .05. ***p = .01.
Similar to the outcomes in Table 8, in Table 9 education is a weaker variable in predicting wealth transitions for entrepreneurs than for workers. In addition, the relationship between wealth transition and age less than 35 years differs between entrepreneurs and workers. Entrepreneurs less than 35 years of age have a lower probability of falling into the bottom tier of the wealth distribution than do entrepreneurs between ages 35 and 54, while workers younger than than 35 years have a higher probability of falling into the bottom tier than do workers aged between 35 and 54 years.
How do entrepreneurs and workers directly compare in wealth mobility, and how does this comparison differ between Black and White entrepreneurs? Table 10 includes only workers and entrepreneurs in L(1) and L(2) models. Both Black and White families are included. I modify Model 1 in these regressions: Employment status at the start of the 4-year period is considered by two variables—Entrepreneurship and Black × Entrepreneurship, an interaction variable. Two independent variables interact if the effect of one of the variables differs depending on the level of the other variable. Of interest here is whether the difference in wealth mobility of entrepreneurship over that of workers differs between Black and White entrepreneurs, after controlling for the effect of the other variables. In the L(1) model that predicts rising into the top tier of wealth from a lower tier, the probability of a Black family moving into the bottom third is .03 lower than that of a White family, while the same probability for an entrepreneur over a worker is .03. Thus, for Black entrepreneurs, the negative impact of Black is offset by the positive impact of entrepreneurship while Black workers are negatively affected by both Black and worker statuses. The Black × Entrepreneur interaction term is not statistically significant, so the effect of entrepreneurship over workers does not differ between Black and White entrepreneurs. Using the Inteff program in Stata (Norton et al., 2004), I found that the statistical insignificance of Black × Entrepreneurship is consistent over the probability range of the dependent variable, rising to the top tier.
Logit Regressions Predicting Family Transitions in the Wealth Distribution Combined 4-Year Periods 2001-2005 and 2005-2009.

Source. Panel Study of Income Dynamics (PSID) and author’s calculations.
Note. Robust standard errors clustered by family are used. Coefficients are marginal effects.
p = .1. **p = .05. ***p = .01.
In the L(2) model that predicts falling into the bottom tier of the wealth distribution from a higher tier, while the probability of a Black family moving into the bottom third is .03 higher than that of a White family, the difference in the probability between an entrepreneur and a worker moving into the bottom third is not statistically significant. Black × Entrepreneur is also not statistically significant. The statistical insignificance of Black × Entrepreneurship was also found to be consistent over the probability range of falling into the bottom third of the wealth distribution.
Overview of Results Logistic Regressions on Wealth Mobility
The logistic regressions control for demographic and other traits that would also affect wealth mobility of families. I find that for Black and White families combined and separately, entrepreneurs have higher upward wealth mobility than do workers, while downward wealth mobility is not found to differ between entrepreneurs and workers. The regressions on only entrepreneurs found that the upward and downward wealth mobility of Black entrepreneurs and White entrepreneurs do not differ. The regressions on only workers, however, found that Black workers have less upward mobility and more downward wealth mobility than do White workers.
Observations and Implications
Can entrepreneurship among Black families reduce the gap in wealth between Black and White families in the United States? I find that Black entrepreneurs have higher wealth levels and more upward wealth mobility than Black workers. The upward wealth mobility of Black entrepreneurs is also equivalent to that of White entrepreneurs, while the wealth mobility of White entrepreneurs is greater than that of White workers. These relationships are consistent with the existence of Black entrepreneurs reducing the wealth gap between Black and White families. In each of the years observed, the existence of Black entrepreneurs reduced the wealth gap between White and Black families in the United States; that is, the Black/White ratios of mean and median wealth would have been lower if the entrepreneurs were excluded from Black family distribution.
To the extent that new Black entrepreneurs would have the same relative wealth mobility as that observed, Black entrepreneurship will reduce the Black–White wealth gap. It is not shown, however, to what extent these favorable outcomes in wealth mobility would hold for new Black entrepreneurs. Further research is needed to project whether efforts to increase Black entrants into business ownership would lead to upward mobility in the wealth of the new entrants. First, the quality of the Black entrants into business ownership would be important. Bates (2011) and Bradford (2012) for example, have discussed the substantial increases in educational and experiential backgrounds of Black entrepreneurs. To the extent that the quality of the new Black entrepreneurs is superior, increasing the growth of Black entrepreneurs will result in improving the relative wealth position of Black families. Second, the quality and quantity of programs assisting Black entrepreneurs would affect the success rate of the Black entrepreneurs and the resulting incremental wealth creation of new Black entrepreneurs. Affirmative action programs for this purpose (such as government set-asides) have existed in various state and local governments and the federal government since the 1970s. Many of these programs have been criticized as unfair and ineffective (and have been made illegal in some jurisdictions) and are now being reduced or eliminated in many government jurisdictions, including the U.S. government (see Bates, 1995; Bates, Lofstrom, & Servon, 2011; Ruffin, 1999). Bates et al. (2011), for example, have discussed weaknesses in government programs that focus on assisting Black entrepreneurs. The effectiveness of private-sector programs that enhance Black entrepreneurship has had mixed results. Black entrepreneurship can be one of the contributors to reducing the Black/White wealth gap. In addition, in the increasingly competitive world economy (Porter & Rivkin, 2012), if the United States is to sustain its economic leadership, it should provide the opportunity for those with business skills and good business ideas to actualize those ideas. Such a result will improve economic development and conditions in the United States over what they would be otherwise.
Footnotes
Appendix
Declaration of Conflicting Interests
The author(s) declared no potential conflicts of interest with respect to the research, authorship, and/or publication of this article.
Funding
The author received no financial support for the research, authorship, and/or publication of this article.