
Abstract
Some challenges communities of all sizes face in identifying the strengths and weaknesses in their regional economy include access to the data and the complexity of the models available to evaluate their regional economies. This research proposes a holistic and accessible method of industry analysis and applies it to the Boise–Nampa Metropolitan Statistical Area. By combining a quantitative quadrant method with a qualitative analyses based on focus groups and interviews, our synergistic approach not only more accurately identifies industry clusters than any isolated approaches but also more concretely examines the multidimensional links between industries and their ties. This methodology is applicable to virtually any size community to learn about its economic strengths and weaknesses and make decisions on where to target its resources for the benefit of the community.
Interest in cluster analysis for economic development in regions has been significant over the years. Knowing the strengths and weaknesses of a community’s industry clusters or economic agglomerations can provide regions with resilience to economic changes. Large and smaller economies that are able to identify their industry clusters and know their competitive strengths and weaknesses may be more adaptable and able to thwart the negative effects of economic change. One example of the value of knowing about the strengths and weaknesses of an economy and the potential to shift to new areas of production and service in a local economy is evidenced in Walla Walla, Washington. Walla Walla (population estimate 31957; U.S. Census, n.d.) had a competitive advantage in wheat production but found the need to transform its economy because global competition made its wheat crop production less competitive. Walla Walla packaged some of its natural amenities and strengths in crop production, made use of the education infrastructure at its community college, and created a new industry stronghold of wine production, tourism, and increasing restaurant and hotel attractions (Public Broadcasting Service, 2012). Walla Walla capitalized on its competitive advantage in crop production, moving from wheat to grapes. This was necessary to stay competitive, but would have been unlikely had it not built on its existing competitive advantage in agriculture and made use of its community college to disseminate knowledge about wine production.
The research highlighted in this study outlines a cost-effective approach that most communities can use to understand their local economies. A lack of resources in terms of labor skills or knowledge, or insufficient funding to acquire someone with such skills or knowledge, or limitations on data availability can impede communities from having the information they need to bolster their local economies. Our study provides an analytical approach—or more accurately a battery of tools—that reduces the complexity and thereby the resources required to perform a cluster analysis. Our approach is robust and accessible to communities lacking resources such as knowledge, funding, or data. To that end, each of the tools presented is selected based on its accessibility to practitioners. Our approach includes a quadrant analysis at the industry sector and subsector levels to identify industries that have demonstrated competitiveness in the region through resilience to employment loss, if not through growth, as well as a series of focus groups and interviews to discern which industries are heavily embedded within the region. The quadrant analysis leads directly to a better understanding of the employment needs of our study area. Thereafter, interviews and focus groups with local business owners, economic developers, and chambers of commerce representatives are detailed to provide further insight into the local economy and its industry sectors. The ultimate intent of the research is to describe and understand the current and potential future employment training that is needed to help keep a particular economic region competitive and resilient to the negative impacts of economic change. Finally, as a demonstration, we developed a cluster map for those that would want to take their analysis to that level. Our synergic approach provides the means for a robust analysis and can be adjusted for very small communities that do not have access to some types of census data. 1 Additionally, the costs that this approach imposes on local communities are marginal, as is articulated later in this study.
The study is organized as follows. We first identify and discuss why we pursue the use of a battery of tools, as opposed to one specific approach, in performing a cluster analysis to understand the strengths and weaknesses of a local economy. The next section puts forth a synergic approach, using a combination of methods to generate a holistic assessment of a community’s regional economic strengths and weaknesses. The hybrid methodology that is advanced in this study marries quantitative data with qualitative data from interviews and focus groups. Our mixed-methods approach further grounds our understanding of the multidimensionality of community employment and industry agglomerations. The next section applies these methods to the Boise–Nampa metropolitan statistical area (MSA) to demonstrate how our synergic approach can be used in practice to benefit a community. We then discuss the concerns and benefits of our synergic approach. The last section forms the conclusion.
Our Synergic Approach
Description
The approach we used to create the battery of tools we needed required determining a combination of methods that would result in the most holistic and robust findings, as well as be accessible to the greatest number of practitioners and communities. We considered data accessibility, the relative low need for funding, and the need to avoid tools that required hyperspecific knowledge, software, or technical expertise. We wanted to use both quantitative and qualitative data whenever possible to get the most complete picture of our clusters. Ultimately, we borrowed principally from Blakely and Green-Leigh (2010) and Austrian (2000) and used the validated ideas of other scholars to create a holistic, robust, and accessible method of industry cluster analysis.
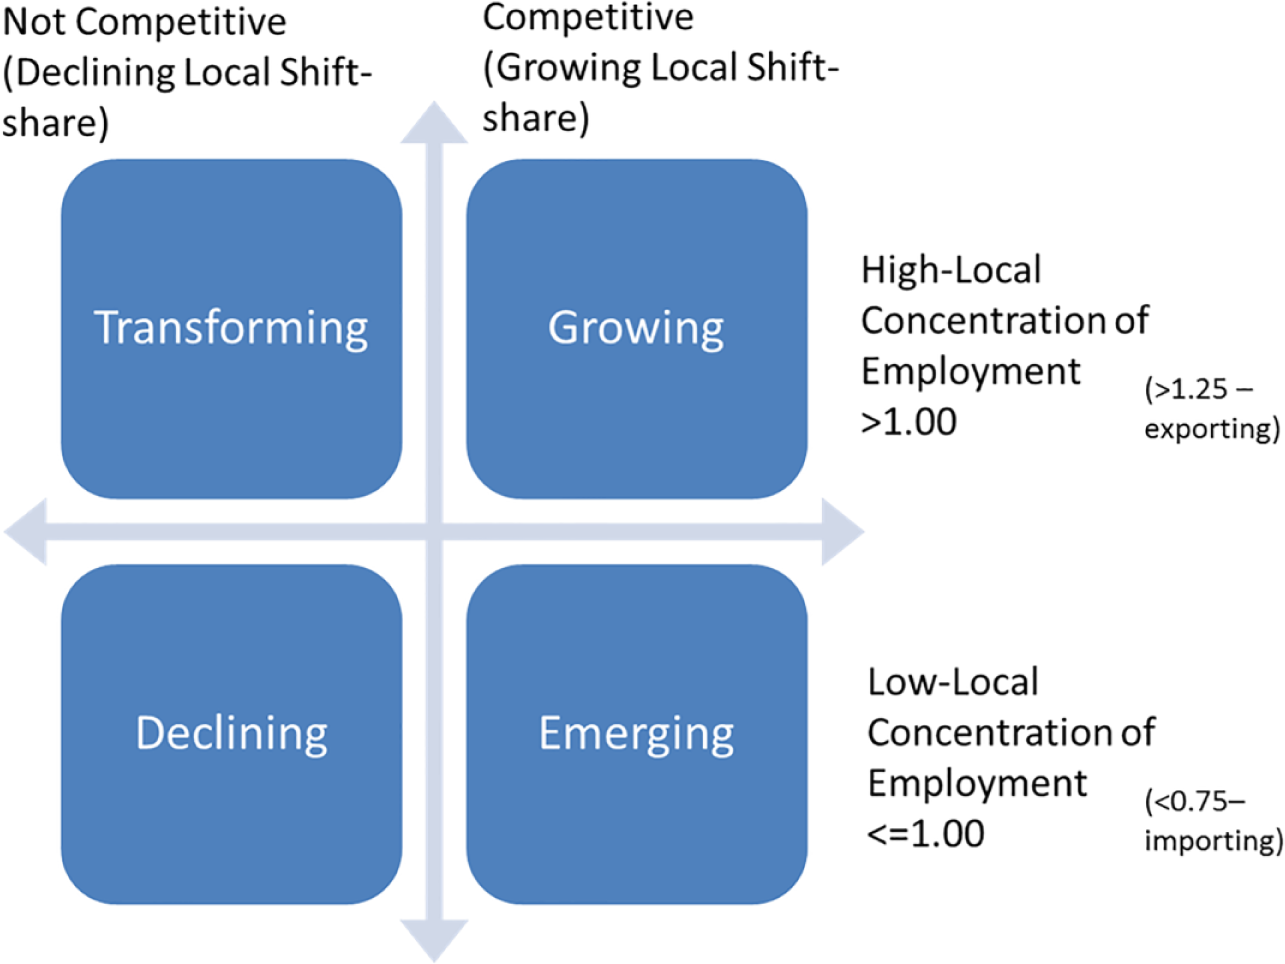
Our approach began with the Blakely and Green-Leigh quadrant method, which uses accessible data in most communities (with the exception of very small communities, because of data confidentiality requirements) to calculate location quotients and to provide national comparisons with the shift-share analysis. Blakely and Green-Leigh (2010) identified clusters quantitatively to assign industries within a region to a particular quadrant within a four-quadrant table. Their model drew on economic base theory to classify and create a cluster analysis of transforming, declining, growing, and emerging clusters. They created a four-quadrant table of noncompetitive and competitive clusters determined by low and high shift-share quotients, crossed by low and high local industry concentrations as determined by the location quotients at both the two- and three-digit industries (Figure 1). The upper half of the quadrant diagram includes industries in the area that maintain location quotients greater than 1.0. The right half of the quadrant diagram contains those industries that maintain a positive location differential, calculated from shift-share analysis. These two calculations allow for the categorization of industries into one of the four quadrants. The upper-right quadrant contains the growing base industries, the upper-left quadrant contains the transforming industries, the lower-right quadrant contains the emerging industries, and the lower-left quadrant contains the declining industries. Industries can then be grouped together based on known and obvious linkages or through other quantitative screening to develop a series of clusters. After removing inappropriate industries (e.g., nonexporter, single dominant firms), the authors then looked for related industries. Thereafter, they began to identify supplier linkages and marketing channels. They noted that using input–output tables could be helpful in identifying the supplier linkages. Finally, the authors suggested considering the local infrastructure and the way it may or may not help shape the cluster.
Quadrant method.
By applying the Blakely and Green-Leigh quadrant method, this first step of our approach not only provided information about industry strengths and weaknesses but also began to point to potential employment needs. One strength of the quadrant method is that the data required are typically readily available from the U.S. Census and the Bureau of Labor Statistics. One drawback is the restrictions that are applied to the release of data when specific employers may be identified, such as in sectors that have low employment or where one employer dominates a particular sector. The limitations of data availability may be more acute for smaller communities. Reid, Smith, and Carroll (2008) note that another drawback to location quotients is that they are specified within a particular areal unit, such as county or MSA, without regard for a neighboring unit’s industrial structure. At the same time, information on geographic models suggests this drawback may not be significant enough to affect its use.
The next step in our approach involved a qualitative analysis, which utilized the quadrant analysis to identify businesses within specific industries to contact for focus groups and interviews. Our selection criteria for participation in focus groups and interviews involved specific businesses within the industry subsectors that had a location quotient above 1.25 and a regional competitive advantage of at least 420 employees, compared with the national or industry expectations in employment changes between 2006 and 2010. The complete results and detailed tables from our quadrant analysis are available at http://career.boisestate.edu/collegiate-employmentworkforce-readiness/. In addition, we sought interview and focus group participation across the region in an attempt to provide diversity in size and geographic location as well as business diversity within the industry subsector.
Our synergic approach, which combines quantitative and qualitative research to identify and further understand the nature of clusters, is inspired by Austrian (2000). Austrian uses qualitative tools to complement the analytical analysis promoted by Hill and Brennan (2000). Austrian (2000) provides a strong framework for conducting the qualitative component of an area cluster analysis through personal interviews, the accompanying interview analysis, and the construction of a cluster map, which is a visual representation of the interactions between industries in the identified cluster. Knowledge obtained from personal interviews and subsequent analysis will produce the additional information necessary to better understand the intricacies of the industry cluster, potentially identify clusters that were not evident through the quantitative component of the analysis, and identify nonquantitative strengths or weaknesses in each cluster, such as the existence of industry collaboration or broader social interaction, or the lack thereof. Unlike a purely statistical approach, Austrian (2000) contends that “the cluster engagement phase should be based on what the companies themselves perceive as their main issues, barriers, and (ultimately) cluster composition” (p. 98, italics in original). Combining both quantitative and qualitative methods reveals the factors that shape the evolution and competitiveness of the industry structures (Austrian, 2000).
Additionally, her research investigated both existing and emerging clusters as identified by location quotients, employment growth rates, relative product, and out-of-the-region export activities. The case studies ultimately made use of descriptive data, literature on the historical development of the clusters, and interviews with cluster leaders. The interviews afforded key knowledge on the interconnections with firms, institutions, and other supporting infrastructure (Austrian, 2000). This element is especially important: If a cluster is currently competitive, it is unlikely that it will maintain its competitiveness for very long if innovation is sluggish because of a lack of social interaction or collaboration. Therefore, it is not solely the business-level interaction, such as buyer–supplier relationships but also the relational and communicative interaction (which fosters ties between businesses, educational institutions, local and state government, and other agencies) that potentially leads to innovative processes and products. Ultimately, Austrian used the cluster maps to describe the way various components of a cluster are related to one another. Although cluster maps are dynamic in terms of future connections and changes, they become the way clusters are perceived by individuals both inside and outside of the cluster. The benefit to the qualitative approach is that it allows more specific details to be gathered and provides a means to create cluster maps that can inform policy makers’ decisions. Again, conducting interviews can be labor intensive, but the unique information gained for each cluster may be invaluable for developing a tool that helps a local population better understand the strengths and weaknesses within its economy.
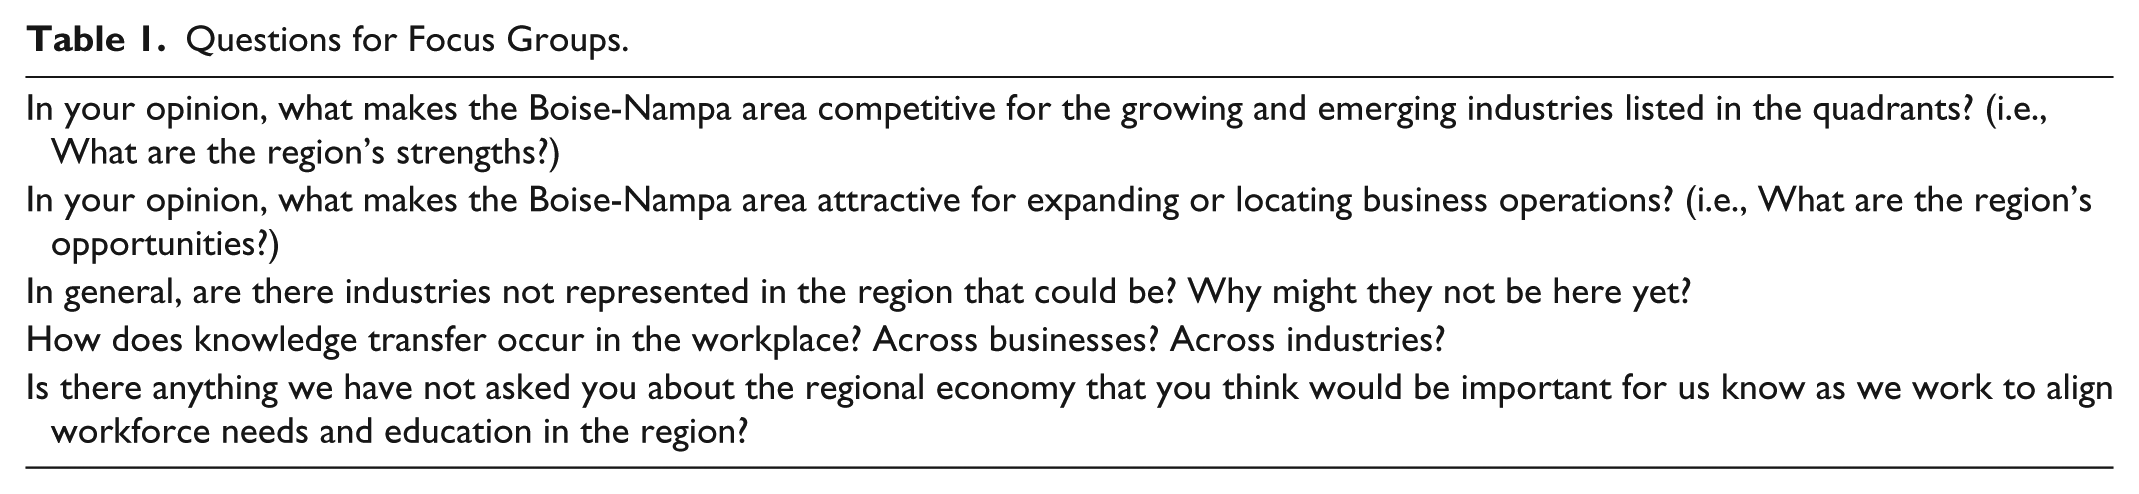
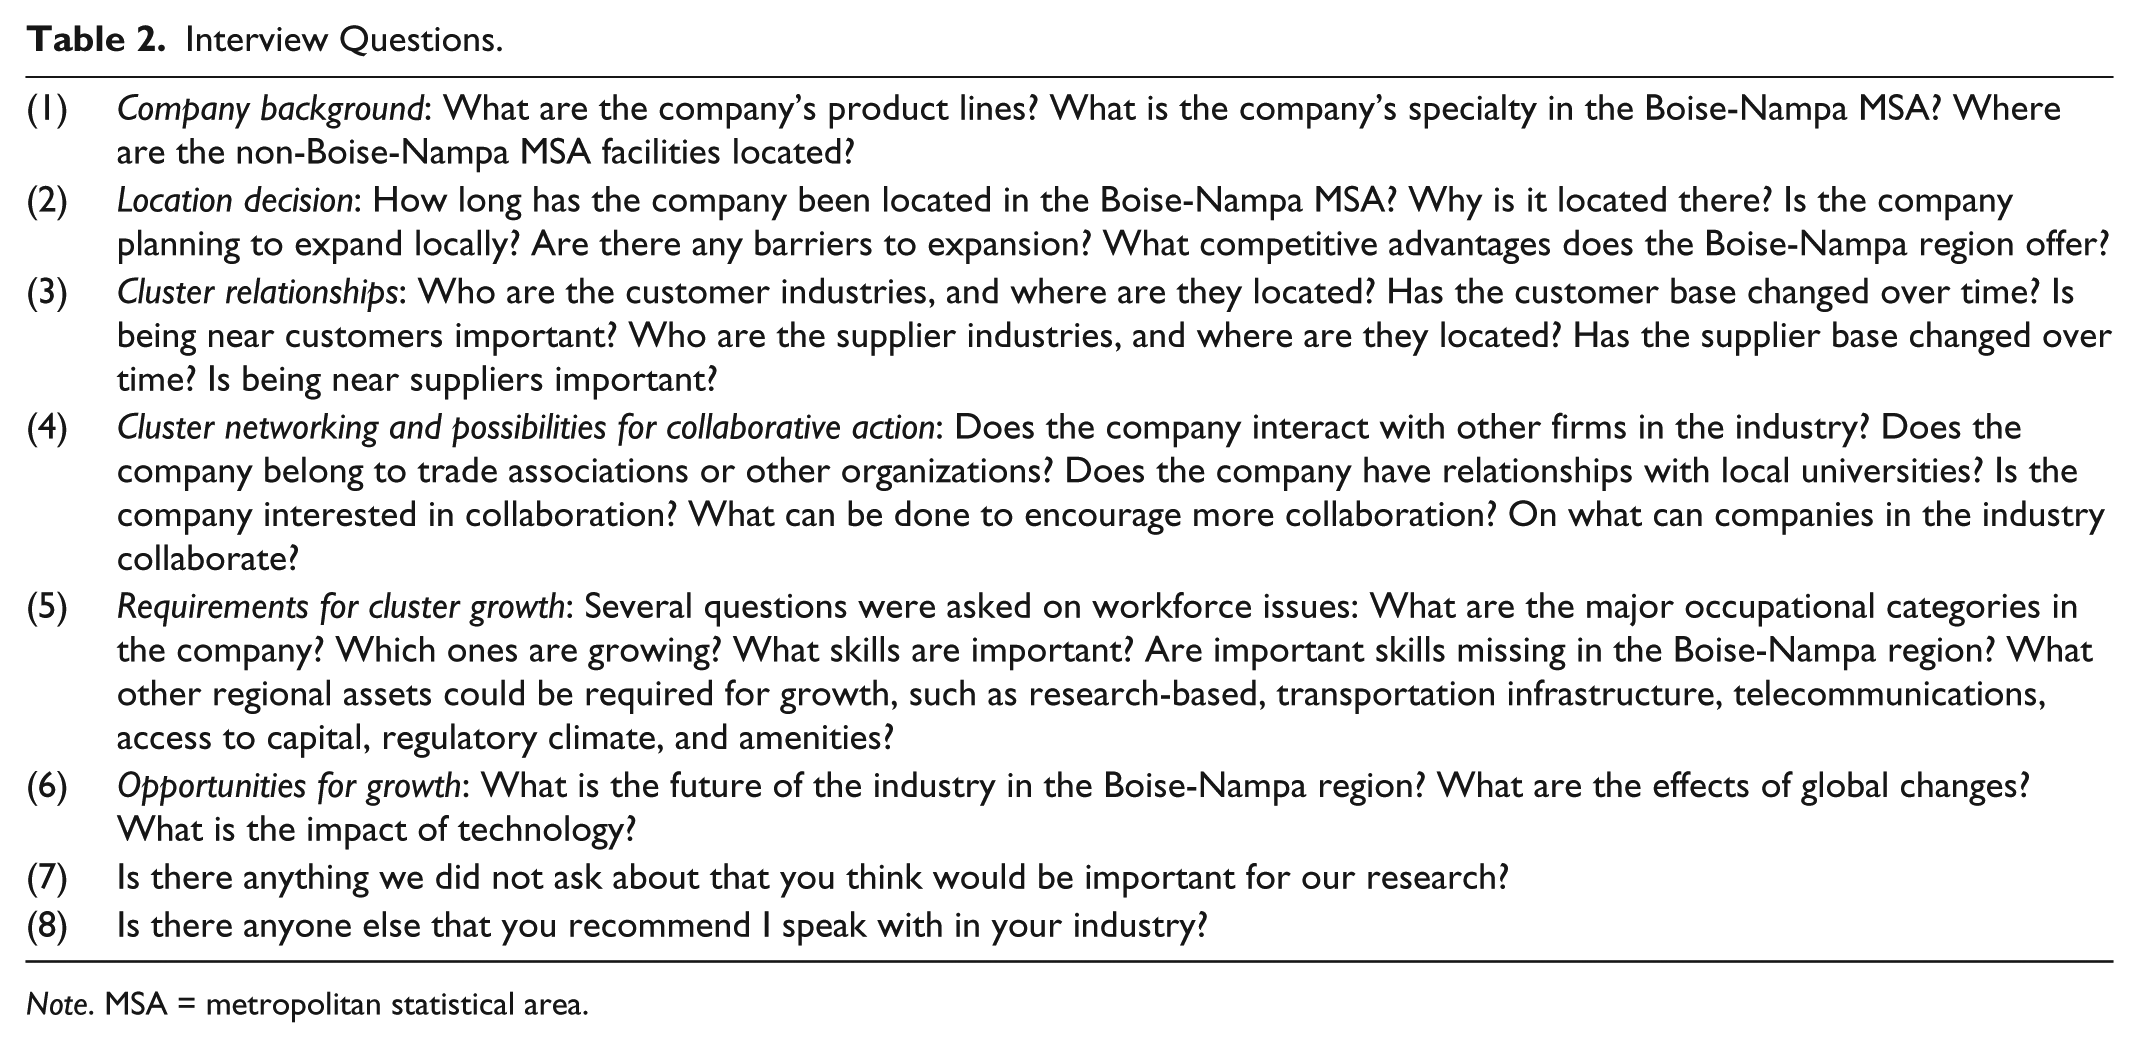
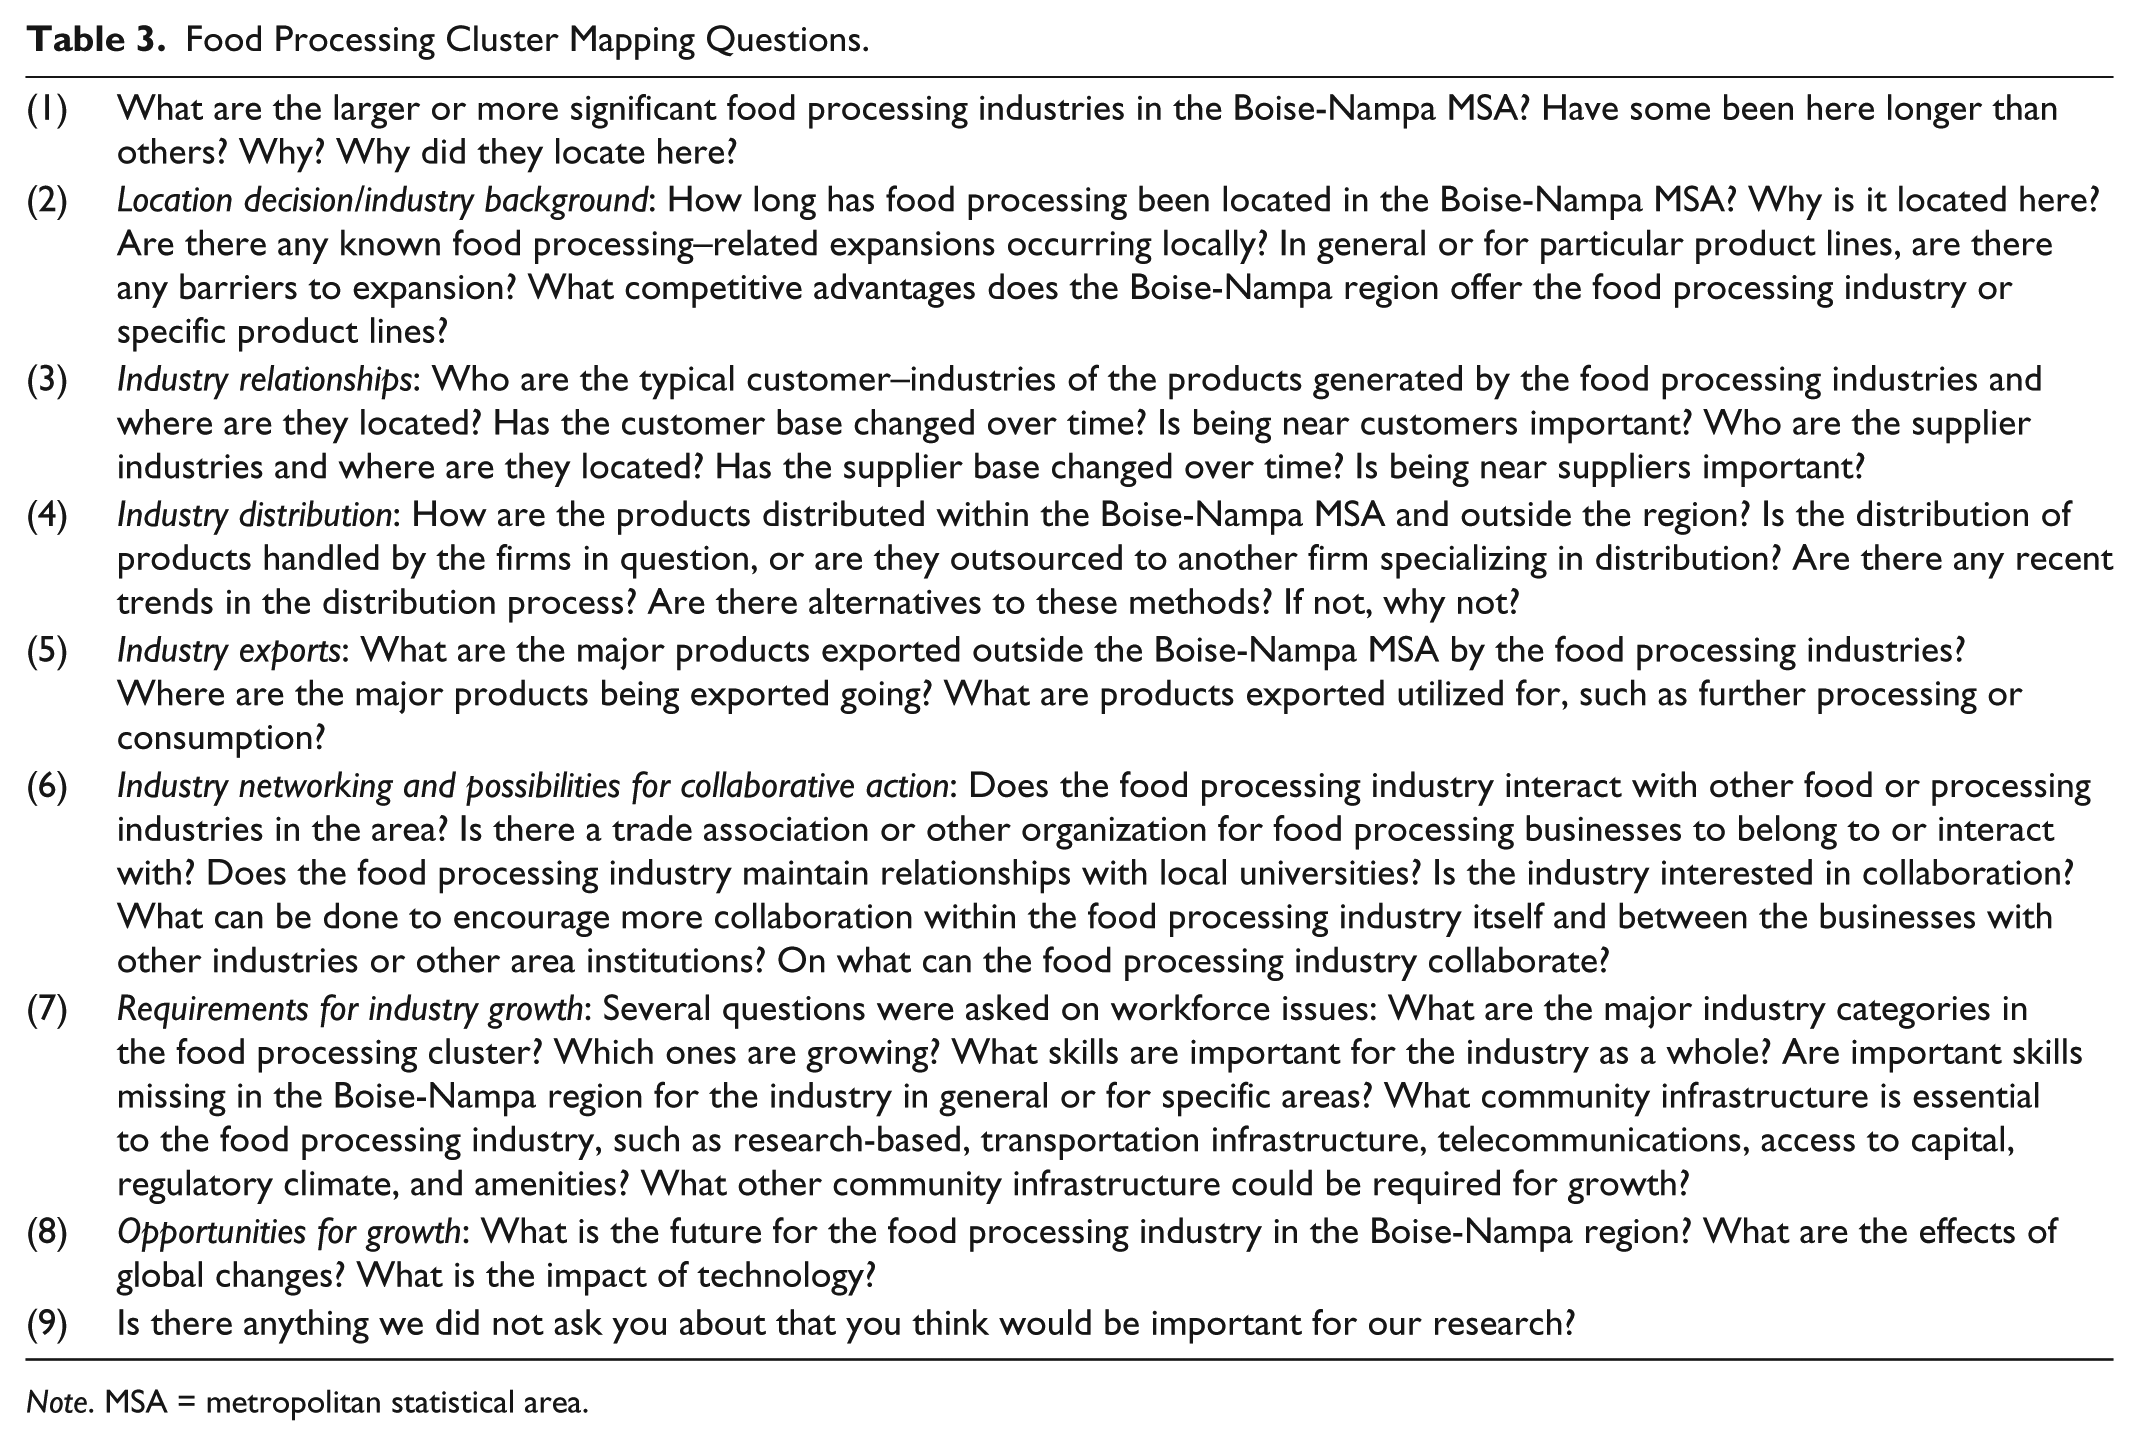
Following the quadrant analysis, the focus groups and interviews allowed us to begin to identify supplier linkages and marketing channels, and consider the local infrastructure and the way it may (or may not) help shape regional economic strengths and weaknesses. Social network analysis could have been employed at this juncture, but because we drew on the questions from Austrian’s protocol, the questions we used were not necessarily designed for use in social network analysis. Additionally, social network analysis is complex and lies outside the reach of many communities in terms of the necessary knowledge and skills. As such, we did not include it as part of our battery of tools, but we note its potential here as an option for communities that may choose to use it. The interviews also permitted the exploration of shared labor and other ways in which the industries collaborate. Prior to the interviews, relevant industry histories were developed to further our understanding and assist with the industry cluster maps. The quadrant analysis results were verified for accuracy with the interviewees and focus groups. The focus group questions were developed specifically for this methodology, as seen in Table 1. The interview questions were drawn from Austrian’s (2000) interview protocol (p. 100), with additional questions added for key interviews with people specifically knowledgeable about the interrelatedness of factors within the industry, as seen in Tables 2 and 3. The industry histories were verified for accuracy in the interviews. Emulating the cluster map method used by Austrian, we developed two cluster maps, one for the crop production industry subsector and another for the food manufacturing industry subsector, in the Growing quadrant of the diagram. We drew from information in the focus groups and key interviews with specific people who had knowledge about the interrelationships among the firms within the industries. Ultimately, the questions specifically used to create the cluster maps were drawn from Austrian’s interview protocol as well as from questions we developed (Table 2).
Questions for Focus Groups.
Interview Questions.
Note. MSA = metropolitan statistical area.
Food Processing Cluster Mapping Questions.
Note. MSA = metropolitan statistical area.
Overall, our approach used publicly accessible data (e.g., the Quarterly Census of Employment and Wages [QCEW] data set), and we complemented it with qualitative analysis (e.g., focus groups and interviews) to provide a rich understanding of the challenges and advantages, including the interrelatedness of suppliers, infrastructure, and labor needs, which would not otherwise have been acquired. Using only the quadrants would not have allowed the rich capture of the needs and interrelatedness of the economic complex. Using only interviews with no data or foundation for the regional economy would have left researchers with little information to determine systematically which industries and businesses to seek out for interviews or the knowledge of the area’s industry composition. It is for these reasons we drew specifically on tools that used publicly accessible data and were not overly cumbersome in terms of time and energy for the interviews needed to provide sufficient data to conduct our analysis.
Note that the Boise–Nampa MSA maintains employment data at the industry subsector level that is relatively easily available, which is a necessity for conducting the first-step quadrant analysis. For communities with smaller populations or those encountering other data limitations, we could perform the analysis at an aggregated geographic area and focus the qualitative component on identifying how that community fits within the economic agglomerations of the region. Another option in the places where detailed employment data are not available is to cull local knowledge. In essence, it may be more obvious to local planners and professionals what the industry strengths are in these smaller communities, and thus, it may not be as necessary to formally create the industry quadrants. In smaller communities, local planners or economic development professionals could sketch their own quadrants from what is widely known in the community about the industries, even if they cannot be explicitly drawn from data.
The Application of Our Synergic Approach to the Boise–Nampa MSA
In the application of the methodology, both two-digit and three-digit industry employment data, as classified by the North American Industry Classification System (NAICS), were obtained from both the Bureau of Labor Statistics website and correspondence with the Idaho Department of Labor. Average annual employment by industry from the QCEW data set for the nation and the Boise–Nampa MSA between 2006 and 2010 was used to calculate the local shift component of the quadrant, while the 2010 QCEW data alone were used to calculate the location quotients. Since we initiated our research in September of 2011, the 2010 data were the most recent data available at the time. The computed local shifts and location quotients are used to classify our four quadrants: (a) Transforming, (b) Growing, (c) Emerging, and (d) Declining industries. For location quotients, the thresholds of 0.75 and 1.25 were used, since they are the accepted rule of thumb in terms of cutoffs for the methodology.
Using the information from both two-digit and three-digit quadrants, we scheduled focus groups with local economic developers, chambers of commerce, and business owners or representatives of specific businesses that are classified as exporting industries in the Transforming and Growing quadrants. Exporting industries are identified as those industries maintaining a location quotient greater than 1.25. Industry-specific businesses were identified using the online business directory provided through the Idaho Department of Labor, which included those businesses having voluntarily elected to provide information, such as NAICS, residing county, and employment range. 2 One industry, Heavy and Civil Engineering Construction, did not produce any business contacts. In light of this, the business directory within the Idaho chapter of the Associated General Contractors of America website was utilized to identify businesses operating in the Boise–Nampa MSA. A total of five structured focus groups were conducted. We deliberately aimed to have small groups of four to six people per group to ensure an opportunity for all attendees to participate and still provide time to explore responses in more depth during the 2-hour sessions. After contacting 11 to 16 businesses and agencies as deemed necessary for each type of focus group, we obtained commitments from five to six people for each group. The lead researcher, who is an experienced facilitator of focus groups, conducted all five sessions. Two other researchers took notes to help identify themes and make sure all the data were captured—not just on the flip charts but also in note form, as well as electronically recorded for analysis thereafter. Two focus groups were composed of chambers of commerce representatives and local economic developers at the city and regional levels; there were five participants in the first session and three in the second session. The remaining three focus groups were industry specific, including only business owners or representatives of firms within a particular industry at the two- or three-digit NAICS level. As there were a few no-shows in each session, there were three participants for two of the industry-specific focus groups—Agriculture industries and Administrative and Support Services industries—and only one participant in the third session on Computer and Electronic Product Manufacturing industries. While each of the business owners or representatives contacted to participate in a focus group was from the same industry at the two-digit NAICS level, the businesses were diversified by employment sizes, geographic locations (counties within the MSA), and industry specializations at the four-, five-, or six-digit NAICS level. Focus group participants were asked a series of questions on area competitiveness, opportunities for industry diversification, business expansion, and knowledge transfer (see Table 1). The information gained through the focus groups provided insight into the economic strengths and weaknesses of selected industry sectors in the region. Following the completion of focus groups, we reviewed the two note-takers’ notes, audio recordings, and information written on the flip-chart paper. The information was then summarized to identify recurring themes among all participating groups.
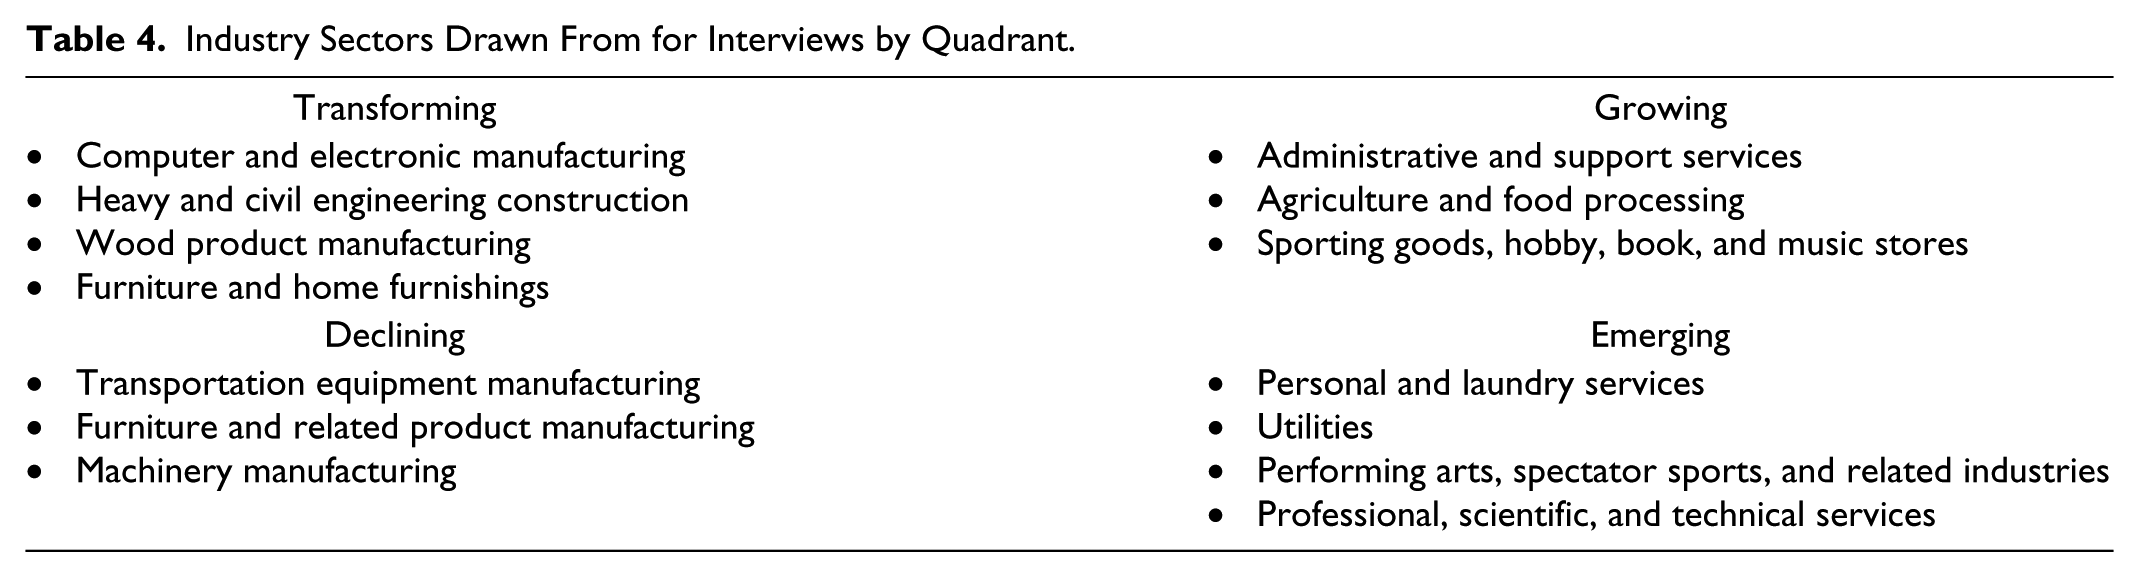
Interview participation was sought across quadrants to provide further understanding of the economic strengths and weaknesses of the region. The selection criteria involved diversity in size and geographic location, as well as business diversity within the industry subsector. The method for identifying key industries in each quadrant differed somewhat. For Transforming and Growing industries, the businesses selected for interview maintained location quotients greater than 1.25 (i.e., exporting industries). The Emerging industry interviews included those industries that maintained the highest local shift change between 2006 and 2010 and a location quotient of between 0.75 and 1.00. To determine a sufficiently high local shift, industries in the Emerging quadrant were sorted from highest to lowest local shift, and a cutoff point was imposed where a noticeable break in the local shift figure between industries occurred. In this research, nine industries were obtained, and the cutoff occurred when the local shift negatively changed from one industry to the next by nearly 50%. For the category of Declining industries, the two-digit industry code was first used to identify the industry that experienced the largest employment loss—in this case, 31-33 Manufacturing. Within the parent 31-33 Manufacturing two-digit industry, the three-digit industries with the largest decline in terms of the local employment shift share were then selected according to the three-digit industry quadrant. Again, through the Idaho Department of Labor, we utilized the business directory to identify businesses within each selected three-digit industry. Prior to conducting interviews within the identified industries, we read a brief industry history to interviewees to further vet the accuracy of our data-driven quadrant analyses in terms of understanding their specific industry. With the above selection criteria and within the nine primary industry areas, we identified 14 subsector industries for interviews (see Table 4). It was not possible to conduct interviews with representatives from all industries listed in each segment of the quadrant diagram at the three-digit NAICS level; however, key businesses were sampled from each industry. We attempted to obtain diversity in the size and geographic location of the businesses from which we drew the interview subjects. After we identified establishments, we first called them and then followed up with e-mail to either ask for their participation (with confirmed date, time, and location) or sent them the interview questions in advance of the interviews and requested a confirmed date, time, and location. Only about half the industries contacted permitted an interview. The three researchers went to the establishments of the interviewees to conduct the interviews. Each interviewee was asked to complete a consent form and then was asked whether he or she was willing to have the interview electronically recorded. All interviewees agreed to be electronically recorded, but the researchers also took handwritten notes during the course of the interviews. All interviewees were assured that the interview would last 1 hour or less. Interviews only exceeded that time limit if the interviewee wanted to continue the session or give a tour or demonstration of the work or production that went on at his or her establishment. In the end, we achieved a cross-sample of industries within each group and made every attempt to get more than one business from each industry. Ultimately, the data obtained proved to be sufficient to glean insights into some of the strengths and weaknesses of the regional economy. Additionally, the snowball method was then employed to identify potential future interviewees that might be helpful in further understanding each of the respective industry ties.
Industry Sectors Drawn From for Interviews by Quadrant.
In the final stages of the methodology application, one industry subsector was selected for the creation of two cluster maps within the subsector of Food Processing. Interviews were conducted with key people, identified through previous interviews as knowledgeable about the factors related to interconnectedness within the industry.
Interview questions were tailored to the development of cluster maps, as adapted from Austrian’s methodology. In addition, we asked questions about requirements for industry growth and the impacts of technological and global changes to identify threats to the competitiveness of the clusters in the region. The cluster maps generated through the interviews illustrate the respective cluster through six categories of information: (a) Final Markets, (b) Distribution Channels, (c) Export Services, (d) Suppliers, (e) Specialized Community Infrastructure, and (f) Threats. The Final Markets category lists the various markets for which the respective clusters’ products are consumed and whether this is for further processing or consumption. The Distribution Channels category provides the means by which the product is transported to and from businesses within the cluster. The Export Services category contains the products produced by the cluster and exported out of the region. The Suppliers category contains the industries that supply the raw and other materials necessary for product creation. The Specialized Community Infrastructure category provides the infrastructure, which is integral for cluster operations. Finally, the Threats category provides any dependencies that threaten the economic viability of cluster expansion or the general operations in the region.
The cluster maps in Figures 2 and 3, for Frozen Potato Processing and Dairy Processing, describe linkages between industries that form two examples of food processing clusters in the Boise–Nampa MSA. The cluster maps describe not only the final markets for the products but also the distribution channels for each food processing structure and the final products. Suppliers and specialized community infrastructures are also identified. Finally, the interviews reveal potential threats to the success of these food processing industries.
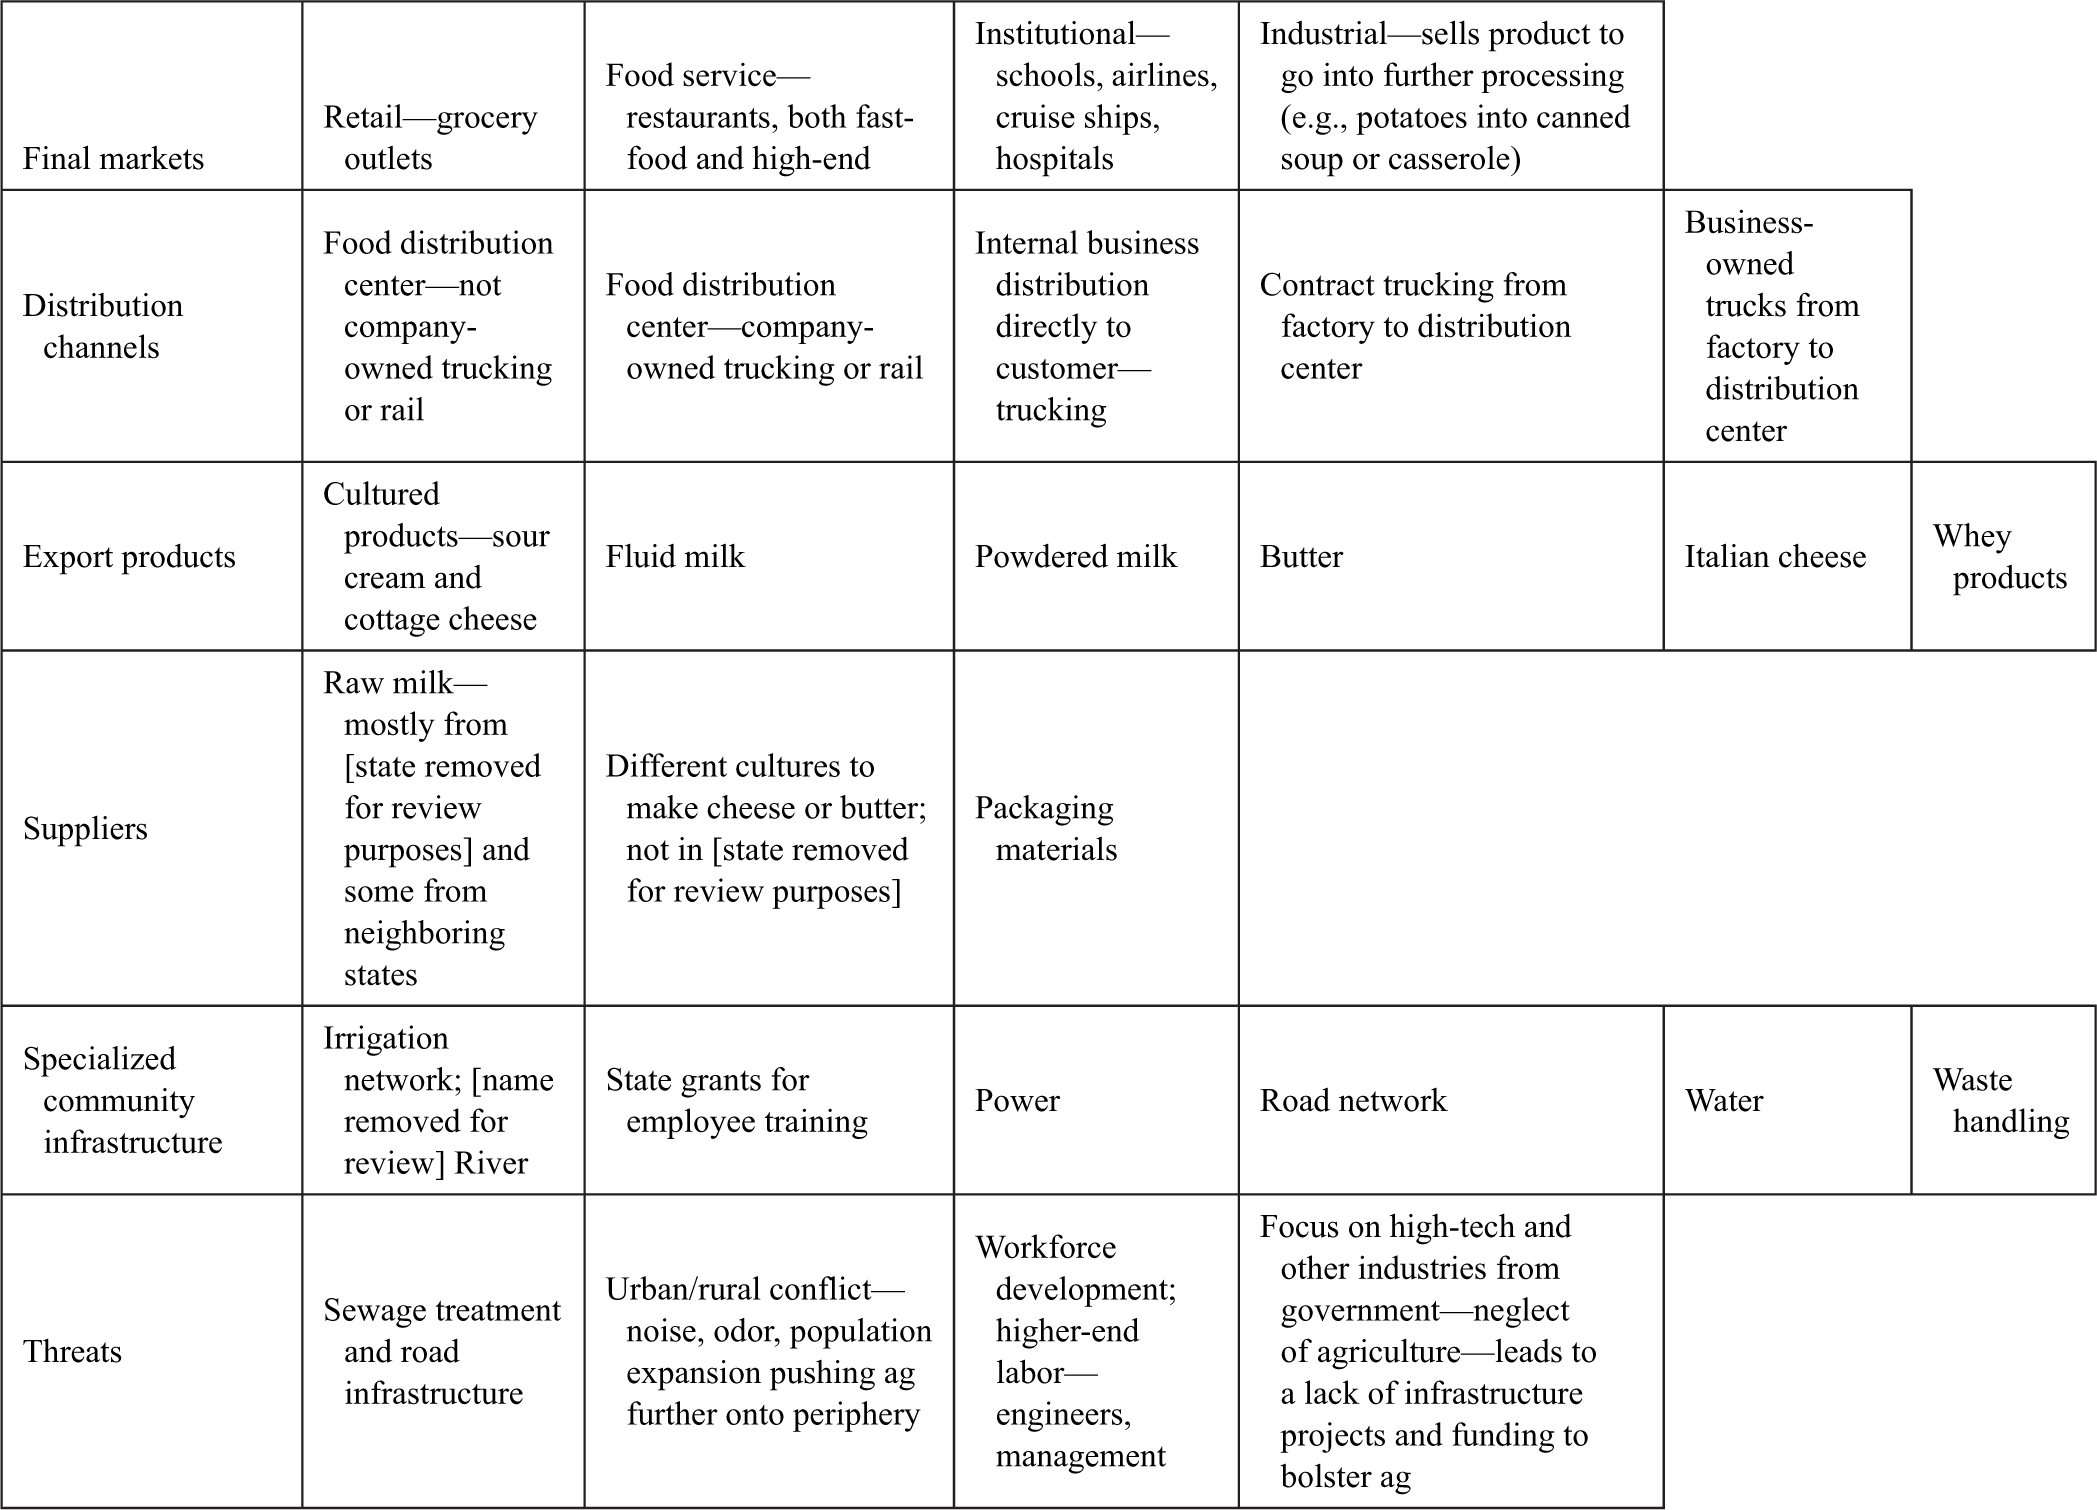
Cluster map of dairy processing in Boise–Nampa MSA.
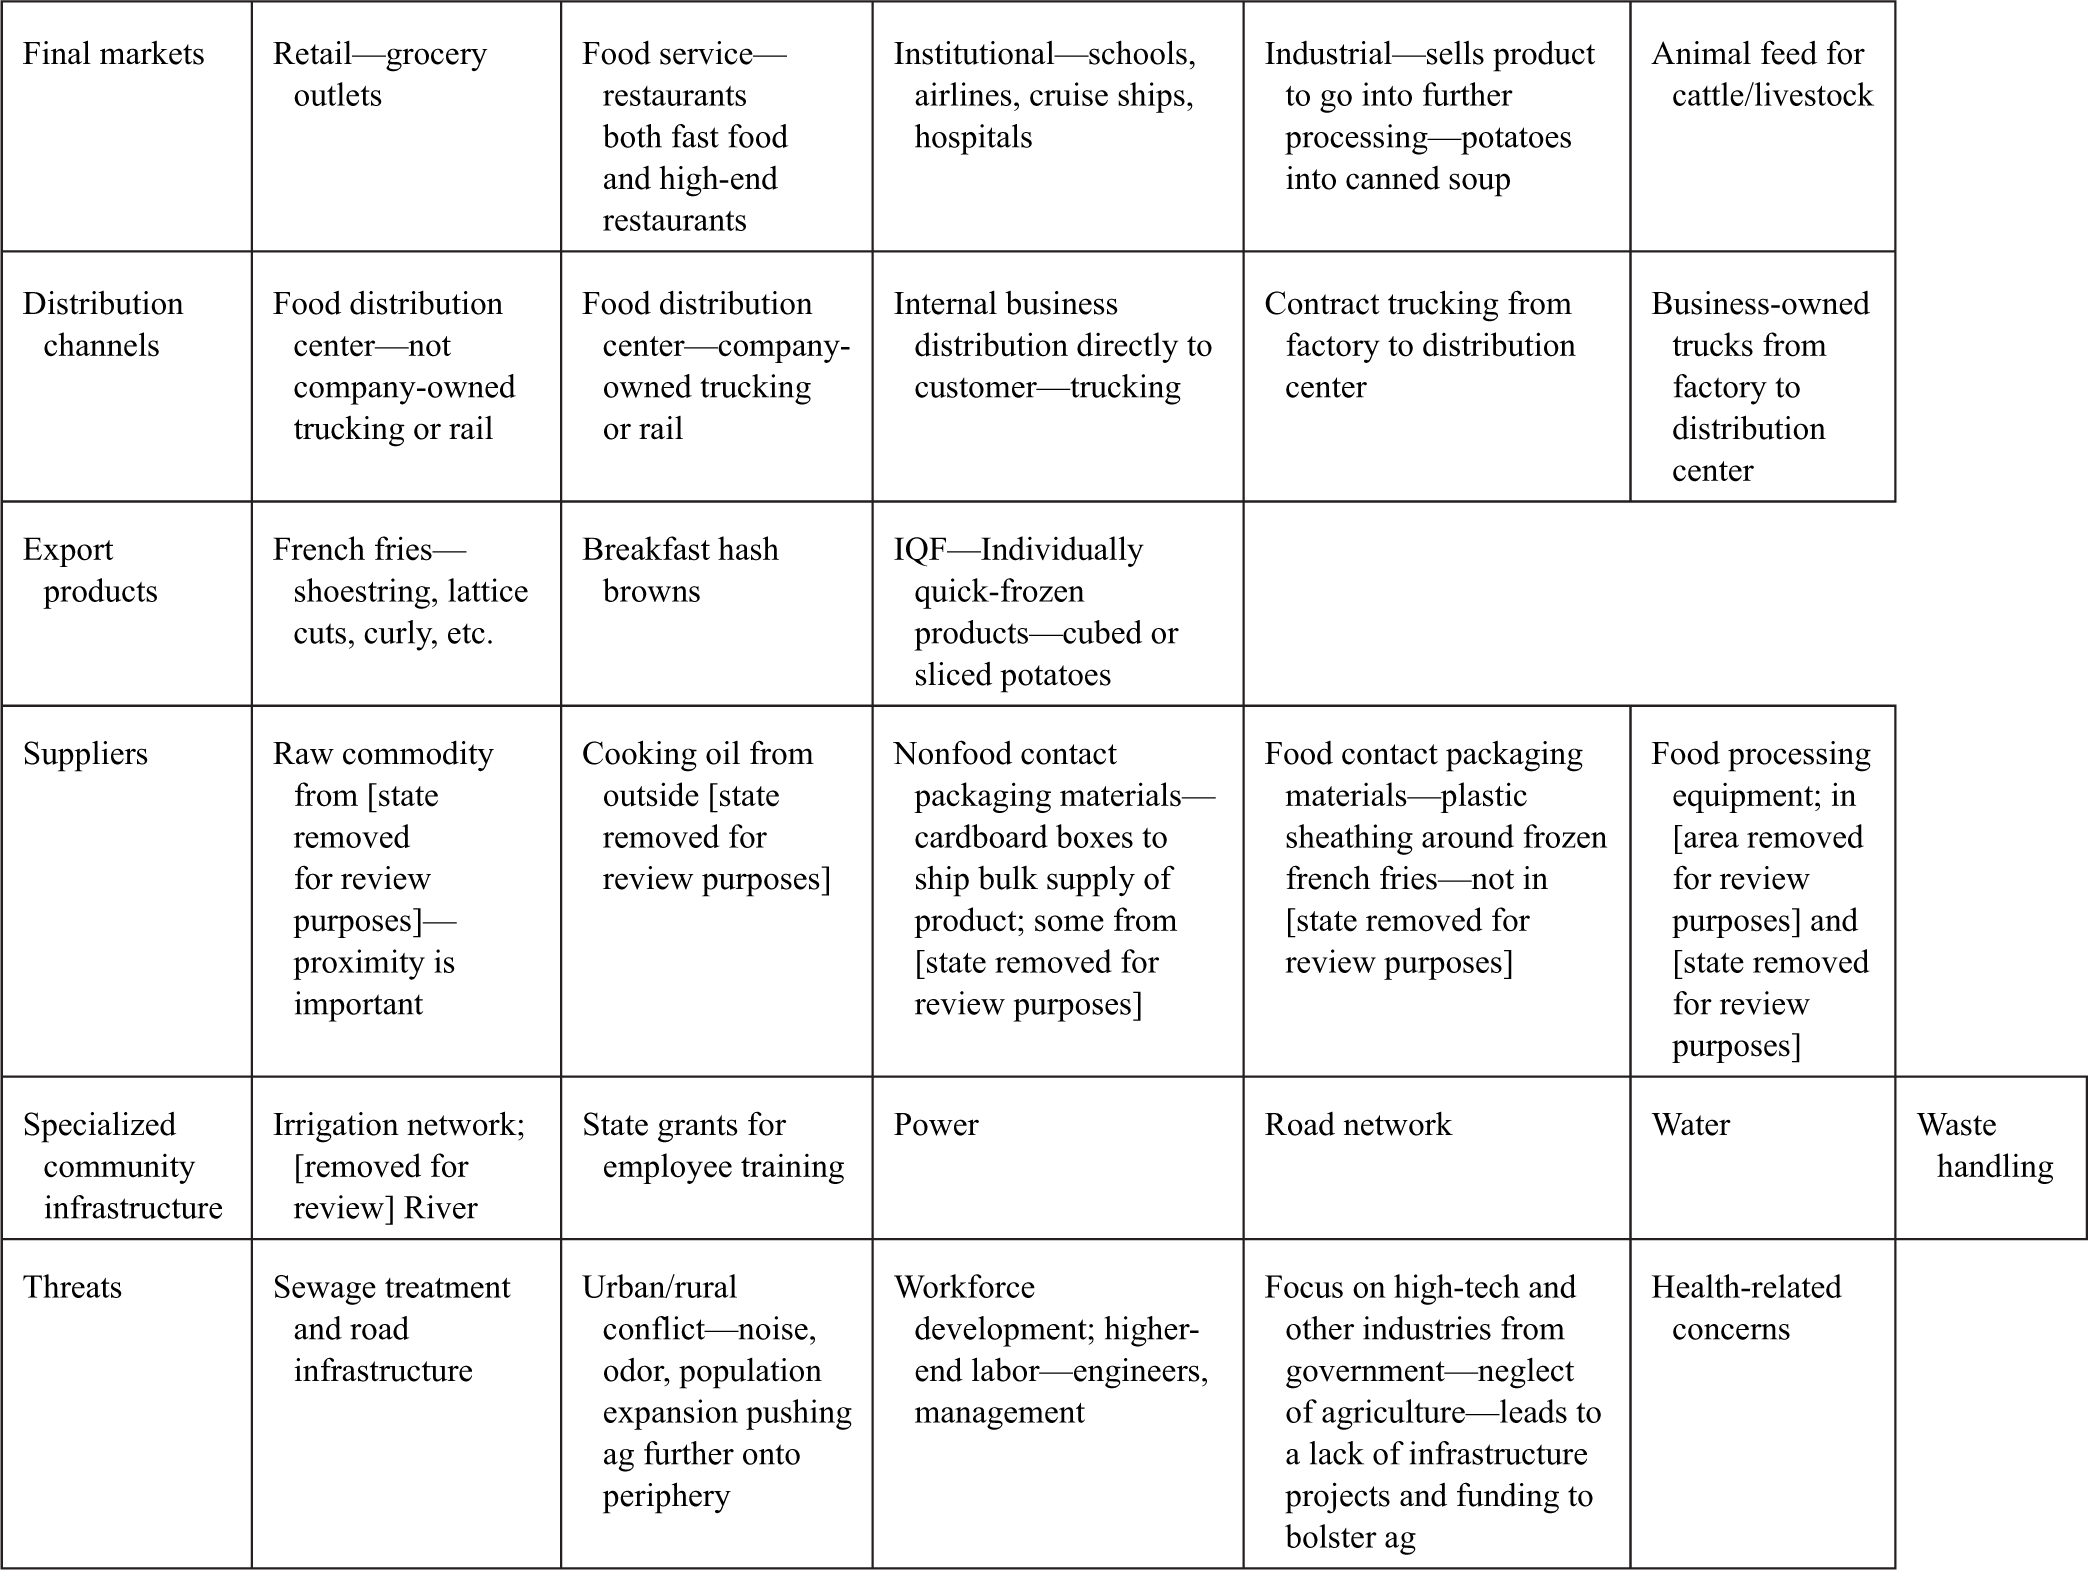
Cluster map of frozen potato processing in Boise–Nampa MSA.
Potential Concerns and Benefits of the Synergic Approach
An obvious critique of our hybrid approach is that it could be more mathematically driven. In recent years, one approach that gained significant attention was the mathematically driven cluster analysis put forth by Hill and Brennan (2000). Hill and Brennan created a sophisticated data-driven model employing not only traditional methods from economic base theory, such as location quotients and shift-share analysis, but also statistical techniques of cluster analysis and stepwise discriminate analysis to identify drivers of the economy. The methods are sound but difficult to employ without access to the necessary data. In their analysis, Hill and Brennan also made additional investigations using input–output models to identify linkages within regional industries. They used statistics as the driving force in identifying the clusters. This methodology is one of the most comprehensive quantitative models for performing cluster analysis, but even the authors note that they were fortunate to obtain access to the detailed establishment-specific data utilized in their analyses (Hill & Brennan, 2000). As such, the complexity and data requirement of Hill and Brennan’s model renders it less usable for many communities than other approaches.
Held (2004) replicated much of the Hill and Brennan (2000) methodology in a comparison across seven metropolitan regions. Even after he purchased data through IMPLAN for regional coefficients, he felt the information was not precise enough to make the buyer–supplier linkages and chose to let policy makers explore those linkages. In Hill and Brennan’s (2000) study, they struggled with making specific thresholds in their discriminant analysis, and this resulted in Held’s needing to create his own decision-making rules to ensure consistency across the seven metropolitan regions. As such, it illustrates that even highly mathematically driven objective analysis may take on some subjective or non–data-driven decision making when applied in practice. This being the case, perhaps a simpler, more transparent model would be just as effective and at the same time more accessible to communities competing in a global era.
Peters (2005) also made use of Hill and Brennan’s (2000) methods and occupational data, but instead of industries, he used the method to develop industry–labor complexes to explain why certain industries are drivers. Using multivariate analysis of variance and discriminate function analysis, he grouped together labor complexes that would not be hidden in smaller economies. This process culminated in an outcome similar to cluster analysis in which it tends to be drawn to the core of regions as opposed to the periphery. However, the focus on labor is more easily amended by policy changes, by which actions can be directed at public–private partnerships in training to assure a skilled labor force, or at marketing for industry that can use the skills of a particular labor complex. Peters’s (2005) approach recognizes the knowledge spillovers among industries with a shared labor force that occur both formally and informally among skilled workers or mobile labor. Although the data Peters used are more readily available than that of Hill and Brennan (2000), the ability to determine the valuable labor complexes requires a rather sophisticated mathematical analysis. In short, some models have become so complex that the technical expertise needed to conduct the analysis may be beyond a community’s reach.
Additionally, there is also no agreed-upon methodology for identifying clusters (Blakely & Green-Leigh, 2010; Boschma & Kloosterman, 2005; Koo, 2005; Martin & Sunley, 2003; Reid et al., 2008). Most models have a theoretical underpinning that drives the focus of the “glue” for what makes a cluster. That glue can include factors such as geography, knowledge transfer, labor supply, or buyer–supplier linkages (Koo, 2005). Industry clusters share scale, scope, and activity complexity (Parr, 2002). As such, industry clusters are complex agglomerations that share horizontal, lateral, and vertical integration (Martin & Sunley, 2003; Parr, 2002). Most models that attempt to identify industry clusters by focusing on one or two of these “glue” aspects at a time. As a result, most models, no matter their sophistication, do not portray the complete picture or dynamics of the industry cluster.
Our synergic approach that integrates quantitative analyses with focus groups and interviews is relatively simple to conduct and thus has a big advantage for smaller to medium-sized communities that are facing a lack of resources (e.g., they lack the necessary knowledge, skills, and data availability to perform their own analysis, or the financial means to obtain an analysis from a third party). Moreover, our synergic approach is able not only to more accurately identify industry clusters than any isolated approach but also to more concretely examine the multidimensional links and ties between industries.
The first part of our synergic approach—the quadrant method—takes advantage of the publicly available data from the U.S. Census and the Bureau of Labor Statistics. Through location quotients and shift-share analysis, the quadrant method is a less sophisticated mathematical analysis that does not require a high level of technical expertise to conduct; thus, all communities may be able to take advantage of it for their economic development policy. The quadrant method is able to identify existing clusters that may require a closer examination of potentially emerging clusters for our regional economy. Therefore, it has the advantage of providing a base (i.e., national employment) for comparison and a starting point for understanding the comparative advantages of a regional economy. However, while the quadrant method may identify industry clusters, using this method alone does not explain the linkage between clusters; thus, it is insufficient to reveal the unique qualities of the regional industry network. For example, it ignores gaps in the supplier chains. The gaps in the supplier chains could also provide valuable information about local comparative advantages and point to where key sectors could be interacting and sharing labor with local cluster firms.
The second part of our synergic approach—qualitative analyses based on focus groups and interviews—substantially complements the quadrant method and provides in-depth knowledge that is difficult to discover any other way. First, although the quadrant method is able to identify emerging industries, the qualitative analyses may be helpful to identifying industry clusters that are in the process of forming but do not show up based on currently available data. The focus groups and interviews also help vet findings from our quantitative industry cluster analysis. Second, our qualitative analyses augment what we know about the way clusters work (i.e., the factors that shape the evolution and competitiveness of the industry clusters) as well as the issues faced by different industry clusters. Through the focus groups and interviews, we are able to identify supplier linkages, marketing channels, shared labor force, and local infrastructure needs that would not have been attained from the quadrant method alone yet are clearly critical to the prosperity of our industry clusters. Third, the focus groups and interviews provide us with a more comprehensive understanding, from the participants’ perspective, of the challenges and advantages, as well as the interrelatedness of suppliers, infrastructure, and labor needs. Focus groups and interviews also provide a great opportunity for companies to speak to researchers and policy makers on what they perceive as their cluster composition, as well as on the main issues and barriers faced by their clusters.
Our synergic approach paints a picture of the industry clusters and the linkages within and between these clusters. Using existing data, the quadrant method provides a sound foundation for the classification of industry clusters. The focus groups and interviews afford key knowledge on the interconnections with firms, institutions, and other supporting infrastructure. They also provide a means to create cluster maps that can inform policy making. The information gained from our synergic approach is invaluable for developing a tool that could help a local area better understand the strengths and weaknesses in its economy.
In addition, compared with the more mathematically and theoretically complex approaches, our synergic approach could be applied on a more cost-effective basis in a smaller community or region. In our project, we organized five focus groups to meet with the Chamber of Commerce, economic development agencies, and industry representatives, as well as more than 25 interviews with business owners and managers. The total time spent by three researchers on focus groups and interviews, including planning and managing the process as well as time in the field, was roughly 110 to 120 hours. The people we invited were willing to participate in focus groups and interviews without any monetary incentives. Indeed, the total cost of conducting this project was marginal. We believe this is an important advantage for smaller to medium-sized communities with limited budgets.
Finally, in contrast to the more mathematically driven approaches that few understand, the transparency of our approach creates an accessible methodology that gives a community a greater “on the ground” understanding of its local economy. When the local community takes the initiative to study its own economy, civic leaders not only understand the outcomes of the analysis better, but they also develop important business contacts and are able to complete a cost-effective analysis as compared with taking a more mathematical approach. Furthermore, the focus groups and interviews can lead to better community “buy-in,” as businesses and individuals become an engaged part of the process of understanding and analyzing the economic cluster dynamics in their community.
Conclusion
The synergic approach applied in this research holds the opportunity for virtually any size community to know more about its economic strengths and weaknesses and get a sense of where to target its energies to improve its industry subsectors in each of the four quadrants. In doing so, this research subscribes to the approach proposed by Peters (2005) when examining labor complexes in Missouri. Following Peters’s approach makes it possible to learn more about labor and knowledge spillovers within a region’s shared labor force.
In summary, the benefits of our synergic approach are multifold. Our quadrant analyses highlight a variety of employment opportunities that may be needed by different industries (complete results can be accessed at http://career.boisestate.edu/collegiate-employmentworkforce-readiness/). Yet without coupling quantitative analyses of industry sector- or subsector-level employment data with specific employer needs through focus groups and interviews, it is difficult to understand the linkage within or between industries, as well as to predict the demand for specific fields or occupations—and therefore the demand for a shared labor force in the region. Our synergic approach is a more prudent method to project future regional workforce needs through interviewing those companies from four quadrants (Emerging, Growing, Declining, and Transforming) of industry sectors and subsectors on how they fit with the current workforce, what benefits the region is offering them, and what challenges the industries are facing.
The cluster maps derived from focus groups and interviews also help demonstrate the interconnectedness of industries and the sufficiency of regional resources, including labor and infrastructure. The maps eloquently demonstrate the way a community’s industries and resources are interrelated and how they foster economic development in the community. They may be of use to identify potential strengths that would allow for new industries to be developed and for businesses to innovate. More sophisticated methods such as social network analysis, in addition to interviews and focus groups, could be employed to help identify the direction and strength of the linkages and potential areas that may be ripe for fostering new businesses or innovations. Perhaps most important, this methodology provides a battery of tools for communities of all sizes, especially those with limited resources and technical skills, as they prepare themselves for a global era of competition and transition.
Footnotes
Acknowledgements
The authors would like to thank the reviewers for their helpful comments.
Declaration of Conflicting Interests
The authors declared no potential conflicts of interest with respect to the research, authorship, and/or publication of this article.
Funding
The authors disclosed receipt of the following financial support for the research, authorship, and/or publication of this article: The orignal research was funded by a grant from the Office of Research and Economic Development at Boise State University to assist its Career Center with a study on collegiate employment/workforce readiness.