
Abstract
Individual-level research has found self-employment positively linked to regulations that facilitate health insurance access outside the large group market. Since self-employment can aid regional economies, if such a relationship holds at the state level, insurance regulation may bolster state economic development. Yet such regulations may spawn high insurance premiums, which can depress self-employment. This study tested whether state self-employment rates from 2009 to 2011 related positively to states’ use of “guaranteed issue” mandates in the individual and small group markets from 2008 to 2010. These mandates require insurers to offer coverage to all applicants. Self-employment rates are measured as the share of the nonagricultural labor force self-employed, and alternately as the number of individual proprietorships per 1,000 population. Both measures are statistically higher in states that mandate guaranteed issue for groups of one in the small-group market than in states that do not; however, they are insensitive to individual market-guaranteed issue and inversely related to premiums.
Approximately 10.1% of working Americans are self-employed (Hipple & Hammond, 2016). Self-employment can enable professional “self-realization” (Carree, van Stel, Thurik, & Wennekers, 2002, p. 274) and offer income to people facing job market discrimination (Bashir & Chawdhry, 2014), disabilities (Ipsen, Arnold, & Colling, 2005), unemployment (Beckhusen, n.d.), aging (Cahill, Giandrea, & Quinn, 2013), and caregiving roles (Clark & James, 1992; Vanderkam, 2009). Beyond these forms of private value, self-employment can buoy subnational economies (Bashir & Chawdhry, 2014; Loveridge & Nizalov, 2007; Rowe, Haynes, & Stafford, 1999; Rupasingha & Goetz, 2013; Stephens & Partridge, 2011). Scholars of regional economic development routinely call for more research on public policies’ impacts on self-employment rates (Goetz & Freshwater, 2001; Low & Weiler, 2012; Stephens, Partridge, & Faggian, 2013).
State-level public policies that may influence self-employment thus merit study (Goetz & Freshwater, 2001; Goetz & Rupasingha, 2011). Health insurance regulations are a key example. In the United States, large-group insurance often carries less cost to the individual and less intensive underwriting than small-group or nongroup (individual) coverage (Blumberg, Corlette, & Lucia, 2013; Buchmueller & Monheit, 2009; Heim & Lurie, 2014a). “Job lock” studies have found that many people retain full-time work with a large organization to retain large-group coverage (Gruber & Madrian, 2002; U.S. Government Accountability Office [GAO], 2011). 1 Yet state regulations that govern insurance access in the small- and nongroup markets, where the self-employed can shop for insurance, may create substantial subnational variation in this scenario.
State insurance regulations’ connections to state-level self-employment patterns nonetheless remain unclear. Some individual-level studies find self-employment positively linked to state regulations that foster insurance access in the small- and nongroup markets (Becker & Tüzemen, 2015; DeCicca, 2010; Heim & Lurie, 2013; U.S. GAO, 2011), although others do not (Heim & Lurie, 2014a; Heim & Yang, 2014). Studies of state self-employment rates’ ties to insurance regulation also give contradictory results (e.g., Blumberg et al., 2013; Heim & Yang, 2014). For this reason—and since individual and aggregate policy reactions can differ (Shirvani, 2015)—more state-level research on self-employment’s link to small- and nongroup insurance regulation is needed.
Using panel data from 2008 to 2011, this study tests whether state guaranteed-issue (GI) mandates in the small- and nongroup markets correspond to higher self-employment rates. GI requires private insurers to offer an applicant insurance of some form and price, regardless of health status (Kaiser Family Foundation [KFF], 2012a). GI does not mandate coverage of all conditions (Blumberg et al., 2013; KFF, 2012a) and does not limit plan cost (Corlette, n.d.; Gruber, 2010). However, absent GI insurers may entirely reject applicants with preexisting conditions (Corlette, n.d.; KFF, 2012a). In the individual market, GI ensures that people unconnected to a group can obtain an insurance offer. In the small-group market, GI gives this assurance to people from small firms. If applied to “groups of one” in the small-group market, GI guarantees insurance offers to people self-employed with no employees (Blumberg et al., 2013), often called the “SENE.”
This analysis has scholarly and policy relevance in four respects. First, the results engage with a longstanding debate that is reviewed in this study’s third section on whether regulations like GI aid or impede self-employment. Although some research finds that GI in the small- and nongroup markets may raise self-employment rates (e.g., Blumberg et al., 2013; DeCicca, 2010), other work argues that such regulations frustrate self-employment by raising insurance prices (Jensen & Morrisey, 1999; Mathur, 2010; New, 2005, 2006). By testing self-employment’s relationship to specific types of GI using new state-level data, this study adds information to this debate. Since self-employment may aid regional job and income growth (e.g., Rupasingha & Goetz, 2013; Stephens & Partridge, 2011), new information on GI’s relationship to self-employment rates may carry interest for state policy makers (e.g., Hart, 2008).
Second, while only a limited number of states have historically used GI in the small- and nongroup markets (KFF, 2012a), the 2010 Affordable Care Act (ACA), through its intersection with existing policies, has essentially made GI in these markets national law, and particularly gives new insurance guarantees to the SENE. 2 Blumberg et al. (2013) estimated that because of the ways that the ACA may ease job lock, self-employment in the United States will in time be 11% higher than it would be otherwise. Yet such predictions merit study through several lenses, including the lens offered by pre-ACA cross-state variation in GI use (e.g., Volden, 2006), in light of the aforesaid competeing argument that such regulations may hinder self-employment by raising insurance prices (Jensen & Morrisey, 1999; Mathur, 2010; New, 2005, 2006).
That said, this study also has policy relevance because GI’s new status as de facto national law is far from fixed. On May 4, 2017, the U.S. House of Representatives voted 217 to 213 to reverse several ACA components (Kaplan & Pear, 2017). The House bill, the American Health Care Act, largely retained the ACA’s individual market GI rules (KFF, 2017), and did not ultimately replace the ACA. Even absent ACA repeal, however, a January 20, 2017 executive order directed federal administrators to ease ACA regulations (Trump, 2017). States may also seek federal waivers from the ACA starting in 2017 by the law’s original terms (Thompson, 2013). Thus, small- and nongroup GI could return to being policies used at states’ discretion.
Fourth, recessions may raise or lower total self-employment (Beckhusen, n.d.; Cahill et al., 2013; Kumar & Weiss, 2012). The data studied here run from 2008 to 2010 on the explanatory side and from 2009 to 2011 on the outcome side. Thus, the results shed light on whether regulations of the sort found supportive of self-employment at the individual level related positively to state-level self-employment rates as the United States emerged from the Great Recession.
The second section reviews literature on self-employment’s role in regional economic development. A discussion of dueling evidence on insurance regulations’ impacts on self-employment follows, along with the hypotheses tested. The data and empirical strategy are then described, followed by the results. In brief, self-employment relates positively to one of the two types of GI studied, but is unrelated to the other and inversely related to insurance prices. The conclusion discusses the study’s limitations and its scholarly and policy implications.
Self-Employment’s Contribution to State Economic Development
States use many strategies to foster economic growth. They court large external firms (Hart, 2008; Rowe et al., 1999; Stephens & Partridge, 2011), provide university research grants (Feldman, Lanahan, & Lendel, 2014), innovate within their unemployment insurance (UI) programs (Plotnick, 1989), and establish various job (Whitacre, Shideler, & Williams, 2016) and childhood development (Jenkins, 2014) programs.
States also try to foster economic development by nurturing entrepreneurial behaviors (Goetz & Freshwater, 2001; Hart, 2008), including self-employment (Heim & Lurie, 2014a; Rowe et al., 1999). State policies used in this endeavor include tax advantages for small businesses (Borchers, Deskins, & Ross, 2016); insurance subsidies for the self-employed (Barber & Moffett, 2015); “continuation coverage” laws in the years before the 1986 federal Consolidated Omnibus Budget Reconciliation Act (COBRA; Gruber & Madrian, 1994); and self-employment assistance (SEA) funds for the unemployed in lieu of traditional UI benefits (Messenger, Peterson-Vaccaro, & Vroman, 2002).
Several scholars have cited self-employment growth as conducive to economic development (Feldman & Francis, 2004; Goetz, Fleming, & Rupasingha, 2012; Stephens et al., 2013), and while not unqualified, 3 much work finds a positive link between aggregate self-employment rates and economic health. For instance, at least before the Great Recession, self-employment was positively linked to economic development in both the northeastern United States (Bashir & Chawdhry, 2014) and the Appalachian Regional Commission area (Stephens & Partridge, 2011), and to job and income growth in metropolitan and nonmetropolitan counties (Rupasingha & Goetz, 2013). Baldwin and Chowhan (2003) have credited self-employment with raising business productivity by 4.1% in the 1980s (as cited by Vanderkam, 2009). Loveridge and Nizalov have argued that a “regional economy needs to maintain a sufficiently large share of self-employed entrepreneurs, family businesses, and other small (micro) enterprises to enhance growth of other parts of [the] local economy” (Loveridge & Nizalov, 2007, p. 258, as cited by Low & Weiler, 2012).
Self-employment aids regional economies in part by creating jobs (Allen & Park, 1999; Stephens et al., 2013). The self-employed may deserve credit for one third of new jobs (CFED, n.d.) and 10% of all wage jobs (Deltas & Kim, 2003). From 1981 to 1985, “very small firms . . . created about 88 percent of all net new jobs” (Birch, 1987, p. 16). A caveat is that a minority of the self-employed employ others (Carree et al., 2002). Scholars call those who do “gazelles” (Nightingale & Coad, 2013) or “Schumpeterian entrepreneurs” (van Acht, Stam, Thurik, & Verheul, 2004; Wennekers & Thurik, 1999, as cited by Thurik, Wennekers, & Uhlaner, 2002). They have called those who do not “muppets” ("marginal, undersized, poor performance enterprises") (Nightingale & Coad, 2013, p. 113), “shopkeepers” (van Acht et al., 2004, p. 12; van Stel, Carree, & Thurik, 2005, p. 319), and “income substitutors” (Birch, 1987, pp. 29-36). Yet purely "home-based businesses" also bolster state economies (Phillips, 2002; Rowe et al., 1999).
Indeed, although the concepts differ, researchers have often used the share of a workforce that is self-employed to measure entrepreneurship (Bosma, de Wit, & Carree, 2005; Bruce & Moshin, 2006; Low & Weiler, 2012; Thurik, Carree, van Stel, & Audretsch, 2008). Bruce and Moshin (2006) noted that “self-employment . . . is the most easily measured indicator of entrepreneurial activity, and has . . . been used most frequently in prior literature” (p. 423). Thurik et al. (2008) described the share of the nonagricultural labor force self-employed as a “well-established proxy for entrepreneurial activity” (p. 677). Feldman and Francis (2004) described people who desire self-employment as a “latent entrepreneurship” source in any region (p. 131).
Health Insurance Regulation: Boon or Barrier to Self-Employment?
Evidence conflicts on whether regulations like GI raise or curb self-employment.
How Health Insurance Regulation May Support Self-Employment
One set of work argues that job choices reflect the concerns that people face as insurance applicants, and thus that regulations like GI support self-employment. In particular, job lock studies suggest that self-employment is more viable where public policy guarantees insurance to people who are excluded from large risk pools (Bradley, Neumark, & Barkowski, 2013; Buchmueller & Valletta, 1996; Burnetti, Nayeri, Dobkin, & Brady, 2000; Corlette, 2013; Gruber & Madrian, 2002; Litan, 2014; U.S. GAO, 2011). The SENE usually must seek insurance on the individual market (Allen & Park, 1999; Marquis, Buntin, Escarce, Kapur, & Louis, 2005), and in that market—absent GI—poor health may disqualify a person for coverage (Blumberg et al., 2013). Uninsurance is financially perilous even for middle-income earners (Himmelstein, Warren, Thorne, & Woolhandler, 2005). For people with health concerns, “the risks of going without insurance may deter . . . that entrepreneurial leap” (Litan, 2014). Coverage certainty may have the opposite effect—a suggestive, if observational, indication being that people who can join spouses’ plans are 1.2 to 4.6 percentage points more likely to be self-employed than people lacking this option (Wellington, 2001).
Several researchers and policy makers have proposed that regulation of the small- and nongroup markets may buoy self-employment (Becker & Tüzemen, 2015; Blumberg et al., 2013; Corlette, 2013; DeCicca, 2010; Gurley-Calvez, 2011; Heim & Lurie, 2013; Litan, 2014; Wolfe & Serakos, 2015). For instance, individual-level research finds self-employment positively linked to state community rating laws, GI, and insurance subsidies for the self-employed (Heim & Lurie, 2013), to tax policies that treat self-employed persons’ insurance premiums like those of wage workers (Frakt, 2014; Gurley-Calvez, 2011), and to Medicare eligibility, which simply nullifies concerns about small- and nongroup coverage (Fairlie, Kapur, & Gates, 2011, as cited by Blumberg et al., 2013). The Massachusetts 2006 health care bill that jointly established GI, community rating, and an insurance exchange for individuals and small groups (KFF, 2012b) may have raised that state’s self-employment by 10% (Becker & Tüzemen, 2015). New Jersey’s 1993 Individual Health Coverage Plan, which also expanded insurance outside the large-group context, may have raised state self-employment by 14% (DeCicca, 2010, as cited by Blumberg et al., 2013). Scholars have suggested that self-employment may increase post-ACA by similar mechanisms (Becker & Tüzemen, 2015; Blumberg et al., 2013; Corlette, 2013; Wolfe & Serakos, 2015).
Much work in this vein specifically cites GI in the small- and nongroup markets as a potential self-employment aid. For instance, Litan (2014) described GI as “protecting entrepreneurs.” DeCicca (2010) defined New Jersey’s 1993 individual market GI rule as a key self-employment support. Heim and Lurie (2013) treated insurance regulation as a key moderator in models aimed at delineating self-employment’s links to tax policies, and in their analysis, individual market GI differentiates states as having “heavy” versus “moderate” or “light” regulation (p. 96). Simon (2008) asserted that research on the SENE’s ability to shop in the small-group market is needed to assess “whether there is more entry into self-employment when access to health insurance is eased” (p. 94). Blumberg et al. (2013) cited GI for groups of one in the small-group market as central to the post-ACA self-employment uptick that they projected.
How Health Insurance Regulation May Impede Self-Employment
A competing set of scholarship finds that regulations like GI impede self-employment by raising insurance premiums and thus resulting business costs. Broadly, cross-country studies (Bjørnskov & Foss, 2008; Nyström, 2008), and some subnational work in the United States (Goetz & Rupasingha, 2014), have found self-employment robust when government ensures economic and legal stability but is otherwise small. Other work links employer insurance mandates to job cuts (Klerman & Goldman, 1994) and to reductions in new firm formation (Jackson, 2010).
Other studies have found self-employment simply unrelated to regulations that, like GI, ensure access to some type of insurance offer without capping price. For instance, Holtz-Eakin, Penrod, and Rosen (1996) found no link between health insurance portability and entrepreneurship. Except among older Americans, Heim and Lurie (2014a) found no relationship between state community rating and GI mandates in the nongroup market and total self-employment in the 1990s. Several papers challenge the aforesaid findings of positive ties between self-employment and insurance regulation by DeCicca (2010), Becker and Tüzemen (2015), and Blumberg et al. (2013). Heim and Lurie (2014a) argued that DeCicca’s results lack external validity. Contrary to Becker and Tüzemen (2015), Heim and Lurie (2014b) found mixed evidence on the Massachusetts health law’s impact on self-employment. Heim and Yang (2014) and Miller (2016) contended that Blumberg et al.’s (2013) analysis overestimates the ACA’s likely impact on self-employment.
Scholars have identified insurance price as a key mechanism that may lead insurance regulations to have a negative or nonimpact on self-employment. New (2005, 2006) found insurance regulations associated with higher premiums. Other work specifically suggests that GI may raise premiums (McCracken, 2014), particularly in states that do not require all people (including healthy people) to hold coverage (Corlette, n.d.). By one estimate, family premiums may have risen five- to sevenfold after New Jersey mandated GI in 1993 (Bunce, 2002, as cited by New, 2006). Gruber (2010) estimated that if the ACA’s GI rules were retained but its mandate that all people hold insurance dropped, 4 individual premiums would increase by 40%.
Scholars have also noted that because small firms cannot easily self-insure and thereby gain exemption from state regulations (Jensen & Morrisey, 1999), regulations that raise premiums may make small firm growth particularly costly. Mathur (2010) indeed found state insurance regulations inversely related to the probability of a self-employed person hiring new employees.
Hypotheses
Given these conflicting sets of literature, further research is needed on self-employment rates’ ties to insurance regulation, particularly GI. This study examines state self-employment rates’ relationship to two types of GI that help ensure that the SENE can procure an insurance offer, but that do not address insurance affordability. The research hypotheses are that the share of a state’s workforce that is self-employed is higher in states that mandate GI in the individual health insurance market than in states that do not (
Data and Methods
Analyses use an original panel of the 50 states and Washington, D.C. 5 It spans years 2009 to 2011 on the outcome side and 2008 to 2010 on the explanatory side. Right-hand side variables lag the outcome, by a year in most cases, to reduce simultaneity concerns (e.g., Low & Weiler, 2012).
The outcome, self-employment rate, is measured two ways. The first is the proportion of persons working in nonagricultural industries who are self-employed. 6 The second is the state’s number of nonemployer individual proprietorship establishments, calculated per 1,000 population. 7 This second measure should capture the SENE particularly well since “nonemployer” businesses have no paid workers (U.S. Census Bureau, n.d.).
Consistent with
The second GI measure is an indicator of whether a state required GI for groups of one in the small-group market the prior year (henceforth GI − 1). Data exist for 2007, 2009, and 2010; 2007 data stand in for 2008. GI − 1 laws are fairly stable, the only changes being that Arizona and Washington had GI − 1 in 2008 (i.e., 2007), but not 2009 or 2010, and that Michigan did not have GI − 1 in 2008 (i.e., 2007) but did in 2009 and 2010. In states with GI − 1, “individuals who are self-employed may be able to buy the same health insurance policies sold to small employers and benefit from some or all of the same legal protections” (Blumberg et al., 2013, p. 2). Pre-ACA, the SENE lacked this assurance in states that lacked GI − 1, since HIPAA mandates small-group GI but excludes the SENE from the definition of small group (Corlette, n.d.). Thus, the SENE had to shop in the individual market in states without GI − 1, pinning an insurance offer’s certainty on state use of GI of All. The ACA upholds HIPAA’s GI mandate (KFF, 2012a), but as of January 1, 2016 defines a small employer as a firm with 1 to 100 employees (Abbott et al., 2012), thus making GI − 1 national law.
GI of All and GI − 1 both appear in all models. A handful of states use both. More use GI − 1 than GI of All. Table 1 lists which states mandated GI of All, GI − 1, and both, in year 2010.
State Guaranteed-Issue (GI) Laws Relevant to the Self-Employed, Year 2010.
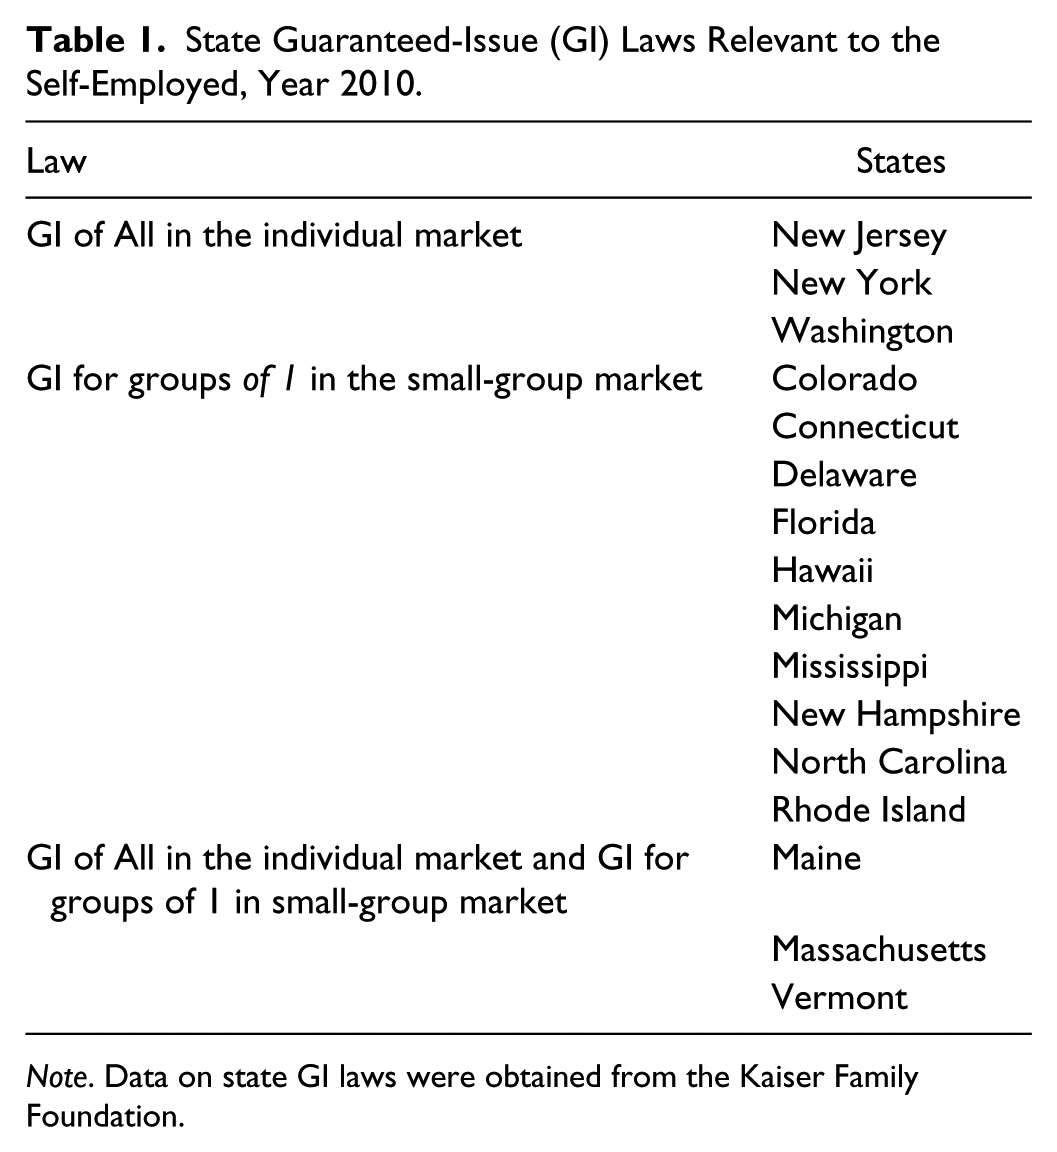
Note. Data on state GI laws were obtained from the Kaiser Family Foundation.
Relevant literature points to five categories of control variables: measures of (1) private and public health insurance availability, UI benefits, and state tax climate, (2) state economic health, (3) grant money available to the self-employed, (4) population characteristics, and (5) politics. Measures were collected for each category and preliminary analyses controlled for all of these factors. The rest of this section explains these measures and describes the approach taken to selecting parsimonious models that use only some of these controls.
Health Insurance Availability, UI Benefits, and Tax Climate
The literature reviewed above makes clear that health insurance availability (especially outside of large-group employment), income sources (especially when unemployed), and tax policies are particularly critical concepts on the right-hand side of self-employment models.
Three insurance availability measures are potentially important. The first is price. The high cost of individual versus group health plans may deter self-employment (Wellington, 2001); and as noted, where adverse selection worries insurers (Corlette, n.d.; Gruber, 2010), GI may raise premiums (Bunce, 2002, as cited by New, 2006; McCracken, 2014). Individual market premium data exist only for some state years, 10 but data exist for all state years on the average annual premium that workers with job-based insurance pay for family and single coverage. 11 The average annual individual market premium for family coverage correlates more highly to the average annual premium those with job-based plans pay for single coverage (0.503), than to the average annual premium those with job-based plans pay for family coverage (0.103). 12 Thus, the average annual premium people with job-based plans pay for single coverage is the best signal of insurance price that allows analysis of all state years. To avoid simply capturing state wealth, this premium is divided by per capita personal income. 13 Thus, the measure used is the ratio of the average annual premium for single coverage paid by those with job-based insurance, to per capita personal income, (hereafter called the “premium-to-income ratio”).
A second insurance availability consideration is the share of the population eligible for Medicaid and separately Medicare. A state’s income-based Medicaid eligibility threshold may relate to workers’ “reservation threshold” for exiting existing jobs (Hamersma & Kim, 2009, p. 765). Regarding Medicare, turning 65 years is associated with an increased chance of self-employment (Fairlie et al., 2011). The Medicaid access measure used here is the percent of the federal poverty level at or below which working parents qualify for Medicaid. 14 The Medicare access measure is the share of the population aged 65 years and older. 15
A third insurance access factor is the prevalence of job-based coverage, since people with job-based insurance have lower business creation rates than do others (Fairlie et al., 2011). This concept is measured as the share of private-sector firms offering insurance. 16
By offering income, UI may enable a person to pursue entrepreneurship rather than a new salaried job (Plotnick, 1989). Or, self-employment’s appeal may rise as UI falls (Beckhusen, n.d.). The UI measure used here is the maximum UI payment available in a state, in 2011 dollars adjusted by the regional Consumer Price Index for All Urban Consumers, divided by the state’s per capita personal income, to avoid simply capturing a signal of state wealth. 17 It is hereafter called the “UI-to-income ratio.”
Tax policy receives extensive study as a self-employment determinant (e.g., Barber & Moffett, 2015; Borchers et al., 2016; Bruce & Deskins, 2012; Bruce, Liu, & Murray, 2015; Clingingsmith & Shane, 2016; Georgellis & Wall, 2006; Heim & Lurie, 2013). The data set captures tax policy with the Tax Foundation’s state Business Tax Climate scores, 18 using FY2008 for 2008 and so on. A caveat is that business owners may not concur with such tax ratings (Motoyama & Hui, 2015).
State Economic Health
The data set uses two measures of state economic health. The first is per capita personal income. While used as described above to transform premiums and UI into ratios comparable across states of varying wealth, per capita personal income could also merit inclusion as a stand-alone signal of population affluence. Since self-employment often requires loans or self-financing (Blanchflower & Oswald, 1998; Low & Weiler, 2012), individual-level self-employment studies attend to factors like wages, income, homeownership, and inheritance (Blanchflower & Oswald, 1998; Fairlie et al., 2011; Gruber & Madrian, 1994; Low & Weiler, 2012). Per capita personal income is an aggregate-level counterpart to such measures. When entered as a covariate, the natural log of per capita personal income is used. Its correlations to the premium-to-income and UI-to-income ratios are modest and do not appear to create multicollinearity. 19
The second measure is the state unemployment rate. 20 Unemployment may “push” people to self-employment (Bosma et al., 2005, p. 39), through the “refugee effect” (Thurik et al., 2008, p. 675; but see Benedict & Hakobyan, 2008). Unemployment rates may also signal firm closures. Closures may raise self-employment by way of labor market push, or firm survival may boost entrepreneurship (Bashir & Chawdhry, 2014).
Grant Money Available to the Self-Employed
It may also be appropriate to control for grant money relevant to self-employment. Small Business Innovation Research awards may aid self-employment involving research and development (Beesley, 2016; Verheul, Bosma, van der Nol, & Wong, 2002). Thus, one measure is the total number of Small Business Innovation Research awards the state received in year y, per 1,000 population. 21 A second is whether a state had an active SEA program in year y, 22 since SEA programs may provide the unemployed money to launch small businesses (Messenger et al., 2002; but see Benedict & Hakobyan, 2008).
Population Characteristics
Individual level job flexibility studies control for education (Bradley et al., 2013; Fairlie et al., 2011; Gruber & Madrian, 1994; Hamersma & Kim, 2009). Goetz and Freshwater (2001) have suggested that the share of adults with a college degree signals a state’s “human capital stocks” (p. 62; but see Hipple & Hammond, 2016). Thus, the data set includes the share of the population aged 25 years and older with an advanced degree. 23 White Americans may have higher self-employment rates than non-White Americans (Hipple & Hammond, 2016; Kumar & Weiss, 2012; but see Wang, 2015). The data thus include the share of the population that identifies as White. 24
State Politics
Finally, office-holders’ partisanship may relate to firms’ location decisions (Halvorsen & Jakobsen, 2013; but see Leigh, 2008). The data include indicators of Democratic or Republican control of a state’s legislature in year y; the omitted condition is split control. 25 Nebraska has a unicameral, nonpartisan legislature and thus drops from analyses that use these indicators. The data set also includes gubernatorial partisanship (0 if Republican, 1 if Democrat). 26 For Washington, D.C., this variable is coded 1 in all years that the District had a Democratic mayor.
Empirical Strategy
Descriptive statistics for all measures appear in Table 2. Pilot analyses included year fixed effects and all five sets of control variables—the measures of (1) insurance availability, UI, and tax climate; (2) economic health; (3) grant money; (4) population traits; and (5) politics. 27 That said, models that use all of these controls demand much of a small data set.
Descriptive Statistics.
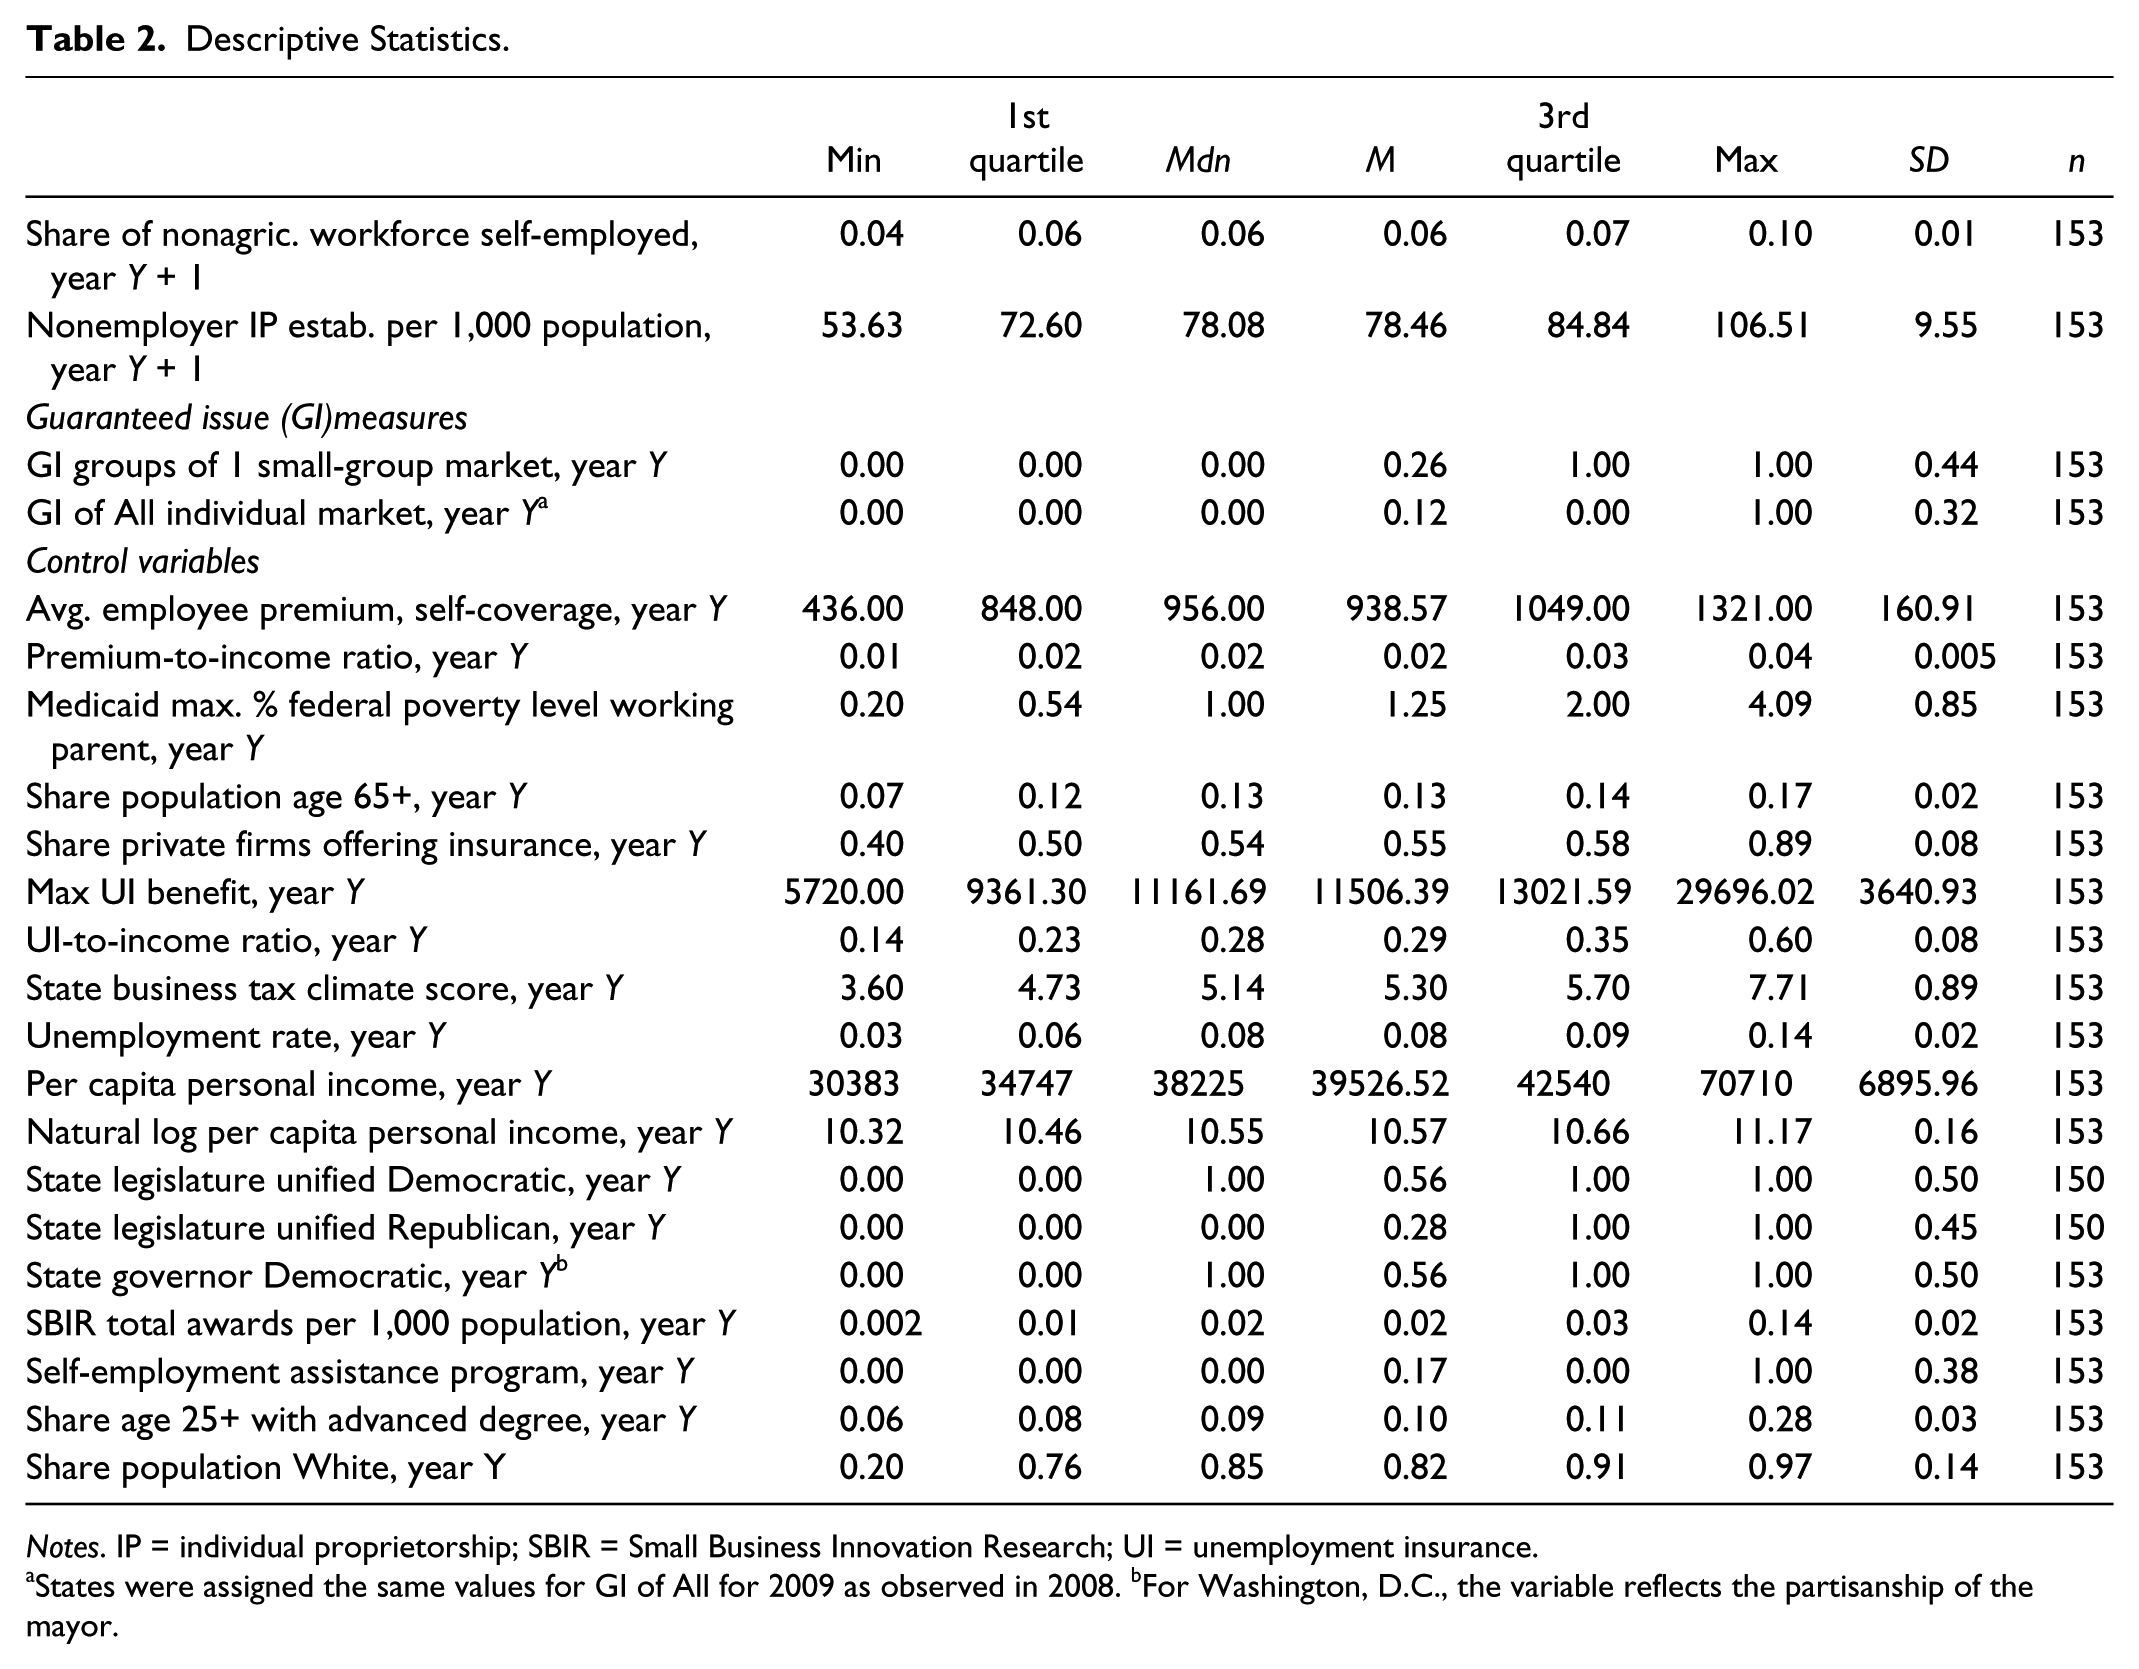
Notes. IP = individual proprietorship; SBIR = Small Business Innovation Research; UI = unemployment insurance.
States were assigned the same values for GI of All for 2009 as observed in 2008. bFor Washington, D.C., the variable reflects the partisanship of the mayor.
Accordingly, nested linear regression was used to arrive at a parsimonious model of the share of employed persons in nonagricultural industries who are self-employed, and separately a parsimonious model of the number of nonemployer individual proprietorship establishments per 1,000 population. In both cases, the nested regressions considered six sequential variable blocks and clustered standard errors by state. The first (foundational) block consisted of the GI of All and GI − 1 indicators and year fixed effects. The next five blocks consisted of the five sets of controls, added in the following order: the measures of (1) insurance availability, UI generosity, and tax climate; (2) economic health; (3) grant money; (4) population traits; and (5) politics. The blocks were added in this order because, as per the literature above, the theory that supports inclusion in the model appears strongest for the first control block and more conflicted as we proceed to the fifth.
Where the outcome is the share self-employed in nonagricultural industries, nested regression found the foundational block and the first two control blocks significant at the 0.10 level or 0.05 level. 28 Thus, the least parsimonious model of this outcome reported in the next section includes the GI indicators, year fixed effects, and the controls from these two blocks. Where the outcome is individual proprietorships per 1,000, nested regression found the foundational block and the first control block significant. Thus, the least parsimonious model of this outcome reported in the next section models it as a function of the GI indicators, year fixed effects, and the covariates in this first control block. More minimal models are also reported below.
Results
Before launching into regression, Table 3 reports the mean share of persons in nonagricultural industries who are self-employed in states with GI of All versus without and in states with GI − 1 versus without. Table 3 also reports the mean number of individual proprietorships per 1,000 in states with GI of All versus without and with GI − 1 versus without. The t tests find both self-employment measures statistically higher in states with GI than without, for both GI types.
Self-Employment Rates in Year Y + 1 and Guaranteed Issue (GI) Regulations in Year Y.
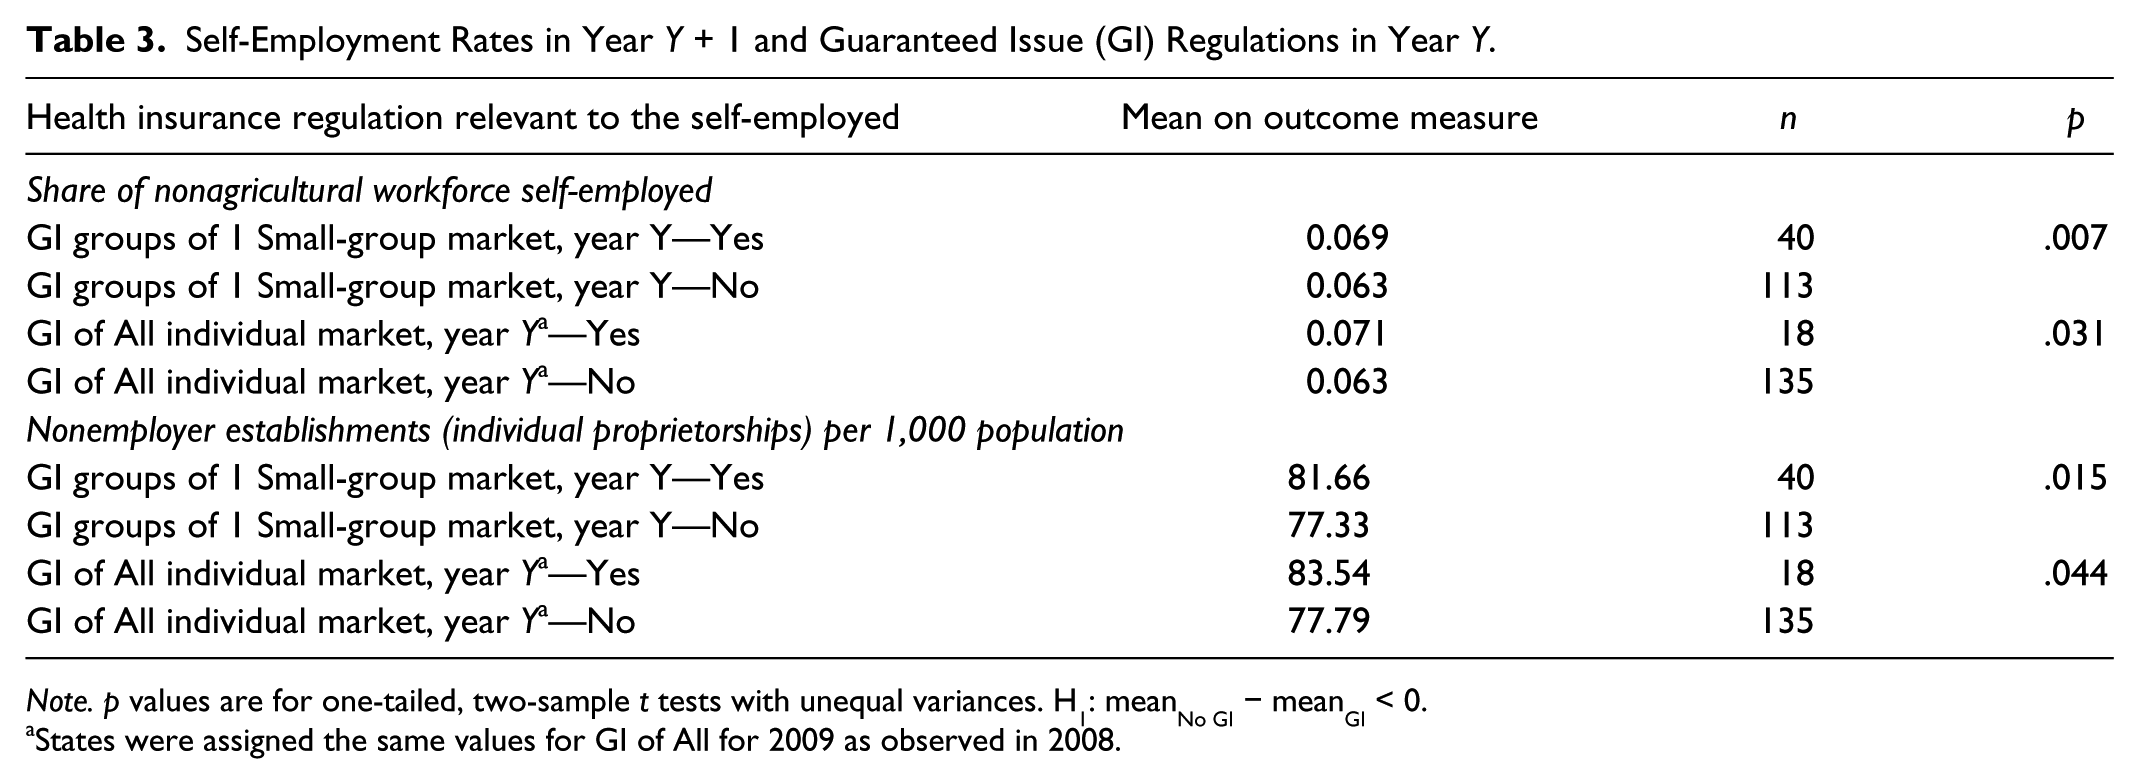
Note. p values are for one-tailed, two-sample t tests with unequal variances. H1: meanNo GI − meanGI < 0.
States were assigned the same values for GI of All for 2009 as observed in 2008.
Table 4 reports the results of modeling the share of persons working in nonagricultural industries who are self-employed in year y + 1 as a function of GI − 1 and GI of All in year y, year fixed effects, and controls in year y, using linear regression with standard errors clustered by state. Model 1 in Table 4 includes the controls noted above—those from the blocks found significant in the nested regression procedure described in the previous section. Model 2 reports the results when using only the controls that are significant in Model 1.
Share of Nonagricultural Workforce Self-Employed, Year Y + 1.
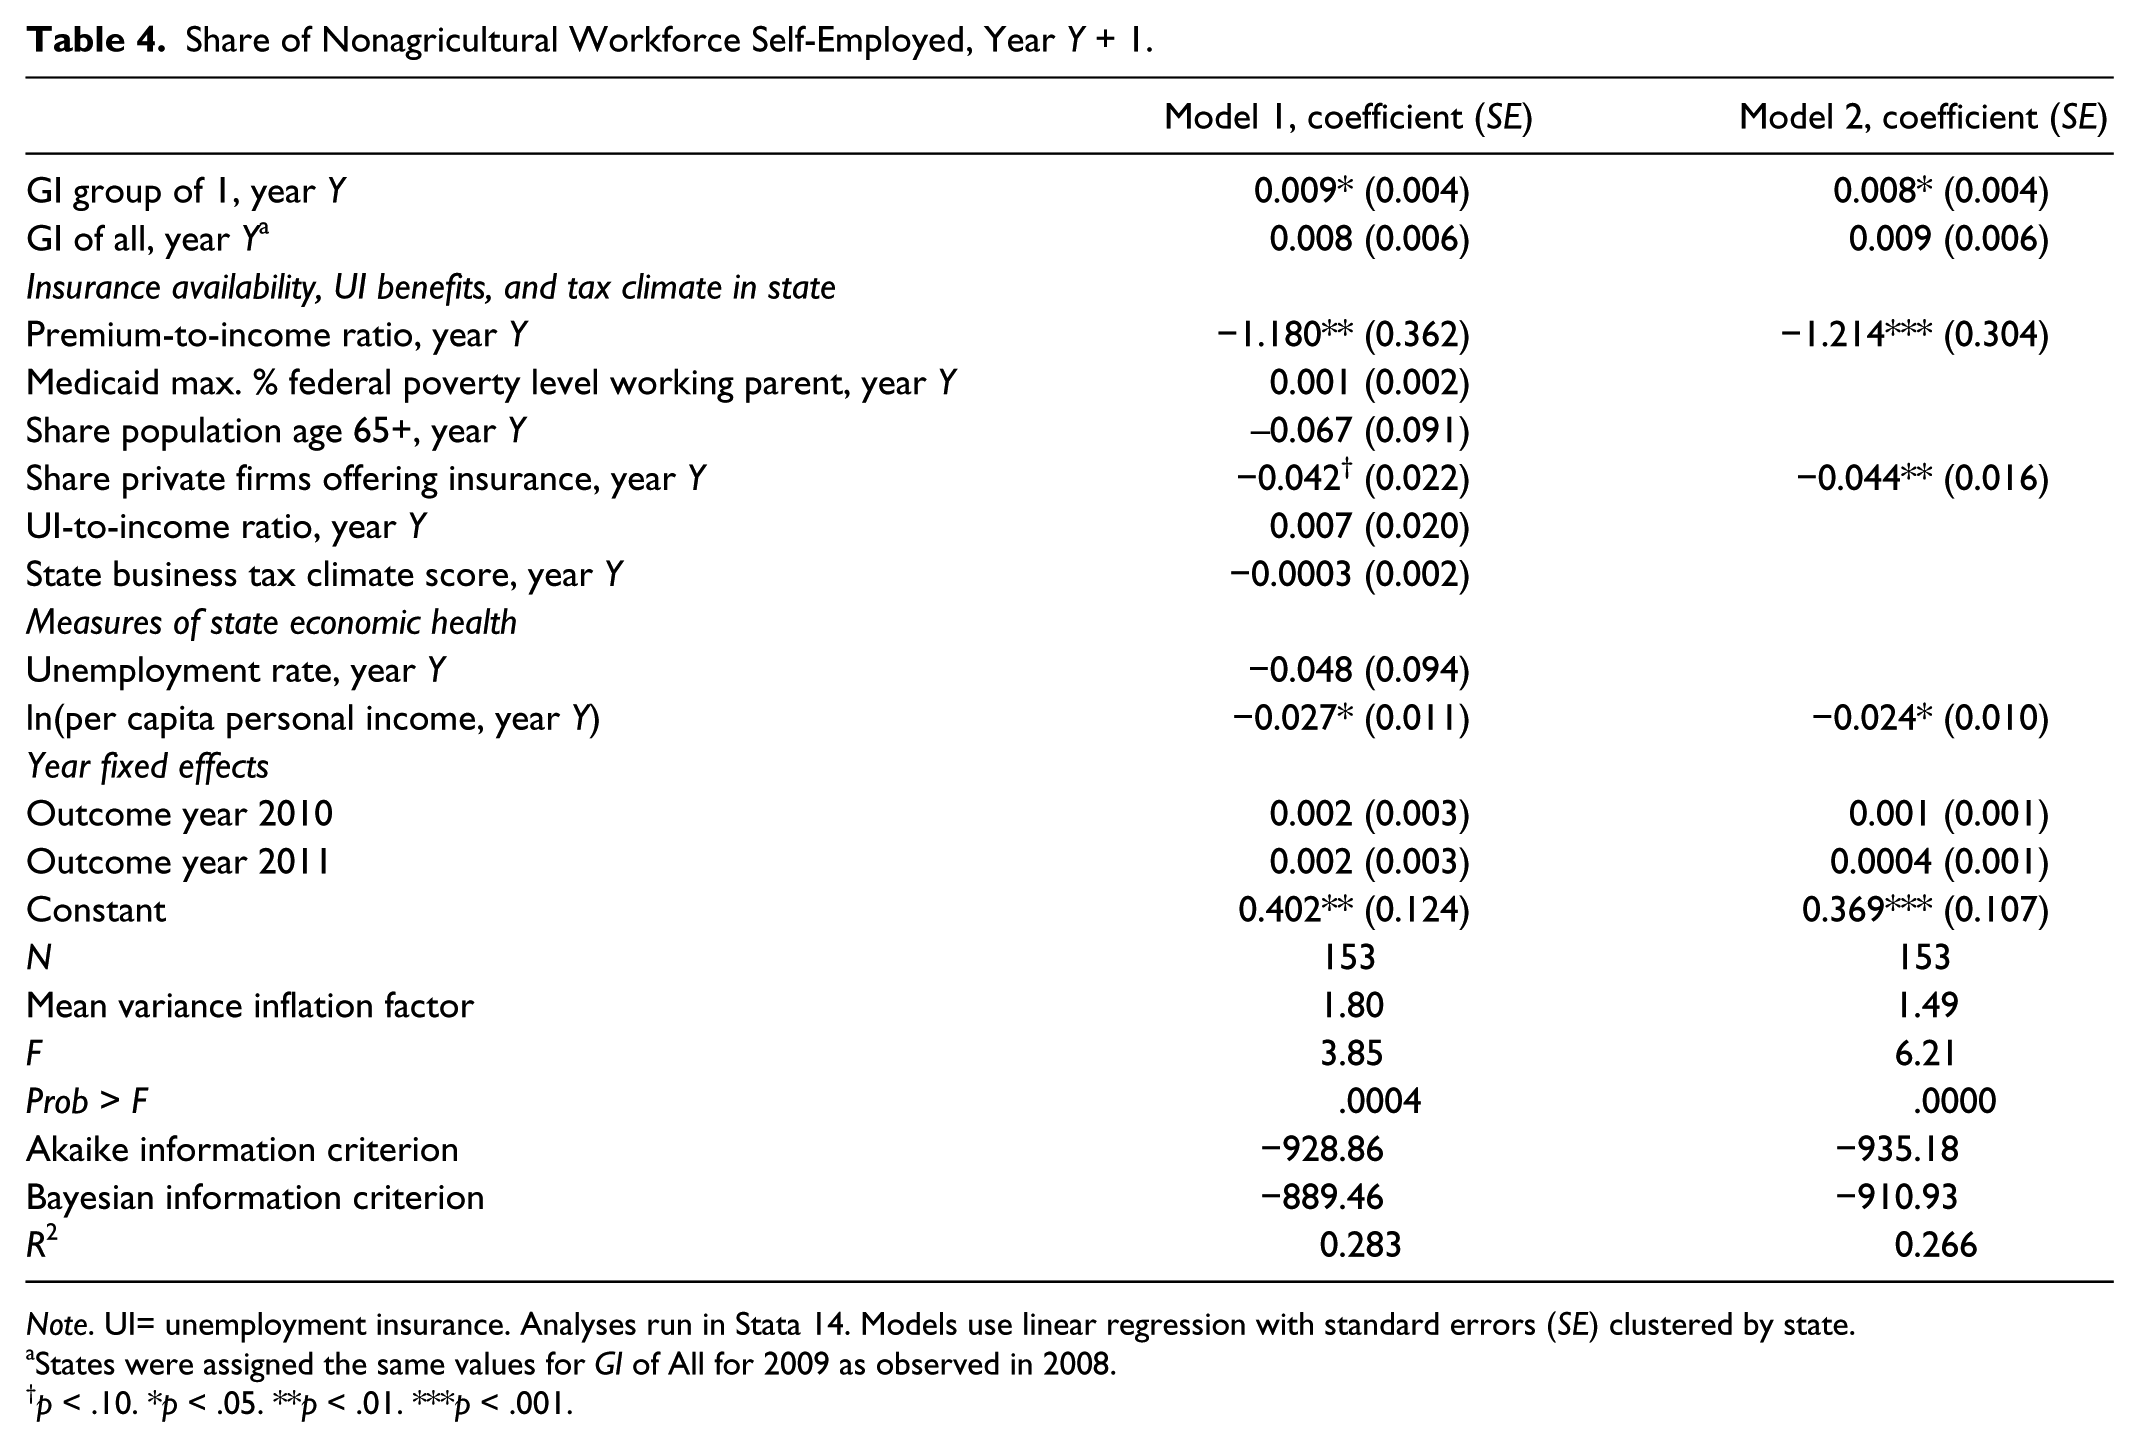
Note. UI= unemployment insurance. Analyses run in Stata 14. Models use linear regression with standard errors (SE) clustered by state.
States were assigned the same values for GI of All for 2009 as observed in 2008.
p < .10. *p < .05. **p < .01. ***p < .001.
The GI − 1 coefficient is positive and significant in both models. The GI of All coefficient is positive but insignificant. To interpret the GI − 1 result substantively, model 2 (the better model per the Bayesian information criterion and Akaike information criterion) estimates that, in 2011, 6.99% of people (95% confidence interval [CI] [6.32, 7.66]) in nonagricultural industries were self-employed in a state that, in 2010, mandated GI − 1, but not GI of All, whose premium-to-income ratio, share of firms offering insurance, and logged per capita personal income took median values. It estimates that 6.16%, 95% CI (5.77, 6.56), of this workforce was self-employed in a state with the same traits without GI − 1.
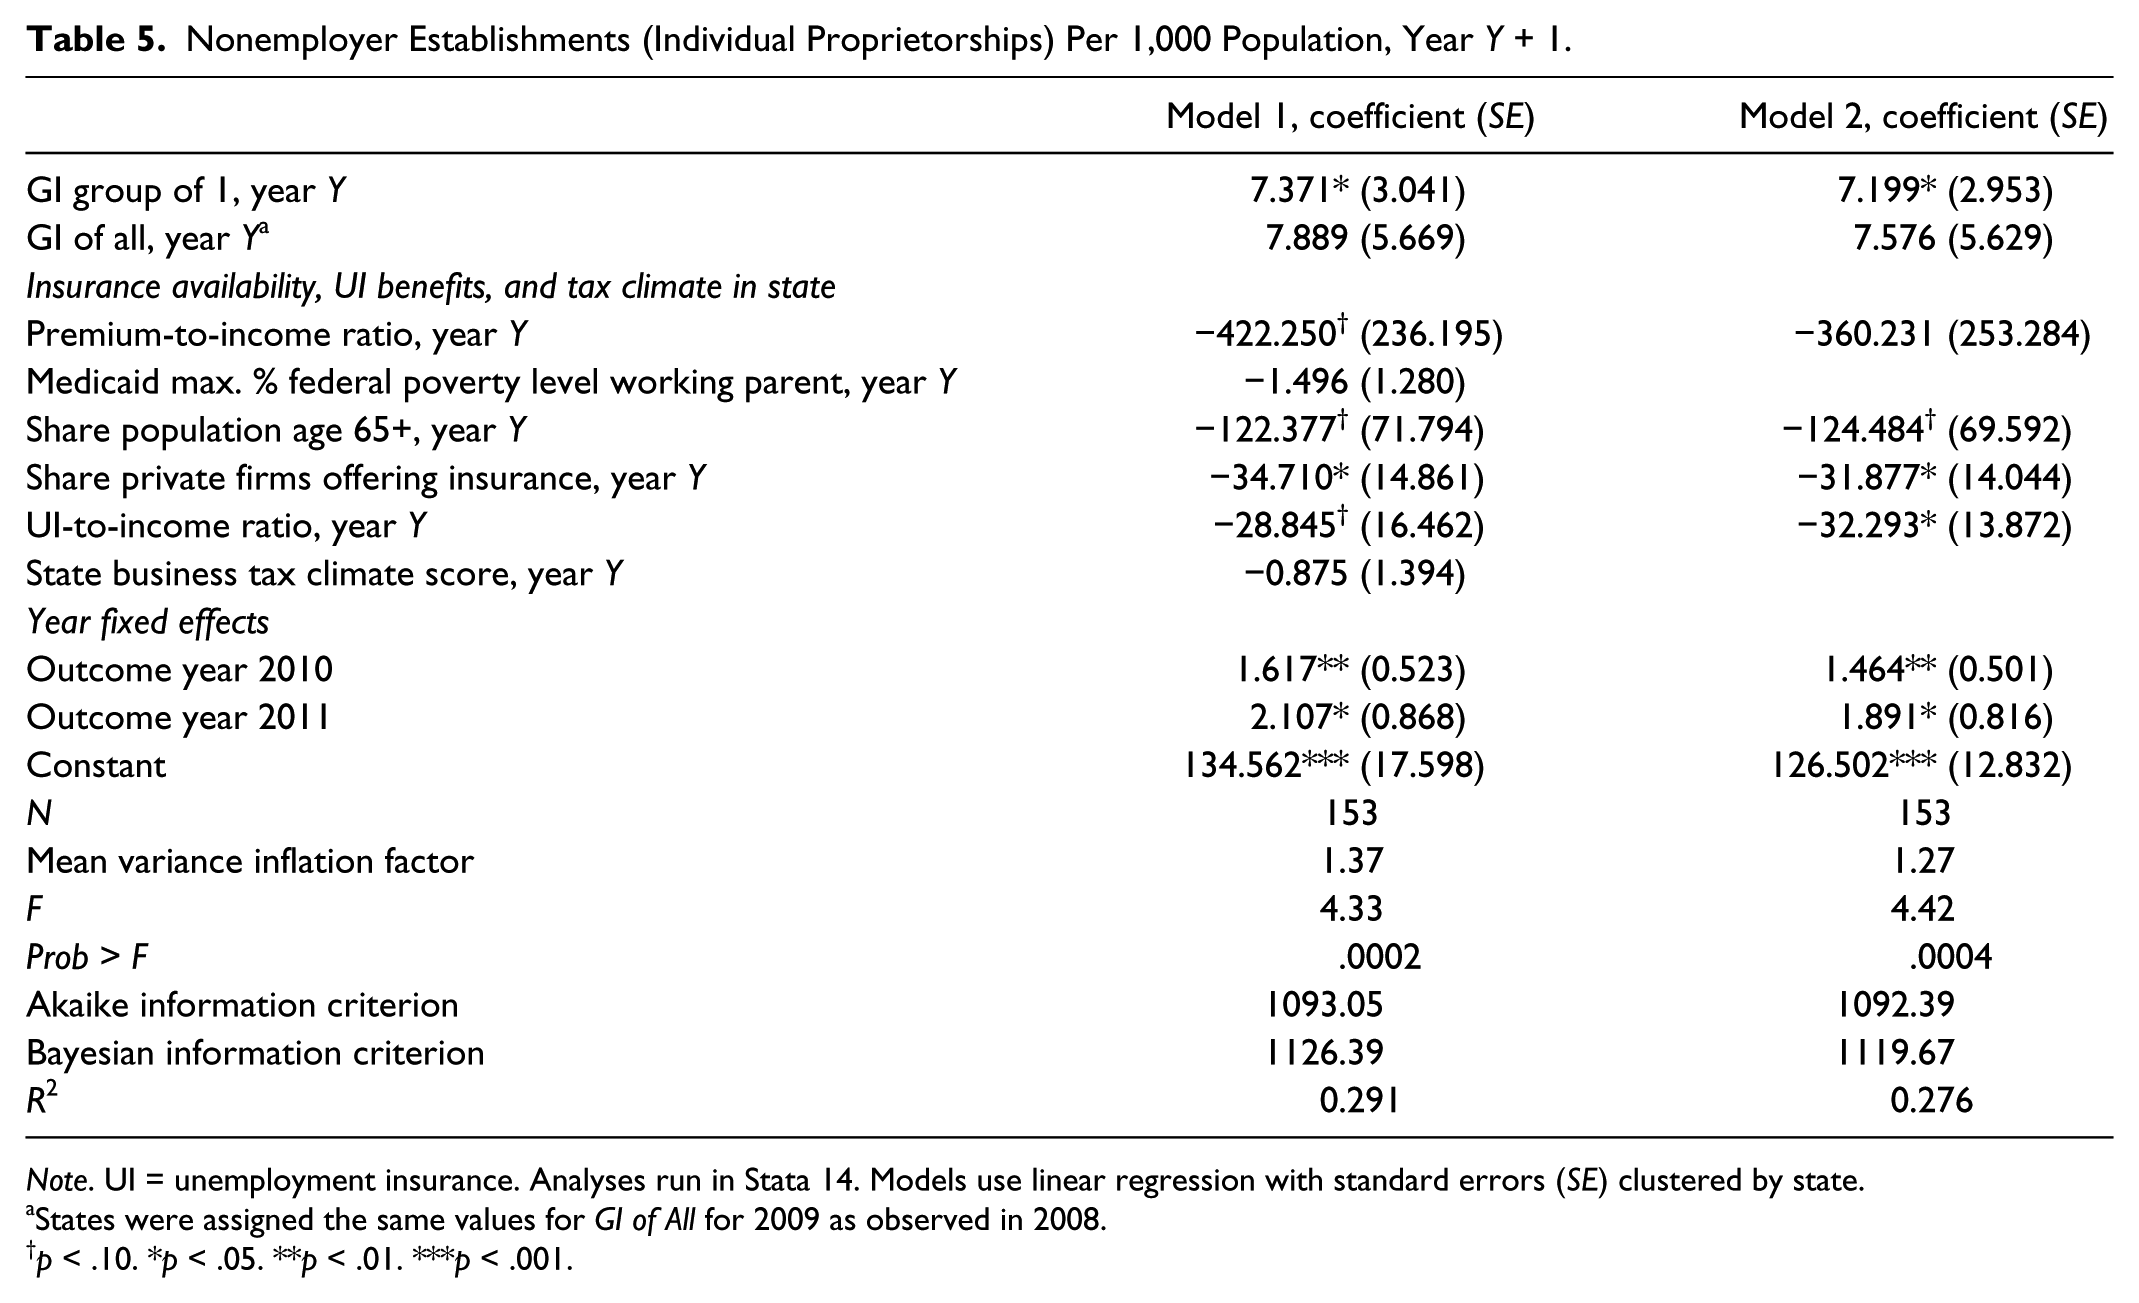
Table 5 reports models of the number of individual proprietorships per 1,000 in year y + 1, using linear regression and state-clustered standard errors. Model 1 in Table 5 includes the GI − 1 and GI of All indicators in year y, year fixed effects, and the controls from the block that was significant in the nested regression work described in the previous section. Model 2 includes only the controls found significant in this first model.
Nonemployer Establishments (Individual Proprietorships) Per 1,000 Population, Year Y + 1.
Note. UI = unemployment insurance. Analyses run in Stata 14. Models use linear regression with standard errors (SE) clustered by state.
States were assigned the same values for GI of All for 2009 as observed in 2008.
p < .10. *p < .05. **p < .01. ***p < .001.
This self-employment measure also relates positively to both GI types, but significantly only to GI − 1. Model 2 (the slightly better model per the Bayesian information criterion and Akaike information criterion) finds GI − 1 associated with roughly 7.2 more individual proprietorships per 1,000 than would exist in its absence. Model 2 estimates that there were 83.8 individual proprietorships, 95% CI (78.3, 89.4), in 2011 in a state that, in 2010, used GI − 1 but not GI of All, that had median values on the other covariates. It estimates 76.6 such establishments, 95% CI (74.3, 78.9), for a state with the same traits that did not mandate GI − 1.
Thus, we reject
The finding of significant, positive relationships between GI − 1 and self-employment rates when controlling for the premium-to-income ratio aligns with past evidence that GI—particularly GI − 1—aids self-employment despite insurance’s price (e.g., Blumberg et al., 2013). Yet it is also important to underscore that self-employment’s relationship to the premium-to-income ratio is negative and significant in both models of the share of the nonagricultural workforce self-employed, and negative and marginally significant in model 1 of individual proprietorships per 1,000—as work pointing to the costs that insurance can pose for small firms would predict (e.g., Mathur 2010; New, 2005, 2006). The left panel in Figure 1 (based on model 1 in Table 4) illustrates the predicted share of nonagricultural workers self-employed in 2011, across the range of the premium-to-income variable. This figure pertains to a state that in 2010, mandated GI − 1 but not GI of All, and had median values for the other covariates. As the premium to income ratio rises from its minimum (0.010) to its maximum (0.035), the predicted share self-employed falls from 8.8%, 95% CI (7.5, 10), to 5.8%, 95% CI (4.8, 6.8). The right panel of Figure 1 (based on model 1 in Table 5) illustrates the predicted number of nonemployer establishments per 1,000 population in 2011, across the premium-to-income range. This figure also describes a state that in 2010, used GI − 1 but not GI of All and had median values on other model covariates. As the premium-to-income ratio rises, the predicted number of nonemployer establishments per 1,000 falls from 90.6, 95% CI (82.6, 98.6) to 80.1, 95% CI (72.2, 87.9).
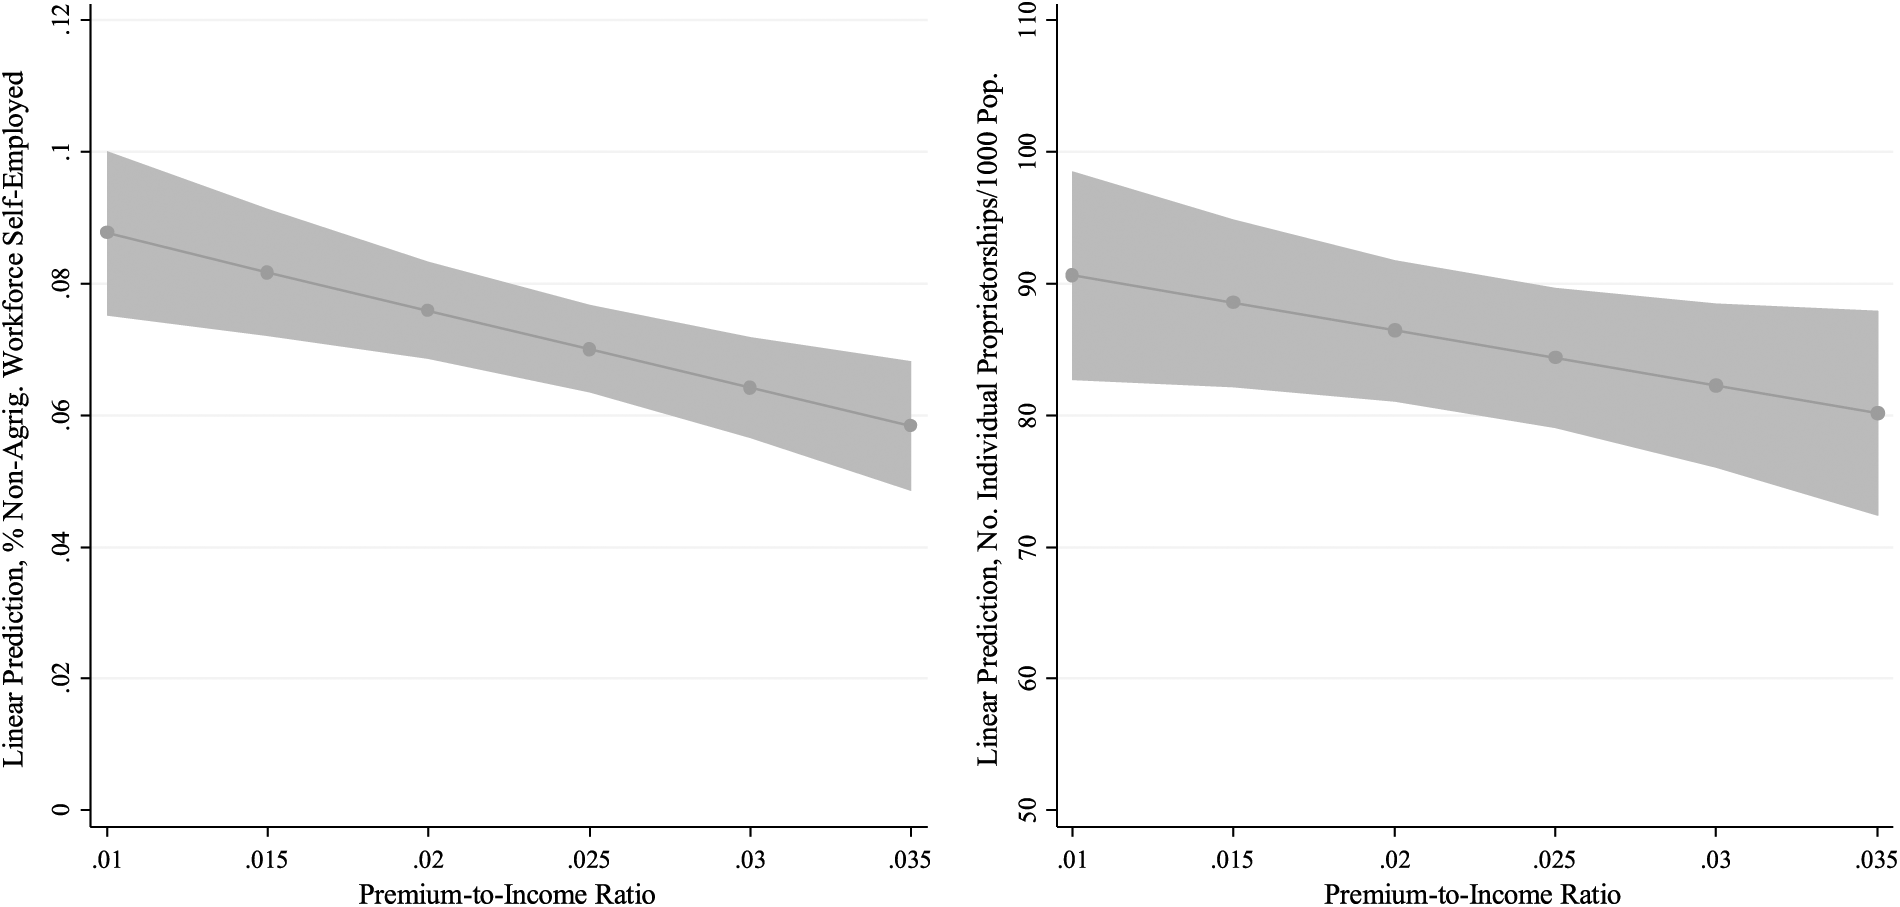
Predicted self-employment rates in Year Y + 1 Versus Premium-to-Income Ratio in Year Y.
The analyses are not designed to test whether either GI type causes higher premiums; therefore, this study cannot assess whether GI − 1’s positive relationship to self-employment outstrips whatever indirect, negative pull GI − 1 may exert on self-employment by fostering higher prices. In dollars, the average annual premiums paid by workers for single, job-based coverage are statistically higher in states with versus without GI − 1 (by about $62), and in states with versus without GI of All (by about $83). That said, the premium-to-income ratio is statistically the same in states with and without GI − 1, and likewise in states with and without GI of All. What the analyses here can say is simply that GI − 1 and insurance prices have cross-cutting relationships to self-employment rates. In the interest of brevity, other covariates in the models are not discussed; however, self-employment’s negative relationship to the share of firms offering insurance, to logged per capita personal income, and to UI are other results that may merit study in future research.
Discussion and Conclusions
Self-employment rates thus appear significantly, positively related to GI − 1 but unrelated to GI of All. The null GI of All results contrast with Heim and Lurie’s (2013) and DeCicca’s (2010) findings, but concur with Heim and Lurie’s (2014a) evidence that self-employment is insensitive to individual market GI. The GI − 1 results align with Blumberg et al.’s (2013) contested prediction—see Heim and Yang (2014) and Miller (2016)—that nationwide GI − 1 will boost self-employment. The GI − 1 finding answers “yes” to Simon’s (2008) question of whether self-employment rates are sensitive to regulations that let the SENE shop in the small-group market. And, the GI − 1 finding aligns with a proposal that the National Association of Insurance Commissioners made in its 1996 Small Employer Health Insurance Availability Model Act to define “small employer to include a business group of one” (Allen & Park, 1999, p. 3).
This study sits against a backdrop of two competing bodies of literature. One argues that regulations like GI aid self-employment and the other argues that such regulations frustrate self-employment by raising business costs. The findings offer some support to both literatures. GI − 1 and insurance prices both have significant and cross-cutting relationships to self-employment rates; the former positive, the latter negative.
In three ways, the findings add new information to, and raise questions for, research on insurance regulation and self-employment. First, the finding that self-employment rates are unrelated to GI of All but positively related to GI − 1 is new to the author’s knowledge, but carries uncertain external validity. Since costly premiums can impede individual market GI from reducing uninsurance (Blumberg et al., 2013), one reason the results reject
Second, the study finds self-employment rates positively related to GI − 1 as the United States emerged from the Great Recession. A federal policy prevailing in the years studied, the 2009 American Recovery and Reinvestment Act, if anything, may have weakened any relationship between GI and self-employment—at least self-employment driven by unemployment. The American Recovery and Reinvestment Act subsidized COBRA for many laid-off workers, raised COBRA take-up, and thus reduced the need to shop in the small and nongroup markets (Bovbjerg, Dorn, Macri, & Meyer, 2010). Yet a positive link between GI − 1 and self-employment rates exists in this period.
Third, albeit Becker and Tüzemen’s (2015) Massachusetts study and parts of DeCicca’s (2010) New Jersey study, work on insurance regulation and self-employment has largely focused on individuals, basing state estimates on those results (e.g., DeCicca, 2010; Heim & Lurie, 2013, 2014a, 2014b; Blumberg et al., 2013). Individual-level data avoid ecological fallacy concerns and often offer more statistical power than state-level data (e.g., Heim & Lurie, 2013). Yet inferences about aggregate patterns drawn from person-level data also merit scrutiny (Firebaugh, 1978; Shirvani, 2015). The results are informative in suggesting that the positive link between insurance regulation and self-employment that is sometimes, but not uniformly, found at the person level appears at the state level, albeit only for GI − 1.
The results are subject to the strong caveat that because GI is not randomly assigned across states, we cannot conclude that GI − 1 laws cause higher self-employment rates. States self-select their regulations, and states that choose to use GI − 1 may also have other traits or policies that deserve “credit” for strong self-employment rates, credit that here goes to GI − 1. It is not possible to include state fixed effects in the models since the data set is small; however, unobservable state-level traits could be omitted variables that affect the results.
The findings suggest that GI − 1 merits evaluation by state policy makers seeking to raise self-employment rates, alongside the questions of whether GI − 1 increases insurance premiums, and if so, what net impact GI − 1 mandates have on self-employment rates.
Footnotes
Acknowledgements
Thanks to Steve Billings, Jim Douglas, Suzanne Leland, Cherie Maestas, John Szmer, three anonymous reviewers, and the editor for helpful suggestions. Thanks to Sandra Hollis (National Association of Insurance Commissioners), Rachel Licata (Kaiser Family Foundation), Quan Phan (Bureau of Labor Statistics), and Jeanne Mejeur (National Conference of State Legislatures) for assistance locating data. Thanks to Madison Esterle, Michael Goldsbury, Aileen Lapitan, Kimberly Hill, and JoEllen Pope for research assistance.
Author’s Note
An earlier version of this study was presented at the 2015 Northeast Conference on Public Administration. Replication commands and the data are available from the author, although the author does not own the raw data behind the individual variables and may need permission to redistribute select measures.
Declaration of Conflicting Interests
The author declared no potential conflicts of interest with respect to the research, authorship, and/or publication of this article.
Funding
The author received no financial support for the research, authorship, and/or publication of this article.
Notes
Author Biography
References
Supplementary Material
Please find the following supplemental material available below.
For Open Access articles published under a Creative Commons License, all supplemental material carries the same license as the article it is associated with.
For non-Open Access articles published, all supplemental material carries a non-exclusive license, and permission requests for re-use of supplemental material or any part of supplemental material shall be sent directly to the copyright owner as specified in the copyright notice associated with the article.