
Abstract
There is more agreement on the need for advisory services to help small and midsized manufacturers keep up with the latest managerial techniques and technologies than there is on the optimal design of those services. This study reconfigures and reanalyzes administrative data from the American Manufacturing Extension Partnership, and draws on extensive interviews with “street-level bureaucrats” at Manufacturing Extension Partnership centers, to identify and compare variation in centers’ approaches to service delivery. Centers and clients who rely on third-party providers tend to have more rather than less enduring ties, suggesting that it’s direct delivery, rather than brokerage, that is associated with one-shot deals. There is evidence also that projects generate the most impact when they help “get the relationships right” and mitigate network failures.
Small and medium-sized enterprises (SMEs) loom large in the contemporary industrial landscape. The spread of networked production models has brought with it the delegation of myriad manufacturing tasks to armies of contractors and subcontractors, and has left SMEs responsible for a large and growing share of manufacturing employment and value add. 1 This can offer systemic advantages, as SMEs can specialize and are often more flexible and reactive than their larger customers (Sturgeon, 2002; Wessner, 2013). But it also raises new policy concerns. There are, for instance, persistent gaps in the average productivity of small and large manufacturers, as well as in their propensity to invest in research and development (U.S. Department of Commerce, 2015; Wessner, 2013). The wages at SMEs are also, on average, lower. And while the so-called “firm size wage effect” has narrowed as internal labor markets decline in importance (Cobb & Lin, 2017; Hollister, 2004), Wilmers (2018) has shown that it may persist in manufacturing in part precisely because larger buyer firms have, across the past few decades, concentrated their market power vis-a-vis their (usually) smaller suppliers.
These gaps are neither inevitable nor beyond the reach of policy. The most productive small American manufacturing firms “have at least one and a half times the productivity of the median firm” (Helper & Wial, 2010, pp. 2-3). According to Bloom et al. (2017), as much as 20% of the dispersion in manufacturing productivity is due to variation in management practice. Wilmers’ (2018, p. 231) study shows not just that “value creation-oriented firms seem to be buffered from buyer power” but that “negative wage effects can be blunted when suppliers invest in distinctive capabilities through R&D.” And, though not dispositive, governments the world over are certainly convinced something can and should be done. Often-cited examples include Japan’s Kohsetsushi Centers, which foster training, testing, and technology transfer among SMEs; South Korea’s Small and Medium Business Administration, which provides SMEs with “a variety of technology and innovation support services”; Germany’s Fraunhofer Institutes, which are lavishly funded to assist large and small firms alike; and, in the United States, the Manufacturing Extension Partnership (MEP), housed in the National Institute of Standards and Technology (NIST) in Gaithersburg, MD (Ezell & Atkinson, 2011).
There is more conviction, however, that there is a need for programs to diffuse technique and technology to SMEs than there is consensus on their raison d’être and design (Lenihan, 2011; Shapira, Youtie, & Kay, 2011). The dominant view holds that SMEs are confronted by “market failures” that block their access to essential consulting services (Martin & Scott, 2000), due either to credit market constraints (Bruhn, Karlan, & Schoar, 2013) or to ignorance or uncertainty about the returns to consulting services (Glückler & Armbrüster, 2003; Shapira, 2001). An emerging alternative view—and one to which we contribute in this study—shifts the terms of debate by arguing that market failures are neither the only impediment to SME upgrading nor the sole rationale for government response. Proponents of this latter view argue that manufacturing modernization requires more than just getting the prices (incentives) right, as market failure approaches would have it, but some means also of mitigating what Schrank and Whitford (2009, 2011) define as “network failures.” They therefore advocate that policy makers concern themselves in some case also—or even instead—with “getting the relationships right” (Block & Keller, 2015; Brandt & Whitford, 2017; Keller & Negoita, 2013; Wade, 2012).
This raises, for instance, the “debate as to whether online methods can be used or whether face-to-face approaches are required” (Shapira et al., 2015, p. 114). If the concern is just that SMEs cannot find skilled providers or that they need credit to pay consultants whose results bear fruit only with time, governments might simply strive to generate a transparent and competitive private market by certifying private consultants; putting their identities, qualifications, and prices into a database that is available to their managers at cost; and using loan guarantees to ease SMEs’ credit crunch (Center for Applied Ethics, 2006; Lambrecht & Pirnay, 2005). However, if the fundamental problem is that SMEs do not know what and whom they do not know (or can trust), the policy concern is quite different. If this is the problem, the consulting services SMEs most lack will be less akin to standardized commodities like screwdrivers or even to customizable services like software. They will tend to be services necessarily “coproduced” at least in part by consultant and client together. And we should then expect network failures to be rife, and that online and on-site approaches will be more complements than substitutes (Glasmeier, Fuelihart, Feller, & Mark, 1998; Kutzhanova, Lyons, & Lichtenstein, 2009; Shapira & Youtie, 2014).
To compare these rationales and their implications, we draw on data gathered from and about the American NIST MEP system. The system is composed of a coordinating hub near Washington, D.C. and regional centers in all 50 states and Puerto Rico that are chartered as public–private partnerships, are funded only in part by the federal government, and are relatively free to choose whether and to what degree to rely on (a) field agents they employ to deliver their services directly or (b) agents to broker relationships between client firms and third-party service providers. We identify and compare two ideal-typical center orientations toward manufacturers in their territories, with one focused principally toward the mitigation of market failures, while the other is attentive to network failures. The first is premised on the idea that brokerage and boots on the ground are substitutes for each other and thus generate one-shot deals between extension agents, clients, and consultants, or the direct delivery of extension services—perhaps on a repeated basis—where private consultants are unavailable. The second is premised instead on the belief that brokerage and boots are more complements than substitutes, and thus encourages extension agents to engage client firms and third-party providers in more frequent and continuous interaction.
We find that centers and clients who engage disproportionately in brokerage across and among third-party providers have more rather than less enduring ties, which indicates that direct delivery—rather than brokerage—is associated with one-shot deals. We also find that MEP centers generate the most impact with projects that disproportionately orient toward the mitigation of network failures, which is consistent with the idea that brokerage and boots are complements rather than substitutes. These findings, in combination, suggest that we can think of extension agents as “street-level bureaucrats” (SLBs) who, in a world of opportunism, incompetence, and information asymmetries, must serve not just as honest brokers but also as trusted advisers (Lipsky, 1980; Piore, 2011). Or, to build on a metaphor Lester and Piore (2004) used to describe the role managers must play if their firms are to continuously innovate, extension agents are often asked to serve as something akin to the host of a dinner party. They might sometimes be able just to send out the invitations, make the seating arrangements, plan the menu, and sit back with a glass of wine. But if they are good hosts, they are also at the ready to steer the conversation, to guide their guests “between the shoals of boredom and hostility” (Lester & Piore, 2004, p. 11) lest the party end in acrimony with friends lost rather than found.
The Manufacturing Extension Partnerships: Background and Data Sources
The MEP was established in 1988 amid concerns both about the loss of manufacturing jobs to competitors overseas and about the decentralization of the jobs that remained from larger to smaller manufacturing firms. A key proponent—Senator Frederick “Fritz” Hollings—declared that “We’ve been winning the Nobel Prizes but losing the profits,” mobilized support by pointing to SME advisory support services elsewhere, and introduced the legislation that established a program that would help American SMEs “to play catch-up ball” (Phillips, 1988). The program has, obviously, persisted since; yet because it has been attacked repeatedly amid repeated complaints by opponents that it is a form of “corporate welfare” (e.g., Boccia, 2015; Eckerley & Walker, 1993), it never grew to the size its proponents initially proposed. It has also long been careful to regularly mobilize the support of its client base of manufacturers—notably located in every state and congressional district—and has been subject to considerable monitoring and performance evaluation by supporters and critics alike (Stone and Associates & Center for Regional Competitiveness, 2010; Wessner, 2013).
This monitoring and attention is helpful for our analysis. We ground our arguments in part in new data we have gathered through qualitative interviewing and observation at public events, but rely also on reports produced by NIST MEP centers, and on an independent reanalysis of quantitative administrative data gathered and used by NIST MEP to govern and monitor center performance. We conducted many interviews and conversations with personnel at NIST MEP headquarters dating from 2009 to the present; attended two national meetings that brought NIST MEP administrators, center directors, and key staffers together; and made formal site visits to eight regional centers. We conducted the eight site visits in 2013 and 2014, and interviewed center directors, personnel involved in the direct delivery of services to clients, personnel managing relationships with clients, representatives of third-party organizations with which centers were collaborating, and, in most cases, personnel at client firms that had done project work with the center in question. We did not share the identities of the centers we visited or those interviewed outside the research team, so interviewees could speak freely without fear of repercussions. Most interviews were recorded, with express permission from interviewees on the assurance that only their organizational roles—and not their personal names—would be used in publication.
We selected centers to visit based on a set of “self-study panel reviews” written by center personnel, normally every third year, as part of a program of benchmarking and oversight. We sampled for range, and used those reviews to prepare for visits and to compare findings from interviews with centers we did not visit. We think of the reviews as a window into the centers’ self-conception, as they are written less for public consumption than for a panel of three peer center directors and a representative from NIST MEP headquarters, who then provide recommendations to which the center is expected to respond. We were given access to one self-study from each center from (depending) 2009, 2010, or 2011. These generally included a history of the center; a description of organization and governance; a survey of key characteristics of the service territory; a list of services on offer; a summary of center relationships with other public and private actors in the regional industrial ecosystem; an account of that center’s performance on various metrics; a summary of the center’s strategic direction and vision for its future; and, in the versions provided to us, recommendations made and responses given.
Finally, NIST MEP gave us access to two databases for the years 2003 to 2009 inclusive, on the condition that we mask the identities of private firms in any publication of our results and that we follow the procedures of our respective institutional review boards for the protection of human subjects. One database contained centers’ quarterly reporting to NIST of all projects conducted with client manufacturers. It includes client demographics (e.g., North American Industry Classification System [NAICS] industry code, firm size, and so on), project names, hours of project work, project billing, the names of personnel delivering project services, and, if relevant, the names of third-party service providers. The other contained the results of an annual survey of all client manufacturers that, according to MEP center reporting, contracted for projects that had the potential for measurable impact (Voytek & Carbone, 2007; Voytek, Lellock, & Schmit, 2004). The survey is conducted by an independent third-party firm hired by NIST that asks client manufacturers to estimate the effect of any project work on sales (retained or increased), costs, job growth, and investments. However, those manufacturers are not asked to report the impacts of multiple projects in a particular year separately; instead, the manufacturers are asked to report the sum of the impact across projects (as opposed to assigning some impact to one project and some impact to another).
Manufacturing Extension and Models of Service Provision
Federal funding for the MEP system averaged $112.5 million per year, normalized to 2016 dollars, between 2003 and 2009 (when our administrative data were collected); the average would be $123 million if we exclude the outlier year of 2004, when the budget was reduced to just $38.7 million. The average federal outlay between 2010 and 2016, normalized, has been $133.5 million (authors’ calculations, applying Bureau of Labor Statistics inflation estimates to budget data gathered from Congressional Research Service reports), although the program’s effective budget is larger. Four fifths of that federal outlay is structured as conditional grants given to centers with nonoverlapping territories covering all 50 states and Puerto Rico, where a key condition has long been that they obtain alternative “matching” sources of support equal to at least twice the federal outlay (in 2017, the match ratio was reduced to 1:1; we return to this in the Conclusion). 2 Centers have been allowed to receive some of their matching funds from nonfederal government sources and from in-kind contributions, in the hopes of encouraging state and local governments to use their own funds to expand the program’s reach. However, to ensure that centers are in fact offering services that their client firms value enough to put some of their own resources on the line as well, they are expected to get a significant proportion from project work conducted with and billed to manufacturing firms with less than 500 employees. 3
The final 20% of the federal outlay supports activities where there is a perceived need for oversight or scale. NIST MEP staff at the administrative hub in Gaithersburg are charged with developing tools and services oriented toward the needs of small and midsized manufacturers, with training center staff in their use, and with gathering the data on center activies shared with us for this study. Those data are used in part as the basis for reports to justify the program’s budget to its congressional and taxpaying funders like, for instance, one in 2011 that credited center activities with creating and retaining over 72,000 jobs in 2009 by leveraging nearly $1.9 billion in new private sector investments, and by helping client firms to increase or retain sales by over $8.4 billion while generating cost savings of over $1.3 billion (MEP, 2011, p. 2, 7). 4 However, they are also used for operational purposes, and carry weight with centers that must benchmark themselves to each other and across time, and that are under pressure to generate measurable impact at significant number of client manufacturers.
The key metric in the years we examined in the quantitative data was called “MAIM” or “minimally acceptable impact metric.” The system rolled out a new metric called the CORE approach in 2012 and, although there are differences, both generate a trade-off for centers between emphasizing economies of scale by offering fewer services to more clients, or economies of scope wherein they try to offer more services to fewer clients. 5 Both also allow centers to manage this trade-off by mixing two distinctly (and bureaucratically) denominated models of service provision: (a) direct delivery, defined as an instance where field agents conduct project work with client manufacturers and bill for their time and service or (b) brokerage, wherein field agents, usually but not always for a fee, serve as liaisons to others who then conduct projects and bill for their time and service. An example of the former might be something like a “business growth project” an agent we interviewed described, where he had worked with a small manufacturer’s leadership team on “strategic planning.” Examples of the latter would be an instance in 2005, where a center brought in experts from the state technical college system to provide training in cellular manufacturing to a producer of heating systems; or in 2006 when that same center relied on a private consultant to help a maker of precision-engineered filtration products conduct a “market development” project; and so on.
There is enormous variation across centers in the mix they make of these two models, and not just in the relative share of each model in their individual project portfolios at a given time. Centers vary in terms of the use they make of direct delivery; in whether and when they view direct delivery and brokerage as complements or substitutes; and, if relying on brokerage, whether and when they refer client manufacturers to other publicly funded agencies and organizations like technical colleges or, instead, rely on for-profit organizations and consultants. Furthermore, while some of this variation is due to differences in their institutional and competitive contexts, it mostly reflects strategic choices made at the center level. 6 Those choices, in the term popularized by Lipsky (1980) but adapted by Piore (2011, p. 145), are often made by “street-level bureaucrats” whose “discretion in program development and management” critically underpins government capacity to play an “active . . . role in the management of the economy.”
In our interviews, SLBs—center directors, field agents, and the like—and their clients seemed to see the success of the MEP in both direct delivery and brokerage as reliant simultaneously on SLBs’ mastery of technical knowledge, and on their ability to form and manage relationships between a multiplicity of parties; that is, they viewed relationship management as no less central than technical knowledge. They said they cultivate their ties to private consultants, but peppered their accounts also with references to public and private organizations and programs providing or selling services to small and midsized manufacturers in their respective regions. Many had strong relationships with their state technical college systems and referred client manufacturers to them for training when appropriate. Others had developed subspecialties in the intricacies of more bureaucratic federal programs that, although intended to encourage manufacturers to make new investments or to export, had low take-up rates among SMEs that lacked the administrative slack to apply. They were often active in organizing manufacturers as well, whether by joining or helping form associations or, in two cases we heard of, by organizing local consortia of firms to collaborate on issues of skill and technology development.
Those personnel were keenly aware of the tensions that can arise in their direct provision of revenue-generating services, since this can put them into competition with local technical colleges and with private vendors they might use in their brokerage activities. They sought to manage that tension—they told us—by distinguishing themselves from existing public and private providers of services to manufacturers not so much by exploiting their subsidy to offer lower prices but rather to highlight it as a source of stability. They framed themselves as their client’s trusted advocate, as somehow different because they did not need to make a sale to survive. For instance, one field agent described a case where a consultant he had recommended “just didn’t have the chemistry with the group.” The client, he said, had not fired them but had just asked that very consultant to tell the MEP to make a different match, underscoring that there was no ill will. They had done so, and the “[new] guy wound up working on their staff, actually, 3 days a week for about a year.” Or, for an example provided us by a client, a manufacturer said he had benefitted from “a lot of [the center’s] internal services,” but that he had on some occasions also spoken with an MEP field agent about what he “was seeing internally as problems and . . . what should we do, how can we move it, how can we change things.” He had as a result been directed toward an outside consultant that “had the [center’s] seal of approval.”
Center-Level Data: Collection, Coding, and Analysis
The administrative data we received from NIST MEP were designed mainly for program monitoring and governance. We have, as a result, spent considerable time cleaning them and running numerous diagnostic checks, and have added our own coding of all third parties named as providers of impact-generating services to client firms, using Internet searches to distinguish between public entities (e.g., technical colleges), private providers (e.g., consultants), or nonprofit organizations (e.g., associations). 7 We were forced also to manage different timescales when linking the databases, because centers report projects quarterly but the survey of client impact is conducted annually; thus, we aggregated all projects in a calendar year (summing hours, billing, and the like). We excluded from our analysis projects where manufacturers are engaged in less than 5 hours of project work with a center or reported no (as opposed to low) impact, both because we have reason to believe, based on interviews, that there is heterogeneity in reporting practices for very small projects and because such fleeting engagements are of little theoretical interest for purposes here. This gives us a panel data structure of 58,227 MEP-client interactions across the 60 MEP centers, which reduces then to 18,551 interactions when aggregated to annualized projects.
We use the panel data to map the variation in centers’ relationships with clients and outside experts more generally, with a focus on how centers balance their mandate to serve several manufacturers in their territories with efforts to simultaneously develop deeper engagements with a more restricted set of firms. We first identify projects that ought disproportionately to be what clients in interviews termed “point solutions,” and to treat those projects as a sort of reference category. We operationalize that category as the set of all annualized singleton instances of direct delivery, including in that set of projects that ultimately prove only to be the first in a series, since the parties presumably do not know ex ante that these relationships will continue. These point solutions can be thought disproportionately responsive to market failures because (a) they tend to consist in services available in similar if not equivalent form from private consultants, differing mainly in that they have been tailored to the needs of smaller manufacturers and delivered at a cost that exploits scale; (b) they are offered at a price that reflects a program’s access to state and federal subsidies, and they are presumably consumed by clients at a higher rate than they would be absent their provision by the system; and (c) they can therefore be expected to generate larger impacts than those the private sector alone would have produced.
We then use two distinct measures to identify activities that would suggest SLBs are orienting also or instead toward the mitigation network failures. We operationalize the tendency for interactions between centers and particular client manufacturers to sometimes thicken into durable relationships, with a running count of the number of uninterrupted sequential interaction years between a manufacturer and an MEP center, restarting from zero if a center–client interaction was interrupted for at least 1 year. 8 We identify an annualized set of projects as expert bridging whenever a third party—an individual or organization who was not employed either by the coordinating center or the client firm—delivered at least some of the consulting services, and distinguish between projects brokered to other public, nonprofit, or for-profit organizations. 9 We also code “mixed” cases where a center reports that one project was directly delivered while a second project with that same client in that calendar year was brokered as an instance of expert bridging, as this generates a conservative bias in the results reported below.
Figures 1 and 2 plot these various measures. Centers in both figures are identified with numbers, with the eight we visited using darker text so the reader can confirm that we, in fact, spoke to centers that vary in approach. Figure 1 plots the relative share of each center’s projects (i.e., of center–client interactions in our panel) with clients that had also conducted a project in the previous year on the x-axis (i.e., relationship thickening); the share in which a third party was substantially involved on the y-axis (i.e., expert bridging). The reader can infer that the remainder are tagged in our database as point solutions (which is not to say we think all were; this is a rough upper bound). Figure 2 plots the share of projects brokered to public third parties on the y-axis, while the share brokered to for-profit private third parties is on the x-axis; the remainder are, mostly, cases of direct delivery since relatively few projects are brokered to nonprofit associations or to those we could not categorize.
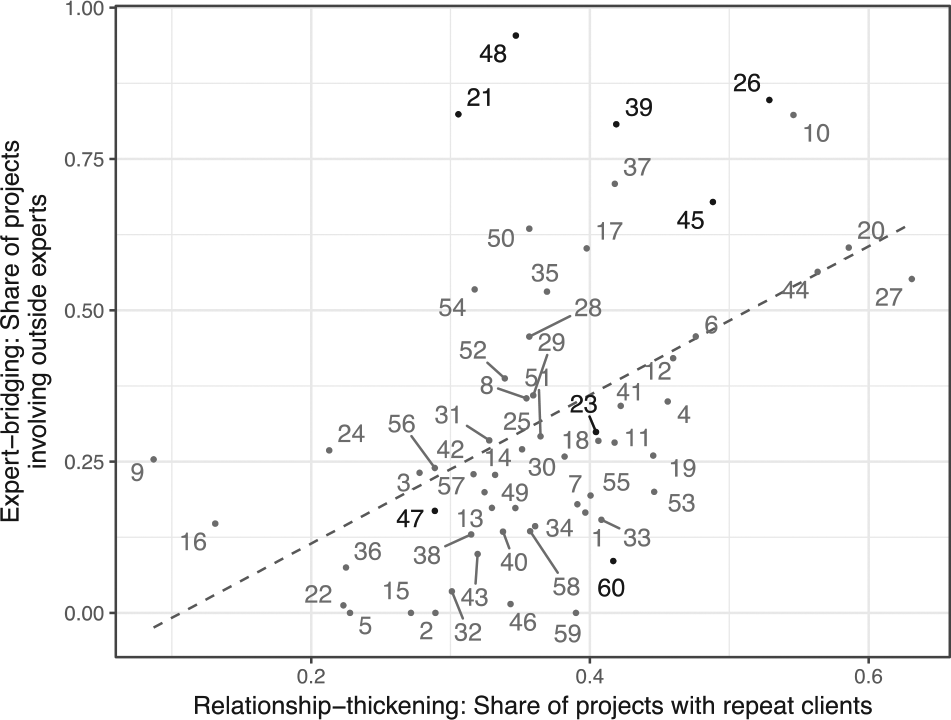
Variation of delivery models.
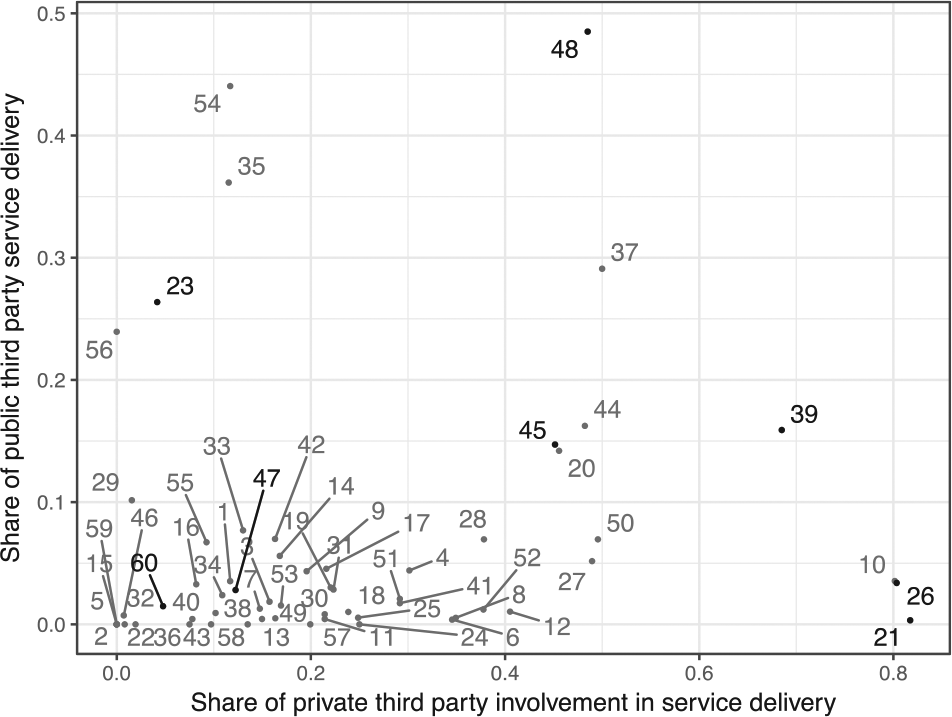
Variation of third-party involvement in delivery models.
The figures are consistent with the hypothesis that brokerage and boots on the ground are more complements than substitutes. Figure 1 shows that centers that are more inclined to turn to third parties for support also boast thicker ties to their clients (r = .5; p < .01). Figure 2 shows that brokerage to private third parties is more common, but that there is some variation. Both figures show that we visited centers that vary widely on our dimensions of theoretical interest. We visited some that develop more thick ties while also pursuing extensive brokerage (26, 39, 45); some that pursue brokerage in the absence of thick ties (48, 21); one that has thinner ties and less brokerage (47); one that boasts thicker ties but nonetheless depends more on direct delivery (60); and one that appears more or less typical on all counts (23). Similarly, it is clear in Figure 2 that brokerage to private third parties is more common, although there is some variation, and that the centers we visited vary widely. Centers 21, 26, 39, and to a lesser degree 45, rely primarily on private third-party providers; centers 48, and to a lesser degree 23, are more inclined to work with public entities; 47 and 60 are, as already noted, inclined toward direct delivery.
Client-Level Data: Street-Level Bureaucrats, Brokerage, and Boots on the Ground
The finding that centers relying more heavily on brokerage are more likely to develop thick ties to their clients—and vice versa—is consistent not just with our dinner party analogy and the network failure approach, but with our interviews as well. For example, one field agent we interviewed told us that the relationships he built with clients were grounded less in the simple selling of project work—he could perhaps sell more if he simply hit up more clients—than in his desire to “become a change agent” by leveraging his time “in introducing companies to new and changing services and initiatives that are out there.” Others echoed this sentiment, including interviewees at client firms with one saying,
I think most manufacturers are not looking for a handout; they are looking for a connection. The nice thing about the relationships that we have [with our MEP agent] is that I trust him. If he says something, I’m more likely to believe him. The people he puts in contact with us have been vetted . . . and can probably do what we need them to do. That’s a big deal!
These examples are indicative, but interviews are selective, and a center-level correlation says nothing about the overall effectiveness of the different approaches. We therefore next compare whether different sorts of client-center interactions are associated with differential effects at the client level. We do not and cannot compare whether the MEP system generates better results than the private sector alone because we cannot control for selection with data drawn just from firms that have already elected to engage with an MEP center. We note, however, that such an analysis has recently been published in this journal by Lipscomb, Youtie, Shapira, Arora, and Krause (2017, p. 29). Their study matching MEP data with the U.S. Census Bureau’s Longitudinal Business Database shows that MEP services “increased the probability of establishment survival for the 1997 to 2007 period,” and that there are “significant productivity differences associated with MEP services by broad sector, with higher impacts over the 2002 to 2007 period in the durable goods manufacturing sector” (see also Jarmin, 1999, for a similar earlier analysis and findings).
Our findings complement their results by exploiting internal variation in the delivery of services in the system as it has operated to date.
We use the quantitative administrative data and the client survey to examine whether more relationship-oriented interactions—those we tag as repeat and brokered interactions—are associated with better or worse results relative to the baseline case of the point solution. We use a pooled regression with fixed effects for center territories, where our dependent variable is the logged sum of the client’s estimate of any reduction in costs plus sales retained or increased that can be ascribed to project work delivered or brokered by an MEP center. We use this indicator because our respondents believe that the dollar results are the most consistently measured across different centers and projects. We log because, as can be seen in Table 1 (which reports the descriptive statistics and frequencies), there is right skew in the distribution: The median project generates about $300,000 in summed impact, while the average is eight times larger. This skew is consistent with what we heard in interviews, where we were told that highly successful and/or longer projects could generate very substantial results on occasion. It also correlates to a similar right skew in the size of projects, measured either in the number of hours or in billed dollars, which can of course generate more substantial impact simply by way of more inputs, and to skew in the size of client manufacturers, since it is easier to get $300,000 in savings at a company with $10 million in sales than at a company with $1 million in sales. 10
Descriptive Statistics.
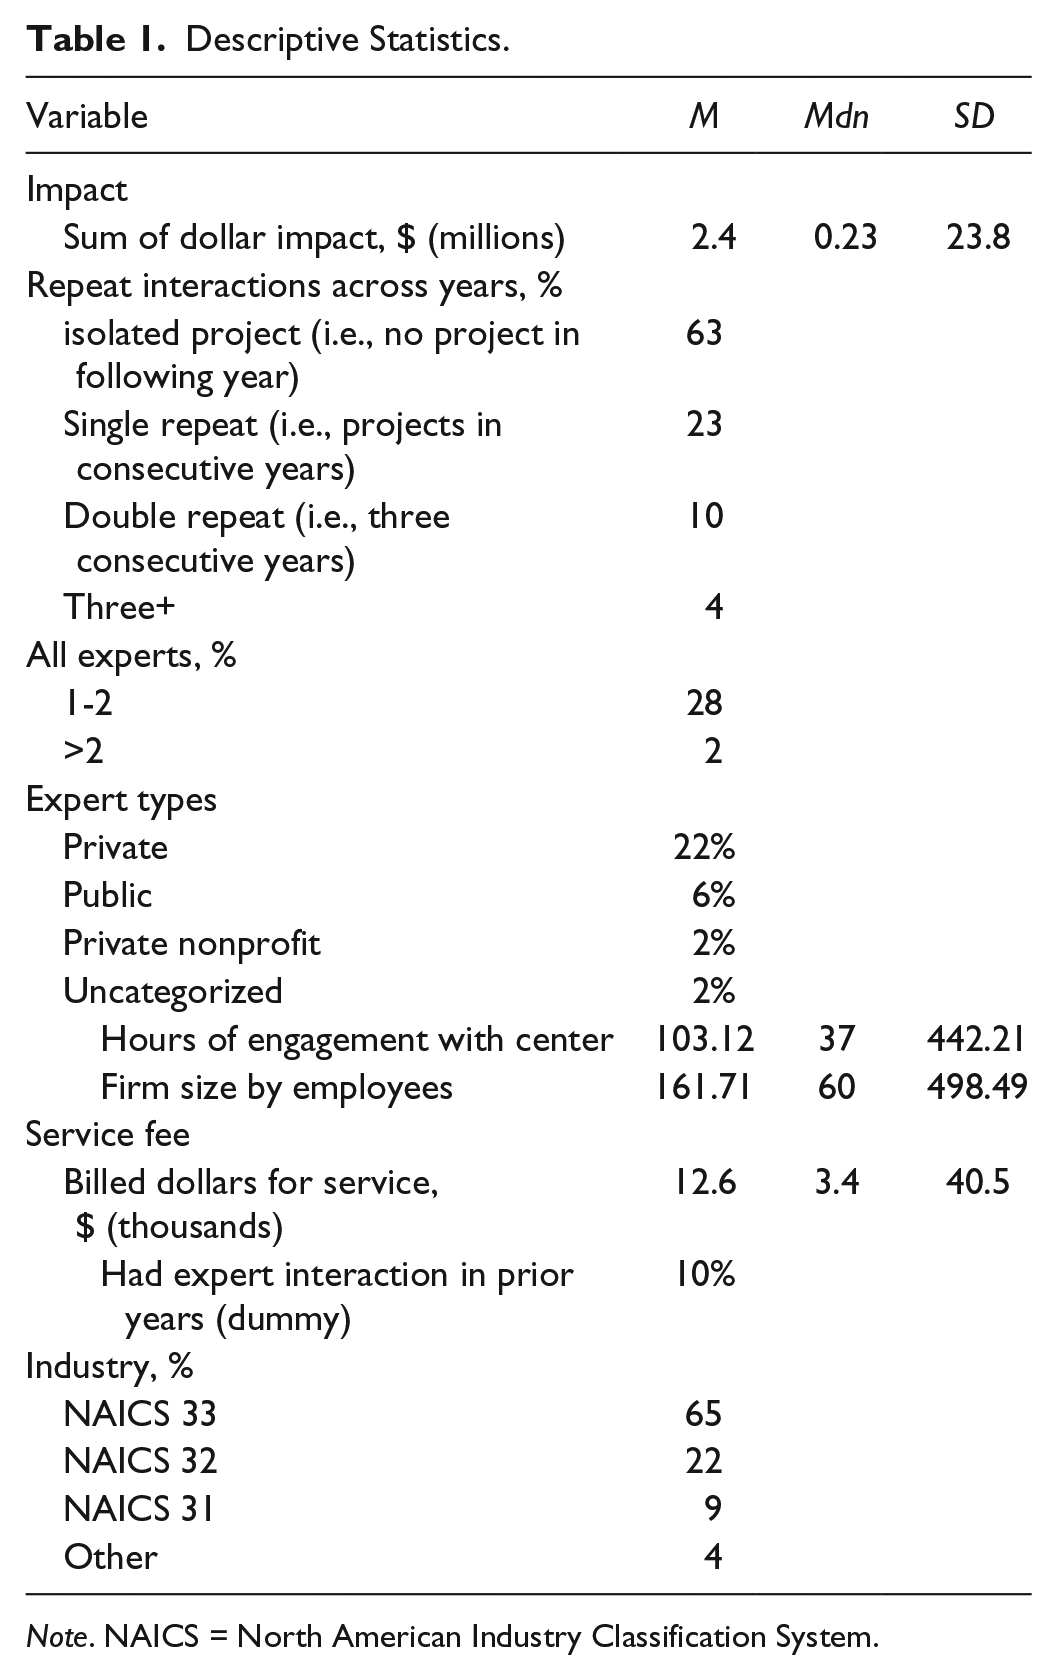
Note. NAICS = North American Industry Classification System.
We place our measures of expert bridging and relationship thickening, and, in one model, dummy variables distinguishing public from private third parties, on the right-hand side. We also remind that we are modeling the population of projects, thus although we cannot control for selection we need not be concerned about sampling error and sampling bias; observed variance in the model reflects real variance in reported firm and project characteristics. The frequencies of our main and control variables are reported in Table 1. We can observe that 63% of projects are not followed by a project in the following year, whereas 23% are. A first project is followed by projects in the next 2 years 10% of the time, while it is followed by projects in 3 or more years 4% of the time. We see also how much more common direct delivery is than brokerage—the ratio is about 2:1—and how much more often brokerage connects client manufacturers to private organizations as opposed to other public agencies (Figures 1 and 2 showed variation across centers but offered no control for center size; here, the denominator is all annualized projects). Finally, we identify predictable right skew in a series of control variables, which we log in our model as result. The controls are client size (logged number of employees), project size (logged fee dollars), intensity of engagement (logged project hours during a given year), and industry (using the NAICS code at the two-digit level, NAICS 33 as the omitted category), since there may be industry-level differences in the potential for measurable improvement.
We use an ordinary least squares regression with center-level fixed effects for both theoretical and practical reasons. We are interested theoretically in heterogeneity not just between center strategies but within those strategies as well because we believe, based on interviews, that SLBs have some discretion in how to allocate their time and attention. We are therefore trying to identify trace effects of the efforts of center SLBs to balance their mission of spreading the gospel of manufacturing modernization as widely as possible, while also serving as ongoing “change agents” at SMEs that, though wary of consultants selling snake oil, need honest and competent advice. We are constrained practically because center territories are nonoverlapping, the manufacturing economies in those territories differ, and firms in those territories are therefore differently “at risk” of impact from project work. We cannot control for territory without controlling for competitive and institutional context. We therefore use a fixed effects model to compare the effects of the projects themselves, rather than comparing centers operationalized as aggregations of projects while controlling also for unobserved center and regional effects. 11
Table 2 reports the results of two models, where main variables on the independent side are the integer counts of projects categorized as “thickened” or “brokered” (the omitted categories correspond to the origin in Figure 1, to projects tagged as point solutions). We use asterisks to denote conventional levels of statistical significance but remind the reader that we are modeling a population (as opposed to a sample) of MEP-client interactions (Gelman, 2013; Greenland et al., 2016). Model A should therefore be interpreted as a simultaneous comparison with controls of differences in logged dollar impact generated at clients between a center’s first or only project directly delivered to a client, and projects that are either a second (or third, etc.) project in consecutive years, or a project where some of the services were brokered from a third party. Model B is the same, but rather than aggregating all third parties into an outside category, we use dummy variables to compare differences in impact between projects brokered to public, private for-profit, and private nonprofit third parties. 12 In both models, controls for hours, amount billed, and firm size are positive as expected (displayed in rows labeled 4 through 6). Also in both models, the confidence intervals can be interpreted as the probability that the reported dollar value of a random draw from our database with some value (whether continuous or categorical) will be greater than (less than) the dollar value of a project tagged as a point solution with those same values.
OLS Models of Reported Project Impact.
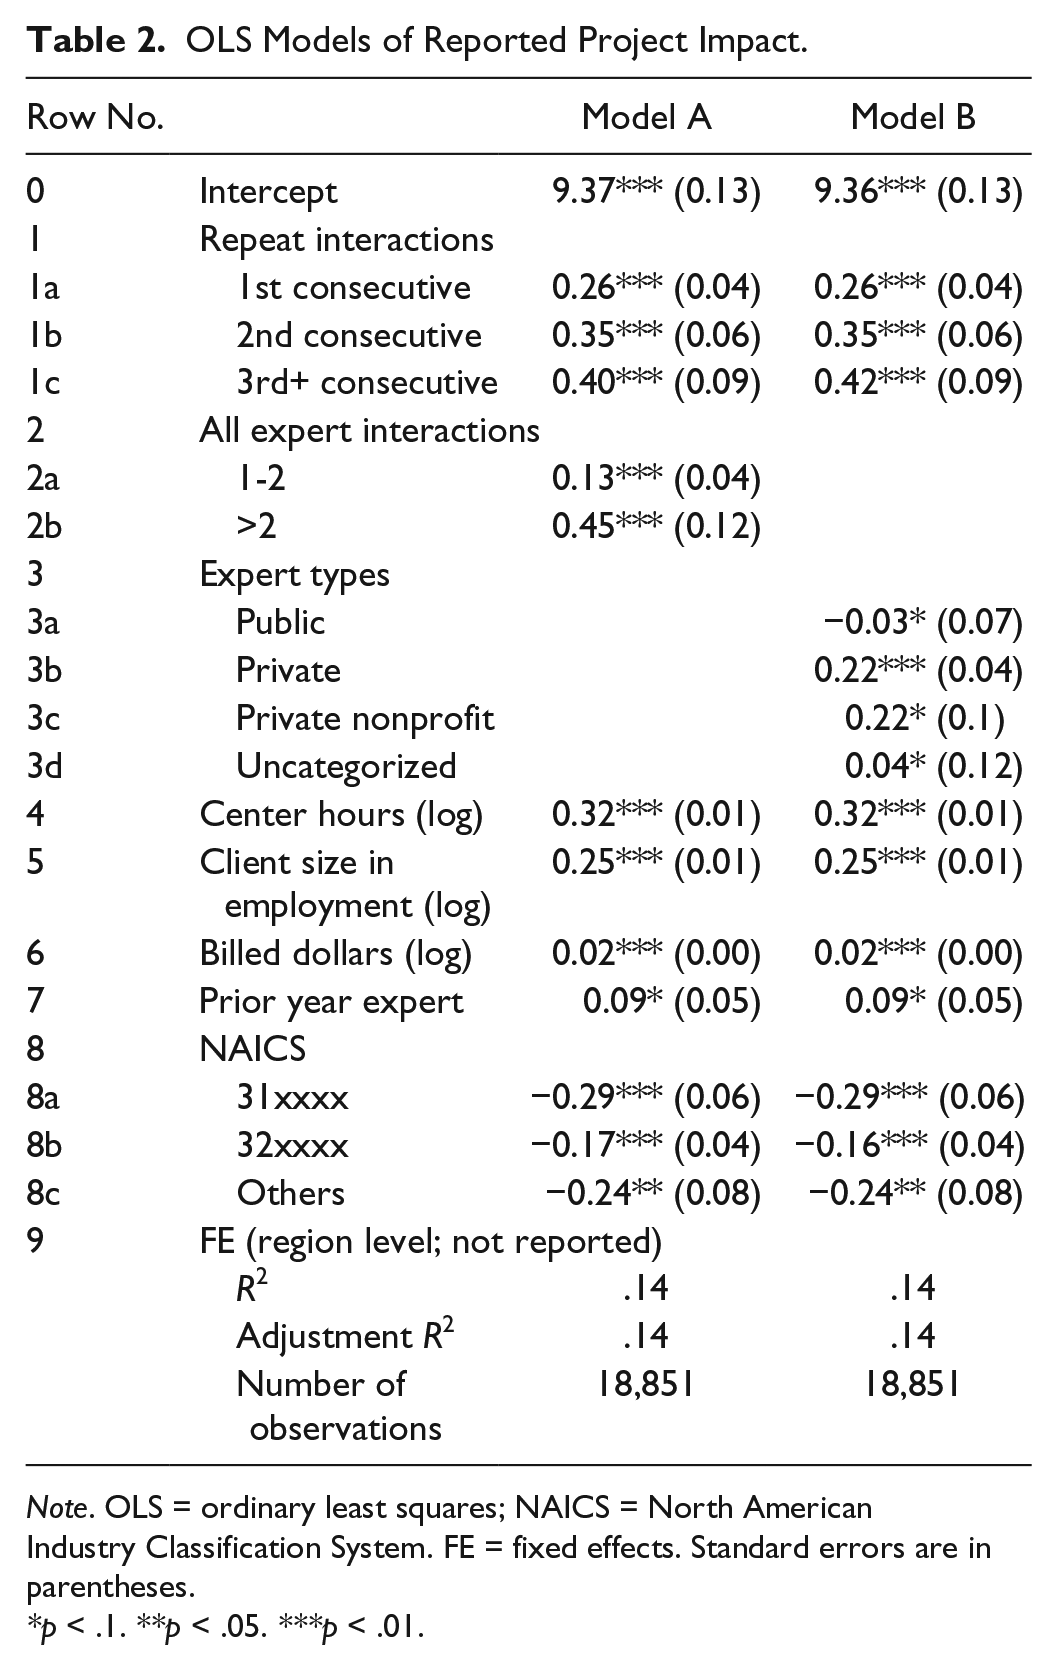
Note. OLS = ordinary least squares; NAICS = North American Industry Classification System. FE = fixed effects. Standard errors are in parentheses.
p < .1. **p < .05. ***p < .01.
The coefficients for the main independent variables in Model A—displayed in Rows 1a to 1c, 2a to 2b, and 7—indicate that centers and clients generate more impact as they learn to work together. The coefficient in Rows 1a to 1c, for instance, is positive and can be interpreted to mean that if an MEP center worked with a client in both 2005 and 2006, the reported effect (net of controls) was greater in 2006 than in 2005. If they worked together in 2007 as well, the reported effect (net of controls) was greater still and, if there was a project in 2008, the reported effect (net of controls) was greater still. If we hold other variables constant, we estimate that the $226,000 in reported cost reduction and/or sales retained or increased that is our median project would grow in year 2 by 30% to $293,000, by an additional 9% to $321,000 the year after that, and so on. 13 This finding is consistent with interviewee claims that the thickening of relationships across years allowed them to undertake and successfully complete more complex projects with the potential for larger returns because—in the words of a field agent—when “you are building the relationship right you are always going to have time to come back to the thing you forgot the week before or whatever.” It also runs counter to the market failure approach, which depicts center personnel as more-or-less-substitutable vectors of information diffusion, as that approach predicts that a first project should provide the greatest opportunity to exploit expertise previously unavailable to the client firm. 14
Row 2a displays the reported impact net of controls of projects in a year brokered to one or two different experts (i.e., one project with third party A, or one project with A and one with B), while Row 2b reports the impact of a project with three or more different experts. We draw the distinction between the number of experts to capture variation, as a market failure approach concerned with moral hazard would lead one to worry that centers might funnel work to confidants or perhaps “cherry pick” the projects with the greatest potential impact for themselves. The coefficients of the variables are, however, positive and significant, and this is again consistent with claims in interviews that the SLBs at MEP centers are doing diagnostic work and effectively directing client firms toward appropriate sources of expertise. Model B, which distinguishes between public, private, and private-nonprofit, reinforces this interpretation by showing that projects brokered to other public agencies differ little from the baseline category of the point solution. Those public agencies are often state technical college systems that provide cost-effective training. They are an essential part of any manufacturing ecosystem and often rely on MEP centers for outreach to manufacturing firms unaware of their offerings. Those offerings, however, are not, for the most part, highly customized and thus should not be expected to generate impacts that run beyond those available in a point solution.
The magnitude of expert-brokering effects is again substantial, increasing returns by 14%—from $226,000 to $257,000 at the median—if the center reports incorporating one or two outside experts into the project. Their direction and magnitude also combines with the results in Rows 1a to 1c to provide an internal control against any concerns about reporting biases in our dependent variable. We have already built in a conservative bias by excluding projects where manufacturers either reported no impact or engaged in less than 5 hours of project work, since such projects would almost always be classified as “point solutions” and their inclusion would have increased the measured relative effects of relationship thickening and expert bridging even with controls for project hours. We cannot exclude that the consolidation of trust across repeat interactions could bias our measurement of the effects of relational thickening, since clients who are happy with their field staff may inflate results so that the center in question will then perform better on NIST MEP metrics. However, if clients are inflating results to favor center field staff, the bias for expert service delivery should run in the other direction and we could expect the results in Rows 2a and 2b to be lower; in fact, the reported impact of centers’ bridging to experts also engender better outcomes than do initial interactions with center staff.
Finally, the coefficient reported in Row 7, which compares differences in impact between our baseline point solution first direct delivery and a project preceded by brokerage, is positive, though with enough variance that the reported confidence interval does include the zero line. More testing is therefore warranted, but we can at least suspect that the effect of repeat interactions, or relationship thickening, is attenuated but still positive even when the prior project was not delivered directly but was instead brokered. This is consistent with the idea that centers do not merely hand off projects to third parties, but serve instead as guides, mentors, and troubleshooters. The process, as one interviewee explained, is one of deciding “which one is the best fit.” He would sometimes just say, “‘You need to use this person,’ because you kind of know it’s a good fit.” At other times—when he knew there were multiple who could match—he offered a range of names. He also said, “I think we get a lot of respect for that,” in the former case because he was willing to stake his reputation and in the latter “because they understand that I don’t care which one . . . they pick.”
Conclusion
Twenty-first century manufacturing economies are often portrayed as simple amalgamations of isolated firms or “chains” of autonomous organizations adding value in a straightforward and sequential process. But there is a growing consensus among academic observers and, increasingly, among policy makers, that it is far better to think of them as complex ecosystems full of interdependent parts that—in all modern economies—rely on and incorporate actors in public agencies in many and varied ways. Those agencies are themselves organizations, and are in their day-to-day activities represented by “SLBs” with varying degrees of expertise and autonomy. Still they have demonstrably been able in countries across the globe to found agencies able to influence whether and how private actors use their productive capacity in a healthy and sustainable manner, often by encouraging the diffusion of the technologies and management practices associated with higher rates of manufacturing productivity (Bloom et al., 2017; Helper & Wial, 2010). That demonstration that SME performance is favored by access to advisory services has not, however, translated into a consensus on their raison d’être and design.
Our contribution to this debate combines secondary and interview data with a theoretically informed alternative analysis of some of the administrative data the MEP system gathers in the everyday conduct of its business. We examine how line-level personnel in the MEP manage the trade-off between the direct delivery and the brokerage of advisory services across varied and changing economic and social conditions. Our goal has been to help understand how policy makers can transition to a world dominated by networked production models, one where they are increasingly asked to overcome barriers to the efficient transfer of technology, technique, and tacit know-how to, and among, a heterogeneous population of small and midsized manufacturing firms. We show in our analysis that those barriers are, in the American case at least, due not just to the market failures typically cited as the main “economic rationale for public participation in private affairs” (Weimer & Vining, 2011, p. 71), and argue that it is therefore not enough just to use subsidies to “get the prices right.” It is critical to recognize that network failures are ubiquitous and persistent too, and that government agencies can act affirmatively to help “get the relationships right.”
When manufacturers know and trust their MEP agents, they are more likely to maintain ongoing relations with the center, of course. But less intuitively, they are more likely also to develop enduring relationships with third-party providers that are then triadic, thus reinforcing the network structures of their regional economies. By contrast, when they have thinner relationships with their MEPs, they are less likely to rely on third-party support and more likely to rely on direct, one-shot deals with their extension agents. This runs counter to the idea that brokerage and boots are generally substitutes for each other, and predicts that online approaches are unlikely to efficiently replace their on-site counterparts in the diffusion of new technologies and cutting-edge managerial practice to small and midsized manufacturers, at least not anytime soon. Extension agents often need to know not just what their clients need—since their clients may not know themselves—but also whether and to what degree it is available, from whom, at what price in their regional economies, and whether its provision by one party or another is more likely to fit the profile of this or that manufacturer. Such knowledge is almost invariably bespoke, frequently tacit, not easily codified, and thus cannot be reduced to the development of a “‘black list’ of poorly performing (technically and ethically) consultants as well as a ‘gold star’ list of consultants who have a record of outstanding ethical and technical service” (Center for Applied Ethics, 2006, p. 8).
Our arguments and findings also bear implication for those trying to make sense of the chaos that has since its inception marked the American federal government’s treatment of the MEP. The program has long been popular on Capitol Hill and has many champions in industry, but has also faced resistance for just as long from groups disputing that the program responds to market failures (let alone to network failures). The program has, as a result, nearly been eliminated multiple times in its three decades of existence, only to see new funding and the allocation of new responsibilities some years later as the political winds change (Brandt & Whitford, 2017; Hallacher, 2005). It was, for instance, given new responsibilities by the Obama administration, and drawn into the National Network for Manufacturing Innovation and into the Investing in Communities Partnership. It was also reauthorized by unanimous consent in January 2017, and granted permission to reduce the ratio of funding centers must get from project work or other sources from 2:1 to 1:1 (American Innovation and Competitiveness Act, 2017).
These are all changes that should help MEP field agents orient toward network failures, although they must still generate revenue and must still offer services manufacturers value, since they can focus more energy toward relationship building or more intensive brokerage. They should be able to channel more of their energy toward smaller manufacturers—which have smaller budgets and will therefore increases agents’ “windshield” time—rather than working principally with larger manufacturers with more resources but fewer, if bigger, projects. However, because the program was again slated for elimination in the Trump administration’s proposed 2018 budget—although at the time of this writing it seems it has again been saved by Congress—centers are rationally wary of making significant or difficult-to-reverse changes to exploit the possibilities the change to their federal funding ratio should offer. They are, after all, public–private organizations that answer also to state and local governments, and to their boards, and that are embedded in their manufacturing community. They would, in many cases, survive without federal funding. But they would do so—as a representative of the Modernization Forum said in 2002 in the face of a prior existential crisis of the program’s federal home—by turning “where the bucks are,” toward larger firms, and scrapping their “public mission of serving the underserved market of small manufacturers” (McCormack, 2002).
Footnotes
Acknowledgements
We must first thank personnel at NIST-MEP, MEP centers, and client manufacturers. Ken Voytek and Mark Schmit were especially generous in facilitating the sharing of NIST-MEP data, and in helping us understand the ins and outs of their database. We would like to thank Economic Development Quarterly for organizing a researchers’ roundtable in July 2017, where we presented some initial findings and received helpful feedback, and the editors and the anonymous reviewers for their constructive engagement with the initial submission. We also recognize assistance provided on the project, especially by Lucia Bazzucchi, Douglas Puett, and Jessica Garrick.
Authors’ Note
The listing of author names is alphabetical. It is truly joint work.
Declaration of Conflicting Interests
The author(s) declared no potential conflicts of interest with respect to the research, authorship, and/or publication of this article.
Funding
The author(s) disclosed receipt of the following financial support for the research, authorship, and/or publication of this article: The project was funded by a grant from the National Science Foundation’s program on the Science of Science and Innovation Policy, award number 0965187.