
Abstract
This article builds on existing research focusing on the intersection of environmental sustainability and economic development while also contributing to a better understanding of the federal economic development landscape. Two major parts of this research work to understand federal economic development spending from 2003 to 2023 and how well environmental sustainability has been integrated into two of the largest programs. The findings reveal that the federal government has been a significant player in economic development, with more than $450 billion in average annual outlays during the study period. However, the two programs studied show minimal integration of environmental sustainability considerations. This research also highlights significant policy and implementation fragmentation in federal economic development spending.
In the face of global competition for jobs, tax dollars, and wealth, policy makers across the United States have created programs aimed at improving the economy, facilitating the creation and preservation of jobs, and increasing the standard of living within their communities. At the same time, concerns over global climate change and environmental quality have prompted many governments to develop policies to protect and preserve the natural environment (Opp & Saunders, 2013; Portney, 2013). How these two policy areas intersect is important given the impact that each can have on the other and on the overall quality of life.
In the not-too-distant past, economic development and environmental protection were viewed as being largely incompatible. Concerns over mobile capital and interjurisdictional competition for development caused many policy makers to be reluctant to engage heavily in environmental protection efforts for fear that it may deter investment (Osgood et al., 2012; Peterson, 1981). However, in the last few decades, there has been a recognition that environmental concerns can be effectively addressed while also pursuing traditional economic development needs (see Opp & Osgood, 2013). In fact, many communities are actively and openly embracing green and sustainable economic development programs (Opp & Saunders, 2013). Although a growing body of research studies the intersection of local economic development and environmental protection policies, comparatively little research explores how—if at all—federal investments in economic development are engaging with environmental sustainability. Given the sheer size and scope of the federal investment into economic development, it is important to understand how these efforts may be impacting sustainability and the natural environment.
This article builds on the growing body of research (see Du & Yi, 2022; Osgood et al., 2017; Portney, 2013) that explicitly focuses on the intersection between environmental sustainability and economic development while also contributing to an improved understanding of the federal economic development landscape. This research begins to fill that gap by identifying and analyzing all federal economic development spending from 2003 to 2023. Using Office of Management and Budget (OMB) function codes, this research identified and studied two of the largest federal economic development programs to determine how—if at all—environmental sustainability considerations are accounted for in the program's design, implementation, decisions on funding allocation, and overall impacts. Specific research questions for this article include:
What investments in economic development have occurred in the federal government from 2003 to 2023? What agencies and programs are the key drivers of federal economic development spending? How does sustainability factor, if at all, into two of the largest federal economic development programs? What lessons can be gleaned from federal economic development spending that can inform research and policy development?
Approach and Scope
To begin the process of cataloging federal economic development spending, it is necessary to first define an “economic development” expenditure. But defining economic development is not a simple task. Not only do a multitude of definitions exist, but the definitions have changed over time. Early research on economic development defined it as a variant of wealth creation usually operationalized as more jobs, more tax revenues, or some combination of the two (Bartik, 1990; Blakely & Bradshaw, 2002). In recent years, some economic development scholars have expressed concern that this historical understanding of economic development has contributed to income inequalities, environmental degradation, and the long-term destabilization of some communities (Blakely & Leigh, 2013). The important, but often missed, distinction between economic growth and economic development can help explain some of the differences in the understanding of economic development over time. Early definitions of economic development describe something more akin to economic growth than economic development. Pursuing economic growth without consideration of quality of life and improvement in a community can be blamed for some of the most significant problems facing communities across the United States (Hammer & Pivo, 2017). Economic development, unlike economic growth, implies an improvement rather than just growth. Community improvement is not always experienced when policy or program goals are simply seeking new jobs or additional wealth. It is important to note that economic development does not completely disregard the goals of increased jobs and wealth; it includes quality of life and improvement in a community as part of the overarching goals for successful economic development.
In recent years, many economic development scholars have intentionally included quality-of-life considerations in their definition and understanding of economic development (see Koven & Lyons, 2010). A common aspect of quality of life is the condition of the natural environment. To be sure, access to clean air and water, open spaces, and other environmental amenities have an impact on quality of life for residents of any community. In fact, promoting sustainability has been categorized as an important economic development tool in some recent research with the expectation that communities with a high standard of living will attract more investment (Koven & Lyons, 2010; Osgood et al., 2012). Recognizing the importance and potential relationship between sustainability policy and economic development, policy scholars have started to explore aspects of the relationship between these two policy areas. This growing body of research provides examples of case studies where green economic development is successful, explores the willingness of cities to engage in sustainability when economic conditions are challenging, and studies the relationships between environmental motivations and economic development strategies, to name a few (Opp & Osgood, 2013; Zhang et al., 2017). Building on this body of research, this article studies the intersection between environmental sustainability and federal economic development spending to begin to build a better understanding of how these federal efforts may support or hinder environmental sustainability goals across the United States.
This article has two separate but related parts. First, this research defines, identifies, and catalogues 20 years, 2003–2023, of federal economic development spending to understand where in the federal bureaucracy and in which categories economic development outlays are occurring. The United States has experienced several unique and economically impactful events in the years since the 9/11 terrorist attacks that likely influenced federal economic development spending requiring a longer-term look at spending trends. For example, the global financial crisis of 2007–2009 was a significant economic stressor that likely contributed to changes in federal economic development spending as the nation tried to improve the economy and rebound from the crisis. Additionally, the Covid-19 pandemic and the resultant efforts to support economic recovery likely influenced federal economic development spending. By examining 20 years of spending, this research is more likely to minimize any unique short-term influences that may have occurred because of these types of events. The 2003–2023 outlays are used to identify the largest categories of economic development spending, the administrative units responsible for those outlays, and the agencies that spend a significant portion of their budgets focused on economic development activities.
The second major part of this article uses program documents, legislation, and agency guidance to study how and whether sustainability and environmental considerations are included in two major federal programs: Federal Highway Administration programs in the Department of Transportation (DOT) and the business loan programs in the Small Business Administration (SBA). This research provides the academic and policy community with important insights into how the federal government's investments in economic development may be engaging with environmental sustainability concepts.
Part 1: Defining and Identifying Federal Economic Development Outlays
According to Leigh and Blakely (2013), economic development “is achieved when a community's standard of living can be preserved and increased through a process of human and physical development that is based on principles of equity and sustainability” (p. 72). The authors go on to identify four common strategic approaches to economic development:
Physical Development Business Development Human Resources Development Community-Based Development
Although these categories are not exhaustive, they represent the most common approaches to economic development policy and are used as the starting point to identify and classify federal economic development spending in this research.
Mirroring the approach of Drabenstott (2005), this research uses OMB function codes to identify specific outlays that fall under the umbrella of economic development. After collecting the outlays, specific programs responsible for them were identified. The OMB codes used in this research are organized into four major categories that largely align with Leigh and Blakely's (2013) four economic development strategies. However, given the importance of innovation and technology development to the “new economy,” innovation is also considered in this research and included within the business development category (Leigh & Blakely, 2017). Table 1 provides an overview of the budget codes used in this research. Each category is explained in greater detail below.
Economic Development Outlays and Federal OMB Codes.
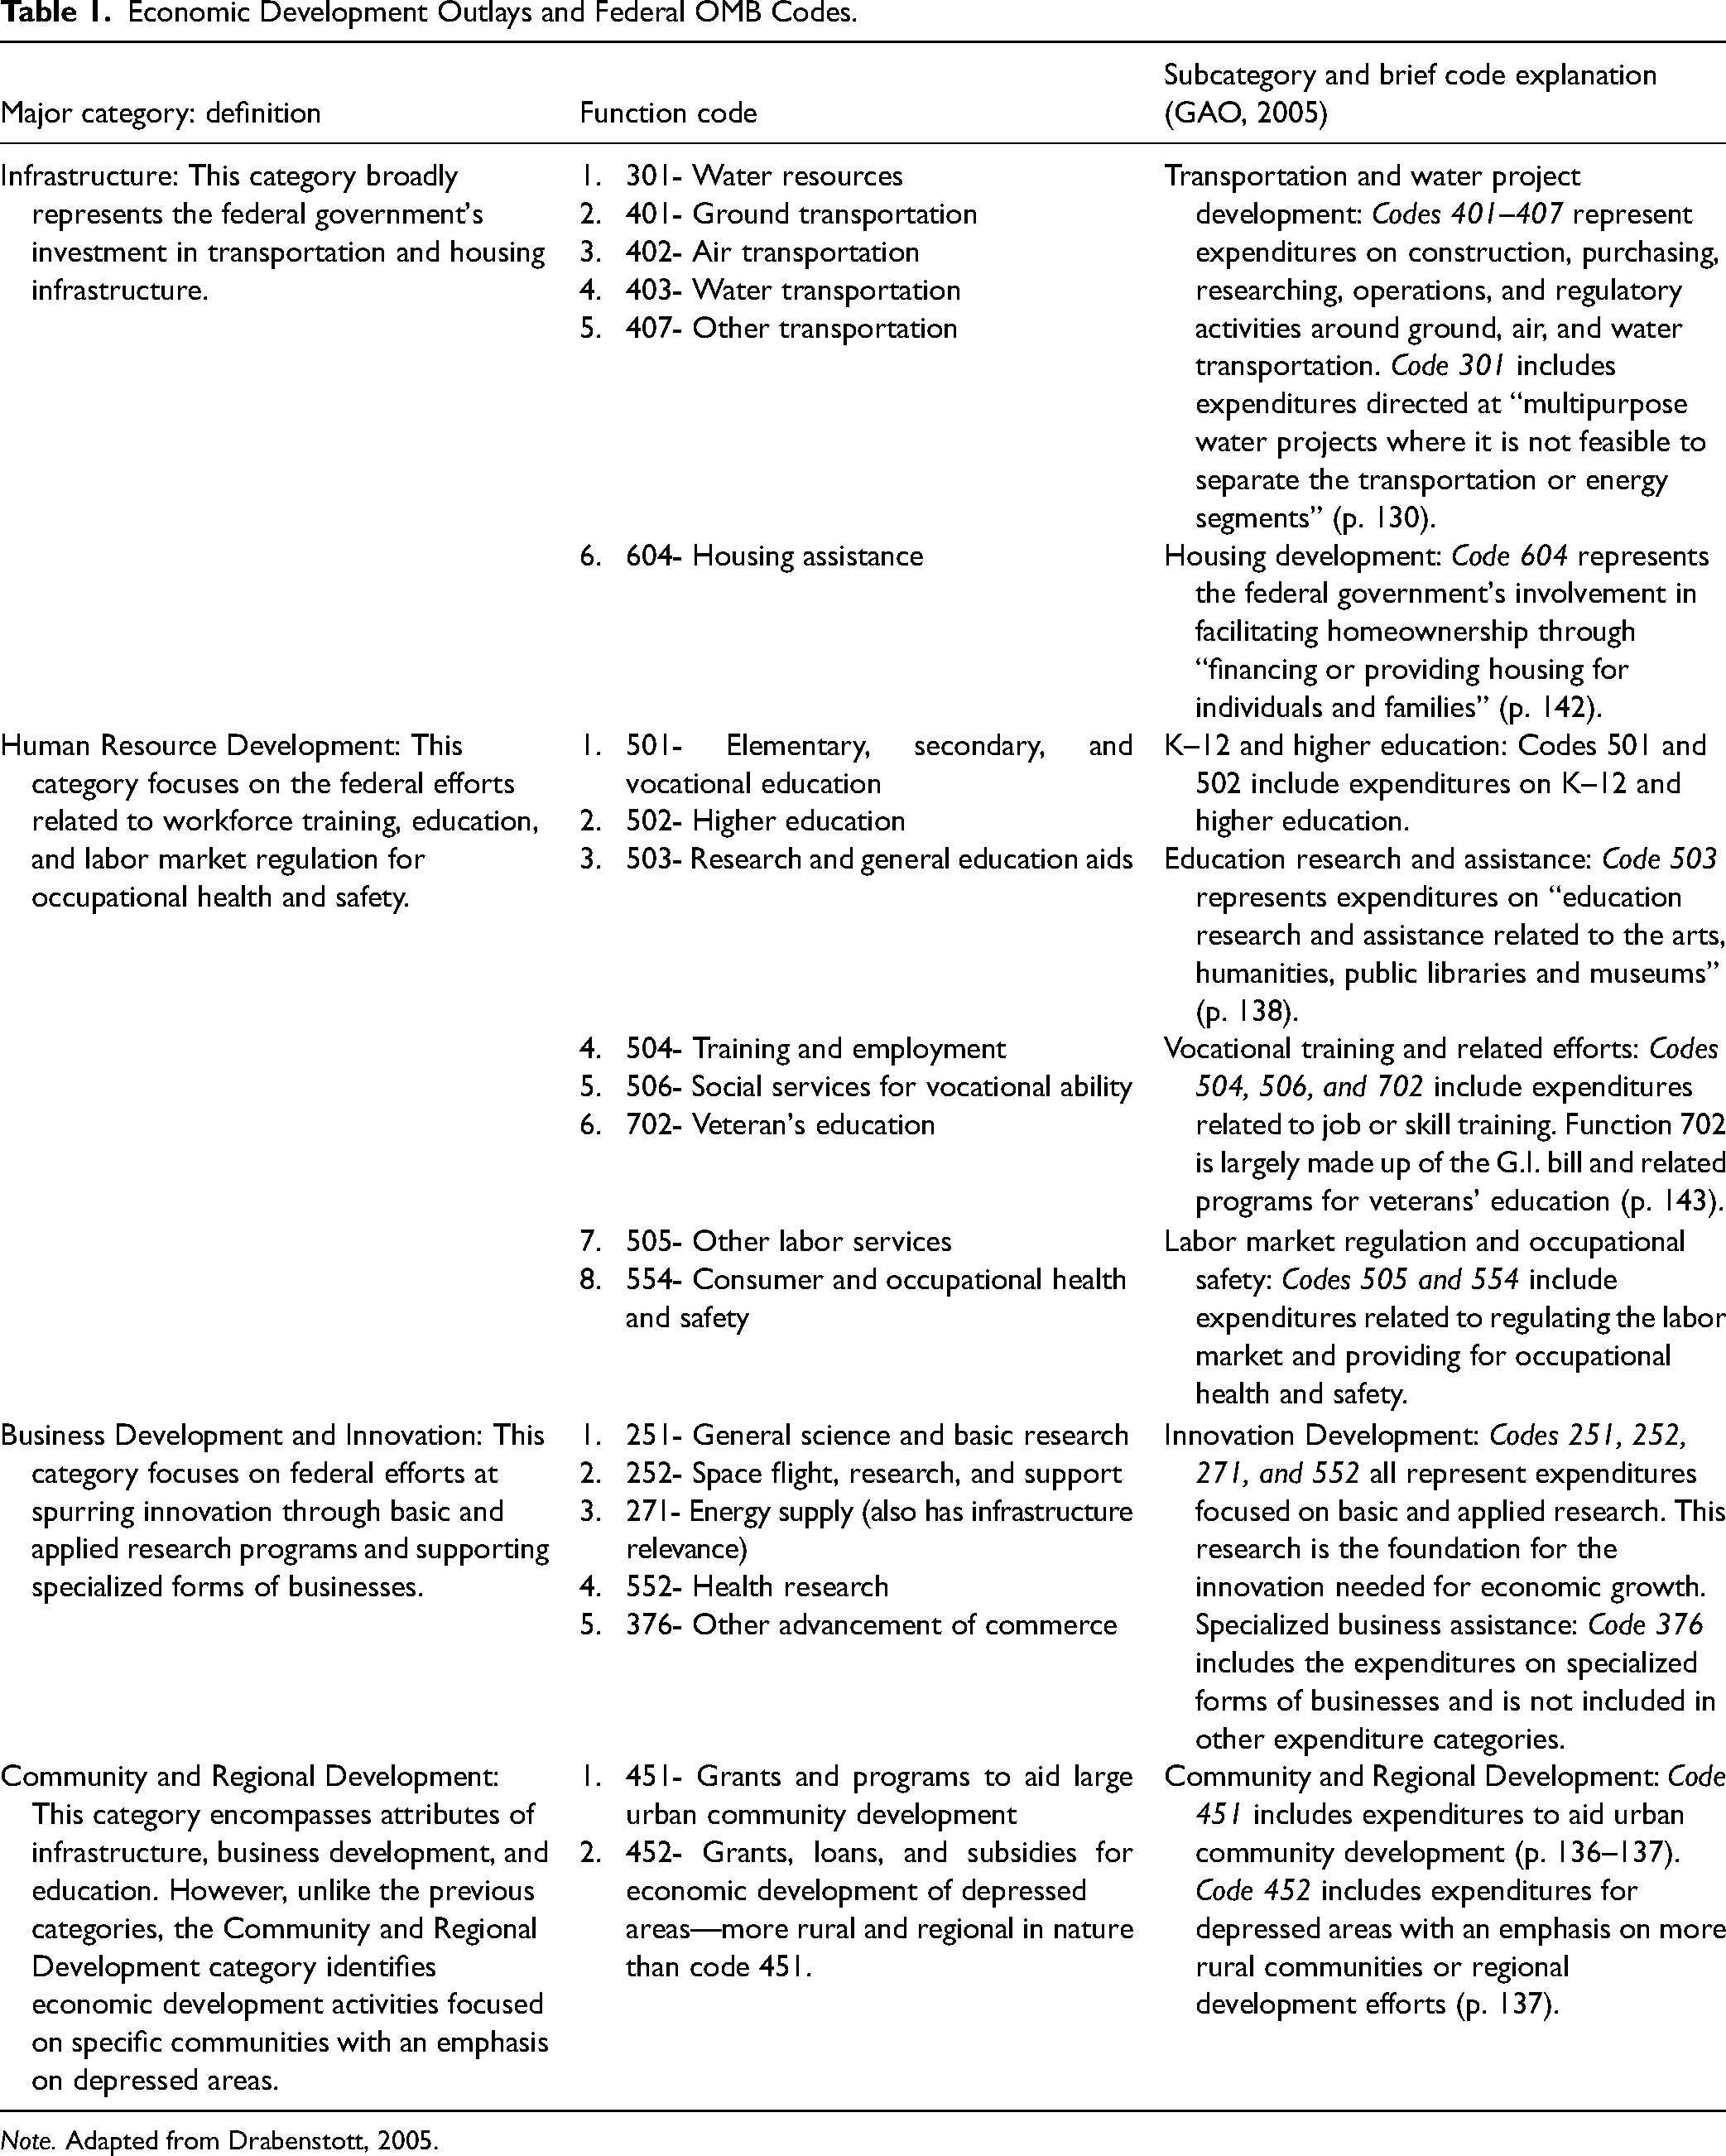
Note. Adapted from Drabenstott, 2005.
Category 1: Infrastructure Development
Infrastructure development is one of the most common economic development approaches and typically includes things like transportation, telecommunication, utilities, and workforce housing (Kessides, 1993; Leigh & Blakely, 2013). Infrastructure is considered a basic input into economic activity. “Without adequate infrastructure, modern commerce characterized by production specialization and exchange across markets would grind to a halt” (Lee, 2011, p. 1). At minimum, developing infrastructure provides a way for businesses to locate, relocate, or expand. For this research, OMB codes 401–407 capture federal expenditures for the construction, purchase, research, operation, and regulation of ground, air, and water transport. OMB code 604 includes the federal government's investment in “financing or providing housing for individuals and families” (p. 142). Housing availability and development “affects economic development through its impact on employment, savings, investment, and labour productivity” (Harris & Arku, 2006, p. 1007).
Category 2: Human Resource Development
Human resource development is an approach to economic development that seeks to train and educate the workforce, regulate the labor market, and provide for occupational health and safety. People can be one of the greatest resources available for economic development in a community. Investing in people through education and training can improve the desirability of a community, the productivity of the workers/businesses, and ultimately increase the human capital stock. Increasing the collective value of a community's human capital stock is thought to reap economic benefits through an overall higher productivity rate, more creativity, and more innovation. Given the long-standing connection between human capital and economic growth, both K–12 and higher education are considered important parts of economic development. Additionally, technical training and workforce development efforts are often key aspects of a local government's economic development strategy.
Federal budget codes 501 and 502 identify federal expenditures in K–12 and higher education; budget codes 504, 506, and 702 are related to vocational education spending. Education has long been identified as an important economic development tool through the provision of basic and advanced skills that enable workers to be more productive. From an individual-level perspective, education is also an important contributor to a higher quality of life through higher wages and expanded employment opportunities. The availability of a quality preschool and K–12 education has also been identified as an important business attraction policy with the potential to encourage businesses to locate or relocate to a particular area (Koven & Lyons, 2010; Leigh & Blakely, 2013).
In addition to the expenditure on education, the federal government invests in research and educational aids that contributes to human resource development. Specifically, federal budget code 503 catalogues the federal expenditure on research and general educational aids. These expenditures include research to improve education and “assistance related to the arts, humanities, public libraries, and museums” (U.S. Government Accountability Office, 2005, p. 138). Like budget codes 501 and 502, these expenditures are related to providing training to the workforce and can also be categorized as a business attraction policy through the provision of amenities (such as libraries) to a community (Koven & Lyons, 2010; Leigh & Blakely, 2013).
Finally, budget codes 505 and 554 capture federal expenditures related to the regulation of the labor market and the provision of occupational health and safety. These programmatic expenditures can affect the productivity of firms and therefore contribute to economic development activity. Specifically, “occupational accidents severely deteriorate human capital, and hence negatively affect the productivity…” (Fernández-Muñiz et al., 2009, p. 980). The expenditures provide for the protection and maintenance of human capital in the United States, thereby directly influencing human resources and productivity of the workforce.
Category 3: Business Development and Innovation
This category captures the federal efforts at spurring innovation through basic and applied research programs and specialized business support related initiatives. Budget codes 251, 252, 271, and 552 all fall into this category, which provides the foundation for innovation for economic growth. Research is considered a basic component of technology innovation and directly impacts economic development through the creation of new businesses, spillover effects to efficiency and productivity, and new economic activity (Koven & Lyons, 2010; Varga et al., 2005). Budget code 376 is a broader category than the others examined in this research. It captures federal expenditures that aid specialized forms of businesses, small businesses, and others not included in other categories.
Category 4: Community and Regional Development
The final economic development category in this research is community and regional development found in codes 451 and 452. These budget codes represent the place-specific development efforts of the federal government. The outlays in these categories include many of the attributes of the previous categories (such as infrastructure development) but focus specifically on urban or depressed rural communities.
Federal Economic Development Landscape 2003–2023: How Much, Where, and for What?
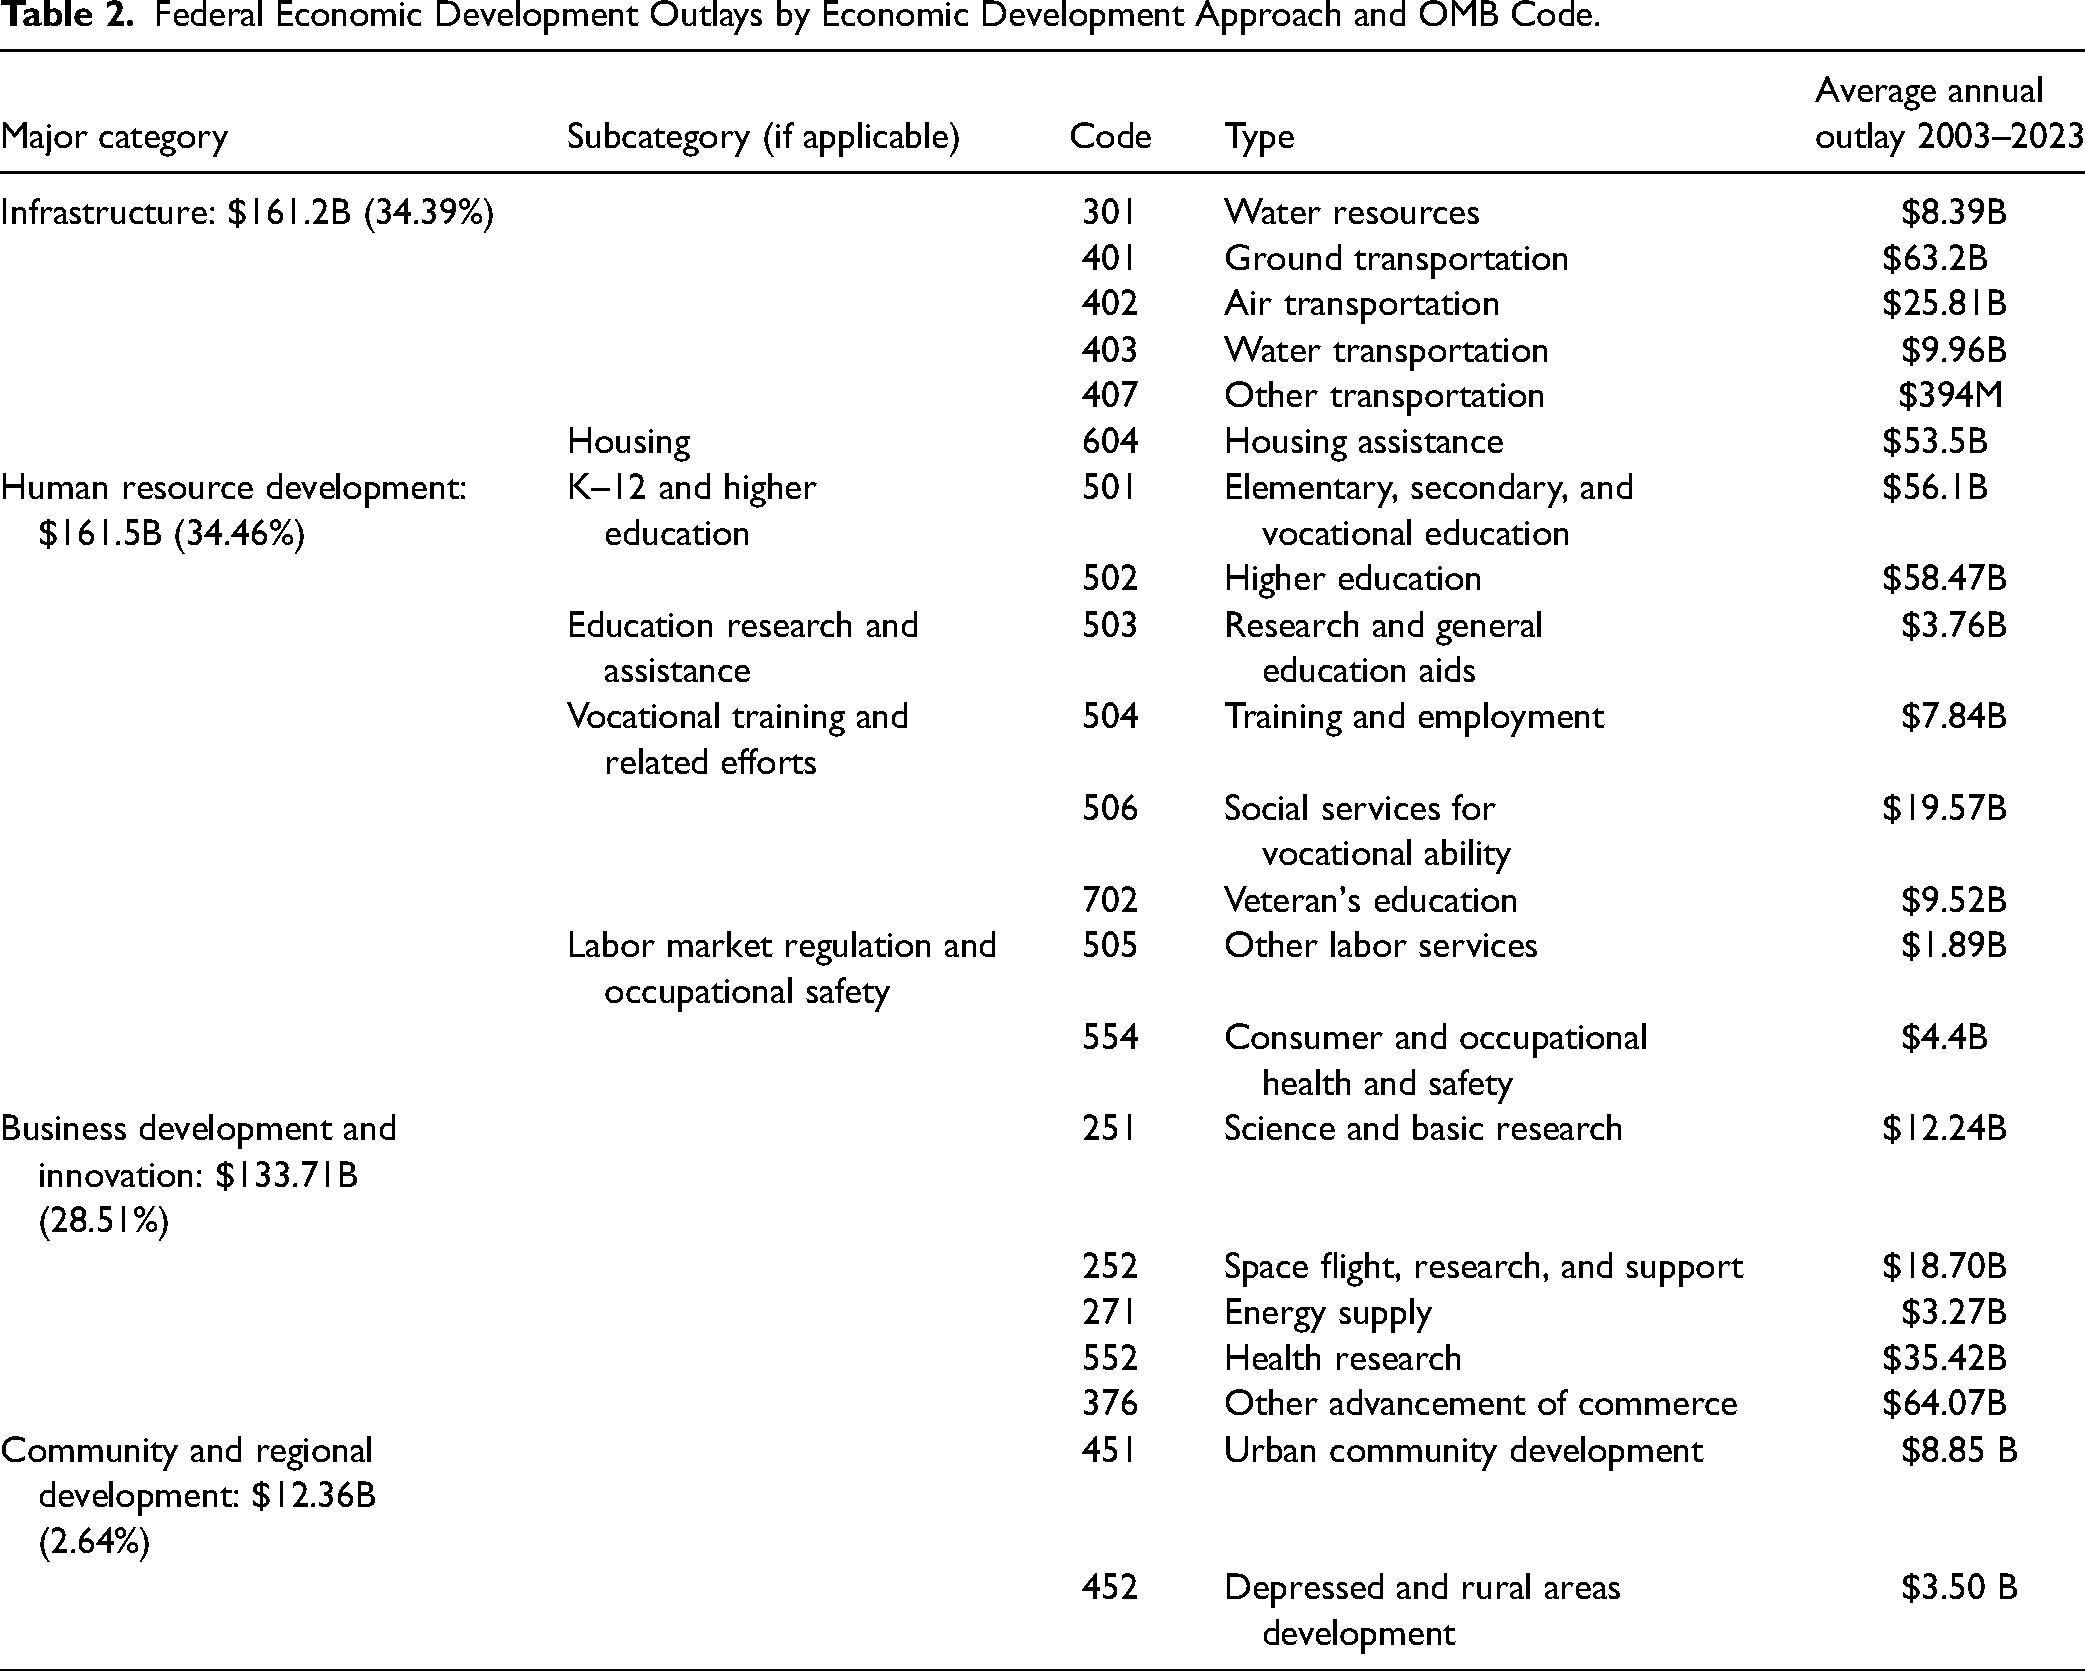
Between fiscal years 2003 and 2023, the average annual outlay for economic development was approximately $468.9 billion across 77 different administrative units. As Table 2 illustrates, the two largest categories for federal economic development outlays are infrastructure development (34.4% of total) and human resource development (34.5% of total). Although 77 administrative units contribute to the $468.9 billion in spending, four departments are responsible for almost 65% of the total: Education (24.5%), HHS (11.2%), HUD (11.5%), and Transportation (17.3%; see Figure 1).
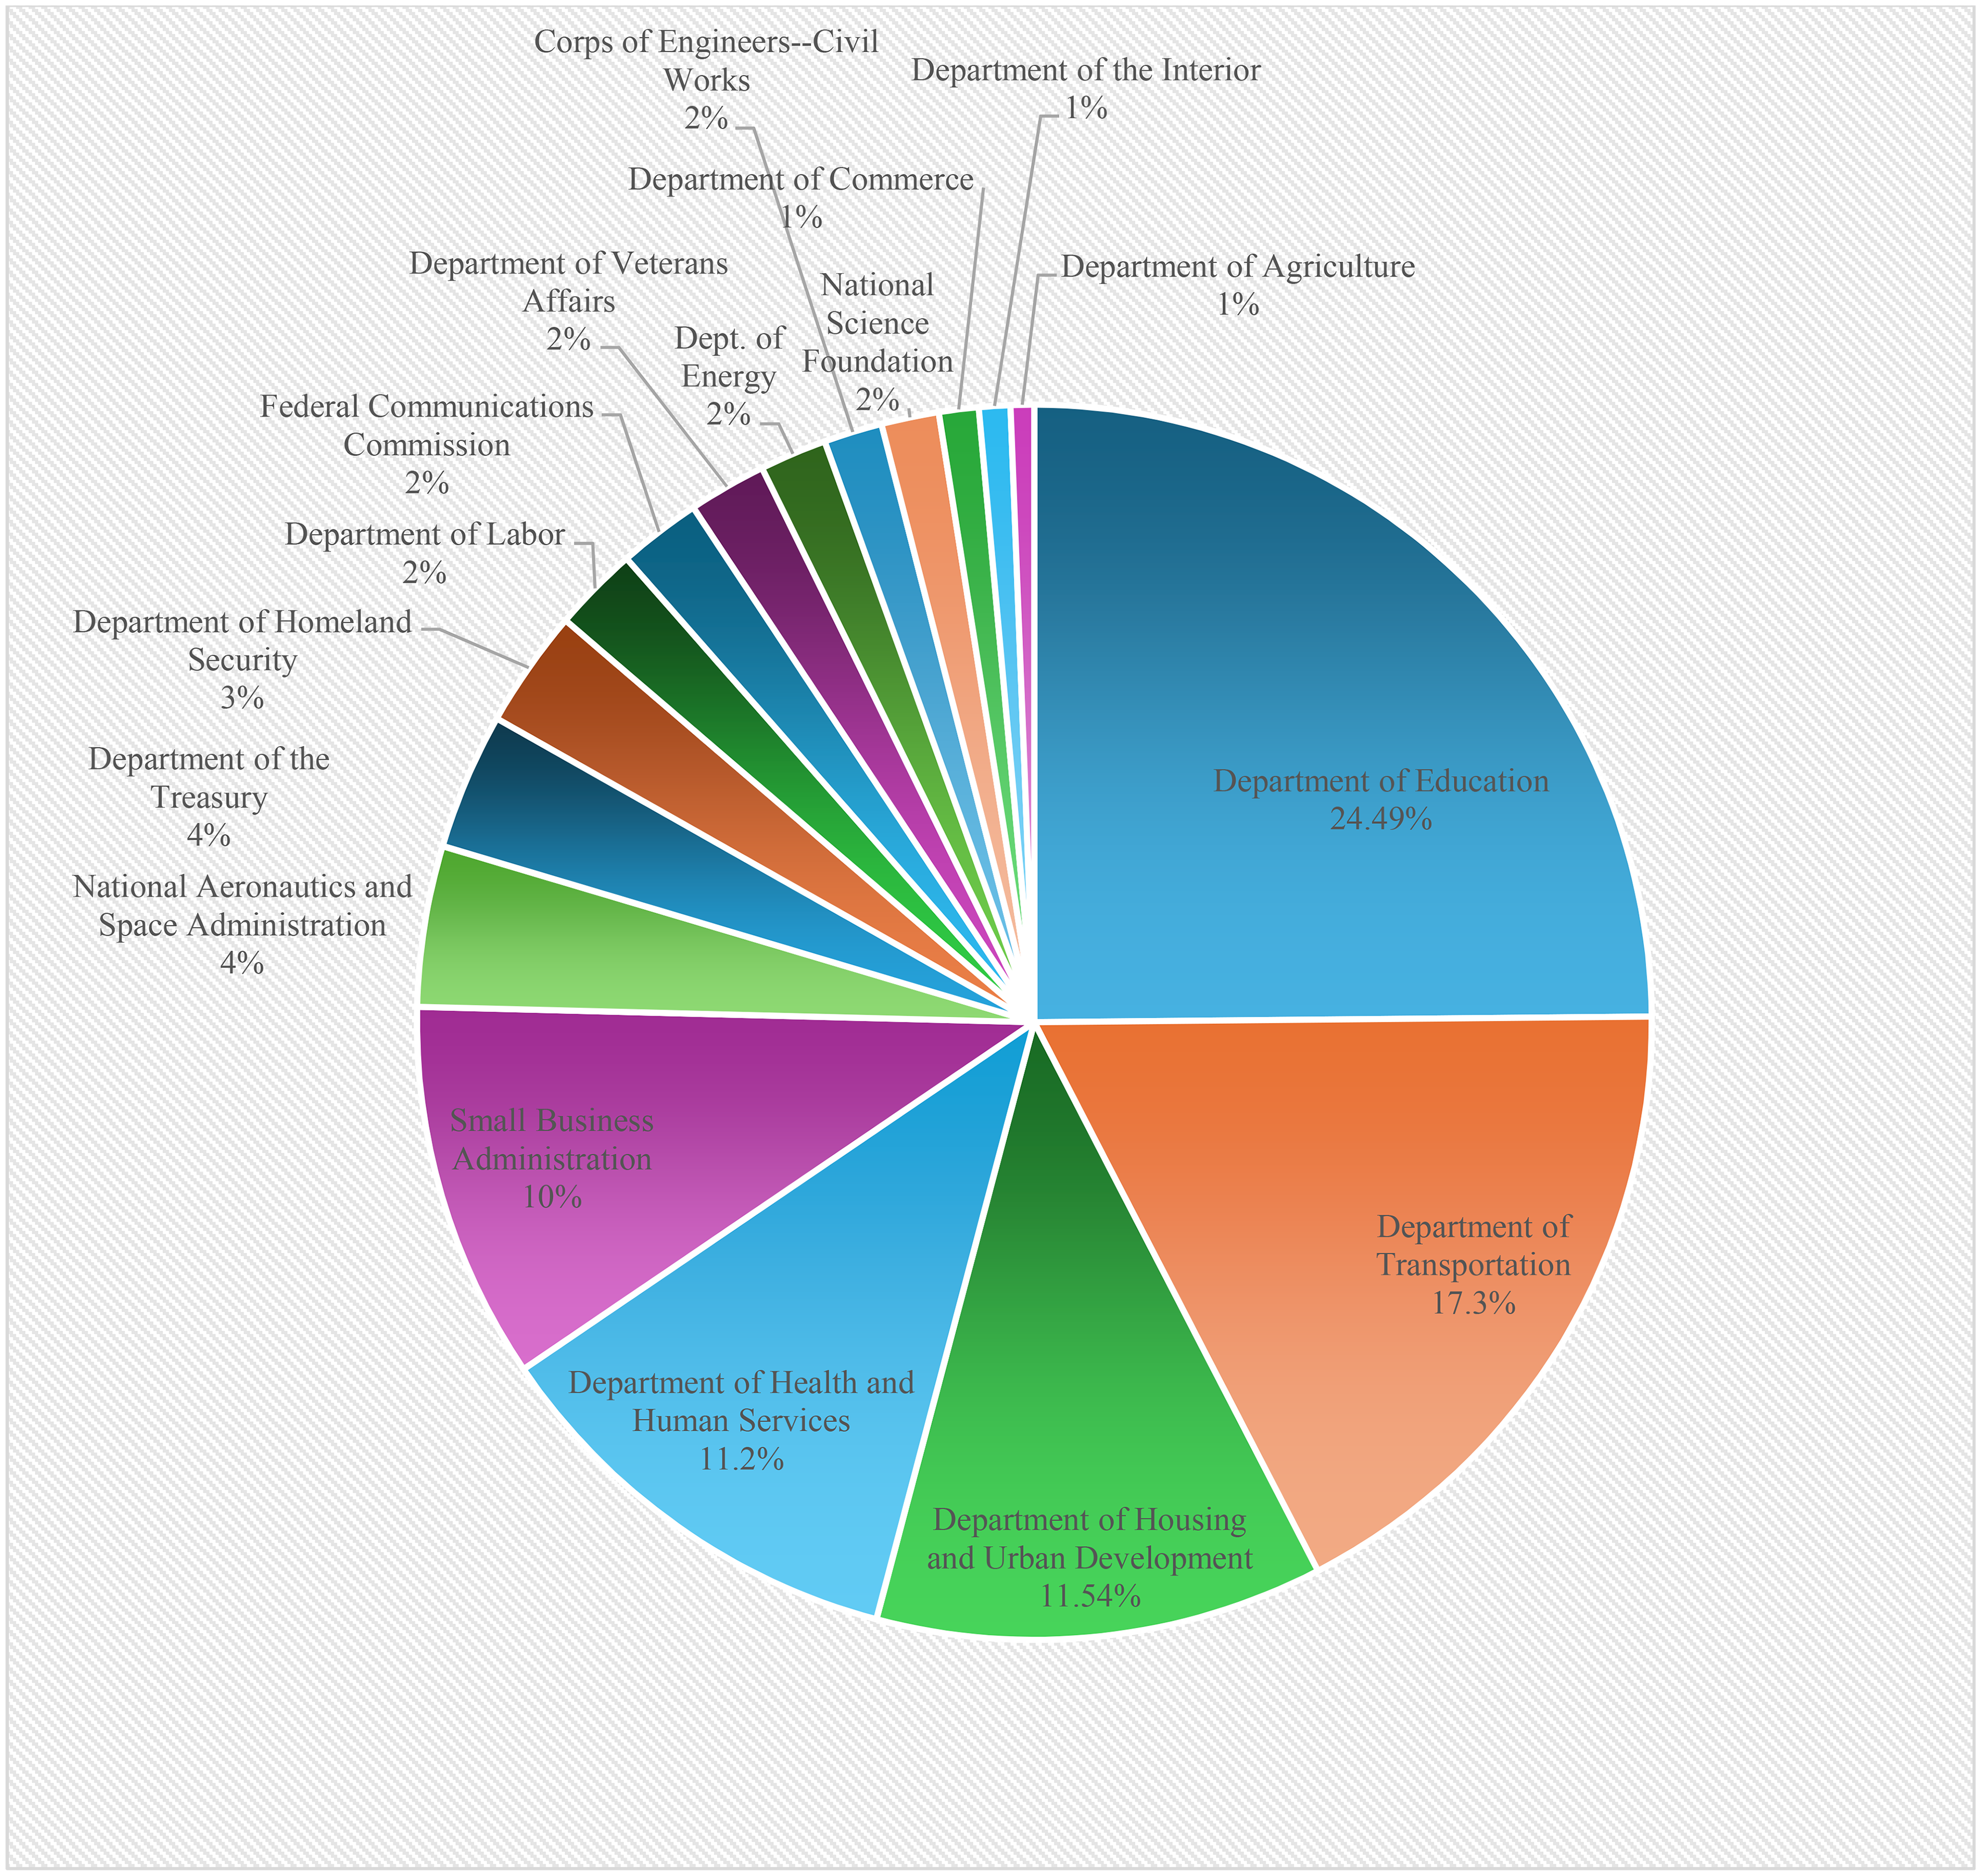
2003–2023 average annual outlays by agency (only showing agencies >1%).
Federal Economic Development Outlays by Economic Development Approach and OMB Code.
Moving beyond the overall spending and more closely examining the 77 administrative units provides insight into the agencies that may have economic development as their primary function. In total, seven agencies spend 98%–100% of their annual average outlays on economic development: Education, HUD, Transportation, Army Corps of Engineers, NASA, National Science Foundation (NSF), and the Small Business Administration (SBA). Two other agencies have sizable portions of their total spending focused on economic development: Commerce, at approximately 50% and the Department of Homeland Security at almost 25%. The remaining agencies, although contributing to the overall federal economic development landscape, contribute significantly less of their overall spending on economic development with most being close to 1%–2% of their total annual outlays.
Returning to the four categories of economic development provides insights into how the federal government is allocating spending and where it is occurring. More will be said on each of the four categories in the sections below.
Infrastructure Development
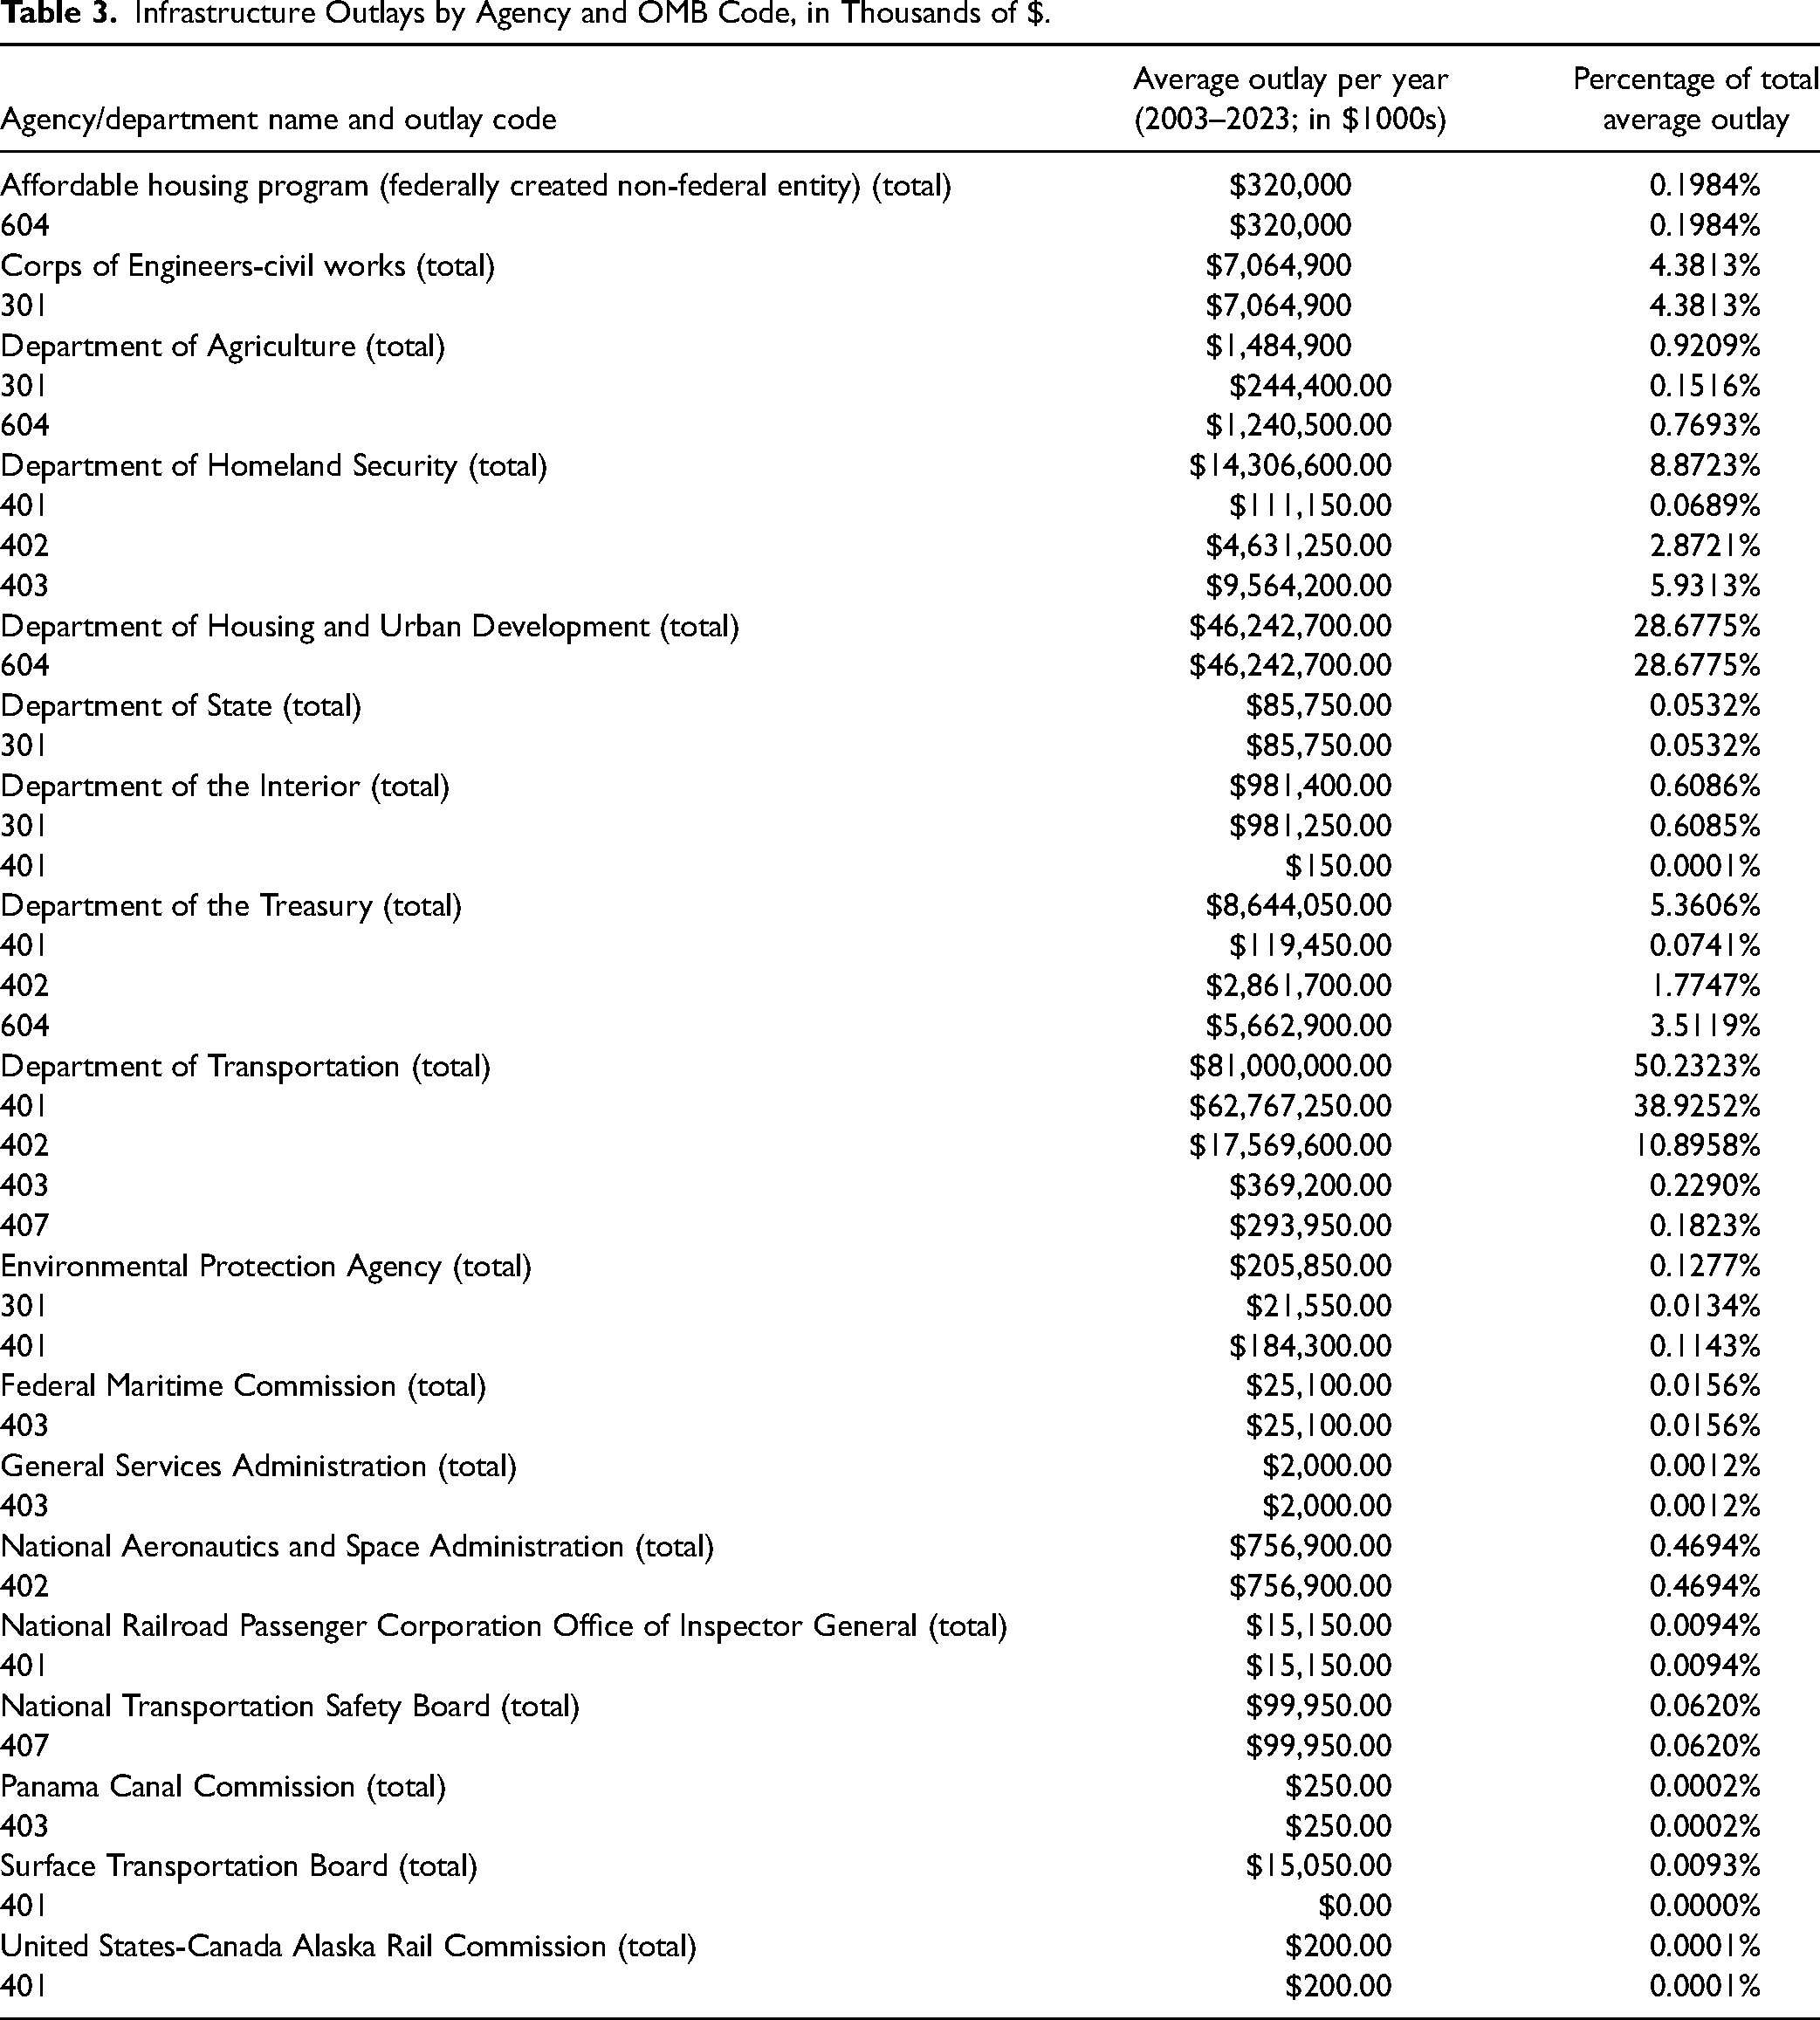
On average, the federal government spent approximately $161.2 billion each year on infrastructure development between 2003 and 2023. See Table 3 for a detailed look at the outlays by agency and OMB function code. The largest contributors to this category include the DOT at just over half, 50.23%, of all infrastructure outlays across this period. Within this economic development category, the largest portion of outlays is attributable to OMB code 401, ground transportation, averaging $63.2 billion a year.
Infrastructure Outlays by Agency and OMB Code, in Thousands of $.
Human Resource Development
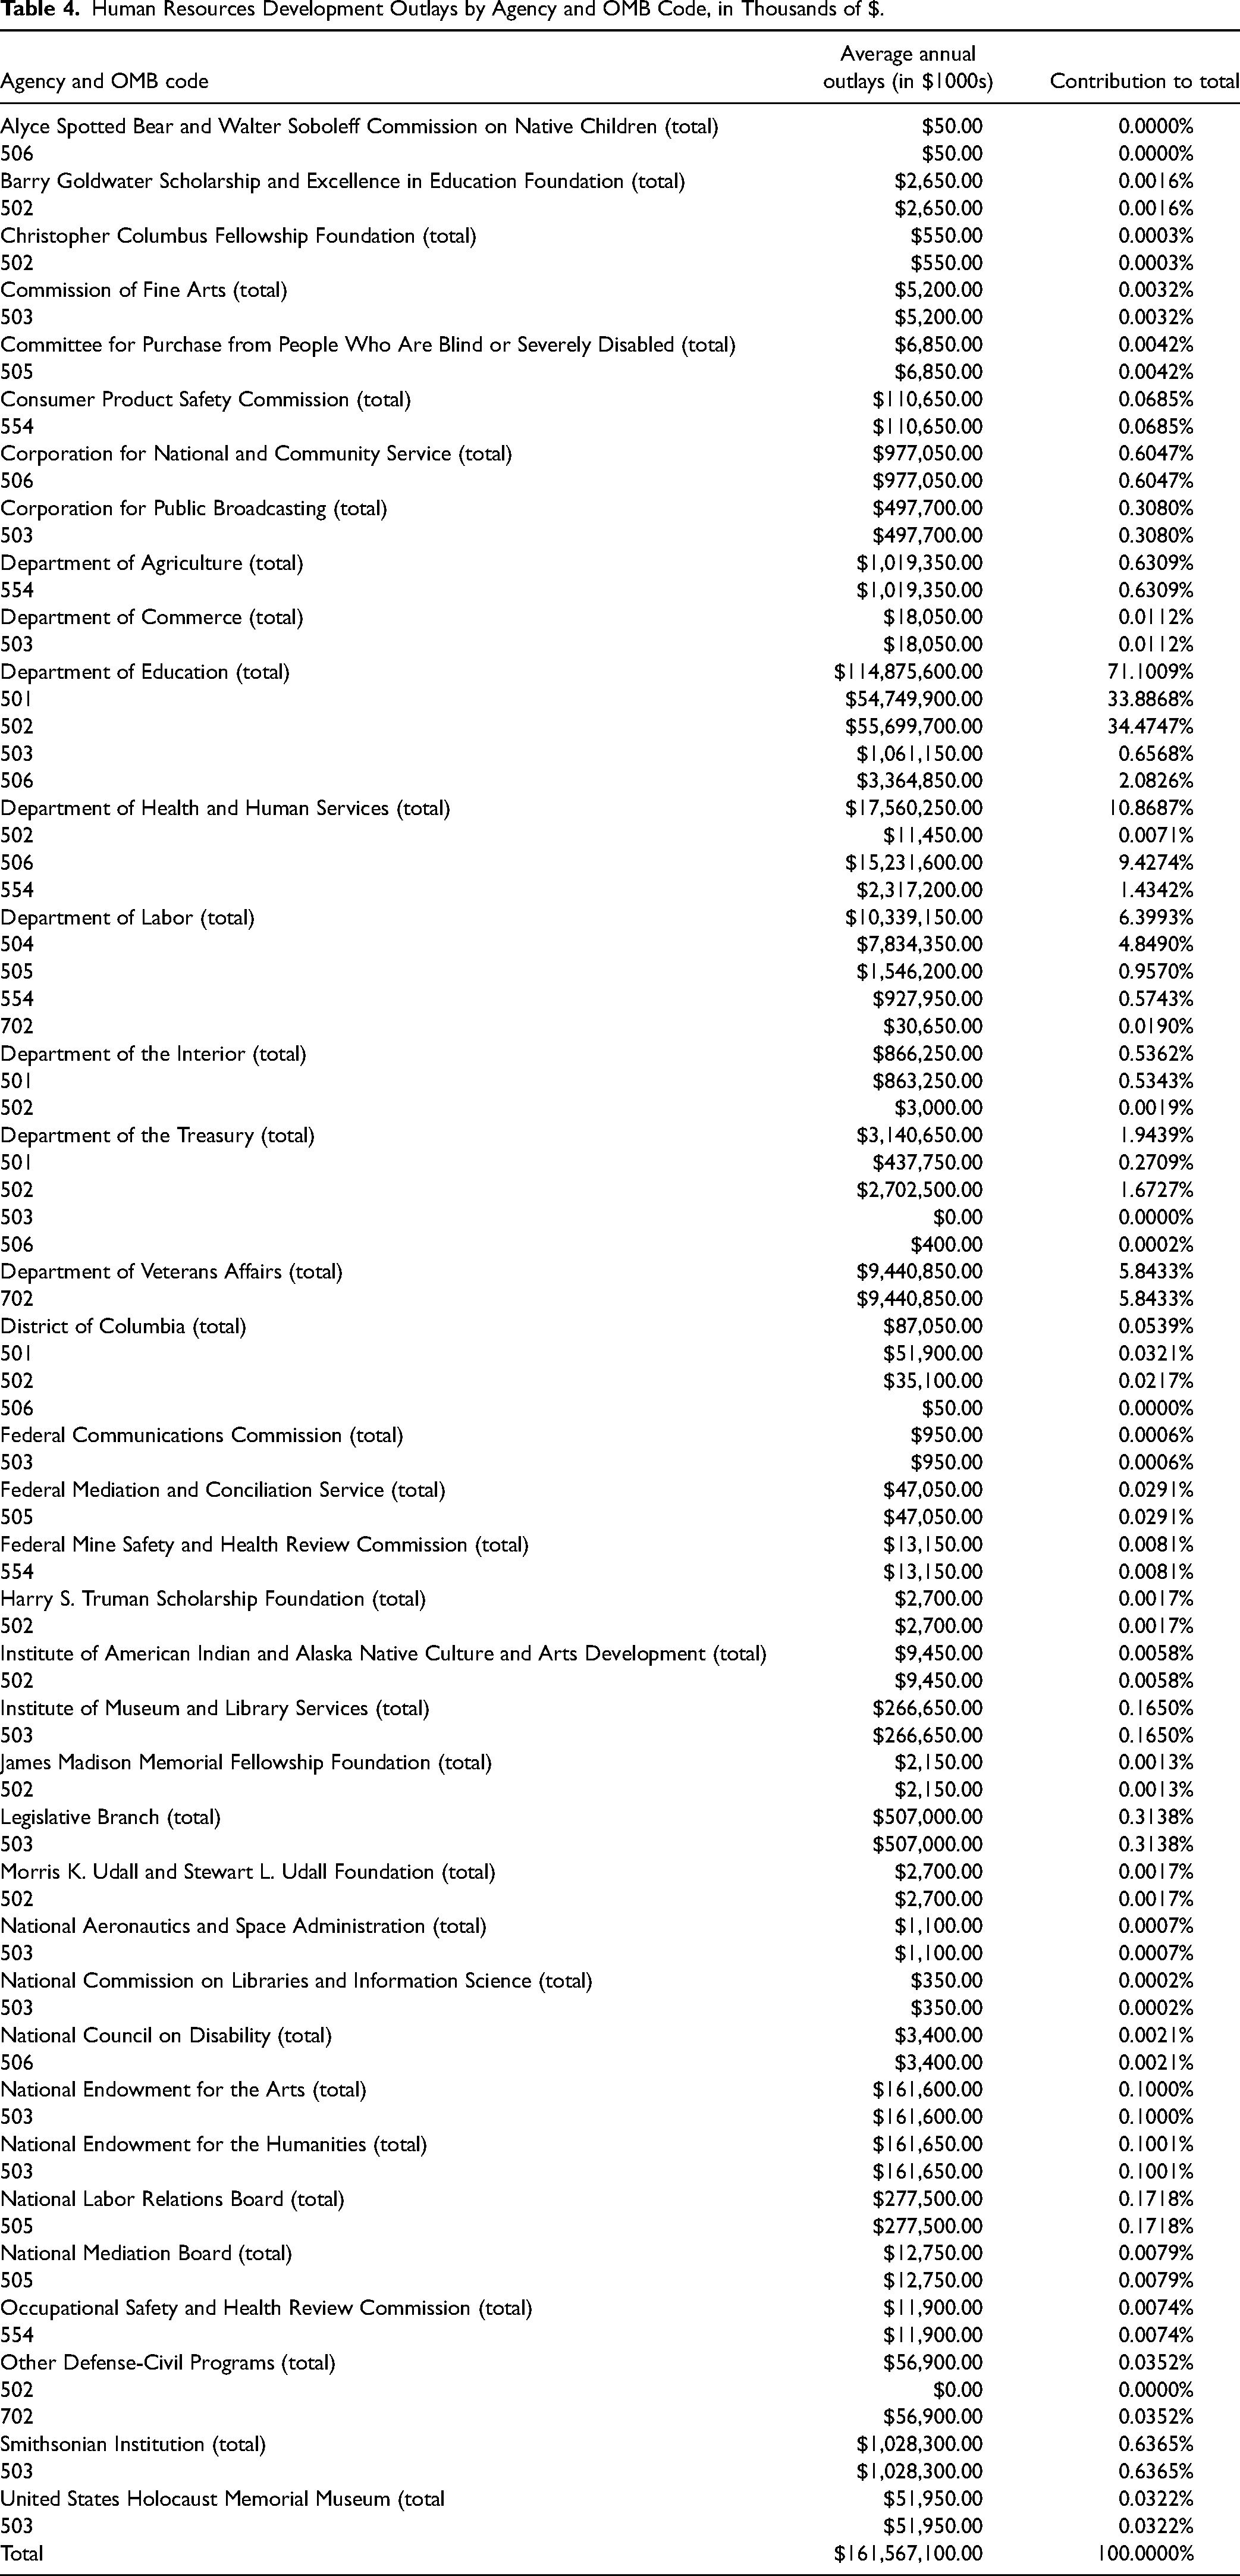
Annual outlays in this category averaged $161.5 billion between 2003 and 2023. The agencies responsible for the largest share of these outlays are the Department of Education at 71.1% of the total outlays, and HHS coming in a distant second with just over 10% of the outlays. See Table 4 for a complete view of these outlays and the agencies that contribute to this category of economic development.
Human Resources Development Outlays by Agency and OMB Code, in Thousands of $.
Business Development and Innovation
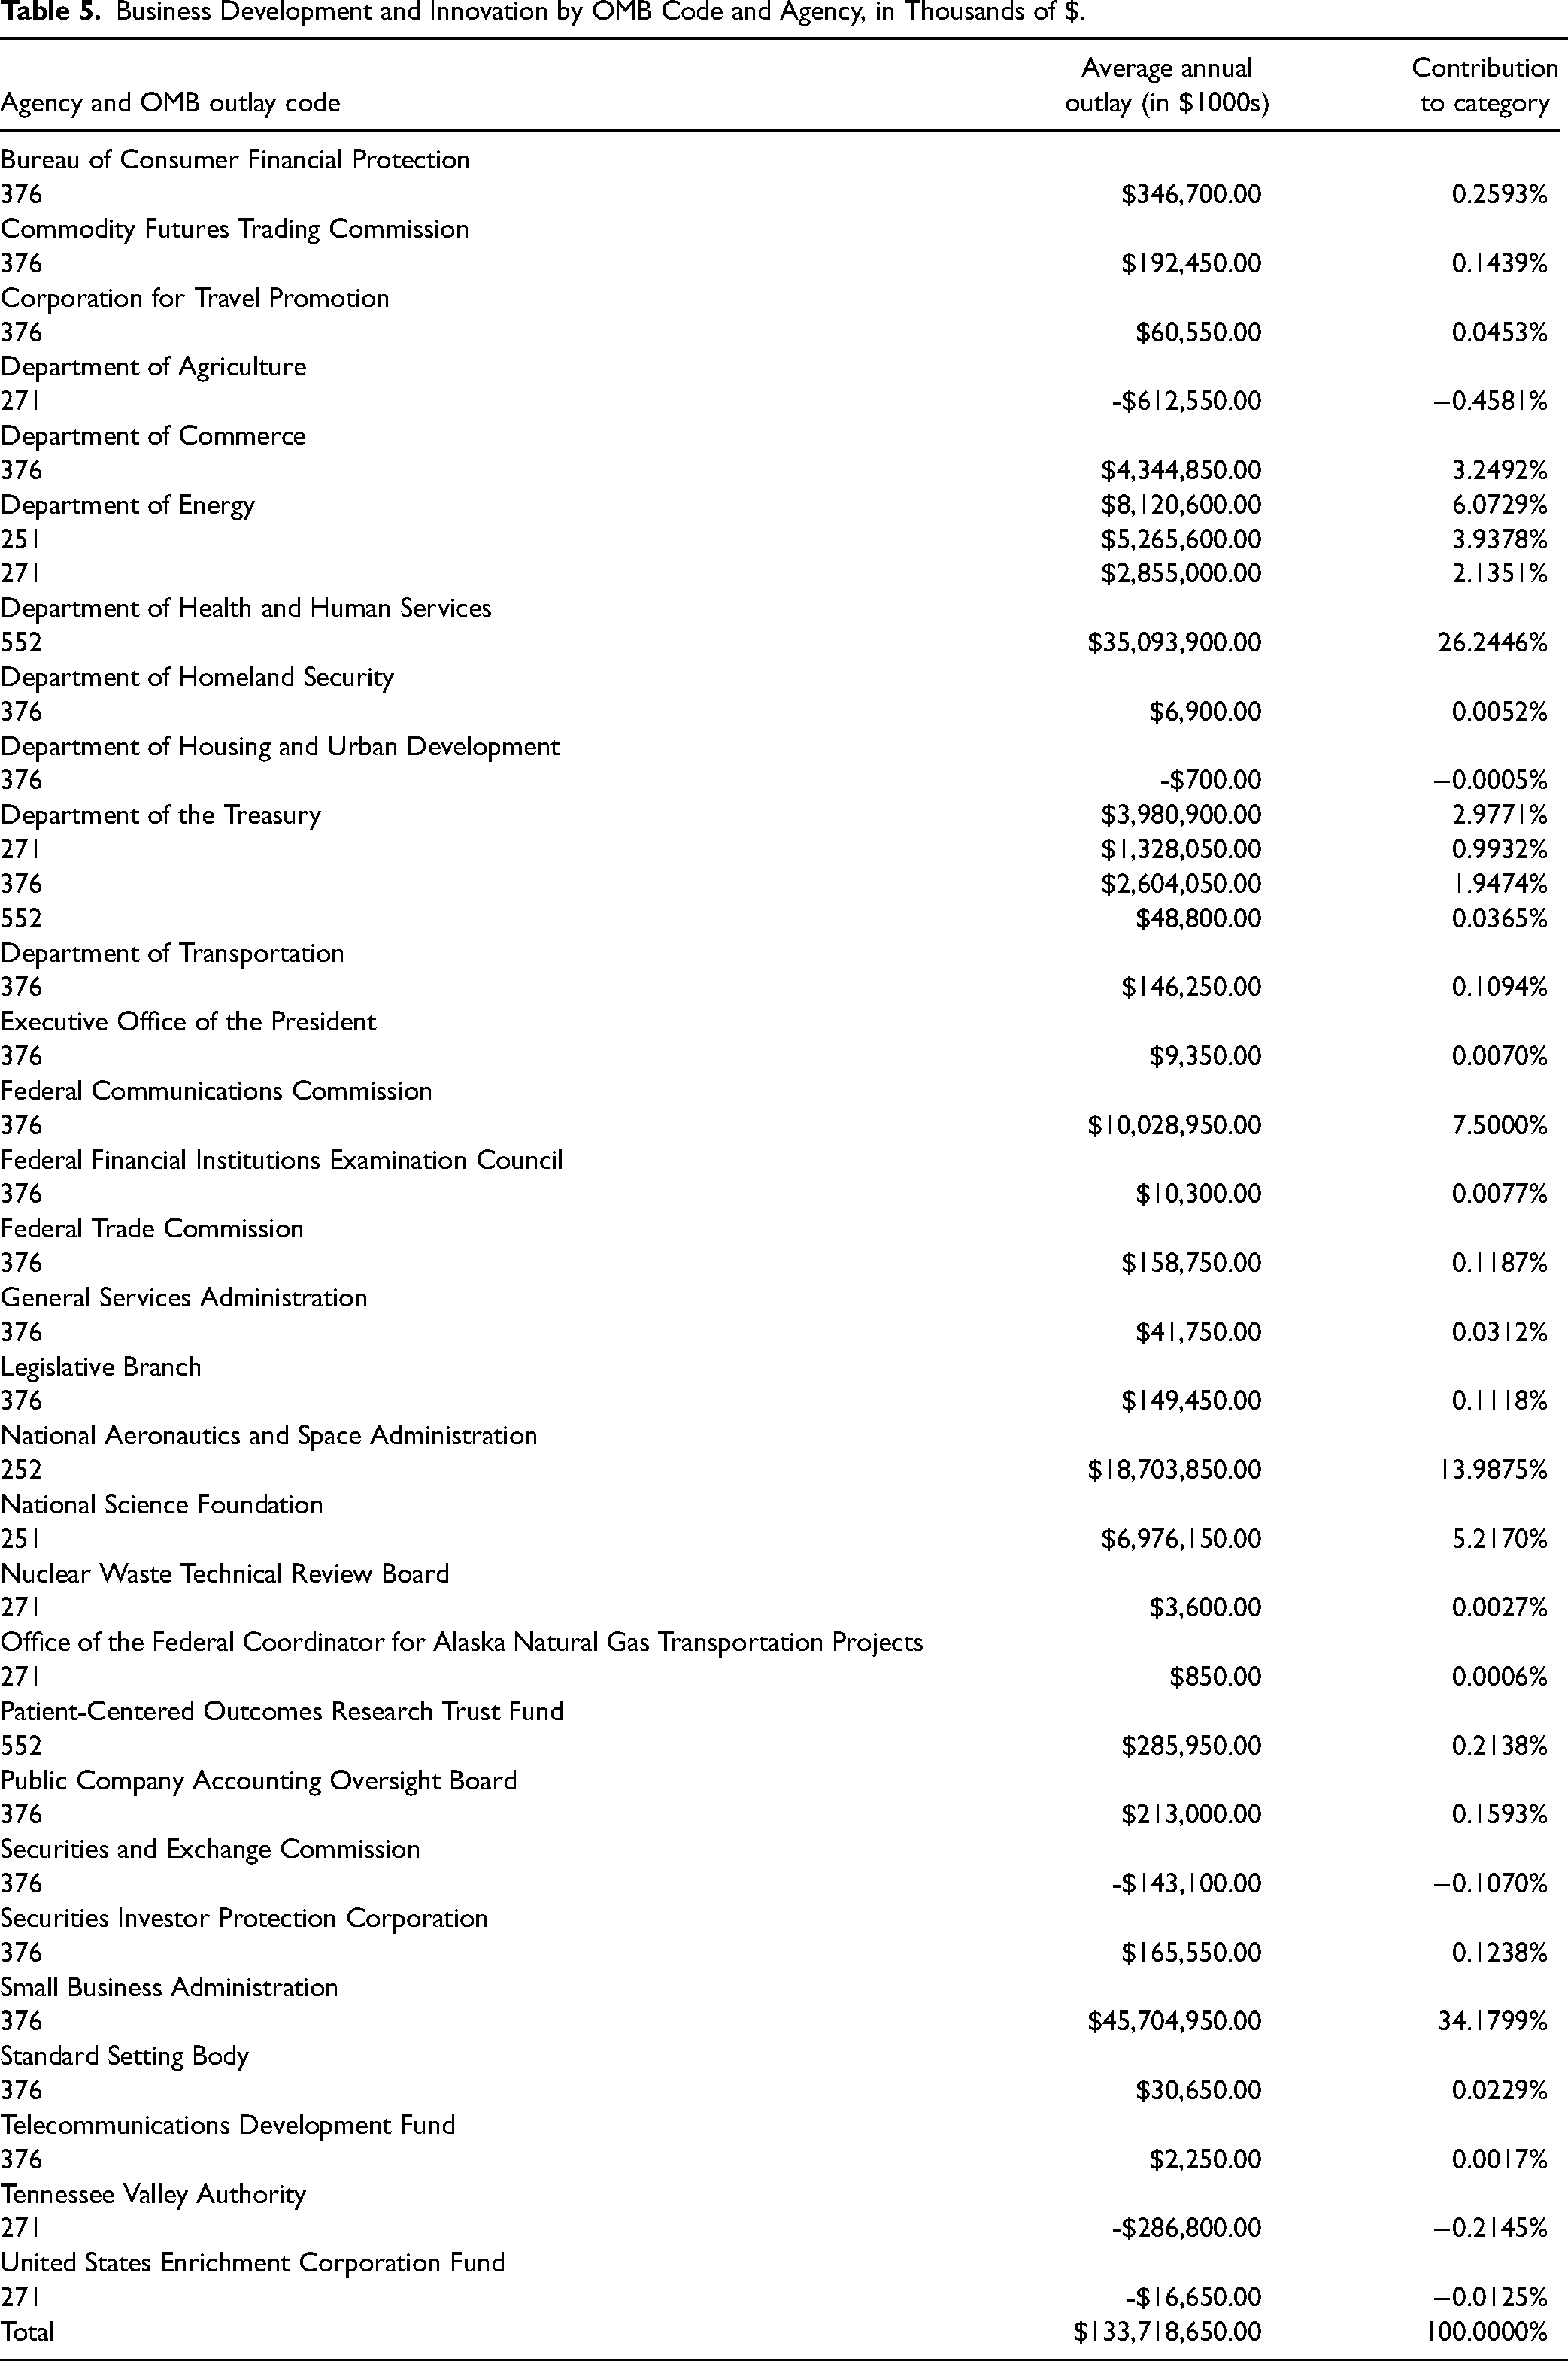
The annual average outlays in this category totaled $133.7 billion between 2003 and 2023. Two agencies make up most of the outlays in this category—SBA and HHS. SBA averaged $45.7 billion in outlays; HHS spent $35 billion for health research purposes (code 552). See Table 5 for a detailed accounting of the outlays and agencies in this category.
Business Development and Innovation by OMB Code and Agency, in Thousands of $.
Community and Regional Development
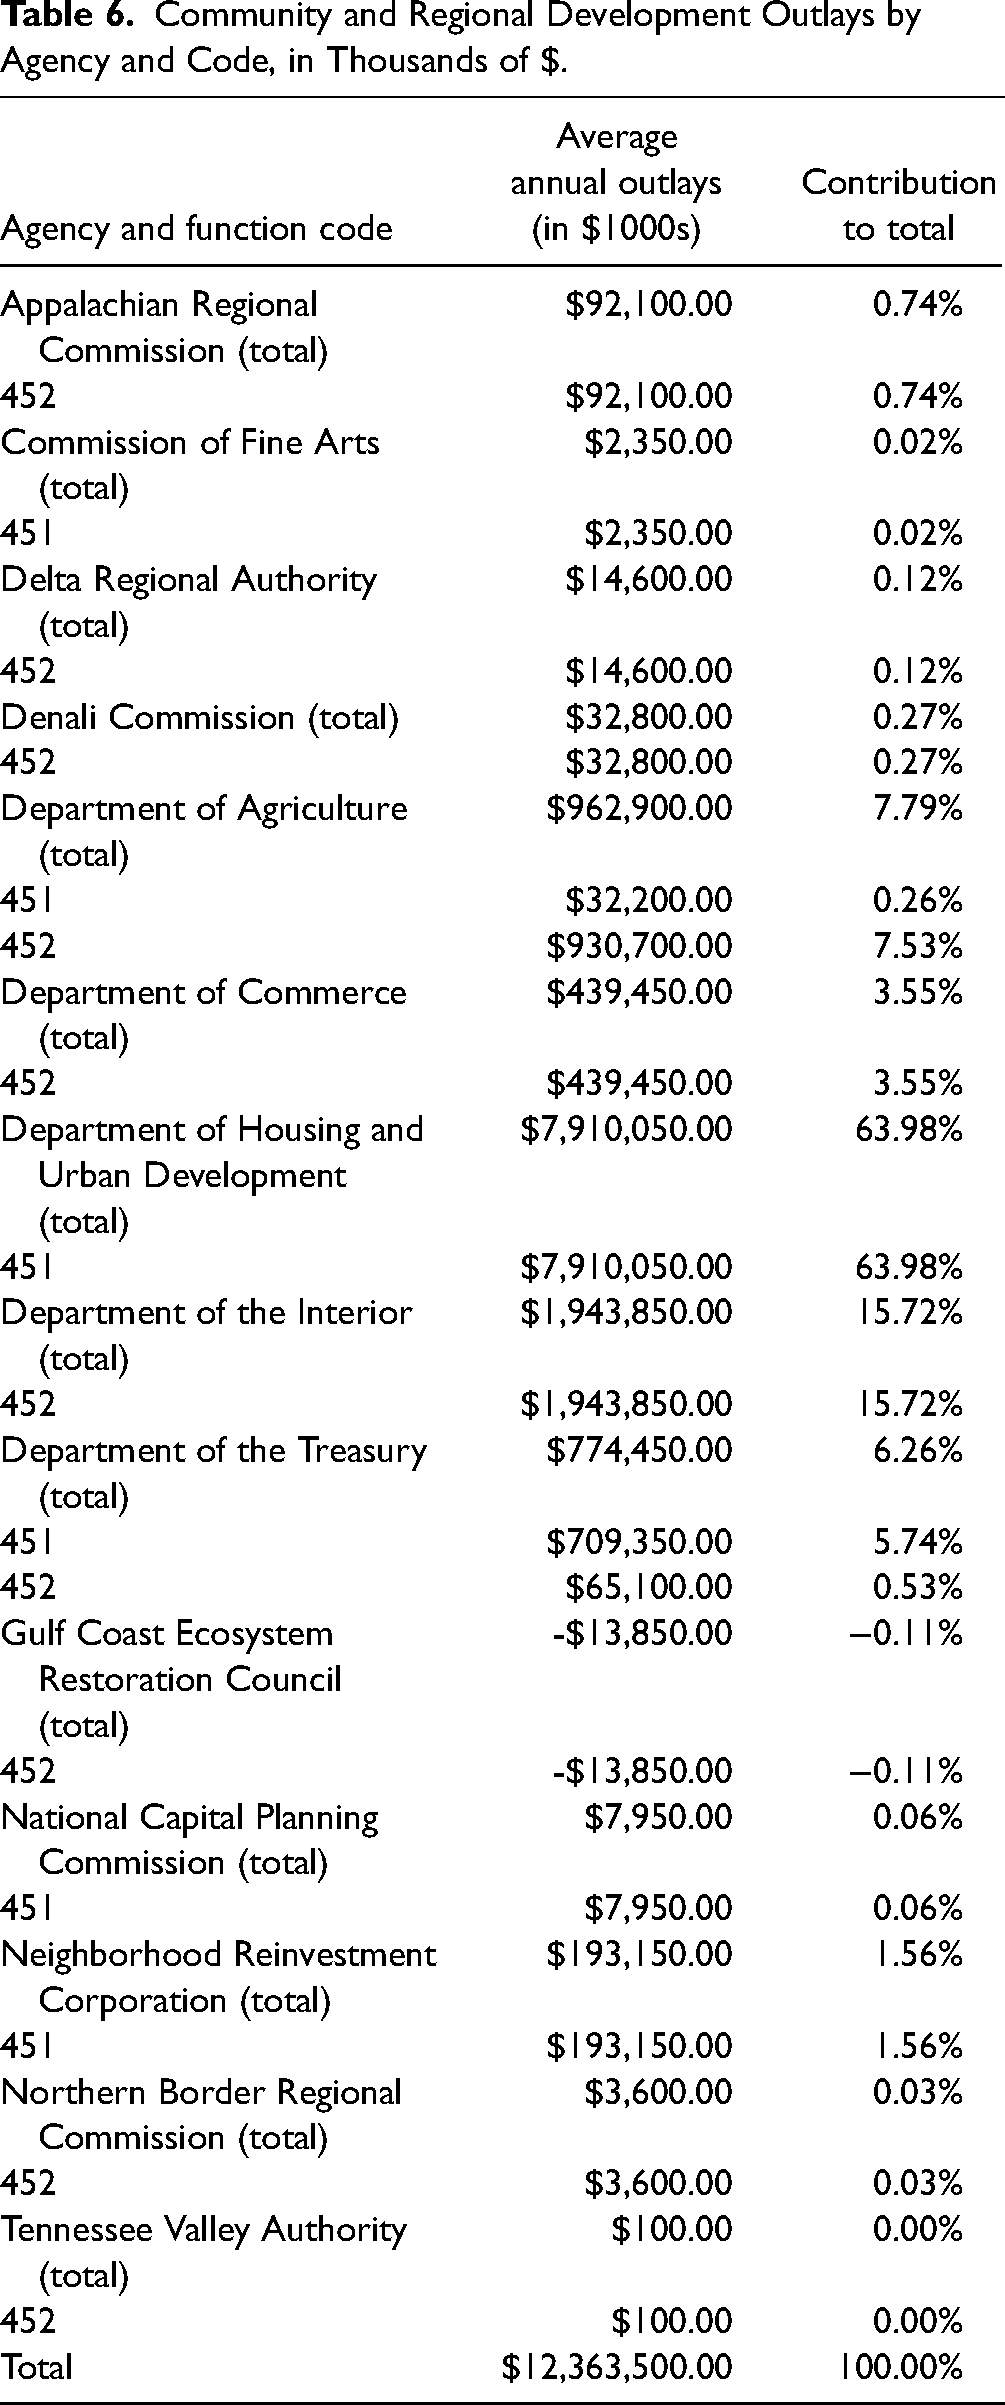
These expenditures share attributes of some of the other categories of economic development but do so with a specific focus on distressed places in both urban and rural communities. Average annual outlays in this category total $12.36 billion with HUD accounting for almost 64% of those outlays. The Department of Interior is the second largest agency participant, spending just under 16%. See Table 6 for a detailed list of agencies with outlays attributable to this category of economic development.
Community and Regional Development Outlays by Agency and Code, in Thousands of $.
Major Federal Economic Development Programs
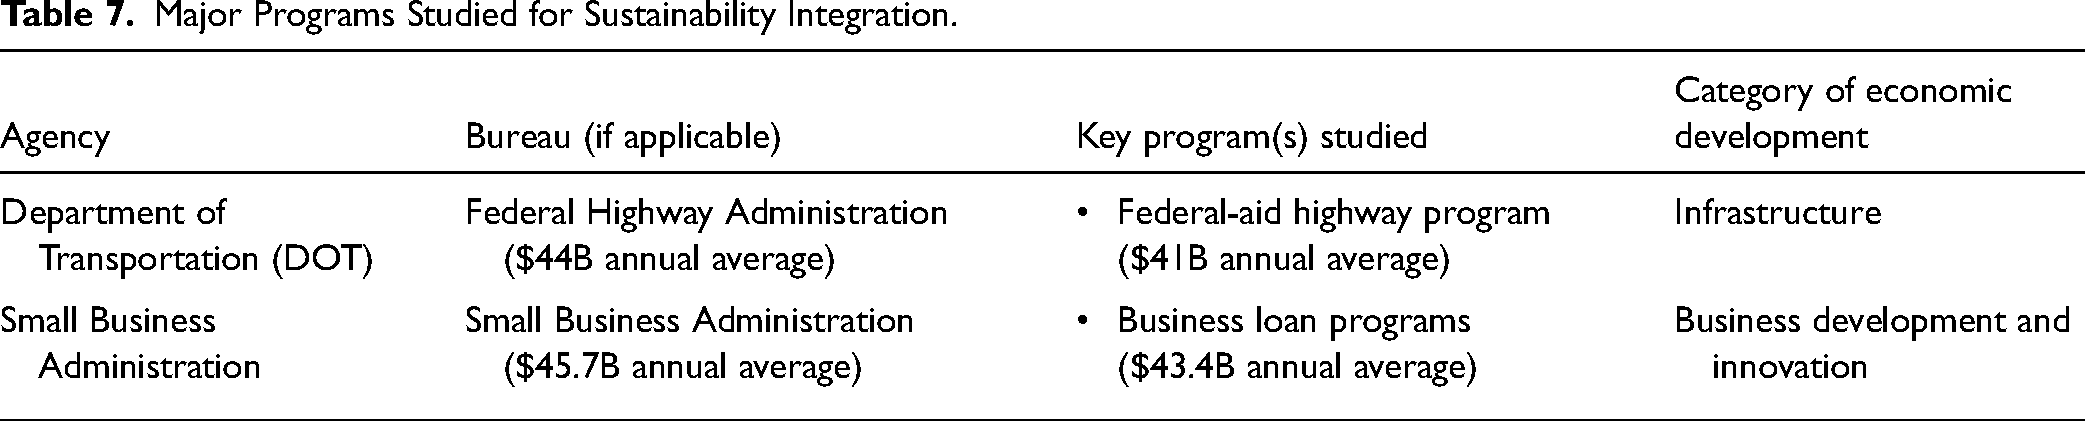
Using this newly collected federal outlay data, two programs are identified that account for significant portions of the outlays and will be studied further: Federal Highway Administration Programs in the DOT and the Business Loan programs in the SBA. These two programs were selected due to their significant annual average outlays in economic development and their long-standing presence in the federal government. Additionally, both programs represent traditional economic development efforts at infrastructure and business development by providing useful insights into how these programs are considering sustainability. Future research should include additional programs, including ones in the other two economic development categories, to fully explore this topic and assess how environmental sustainability fares in other areas of federal spending (see Table 7).
Major Programs Studied for Sustainability Integration.
Part 2: Environmental Sustainability in Federal Economic Development
Environmental Sustainability
Sustainability is often defined through a three-pillar or triple bottom line framework that includes the dimensions of environmental protection, economic development, and social equity (Adams, 2006). These three dimensions are often illustrated as a Venn diagram (see Figure 2). Each dimension overlaps with the other two dimensions; the overlap represents a sustainable future. This research is focused on the connection between the environment and the economic development dimensions. This intersection of environmental protection and economic development is typically populated with policies such as brownfield remediation and redevelopment, mass transit infrastructure development, green manufacturing, and other economic development efforts that include some environmental consideration (Opp & Osgood, 2013).
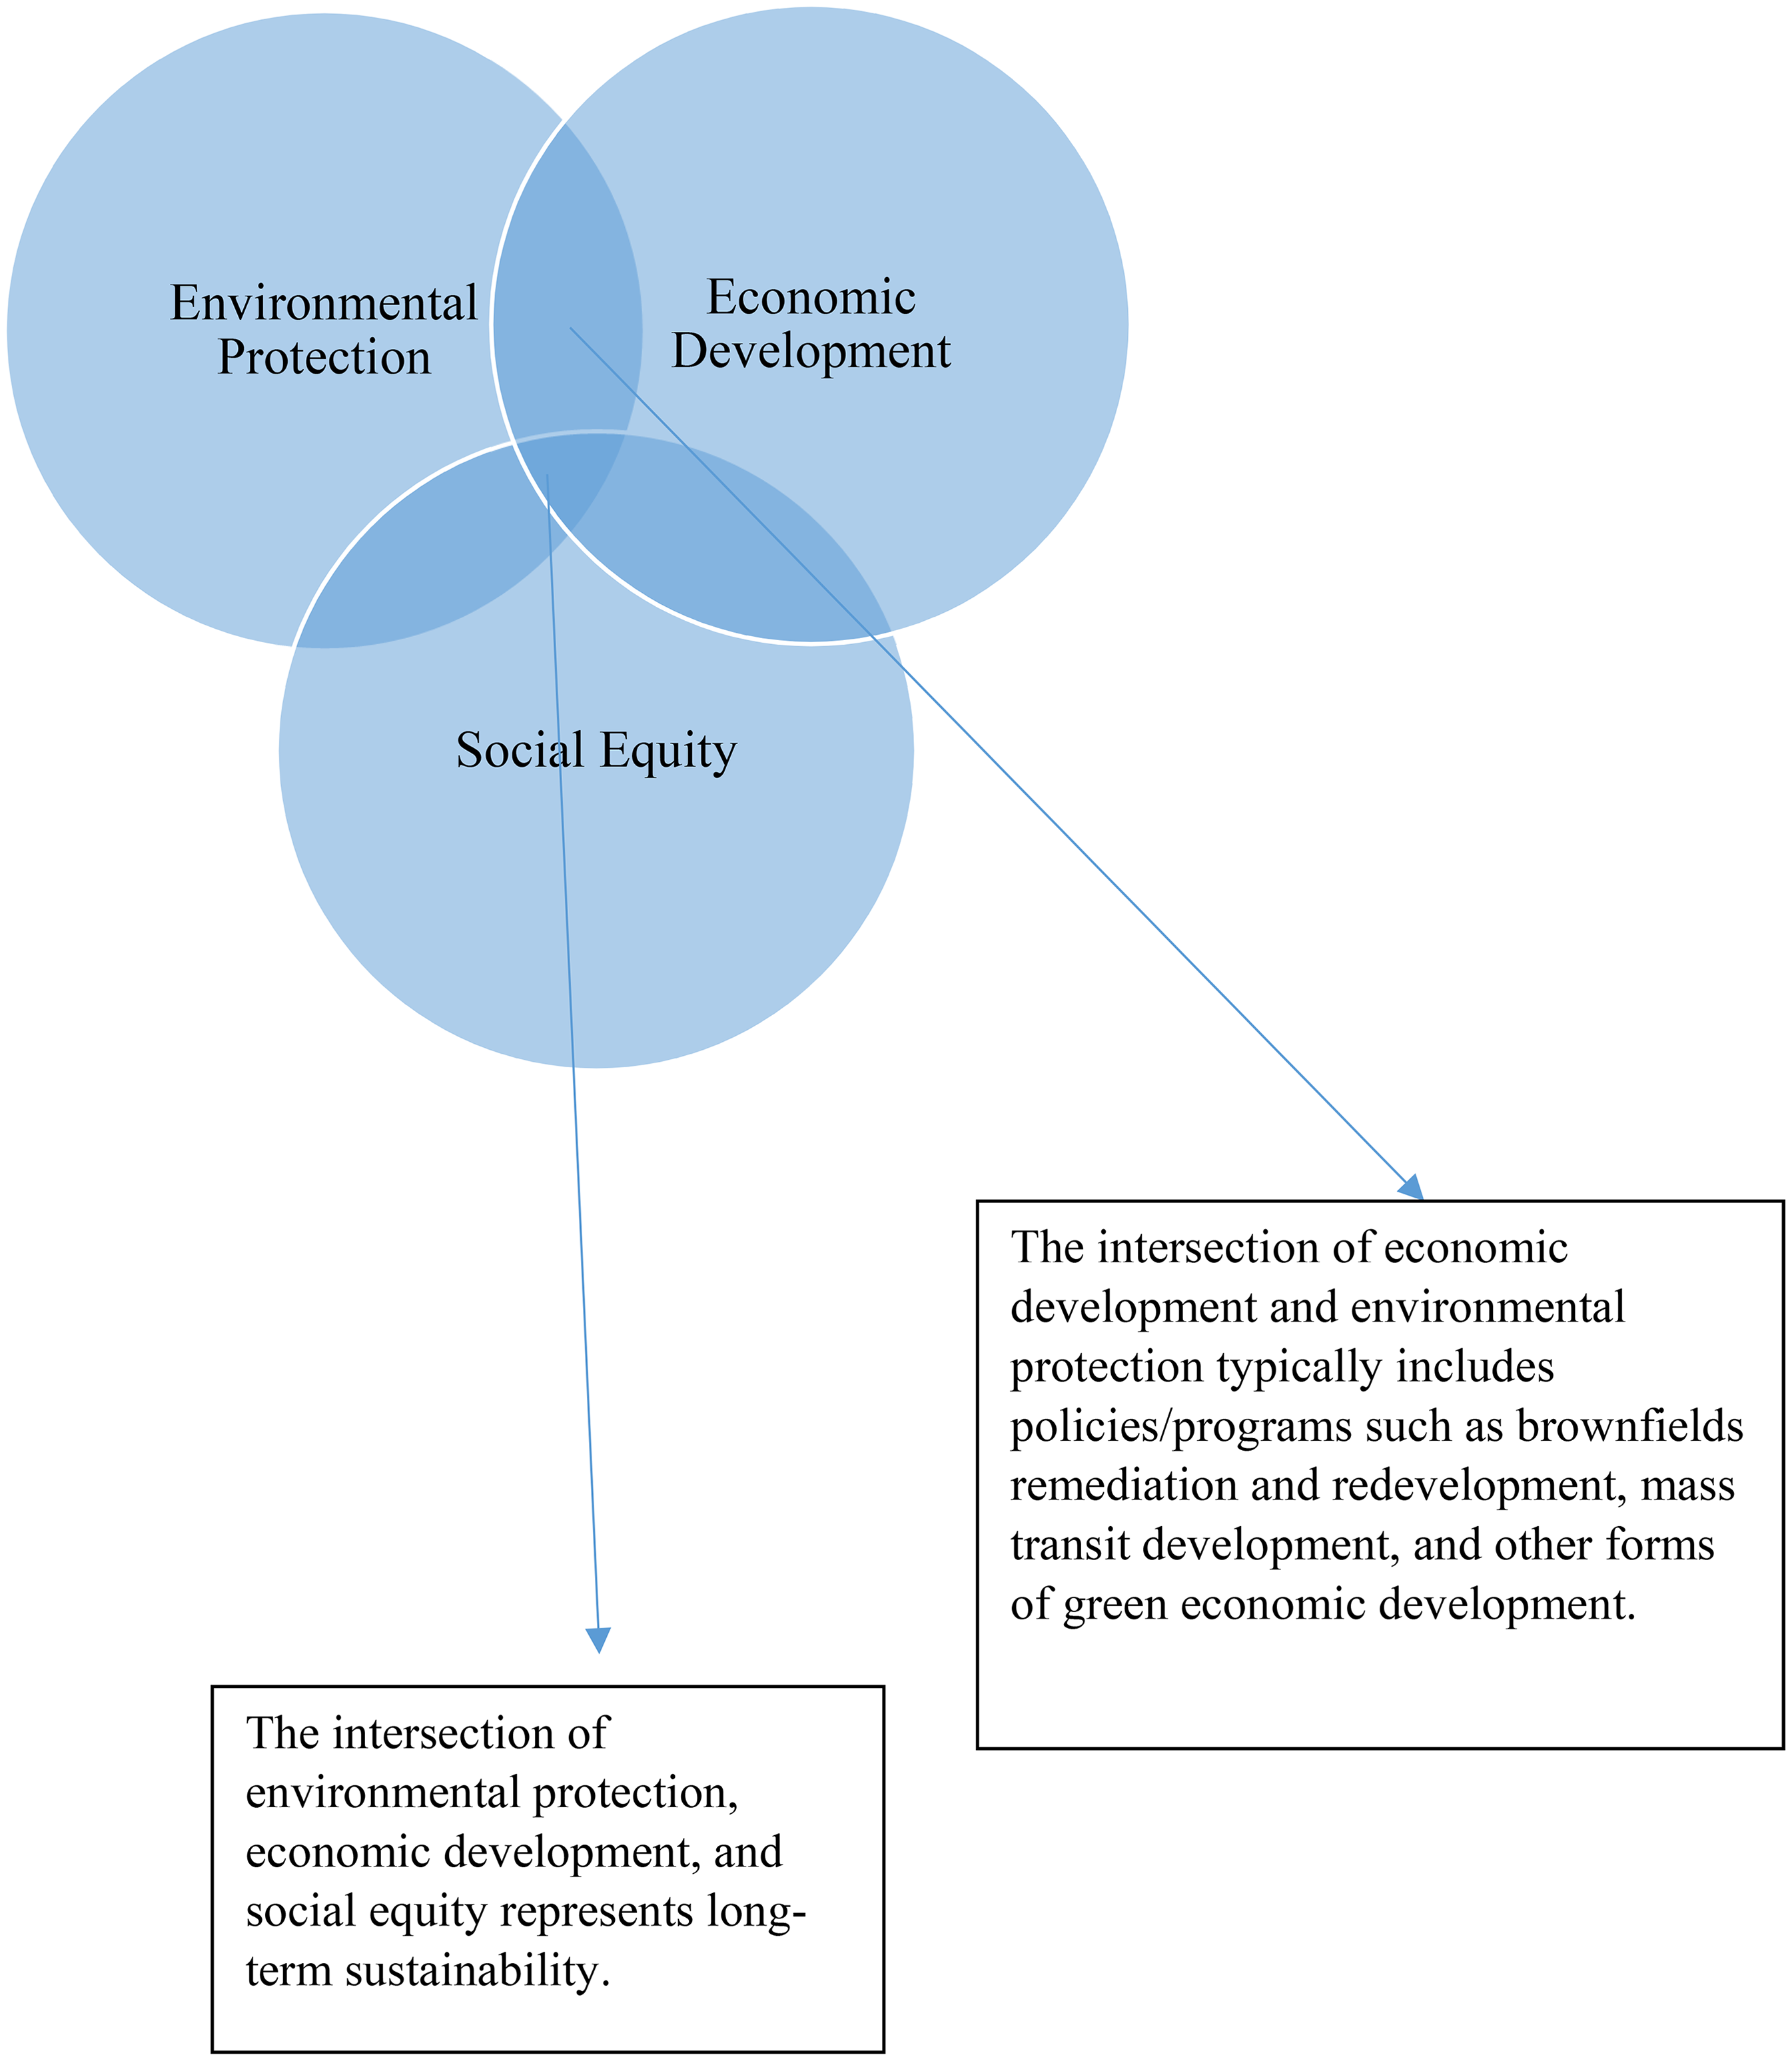
Three pillars of sustainability.
This research studies two of the largest federal economic development programs as defined by the average annual outlay for the 20 years studied. The two OMB codes with the largest annual outlays, codes 401 and 376, were selected to identify key programs responsible for the outlays. The selected programs represent the infrastructure and business development and innovation categories of economic development and have lengthy histories in the federal government. Using program documents, legislation, and agency guidance, any mention of a requirement, incentive, or other environmental-related mentions was documented and considered in this research.
Program Area 1: Federal-Aid Highway
Within the infrastructure development category of economic development, transportation-focused development accounts for about two thirds of the federal outlays with the DOT being the primary agency responsible for these outlays. Within the DOT, the Federal Highway Administration (FHWA) is responsible for the largest share of annual outlays, with $41 billion dedicated to the federal-aid highway program. Principles of sustainability are found in several places across the FHWA and in the programs it implements.
Currently the FHWA has three dedicated offices focused on environmental protection and sustainability including The Natural Environment office, Human Environment office, and Project Development and Environmental Review office. The first two offices deal with issues related to air quality, sustainability, and the built environment while the third office deals primarily with required environmental review processes under the National Environmental Policy Act (NEPA). These offices maintain an active online presence that offers case studies, guidance, publications, tools, and other topics of interest to people studying environmental issues with respect to highway projects (U.S. Department of Transportation, 2024).
FHWA outlays are typically implemented in multiyear programs marked by specific pieces of legislation. During the period studied, FHWA worked under five different multiyear policies (see Figure 3). All five pieces of legislation include some focus on environmental sustainability, including the creation of new environmental-related initiatives, changes to environmental review processes, and/or mandates for research on sustainability topics. Overall, between 2003 and 2023, FHWA's sustainability focus remained primarily on required environmental reviews under NEPA and on congestion reduction as mandated by the Clean Air Act (CAA). Outside of these two areas, sustainability initiatives have represented a series of scattered and comparatively small programs that have changed over time as new policies were implemented.
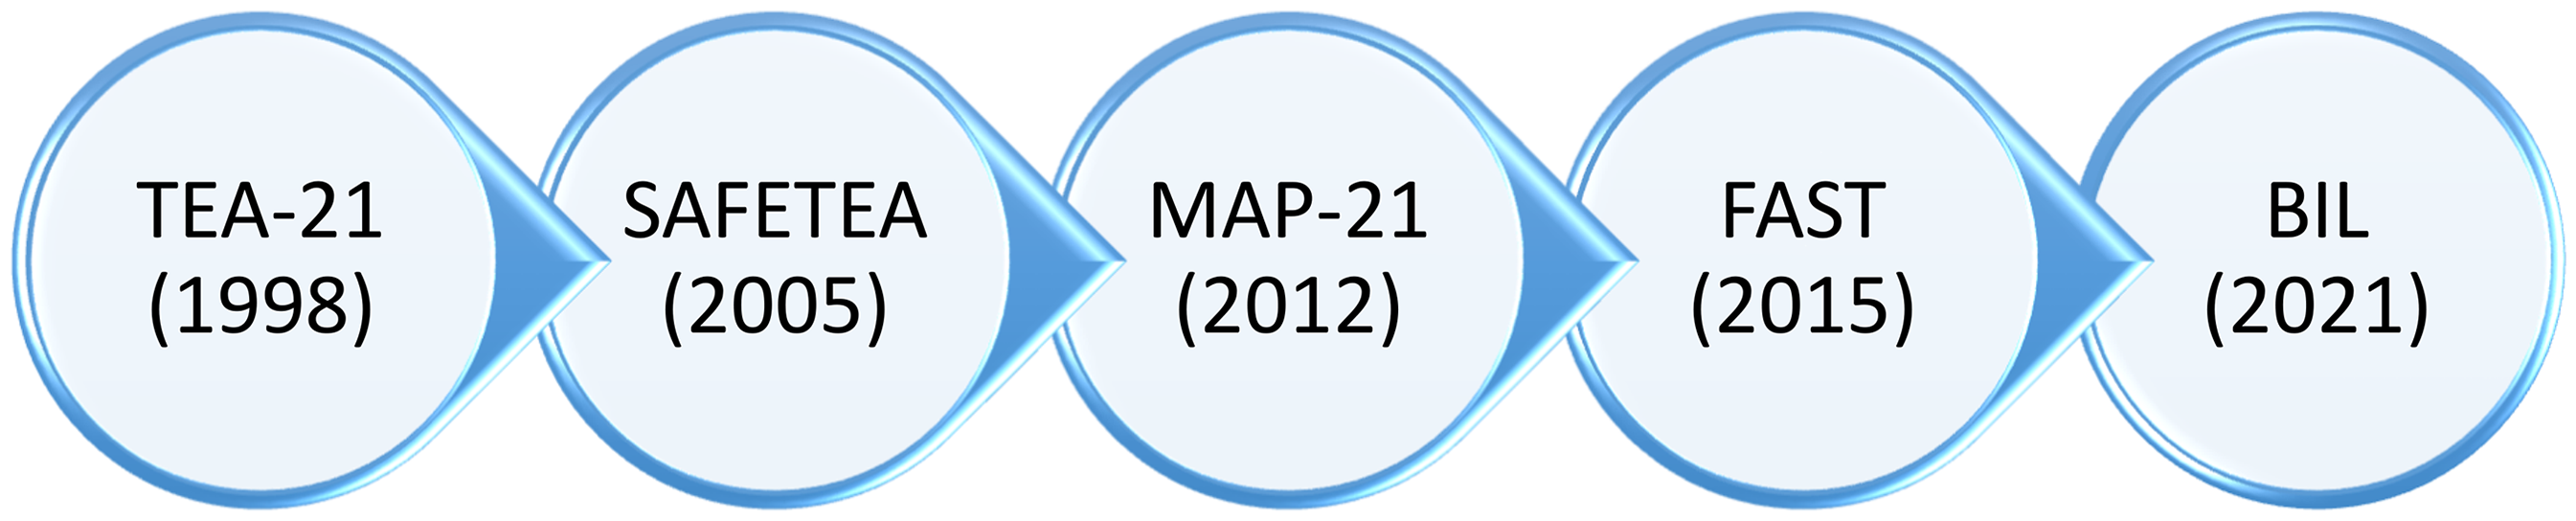
FHWA program legislation.
In the Transportation Equity Act for the twenty-first Century (TEA-21) program adopted in 1998 and operational through 2003, a few small programs were created to support new technologies that included some efforts at improving environmental outcomes. TEA-21 created several unique programs focused on disadvantaged businesses and people that have some relevance to social sustainability concerns and, for those interested in the social equity aspects of sustainability, are worth studying. In the Safe Accountable, Flexible, Efficient Transportation Equity Act (SAFETEA), adopted in 2005, additional congestion reduction programs, pilot programs focused on nonmotorized transportation, and cooperative environmental research programs were launched (U.S. Department of Transportation, n.d.).
Beginning in 2008, climate change adaptation emerged as a visible concern in FHWA with the publication of its first monthly newsletter entitled, “Transportation and Climate Change News” (U.S. Department of Transportation, 2008). These newsletters have remained a part of the organization's sustainability communication efforts and offer news and updates on this topic to readers. This focus continued when, in 2011, DOT issued a formal policy statement on the topic that remains part of the fabric of the organization (U.S. Department of Transportation, 2011).
Moving Ahead for Progress in the twenty-first Century (MAP-21) marked a notable shift for the organization to one with a focus on performance management and outcomes that was not as present in previous FHWA legislation. One of the seven performance management goals for MAP-21 is environmental sustainability meant to “…enhance the performance of the transportation system while protecting and enhancing the national environment” (U.S. Department of Transportation, 2013). Alongside the new requirements for performance management, MAP-21 also continued some of the environmental programs developed under SAFETEA that related to alternative transportation activities including pedestrian and biking infrastructure, conversion of abandoned railroad corridors for trails, and the construction of overlooks (U.S. Department of Transportation, 2012).
With the adoption of Fixing America's Surface Transportation (FAST) in 2015, reducing congestion became the primary sustainability effort with several new programs directed at reducing nonrecurring and recurring congestion on highways (U.S. Department of Transportation, 2024a). In 2022 and 2023, a new policy, the Bipartisan Infrastructure Law (BIL), was adopted. BIL superseded many parts of FAST, created many new programs, and is still in the initial stages of being implemented (Bipartisan Infrastructure Law, 2023). Looking ahead, the BIL program is poised to expand the sustainability focused activities in FHWA by including more robust initiatives to promote sustainability in transportation projects. DOT recently published a series of fact sheets highlighting specific benefits that each state, the District of Columbia (DC), and U.S. territories will receive from BIL. Many of these state fact sheets highlight the climate change mitigation and resilience focus of BIL (U.S. Department of Transportation, 2021).
Ultimately, the biggest challenge to measuring successes or the overall integration of sustainability is how funding is allocated and the comparatively limited federal requirements for specific sustainability goals outside of NEPA. FHWA funding is primarily passed through to states and metropolitan planning organizations (MPO). As a result, states and MPOs wield considerable influence over projects and how sustainability is ultimately reflected in them. As an example, the MAP-21 legislation mandated performance management systems that include sustainability as a required performance category. However, since specific performance goals are determined by states and MPOs, specific sustainability goals and outcomes vary widely across the states. This fragmentation and diversity in approaches makes it impossible to fully ascertain how the FHWA sustainability efforts fared over this period. However, even in absence of being able to fully assess outcomes or overall integration in infrastructure projects, sustainability has grown in recognition in FHWA over the 20-year period examined, and the integration of environmental sustainability has become more robust since the enactment of MAP-21. Ultimately, given the fragmentation and decentralized implementation in the FHWA programs, there is much left to do to fully integrate environmental concerns with these infrastructure development programs. It appears that sustainability is integrated in the BIL and shows promise for more robust integration of economic development and sustainability.
Program Area 2: Business Loan Programs, Business Development, and Innovation
The second program area examined in this research comes from the business development and innovation category of economic development. OMB code 376 represents the single largest OMB code in terms of average annual outlays, most of which falls under the purview of the SBA. The SBA has an average annual outlay of $43.4 billion across several business development loan programs: 7(a), 504, and microloans. The 7(a) loan program is the primary program administered by the SBA, with more than 50% of the average annual outlays studied falling into it. The 7(a) program, like most SBA programs, works by providing loan guarantees to lenders who then provide the loans to small businesses (Small Business Administration, 2024). The 7(a) program loans can be used for a range of things including real estate, working capital, refinancing debt, and purchases of furniture or supplies. The maximum loan under this program is $5 million.
The 504 loan program provides “long-term, fixed rate financing for major fixed assets that promote business growth and job creation” (Small Business Administration, 2024b). Major assets are items such as buildings, land, facilities, and modernization of land. The 504 program cannot be used to fund inventory, working capital, or investment in rental real estate, and there are income limit eligibility rules and a maximum loan amount of $5.5 million. Unlike the 7(a) program that utilizes approved lenders, the 504 program is implemented through nonprofit certified development companies (CDCs).
The smallest of the three programs, microloans (loans up to $50,000), are also provided through intermediary lenders to support small businesses and some nonprofit childcare centers. According to SBA, the average microloan is $13,000 (Small Business Administration, 2024a). The microloan program is geared toward small businesses that need relatively low-cost things like equipment, fixtures, and short-term working capital.
Given the broad definition of eligible entities and the utilization of intermediary lenders or CDCs, it is not possible to fully evaluate sustainable business practices, sustainable business locations, or other typical issues related to business development and sustainability. However, it is possible to draw some insights from historical lending data provided by SBA for the 7a and 504 programs (Small Business Administration, 2024c). Data for the microloan program are not available; however, a full evaluation of the program was conducted in 2021 and is available to review to seek some preliminary insights.
7(a) Loan Program
More than $409 billion was guaranteed from 2003 to 2023 under the SBA 7(a) loan program—an annual average of just over $20 billion. Historical lending data include NAICS codes for the businesses receiving funding under this program, which provides an opportunity to evaluate the extent to which businesses being supported may impact the environment. To identify 7(a) supported businesses that may have a negative environmental impact, the NAICS codes for the fossil fuel industry and mining are used. Green businesses can be identified through the NAICS codes related to clean energy, mass transit, research and development in biotechnology, and environmental remediation businesses.
From 2003 to 2023, the businesses receiving a 7(a) loan reported that 12.5 million jobs were being supported by the loans. A small fraction of these jobs falls into either the environmentally impactful or green jobs categories. Those in the fossil fuel and mining industries reported almost twice the number of jobs supported as did the green job category. From 2003 to 2023, almost 71,000 jobs were supported in the identified fossil fuel and mining industries with a total loan guarantee amount of more than $3 billion. Texas reported receiving more than $600 million in loan guarantees that supported 14,236 jobs. In Texas, somewhat unsurprisingly, the largest category of business receiving 7(a) loans are listed as “support activities for oil and gas operations.” Many businesses in these industries accessed multiple loans over the time studied. The so-called green businesses show that just under $1.7 billion was loaned to businesses that supported almost 40,000 jobs over these 20 years. California reported the largest total dollars and jobs created in green industries over the time studied, with more than $385 million in loans that supported 8,582 jobs. In California, businesses under the “recyclable material merchant wholesalers” category represented the largest in total dollars guaranteed and jobs supported.
Overall, the 7(a) data show that more jobs were supported in the fossil fuel and mining industries, with oil and gas support services dominating this category. Given the rapid development and use of oil and gas hydraulic fracturing, also known as fracking, occurring over this period, the expansion or creation of businesses in this area makes sense. As can be seen in Figures 4 and 5, both industry groupings showed peaks around the time of the financial crisis from 2009 to 2011 and a second smaller peak around the Covid-19 pandemic in 2021. The significant economic shifts occurring during these two events likely indicate a need for financial resources by both industry groups. Neither industry grouping shows a clear upward or downward trajectory over the period studied.
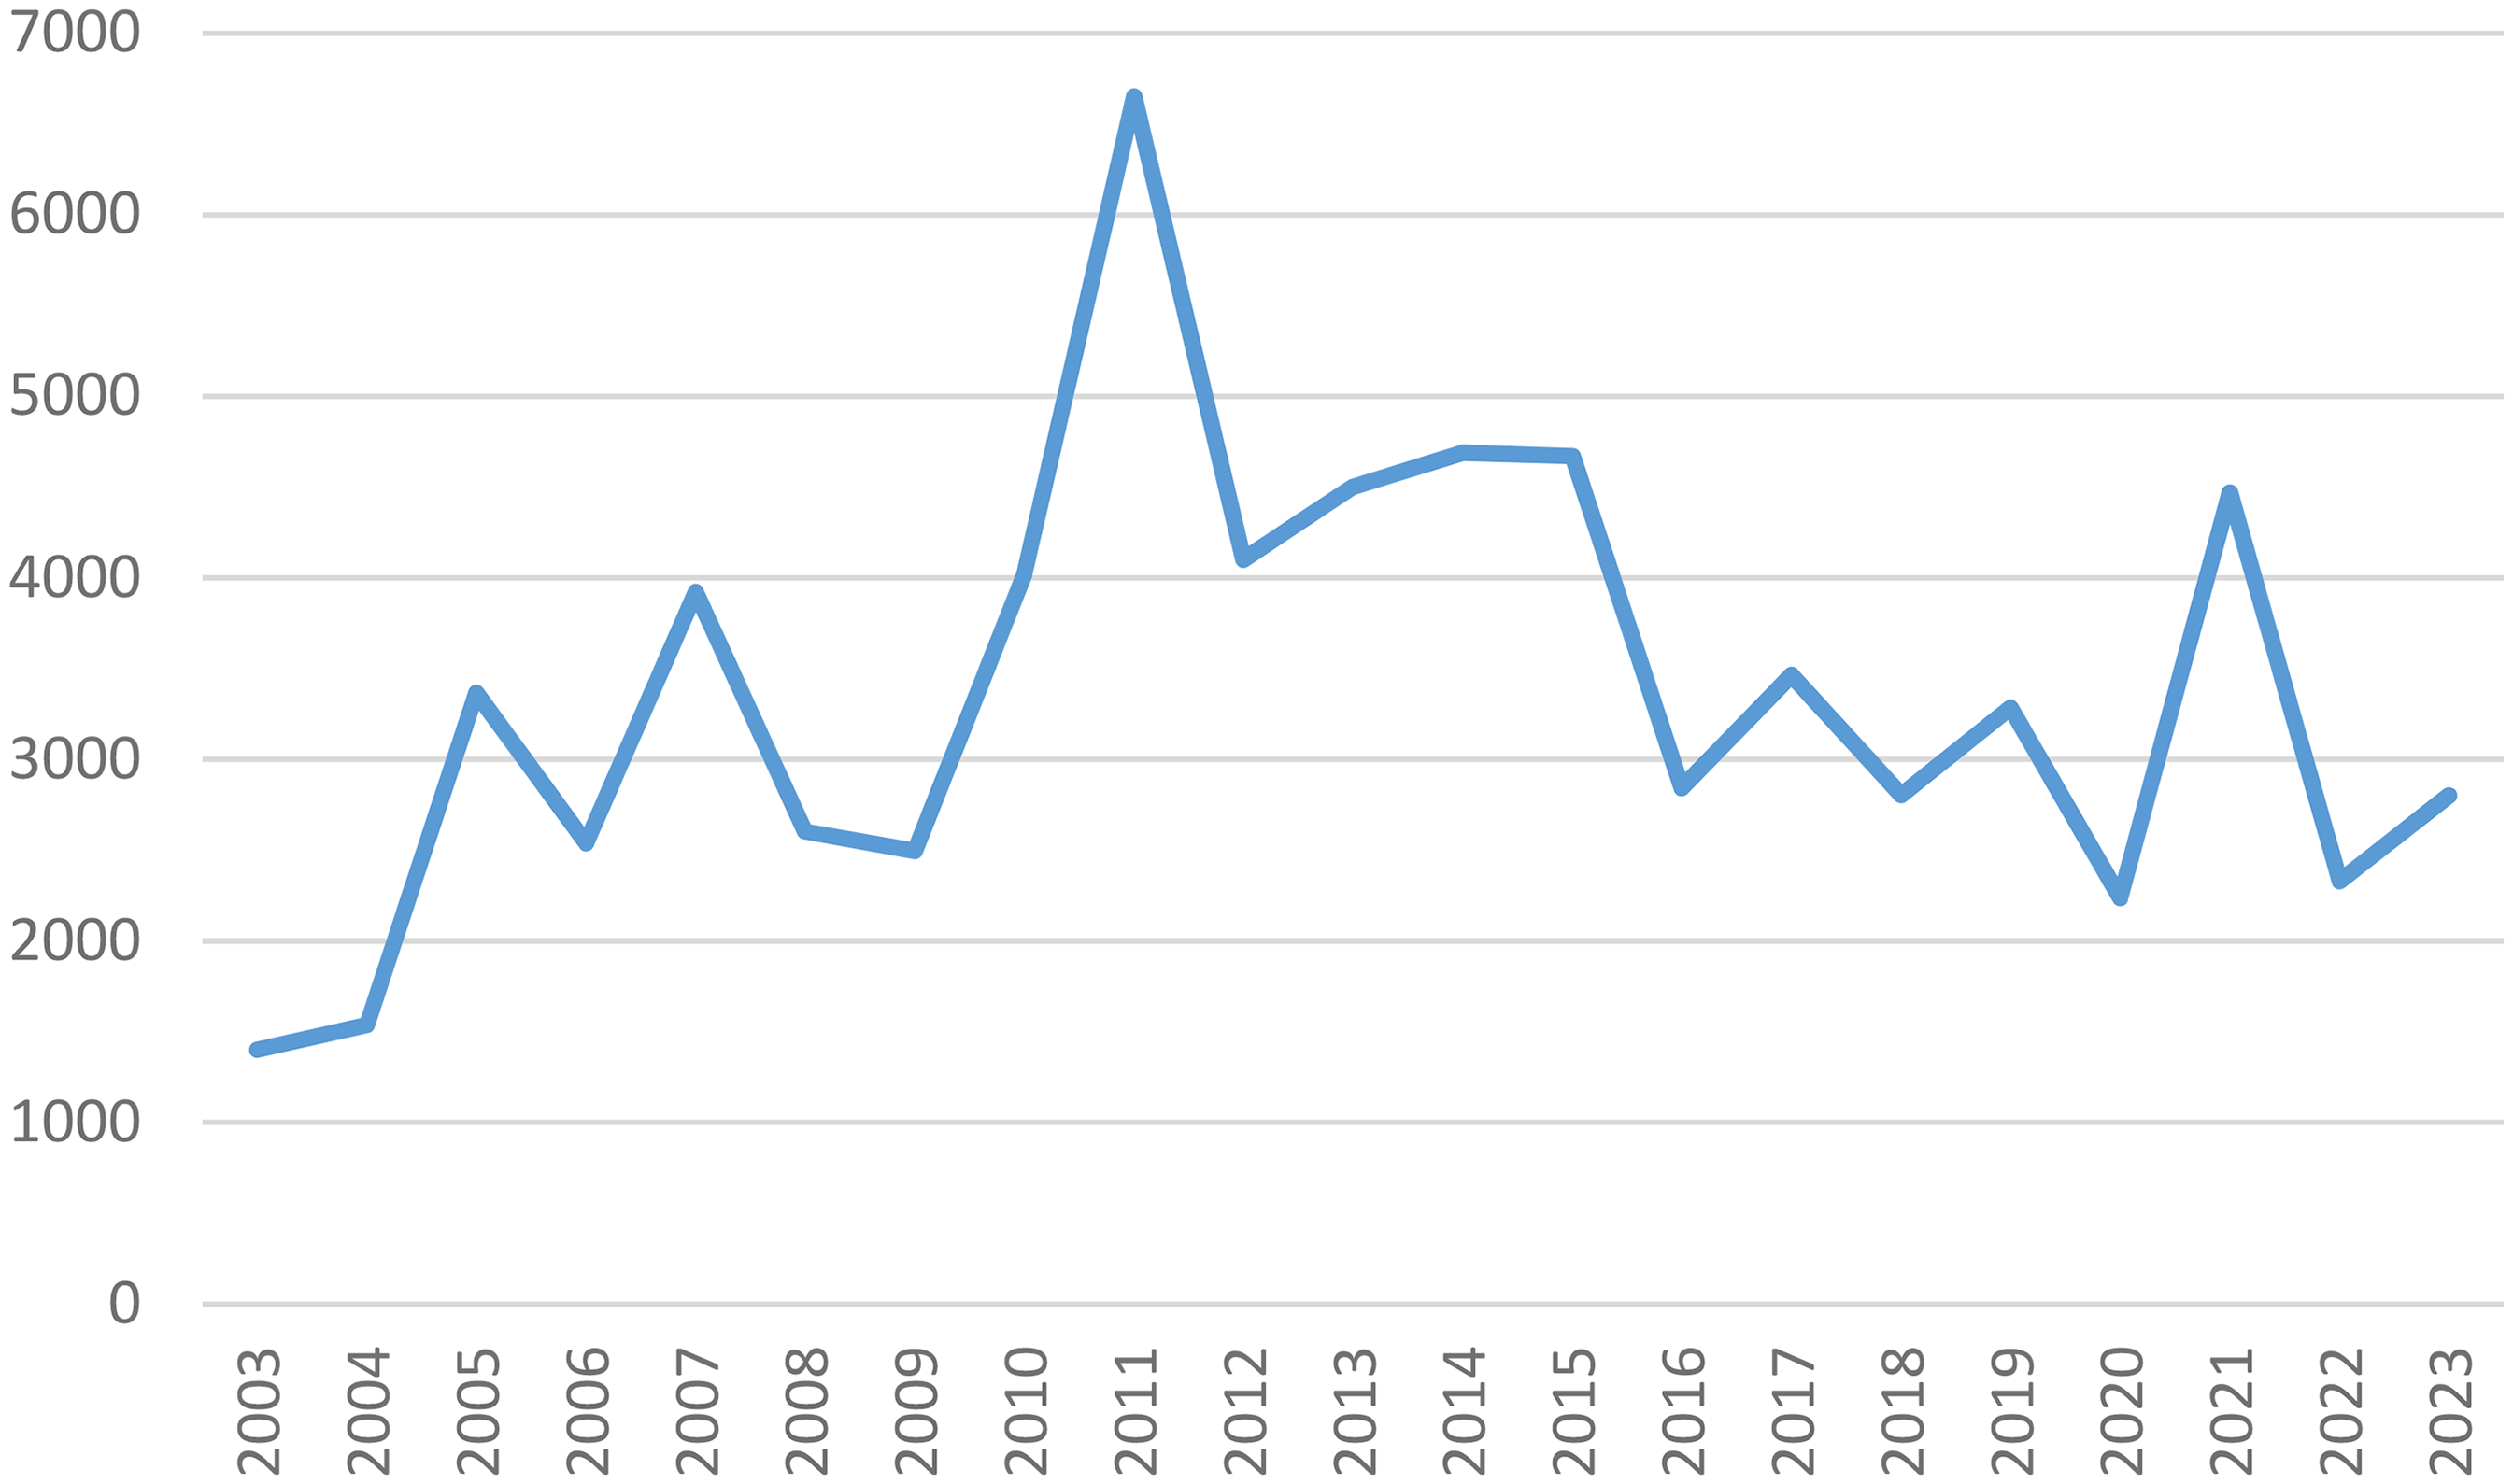
Fossil fuel or mining businesses supported by 7(a) program.
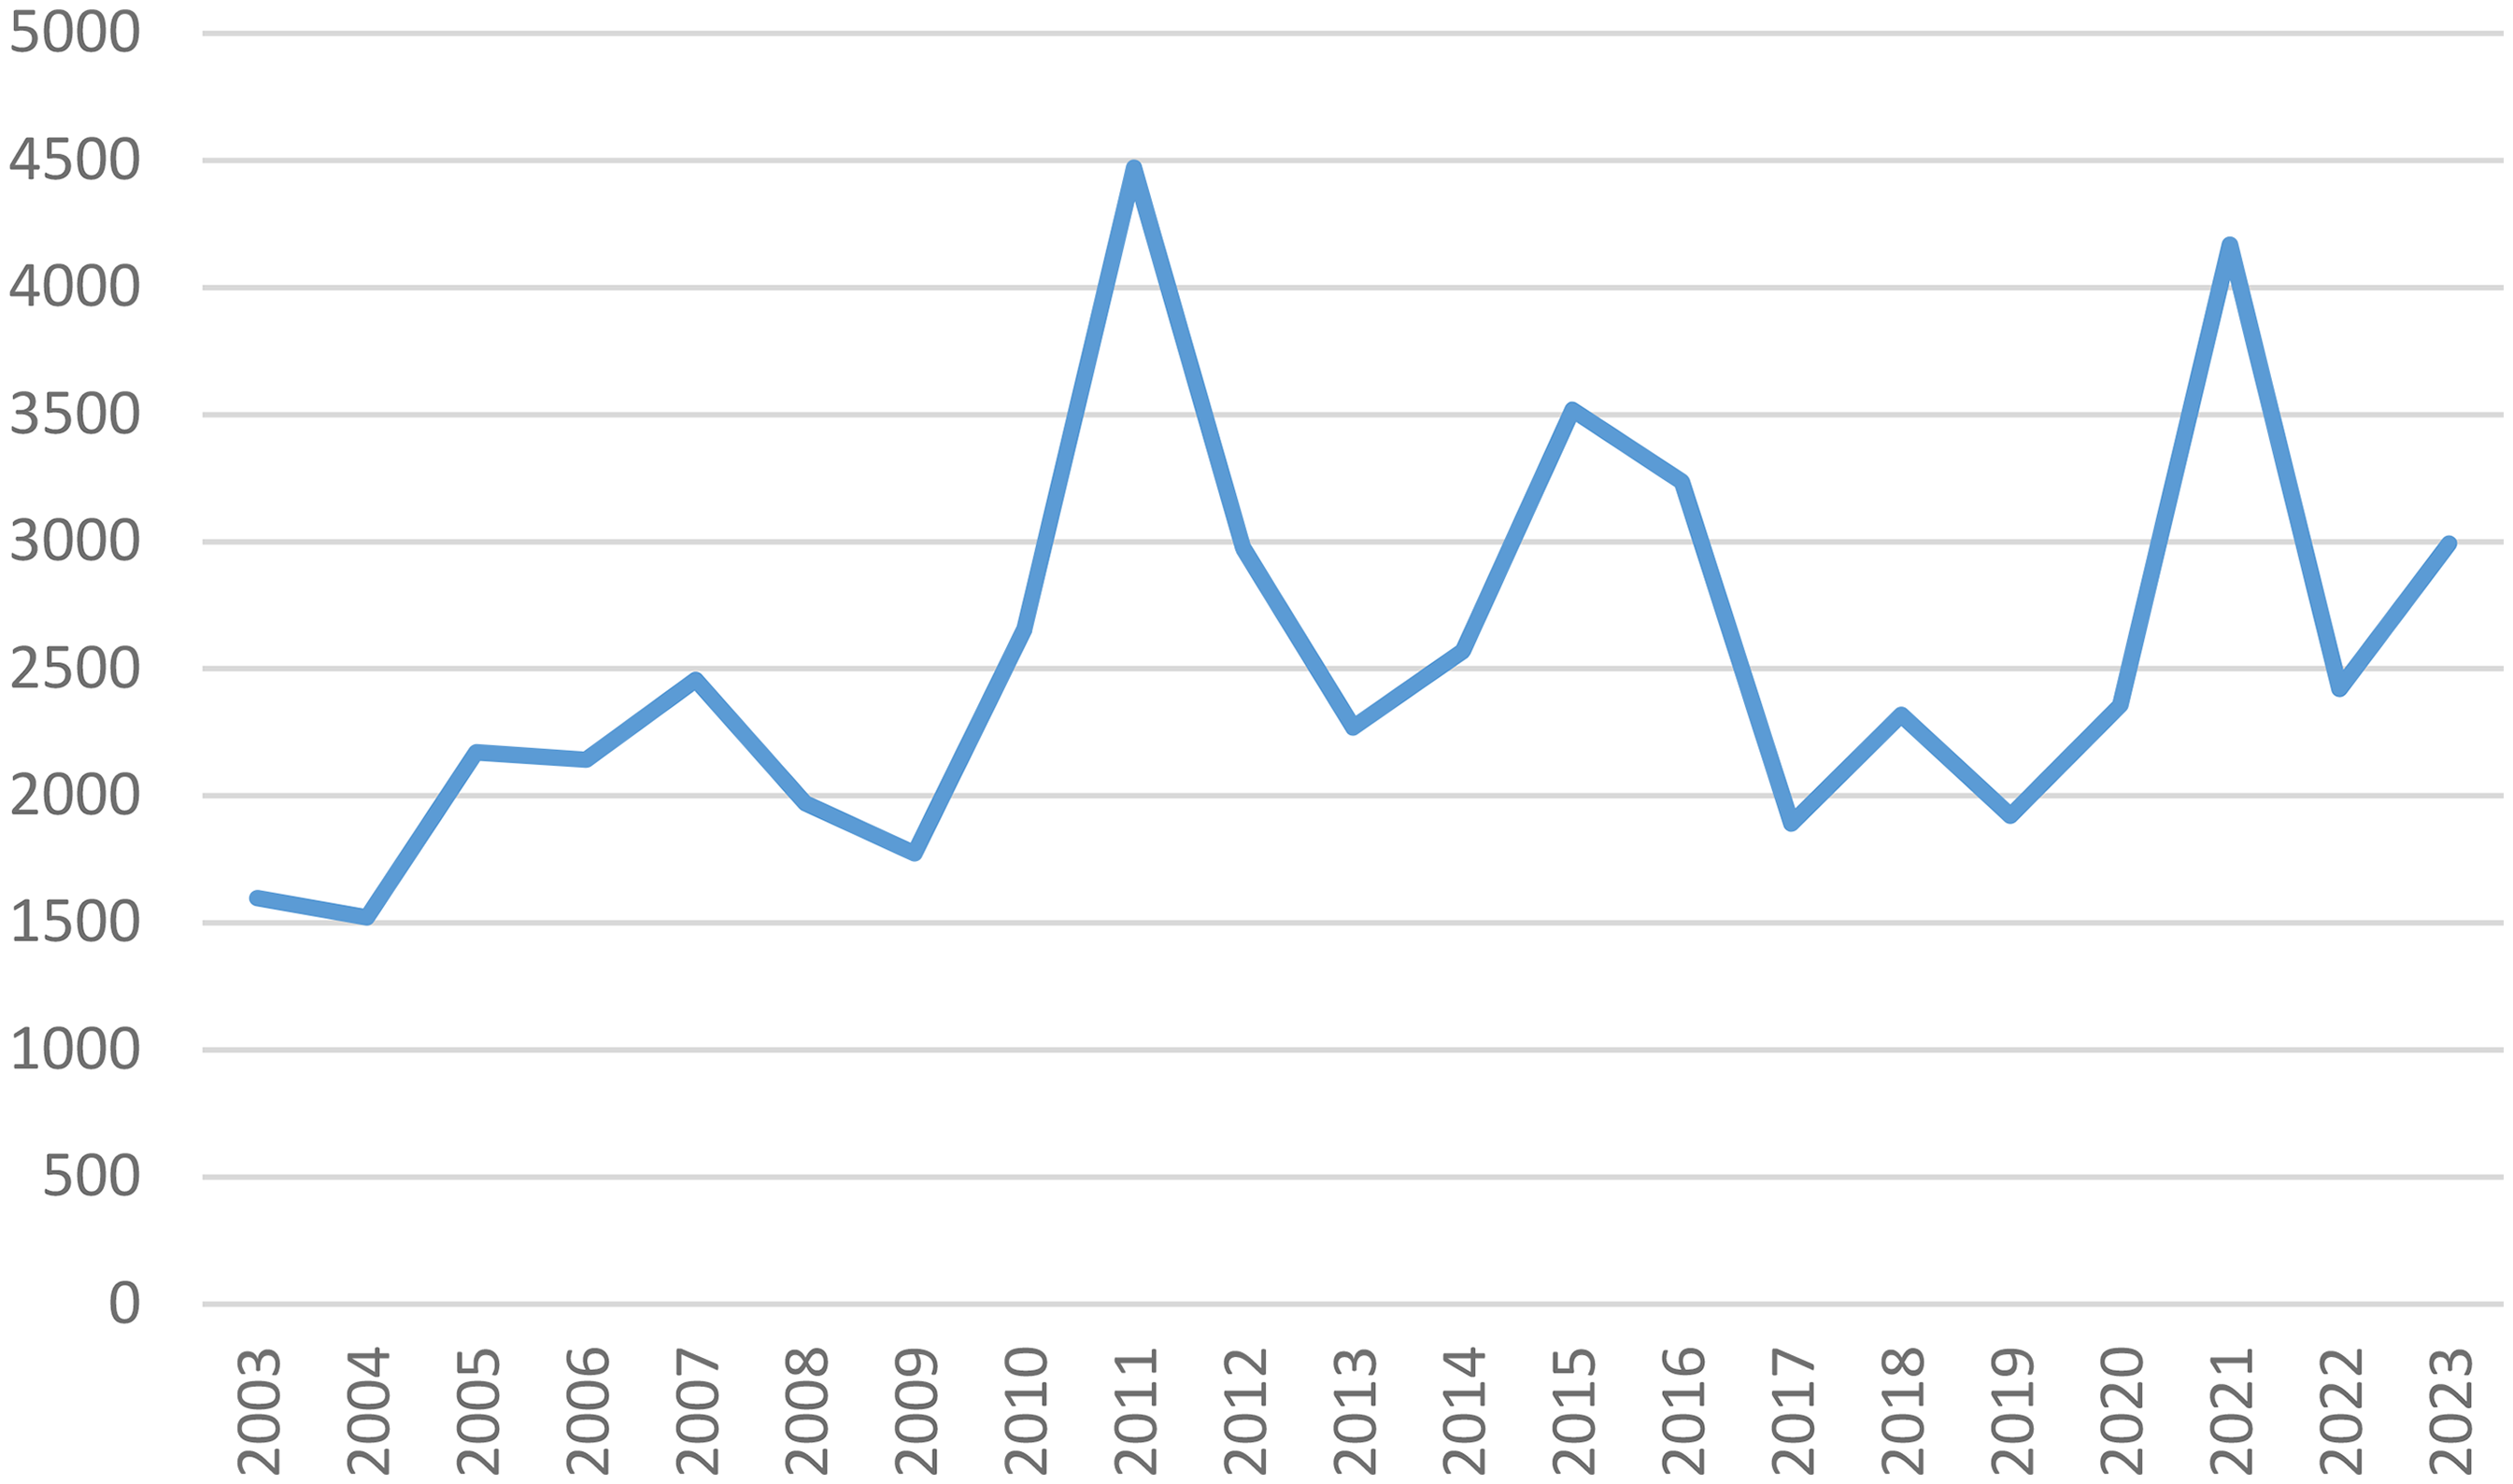
Green jobs supported, 7(a) program.
504 Loan Program
More than $144 billion was loaned under the 504 program from 2003 to 2023 representing more than $7 billion each year. A total of 2.8 million jobs were reported to be supported by this program over this same time. Full-service restaurants, hotels (except casino hotels), and limited-service restaurants reported supporting the most jobs under this program. Replicating the categories studied in the 7(a) program allows for insights into the program's support of jobs that may have environmental relevance.
A total of 8,544 jobs were reported as being supported by this program in the fossil fuel or mining industries with the “petroleum bulk stations and terminals” representing the top industry category. Texas businesses reported supporting the most jobs in these industries at almost 1,400. A total of 12,444 green jobs—notably more than the fossil fuel or mining industries—were reported as supported by 504 loans. California reported the highest number of jobs at more than 4800, with most classified as recyclable material merchant wholesalers and environmental consulting services.
In Figure 6, the 504 program shows a decline in the number of jobs supported over this period, with the fossil fuel and mining businesses remaining lower in total jobs supported throughout most of the years. Given the greater number of restrictions on how 504 loans can be used, it is likely that the fossil fuel and mining jobs reflect the differences in the needs these businesses are likely to have. For example, the oil and gas industry may be more likely to need financial support for items such as working capital or refinancing of existing debt that are not eligible for 504 funding. This could explain the increased number of businesses utilizing the 7(a) program instead of the 504 loan program.
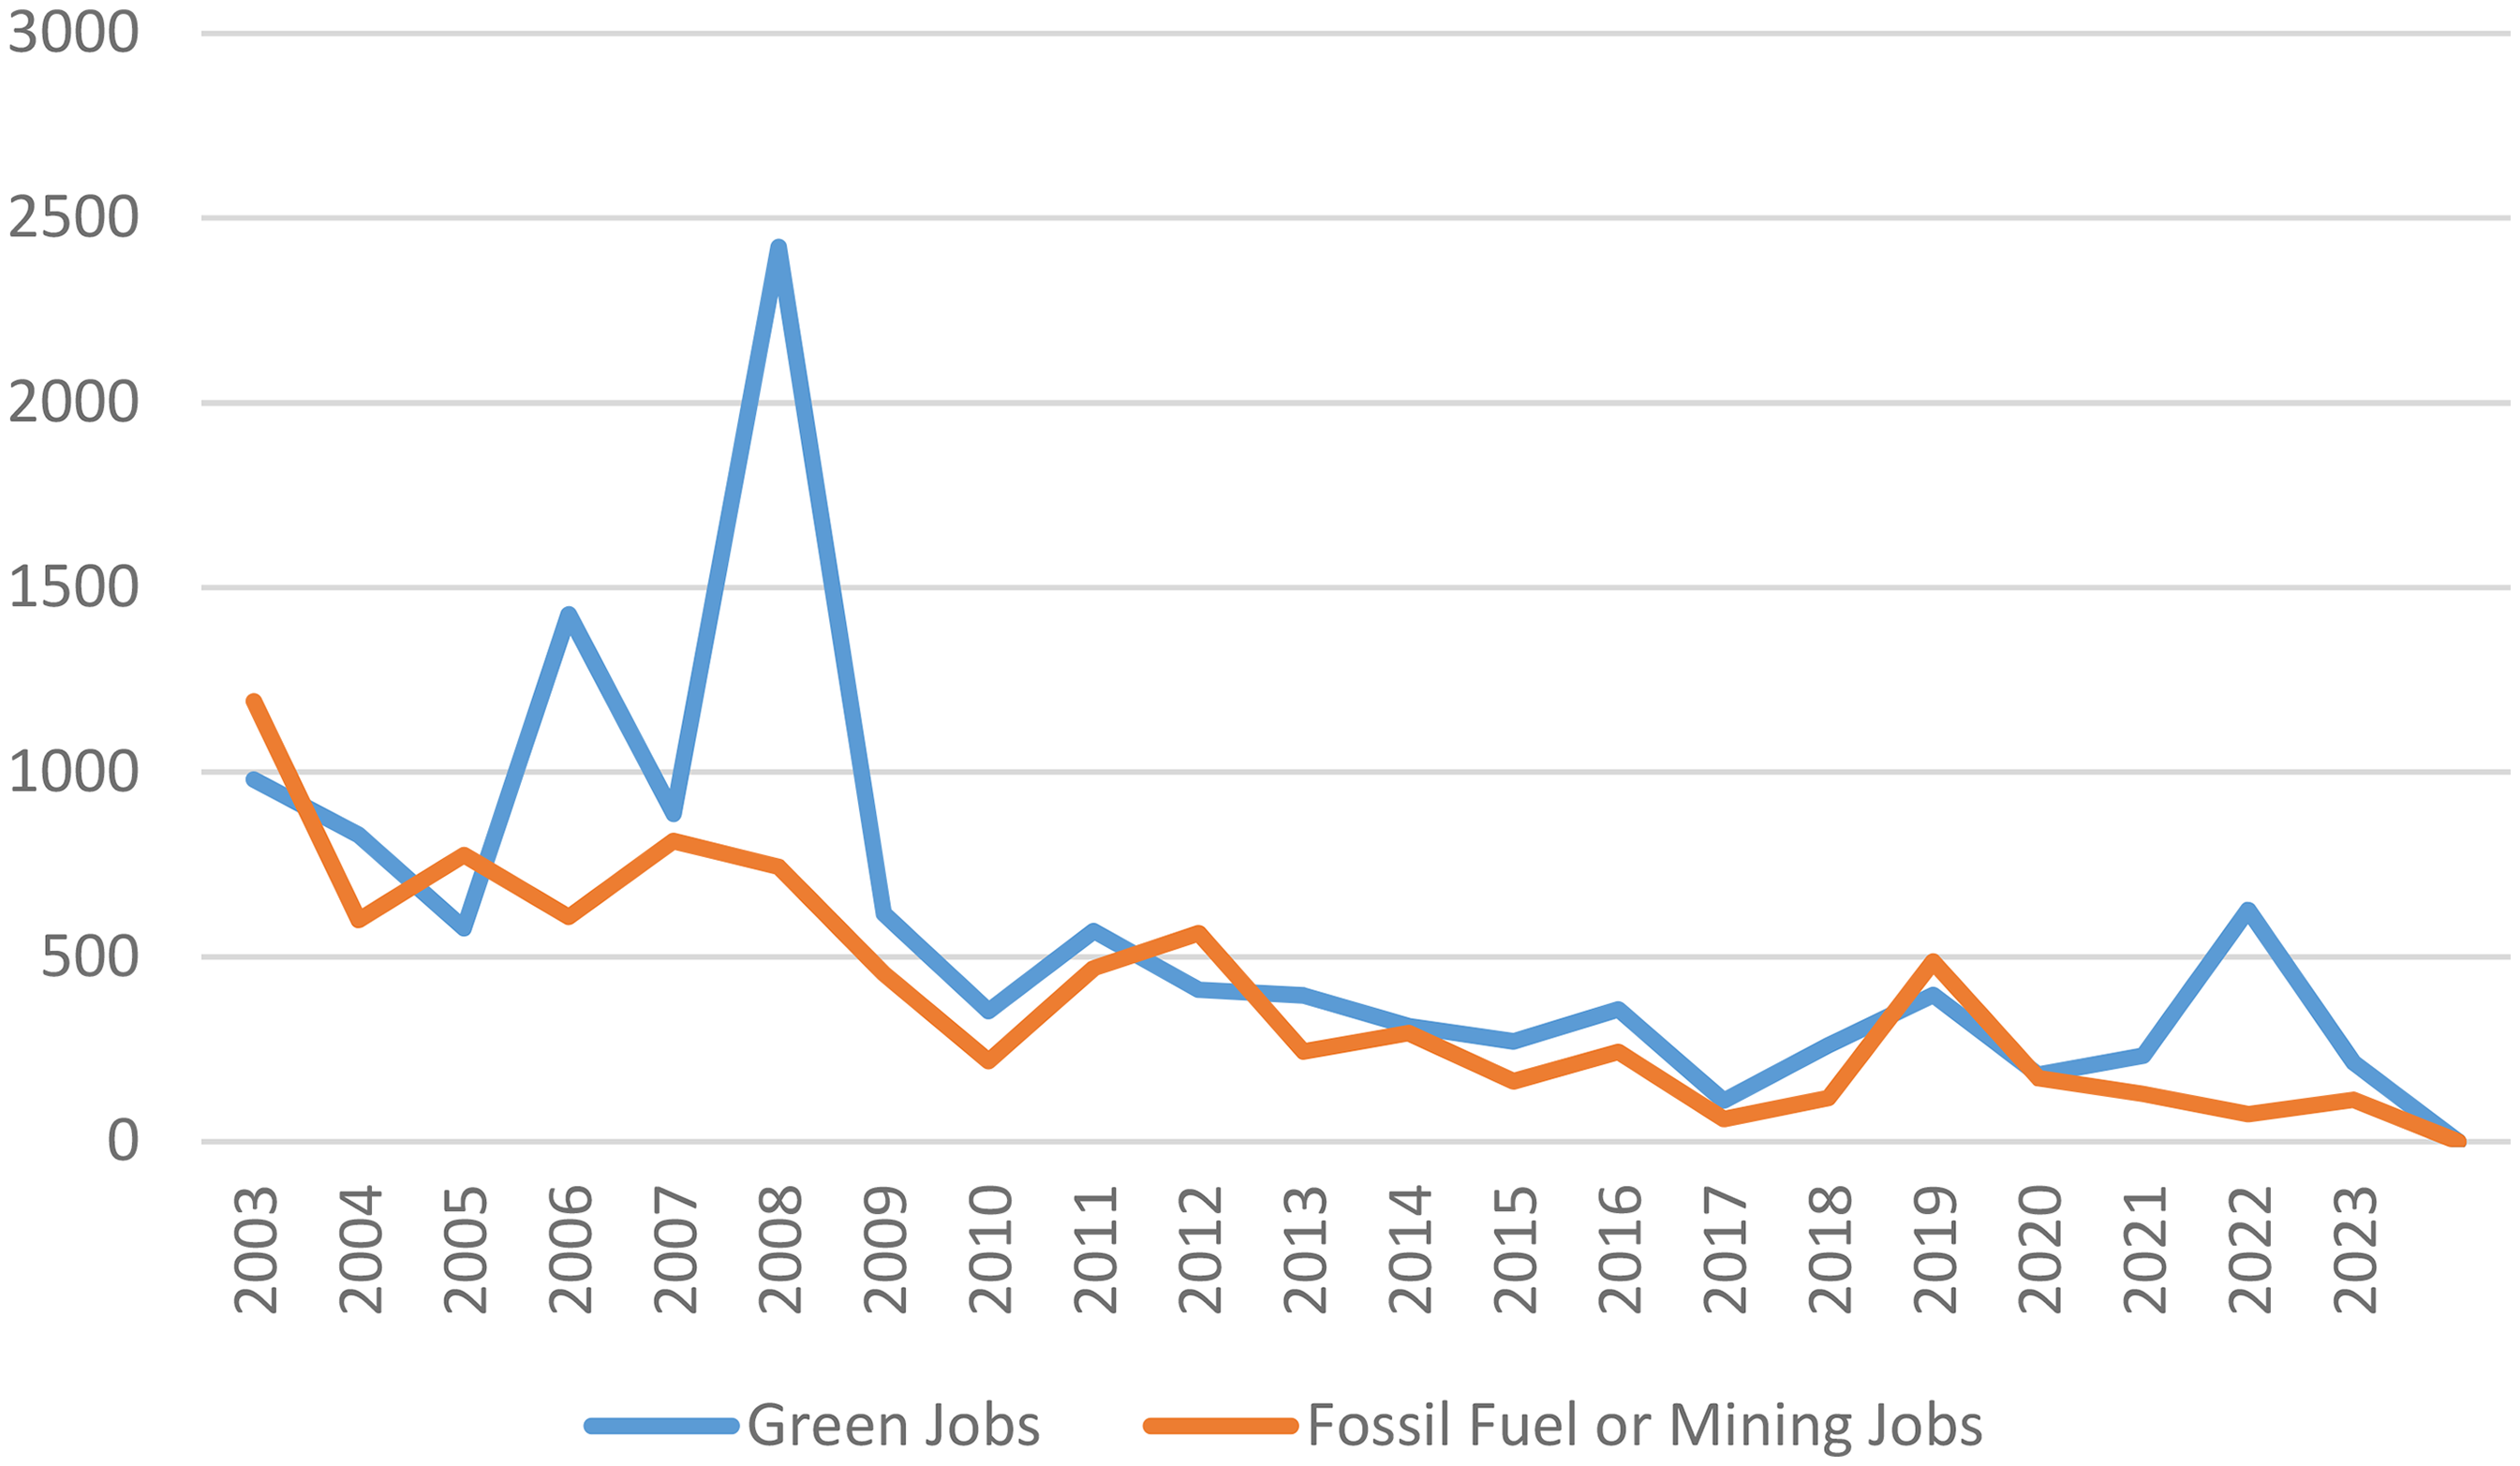
504 program fossil fuel and mining jobs versus green jobs supported.
Microloan Program
Lending data are not available for the SBA microloan program; however, the SBA commissioned and published a full evaluation of the program in November of 2021 that offers some insights for this article. In this evaluation, all microloan data were assessed through fiscal year 2020 and NAICS data were reported at the summary level. According to this evaluation, only 24 out of more than 31,000 businesses receiving a microloan through 2020 were in fossil fuel or mining industries; around 1400 could be classified as green businesses. As noted in the evaluation, “…the largest proportions of microloan firms were in economic sectors of retail trade… other services… accommodation and food services… transportation and warehousing… and professional, scientific, and technical services” (Optimal Solutions Group, 2021, p. 18).
Overall, not much can be said on the integration of sustainability into the microloan program given the lack of data, small number of loans, and nature of the program itself. The microloan program is primarily geared to supporting immediate needs of a business that may struggle to access traditional financing sources. In the evaluation of the program, it was noted that, “Most microloan business owners (80.69 percent) are from underrepresented groups (women, low income, veterans, minorities)…” (Optimal Solutions Group, 2021, p. 19).
Viewed collectively, the SBA loan programs provide limited insight into how sustainability may fare in the businesses being supported by these loans. To be sure, the programs are meant to support small businesses of all types, and no requirements are set to ensure the businesses are concerned with or integrating sustainability principles. The data on businesses in industries that are clearly environmentally bad, such as the fossil fuel industry, provide some evidence of how these loan programs may support negative environmental outcomes for communities. However, absent a robust evaluation at the business level, it is impossible to fully ascertain how the SBA programs are impacting or considering environmental sustainability.
Lessons and Next Steps
Reviewing these 20 years of federal economic development spending reveals some important insights. Among the key lessons are:
The federal government's economic development efforts are fragmented and sometimes overlap. The efficiency and effectiveness of these programs is unclear—particularly as it relates to sustainable economic development. Many federal economic development programs focus on building physical infrastructure such as highways and housing.
Lesson 1: Fragmented
Federal economic development outlays illustrate a fragmented landscape of federal economic development efforts. Seventy-seven different administrative units administer and implement well over 100 different programs that can be characterized as economic development related. Fragmentation in these federal outlays for economic development can be seen at both the policy and the implementation level. DOT is one example of fragmentation at the policy level; it spends billions each year on infrastructure development while the Department of Commerce's Economic Development Administration (EDA) also spends millions annually on infrastructure development in its public works program. This policy fragmentation typically stems from decisions made in Congress that have either intentionally or unintentionally located programs or directed spending into certain administrative units. From an implementation fragmentation perspective, many of these federal economic development programs are implemented through lower-level government units, as is the case in FHWA's programs. Fragmented implementation has a long history of scholarly inquiry with respect to efficiency and effectiveness that poses questions about how these major programs are faring given the role of many actors in the implementation process.
Concerns about efficiency and effectiveness in fragmented systems exist at all levels of government and have a long history of inquiry. “This notion that American policy implementation is ‘fragmented’ has become something of a commonplace among students of policy implementation…” (Farhang & Yaver, 2016, p. 401). Political science scholarship argues that policy fragmentation at the federal level is a result of congressional compromises, “vote-buying,” and desires to control the bureaucracy (Carcelli, 2023; Farhang & Yaver, 2016). Research on policy fragmentation at the federal government has studied specific policy areas—such as foreign aid or housing—and provided evidence that this fragmentation often leads to less effectiveness (Carcelli, 2023; Koschinsky & Swanstrom, 2001). Scholars often call for improved policy integration and cross-agency coordination when lamenting the problems created from policy fragmentation (Cejudo & Michel, 2017).
It remains to be seen whether or how the fragmentation in federal economic development policy influences their ultimate outcomes. It is also unclear how fragmentation factors into the relative deficit of integration of sustainability principles or sustainability goals in the two areas studied. Future research should focus on specific policy areas in the federal government and explore these questions to assess how effectiveness and efficiency are impacted by fragmentation.
Lesson 2: The Federal-Level Involvement in Sustainable Economic Development is Underdeveloped
The two program areas examined in this research do not reflect a focus or significant emphasis on environmental sustainability. Although the DOT appears to be embracing environmental sustainability more in recent policy, the overall engagement remains low and underdeveloped. The SBA's loan programs are designed to have limited restrictions on eligibility. As a result of this open nature, the small businesses being supported come from a diverse set of industries. To explore how sustainability fares beyond the accounting of fossil fuel, mining, or green industries require an analysis at the business level. Questions of where the businesses are located, how any business expansion embraces principles of sustainability, and other case-specific information would enable a more robust analysis of how these SBA programs are contributing to environmental sustainability. It is worth noting that the government's key environmental agency, the Environmental Protection Agency (EPA), showed a small investment of around $205 million a year in economic development outlays in these data from OMB codes 301 and 401. EPA investments may offer some insights into an EPA that has started to invest in sustainable economic development goals.
Conclusions
This research focused on two major tasks: identifying federal economic development outlays and understanding how environmental sustainability may intersect with some of the largest federal economic development programs. The conclusions of this research follow.
What investments in economic development have occurred in the federal government from 2003 to 2023? 2. What agencies and programs are the key drivers of federal economic development spending? 3. How does sustainability factor—if at all—into two of the largest federal economic development programs? 4. What lessons can be gleaned from federal economic development spending that can inform research and policy development?
The federal government is a significant actor in economic development with more than $450 billion in average annual outlays during this time. Scholars and policy actors interested in understanding economic development must look beyond the state and local efforts and include the significant federal investment as part of any analysis. In many communities, federal investment may represent a significant and powerful influence on how a community develops and how well it integrates sustainability principles into economic development. Ultimately, these federal investments may contribute to the overall quality of life landscape for many locations.
Four agencies account for most of the federal economic development spending: DOT, Education, HUD, and HHS. Three of these—DOT, Education, and HUD—dedicate virtually all spending to economic development purposes. Four additional agencies—Army Corps of Engineers, NASA, NSF, and SBA—also dedicate nearly their entire budgets to economic development purposes. Infrastructure and education programs represent the largest share of total economic development outlays. Based on this information, these seven federal agencies can be classified as economic development agencies. As the political environment over the federal budget remains tumultuous, it is important to consider how changes in any of these seven agencies might impact the overall economy and local economic development capacity. Significant cuts or restructuring in an organization solely focused on economic development will likely have impacts far beyond the federal government.
The two programs studied in this research showed minimal environmental sustainability integration, consideration, or prioritization. The FHWA programs appear to be gradually adopting more sustainability efforts, but overall environmental concerns remain focused on meeting CAA and NEPA mandates.
Both policy and implementation fragmentation are seen across federal economic development spending. While previous research has focused on policy integration and policy coordination as being needed to combat the poorer outcomes associated with fragmentation, more research is needed to fully understand how it impacts the ability to integrate sustainability ideals into economic development efforts. To be sure, sustainability is a multifaceted topic requiring an approach that exceeds the boundaries of traditional organizational silos. The economic development fragmentation seen in this research may provide an opportunity to integrate various aspects and dimensions of sustainability into federal programs without expanding the reach of traditional environmental programs.
This research has demonstrated the significant size of the federal investment into economic development. Using OMB function codes allows for the identification of these economic development outlays. However, this research has limitations that must be noted. Although key spending areas and programs responsible for that spending can be identified, it is not possible to derive insights into the ultimate outcomes of these outlays or programs. Additionally, although this research reviewed program guidance and available artifacts of two programs to assess sustainability integration, this is likely an incomplete view of the programs. Conducting in-depth interviews and requesting additional documents from each program is necessary to provide additional insights into how sustainability is discussed, how decisions are made, and where sustainability considerations may exist beyond what is publicly available.
Footnotes
Declaration of Conflicting Interests
The author declared no potential conflicts of interest with respect to the research, authorship, and/or publication of this article.
Funding
The author received no financial support for the research, authorship, and/or publication of this article.