
Abstract
Objective:
The aim of this study was to explore the association of body mass index (BMI), waist circumference (WC), and BMI and WC changes over time with cognitive decline in a nationally representative sample.
Methods:
A total of 5239 participants (≥65 years) were followed for 3 years as part of the National Health and Aging Trends Study. Cox proportional hazard regression was applied to model the risk of cognitive decline.
Results:
BMI, after adjusting for WC and main confounders, was associated with reduced risk of cognitive decline (hazard ratio [HR] 0.97 for each unit BMI increase, 0.95-0.99). After stratifying by gender and age, this effect remained significant among females and young elders ≤80 years. A BMI decrease and WC increase >10% over the study period were associated with increased risk of cognitive decline (HR 1.98, 1.16-3.38; HR 1.30, 1.04-1.62, respectively).
Conclusion:
In the elderly individuals, lean mass, as measured by BMI adjusted for WC, was associated with reduced risk of cognitive decline. Loss of lean mass and gain of fat mass, as measured by WC adjusted for BMI, were associated with elevated risk of cognitive decline.
Introduction
The prevalence of dementia and obesity is growing at an alarming rate in the United States, 1 with the number of individuals with dementia estimated to triple by 2050 2 and obesity prevalence to increase 33% by 2030. 3 Given these trends, there has been increased interest in studying the relationship between obesity, measured clinically by the body mass index (BMI) or waist circumference (WC), and cognitive decline. Studies thus far have revealed conflicting results in elderly cohorts, with most studies using BMI alone as a measure of obesity. 4,5 There is growing recognition, however, that BMI and central adiposity markers such as WC provide different but complementary measures of body composition. Previous studies have demonstrated opposing effects of lean mass, as evaluated by BMI after adjusting for WC, and abdominal fat mass, as evaluated by WC after adjusting for BMI, in association with mortality in an elderly cohort. 6 We hypothesize that the use of BMI alone and the lack of adjustment for WC may partly explain the inconsistency among previous studies of obesity and dementia. In this study, we aim to examine the association of BMI and WC together on the 3-year risk of cognitive decline in a large nationally representative sample of community-dwelling elders in the National Health and Aging Trends Study (NHATS).
Methods
Sample
The present investigation is a longitudinal study of community-dwelling participants in the NHATS. The NHATS is the successor to the National Long Term Care Survey and is a panel study of Medicare beneficiaries aged 65 and older. The NHATS final sample included participants from every state except Alaska, Hawaii, and Puerto Rico. Participants and/or their proxies were interviewed every year in person in 2011 until 2014; the present study includes data over these 3 years of follow-up. The NHATS reports an overall weighted response rate of 85.3% for round 1, 87.4%, and 89.5% for rounds 2 and 3. 7 The first round of NHATS included 8245 individuals. In all, 1048 participants were excluded, since they were noncommunity residents (residential care or nursing home). Additionally, 1835 participants had baseline cognitive decline. Of the remaining 5362 individuals, 5239 reported baseline height and weight and were included in our analysis. Of these, 4276 (81.6%) were subsequently assessed in wave 2, 3603 (84.2%) in wave 3, and 3028 (84.0%) in wave 4. The NHATS survey protocol was approved by the Johns Hopkins University Institutional Review Board, and all participants provided informed consent.
Measures
Cognitive decline
Cognition in the NHATS was assessed in multiple ways. First, participants (or their proxies) were asked if they had been diagnosed with dementia by a physician. If needed, proxies also completed the AD8, a validated proxy report assessment of dementia. 8 Finally, participants were administered a battery of cognitive tests including the Modified Telephone Interview for Cognitive Status (TICSm) and the Clock-Drawing Test. 9 The TICSm has been validated against a 3- to 4-hour neuropsychiatric interview in the Aging, Demographics, and Memory Study (ADAMS) and found to have a weighted accuracy of 74.1% in correct classification of individuals as having normal cognition, cognitive impairment without dementia, or dementia. 9 The Clock-Drawing Test, a brief test of executive functioning, has been shown to have a mean sensitivity of 85% and a mean specificity of 85% for the diagnosis of dementia. 10 Cognitive decline was defined as the presence of any of the following—(1) a self-report or proxy report of a diagnosis of dementia, (2) a proxy-reported score on the AD8 of ≥2, 8 or (3) a score of ≤1.5 standard deviations below the mean on at least 1 of the following 3 cognitive functioning domains tested with the TICSm and Clock-Drawing Test—orientation, memory, and executive functioning. 11 The NHATS algorithm definitions have been validated against the ADAMS. 11
BMI, WC, and change in BMI and WC
Body mass index is a biometric index used as an indirect measure of adiposity. 12 Self-reported height and weight were available from 5239 community-dwelling respondents at baseline. The BMI was computed by multiplying weight in pounds by 703 and dividing by height in inches squared. Self-reported height and weight is commonly used in epidemiologic studies, 13 -15 and measured BMI has been shown to correlate with BMI calculated based on self-reported height and weight. 16,17 The WC is another indirect measure of adiposity 18 ; WC was available for 4999 participants at baseline. The WC was taken at the level of the umbilicus at the end of exhalation and measured to the nearest quarter inch. Both BMI and WC were used as continuous variables, and we did not use current BMI criteria for obesity since these are controversial in elderly individuals. 19 Additionally, we calculated the percentage change in BMI and WC between each follow-up interval.
Physical performance
The NHATS implemented an extended version of the short physical performance battery (SPPB), evaluating standing balance, walking speed, repeated chair stand scores, grip strength, and peak air flow. Cut points were based on the NHATS sample distribution (mean: 6.7 for 6587 participants). 20
Covariates
All data on covariates of interest in our analyses were obtained from the NHATS interviews of participants and/or their proxies. The interview included questions on demographic and social characteristics, including age, gender, race/ethnicity (white, non-Hispanic; African American, non-Hispanic; Other, non-Hispanic; and Hispanic), marital status, and education. Educational status was collapsed into 2 categories: less than high school or high school graduate and college graduate or beyond. Marital status was dichotomized into married versus unmarried. Participants or their proxies were also asked if they had been diagnosed with any of the following medical conditions: cancer, myocardial infarction (MI), other cardiovascular disease, hypertension, stroke, diabetes, lung disease, osteoarthritis and osteoporosis. Depression and anxiety were assessed using 2 validated screenings questionnaires, the Patient Health Questionnaire-2 (PHQ-2) and the Generalized Anxiety Disorder-2 scale (GAD-2). We used a PHQ-2 score ≥3 to define substantial depressive and a GAD-2 score ≥3 for anxiety symptoms; both questionnaires are validated clinical tools among older adults. 21,22
Statistical Analysis
Characteristics of community-dwelling participants were compared by BMI and WC quartiles using χ2 tests. The Bonferroni test for multiple comparisons was used for post hoc analysis. Participants who developed cognitive decline were also compared to those who did not use χ2 tests. Cox proportional hazards regression was used to estimate the unadjusted and adjusted hazard ratios (HRs) and 95% confidence intervals (CIs) between baseline BMI and WC to onset of cognitive decline; missing data were deleted listwise in Cox regressions. In addition, it has been previously suggested that, after adjusting for WC, BMI represents a measure of lean mass and is inversely associated with visceral fat; conversely, after adjusting for BMI, WC represents a measure of total and especially abdominal or visceral fat. Therefore, we assessed the effect of lean mass by adjusting for WC and looking at BMI, and visceral fat by adjusting for BMI and looking at WC, within our Cox regression model. Additionally, height has been inversely associated with cognitive decline 23 and is included in our models to control for height effect. 24 Cox regression was also stratified by gender and age, the latter split into young elders (aged ≤80 years) and old elders (aged ≥81). For the BMI and WC change-over-time analysis, we defined an increase as a positive change over the study period of greater than 10%, decrease as a negative change of greater than 10%, and stable as between +10% and −10%; the stable category was used as the reference. The time-to-event variable was time from BMI and WC measurement to incident cognitive decline; a survivor was defined as any participant without cognitive decline until diagnosis, if ever. Participants who did not return for follow-up were censored at the age of their last cognitive evaluation and those who died during follow-up were censored at their age of death. Finally, to examine the robustness of our results, we reran all analyses after excluding participants lost in wave 2, because they died (n = 132), changed to a noncommunity setting (nursing home or residential care, n = 66), or were lost in follow-up (n = 765). We adjusted for the covariates mentioned earlier in secondary analysis. To account for the complex sampling design of the NHATS in variance estimation, we used the analytic weights provided by the study investigators. Statistical analyses were conducted using Stata 12 SE version (StataCorp, Texas).
Results
Study Sample Characteristics
Table 1 shows the baseline characteristics of study participants by BMI and WC. In general, participants with higher BMI and WC were more likely to be young elders, male, African American (non-Hispanic), married, with a high school degree or less, and taller. In addition, participants with high BMI and WC were more likely to have a score <6 in the NHATS expanded SPPB and had a higher prevalence of heart disease, hypertension, diabetes, osteoarthritis, depression, and anxiety but a lower prevalence of osteoporosis. High WC was associated with a higher previous stroke and MI prevalence, while high BMI was associated with a higher prevalence of previous MI. Results of the post hoc tests are presented in Supplemental Table 1.
Comparison of Relevant Characteristics Between BMI and WC Quartiles.
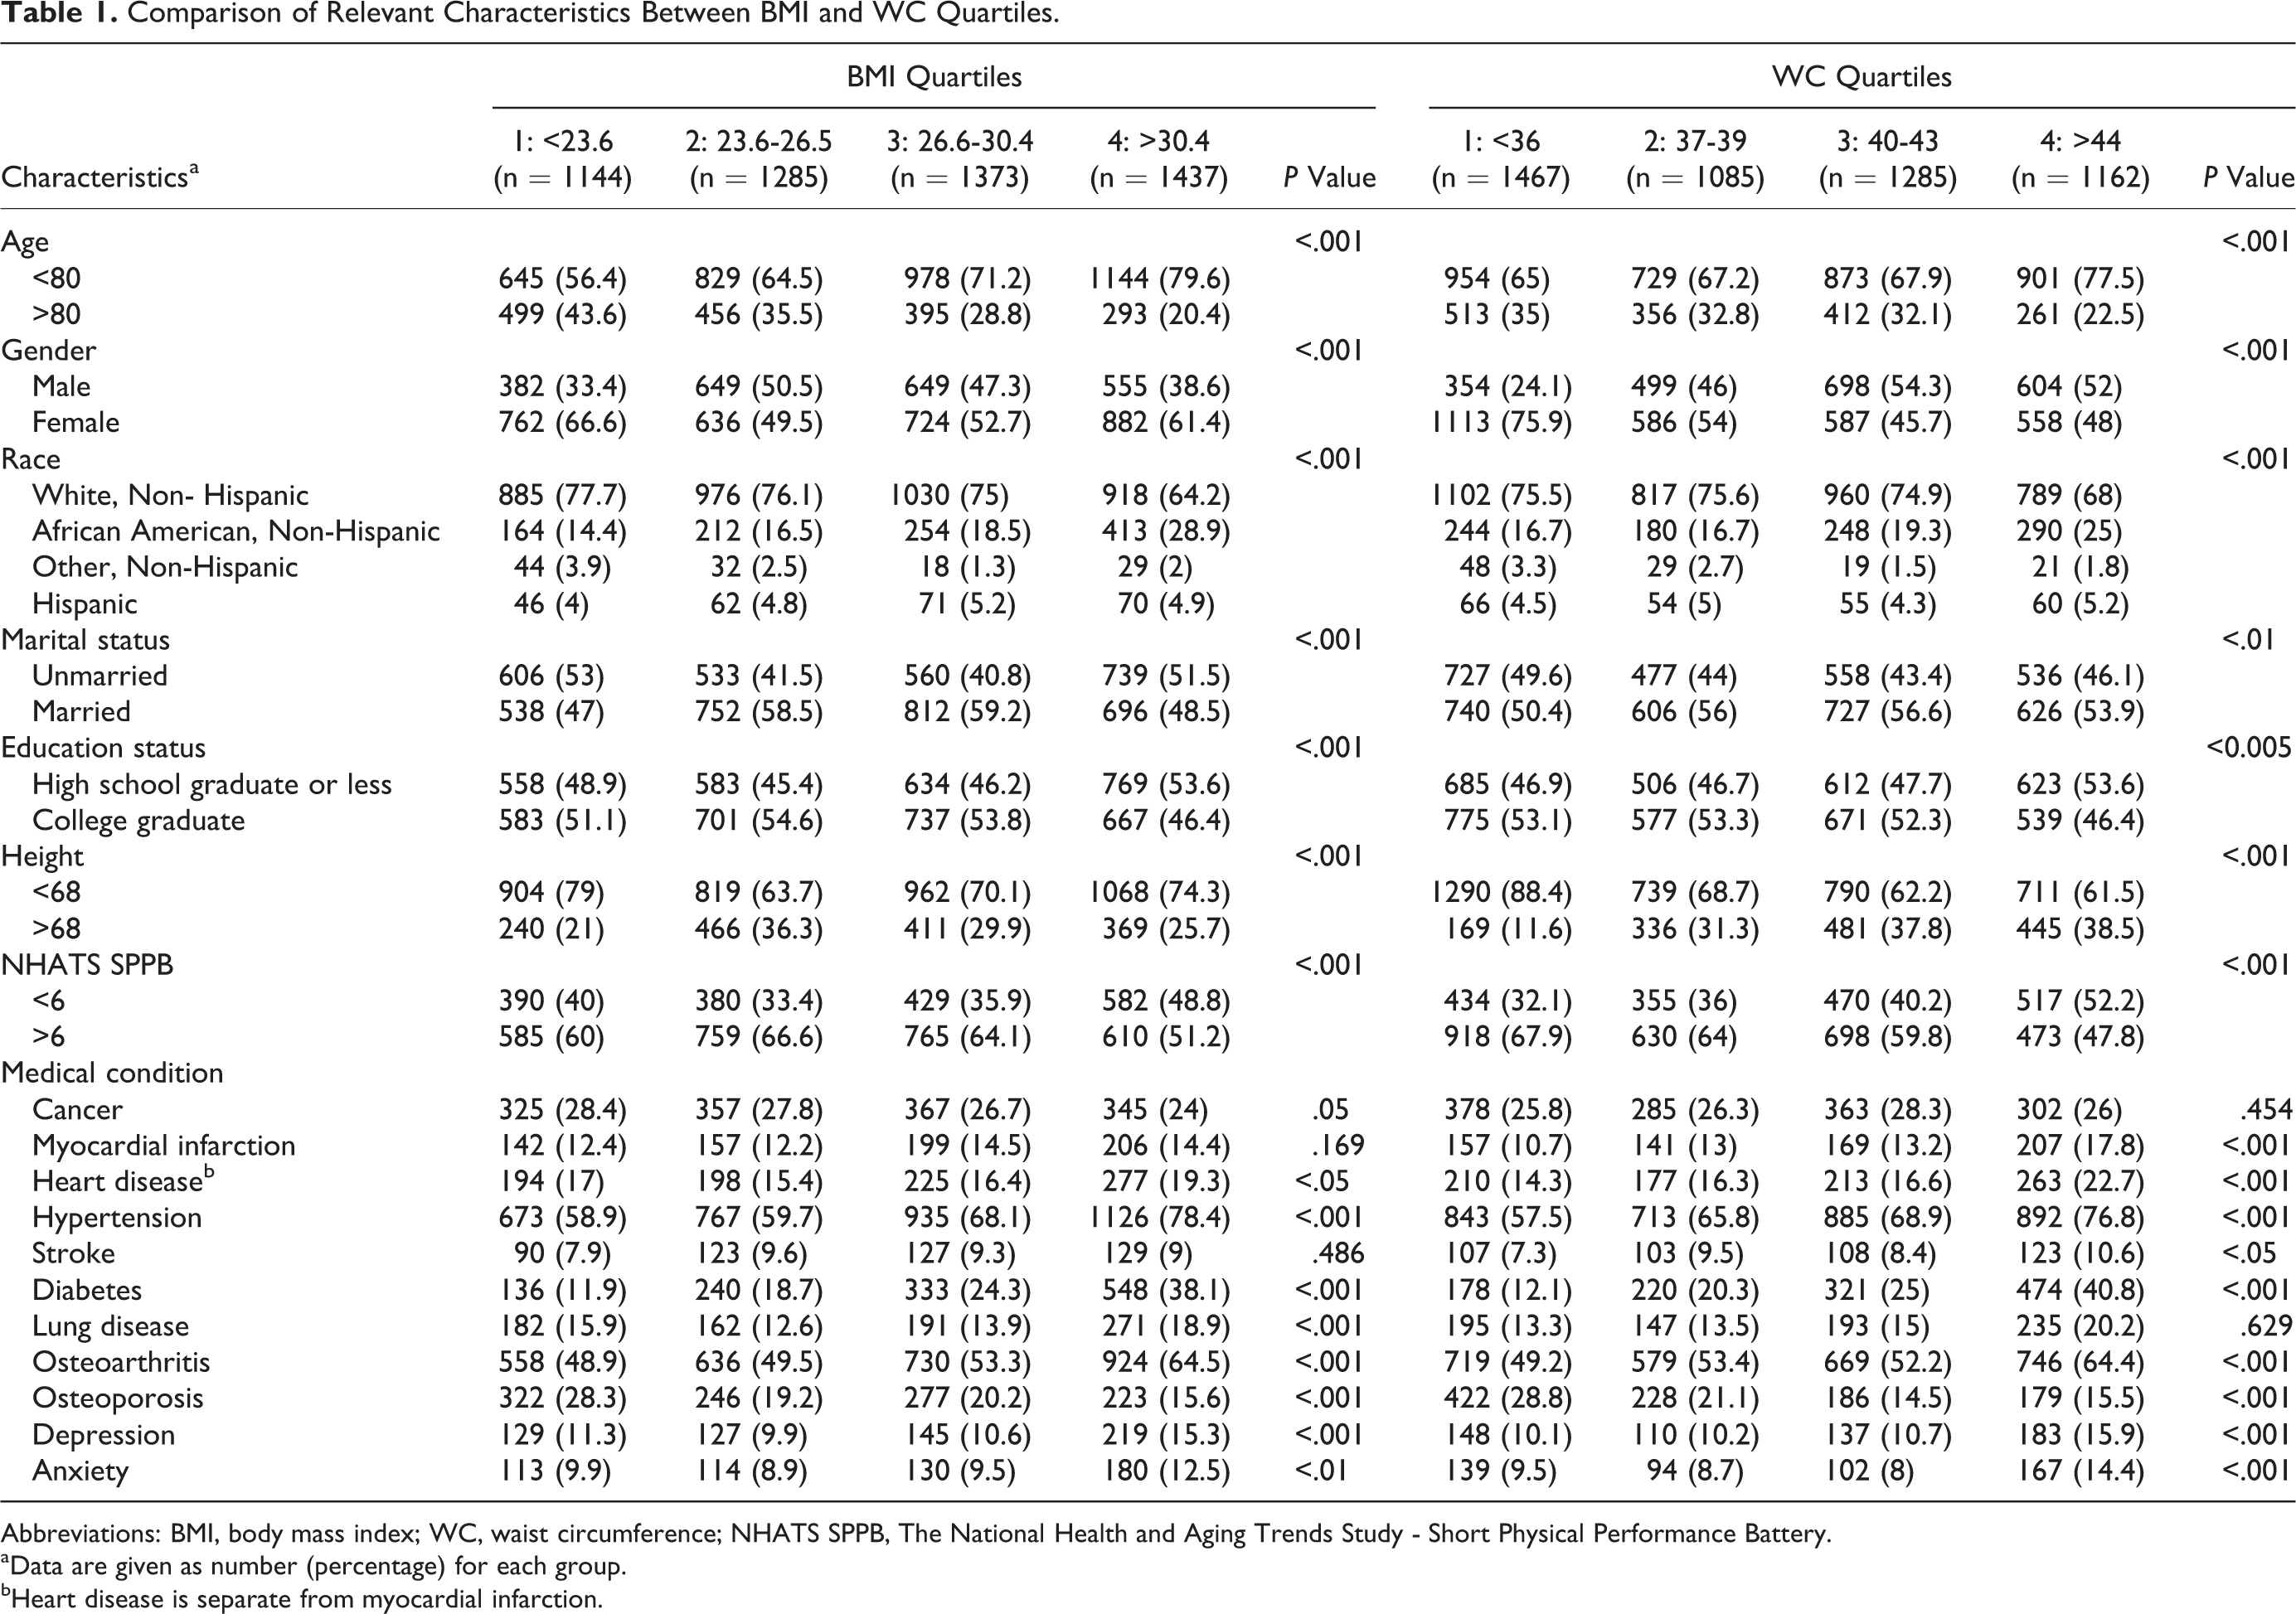
Abbreviations: BMI, body mass index; WC, waist circumference; NHATS SPPB, The National Health and Aging Trends Study - Short Physical Performance Battery.
aData are given as number (percentage) for each group.
bHeart disease is separate from myocardial infarction.
Table 2 compares the 974 participants who developed cognitive decline over the course of the 3-year follow-up period, with those who did not (4265). Participants progressing to cognitive decline were more likely to be older, male, nonwhite, unmarried, and with lower education level. They were also more likely to have a score <6 in the NHATS expanded SPPB and had a greater prevalence of prior MI, prior stroke, diabetes and osteoarthritis, depression, and anxiety.
Comparison of Relevant Characteristics of Nonconverters to Converters.a
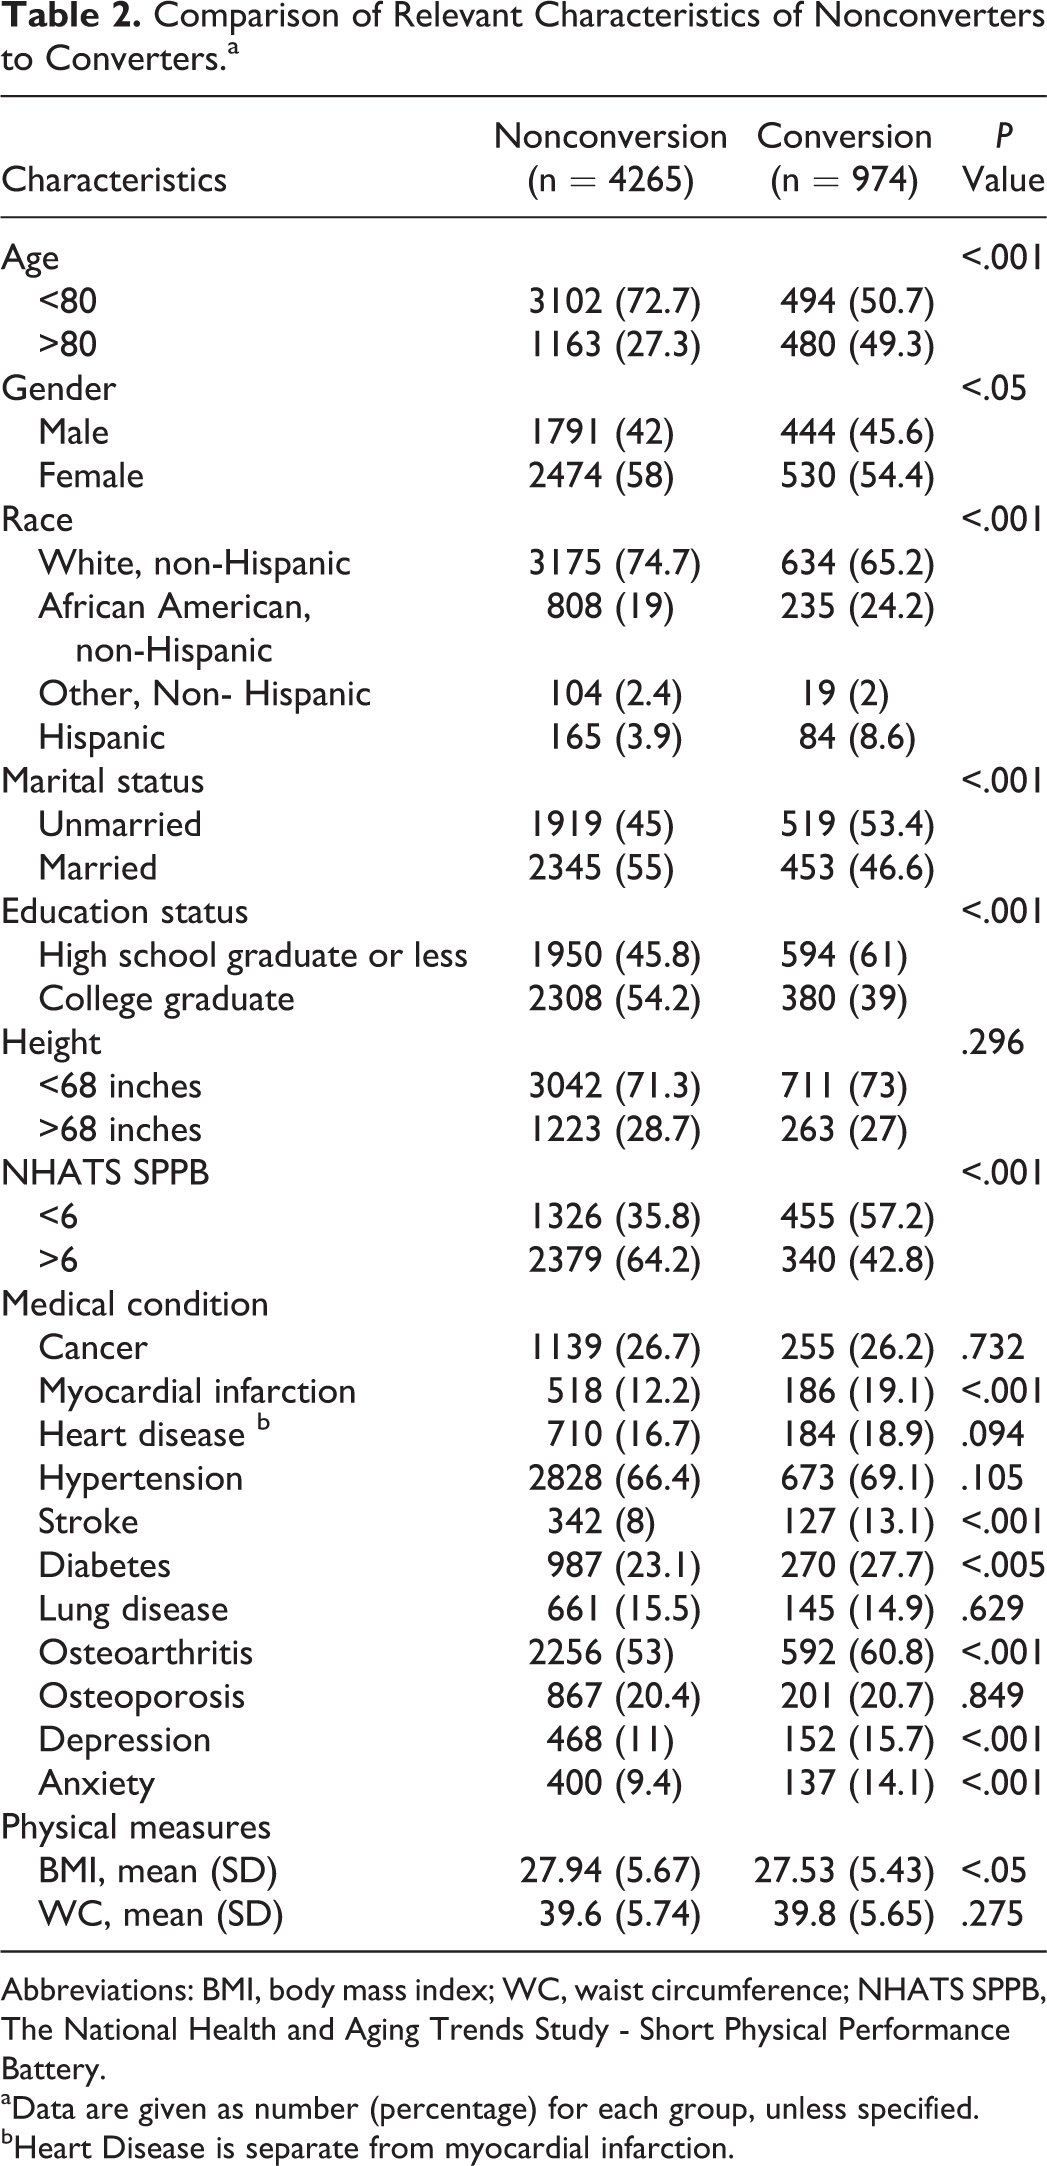
Abbreviations: BMI, body mass index; WC, waist circumference; NHATS SPPB, The National Health and Aging Trends Study - Short Physical Performance Battery.
aData are given as number (percentage) for each group, unless specified.
bHeart Disease is separate from myocardial infarction.
Cognitive Decline and Baseline BMI and WC
Table 3 reports the unadjusted and adjusted HRs of cognitive decline for baseline BMI and WC in the whole sample, stratified by age and gender. Prior to adjustment for covariates, baseline BMI alone as a continuous variable in all participants was associated with an HR of 0.98 (95% CI = 0.97-1.00), indicating a decreased risk of cognitive decline for each unit increase in BMI. Adjusting for WC markedly accentuated the protective effect of BMI (HR 0.93, 0.91-0.95). Conversely, baseline WC alone in all participants was not associated with an altered HR. Following adjustment for BMI, however, WC was associated with a significantly greater risk of cognitive decline (HR 1.07, 1.04-1.09) for each centimeter increase in WC.
Unadjusted and Adjusted Hazard Ratios for BMI and WC as Continuous Variables.
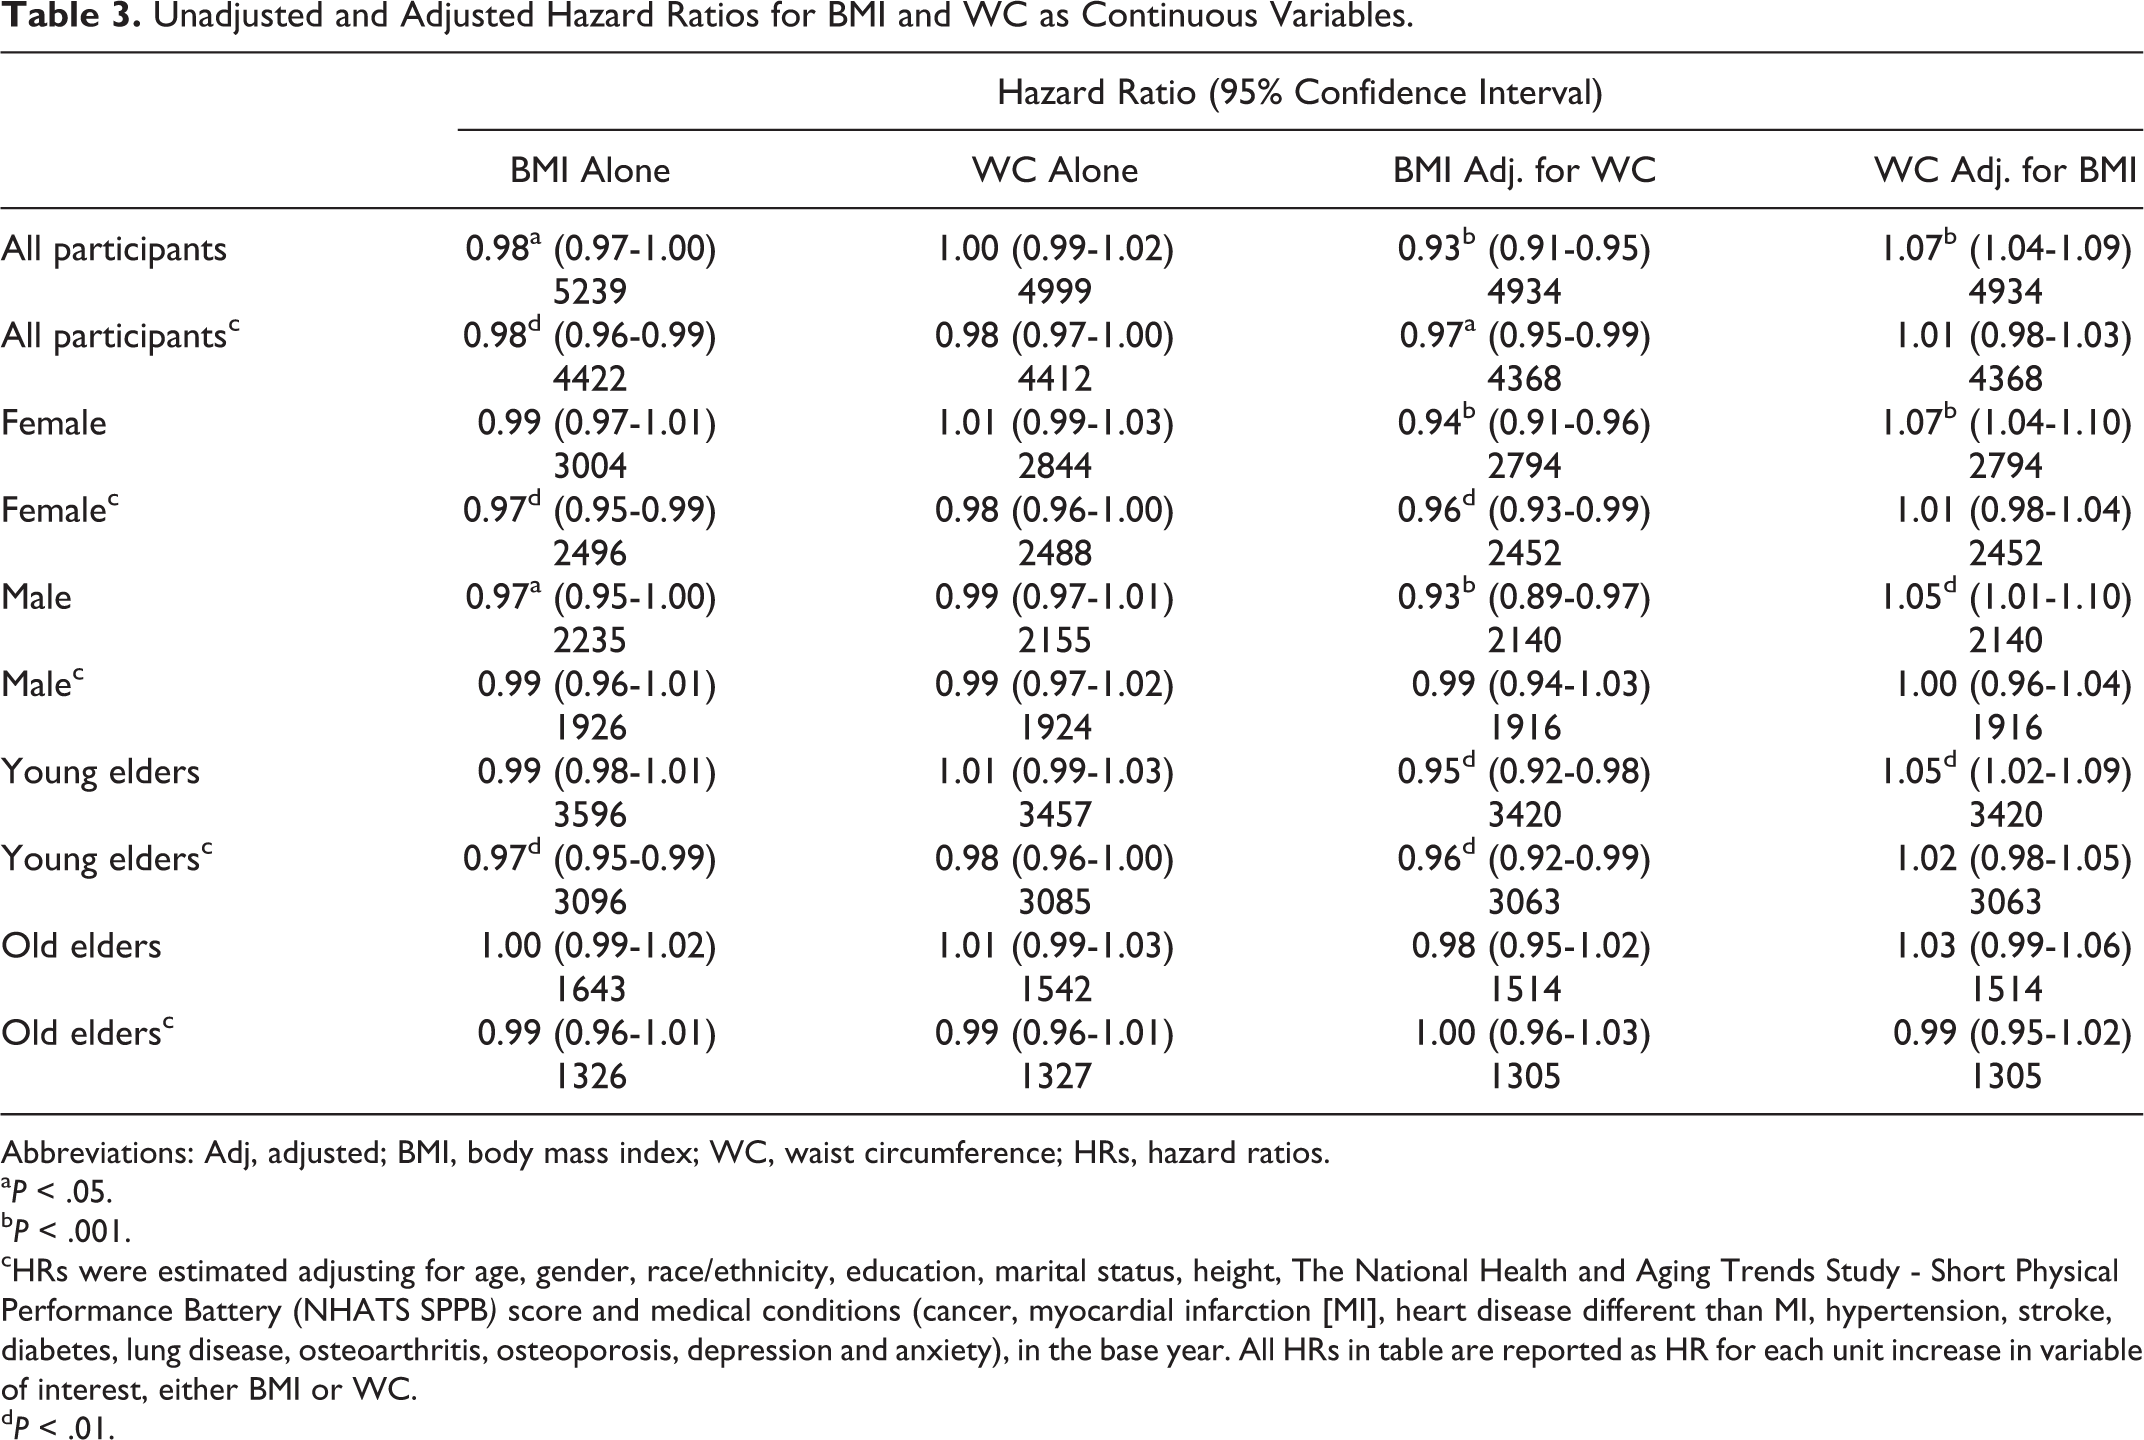
Abbreviations: Adj, adjusted; BMI, body mass index; WC, waist circumference; HRs, hazard ratios.
a P < .05.
b P < .001.
cHRs were estimated adjusting for age, gender, race/ethnicity, education, marital status, height, The National Health and Aging Trends Study - Short Physical Performance Battery (NHATS SPPB) score and medical conditions (cancer, myocardial infarction [MI], heart disease different than MI, hypertension, stroke, diabetes, lung disease, osteoarthritis, osteoporosis, depression and anxiety), in the base year. All HRs in table are reported as HR for each unit increase in variable of interest, either BMI or WC.
d P < .01.
In the full model adjusted for covariates, baseline BMI alone in all participants was again associated with a decreased risk of cognitive decline (HR 0.98, 0.96-0.99); this protective effect was marginally accentuated after adjusting for WC (HR 0.97, 0.95-0.99). On the other hand, both WC alone and WC adjusted for BMI were not associated with an altered risk of cognitive decline in the full model. Finally, stratification of the full model by gender and age revealed the protective effect of BMI alone and BMI adjusted for WC to be present among females and young elders but not male or old elders.
Cognitive Decline and Change in BMI and WC
Analysis of change in BMI and WC over the study period is reported in Table 4, in the whole sample, and stratified by age and gender. While baseline BMI appeared to have a protective effect, both an increase and decrease in BMI or WC of greater than 10% were associated with elevated risk of cognitive decline in the unadjusted model. After adjustment for covariates, a decrease in BMI of >10%, adjusted for WC (HR 1.98, 1.16-3.38), and an increase in WC of >10%, adjusted for BMI (HR 1.30, 1.04-1.62), were significantly associated with elevated risk of cognitive decline.
Unadjusted and Adjusted HRs for BMI and WC Change Over Time.
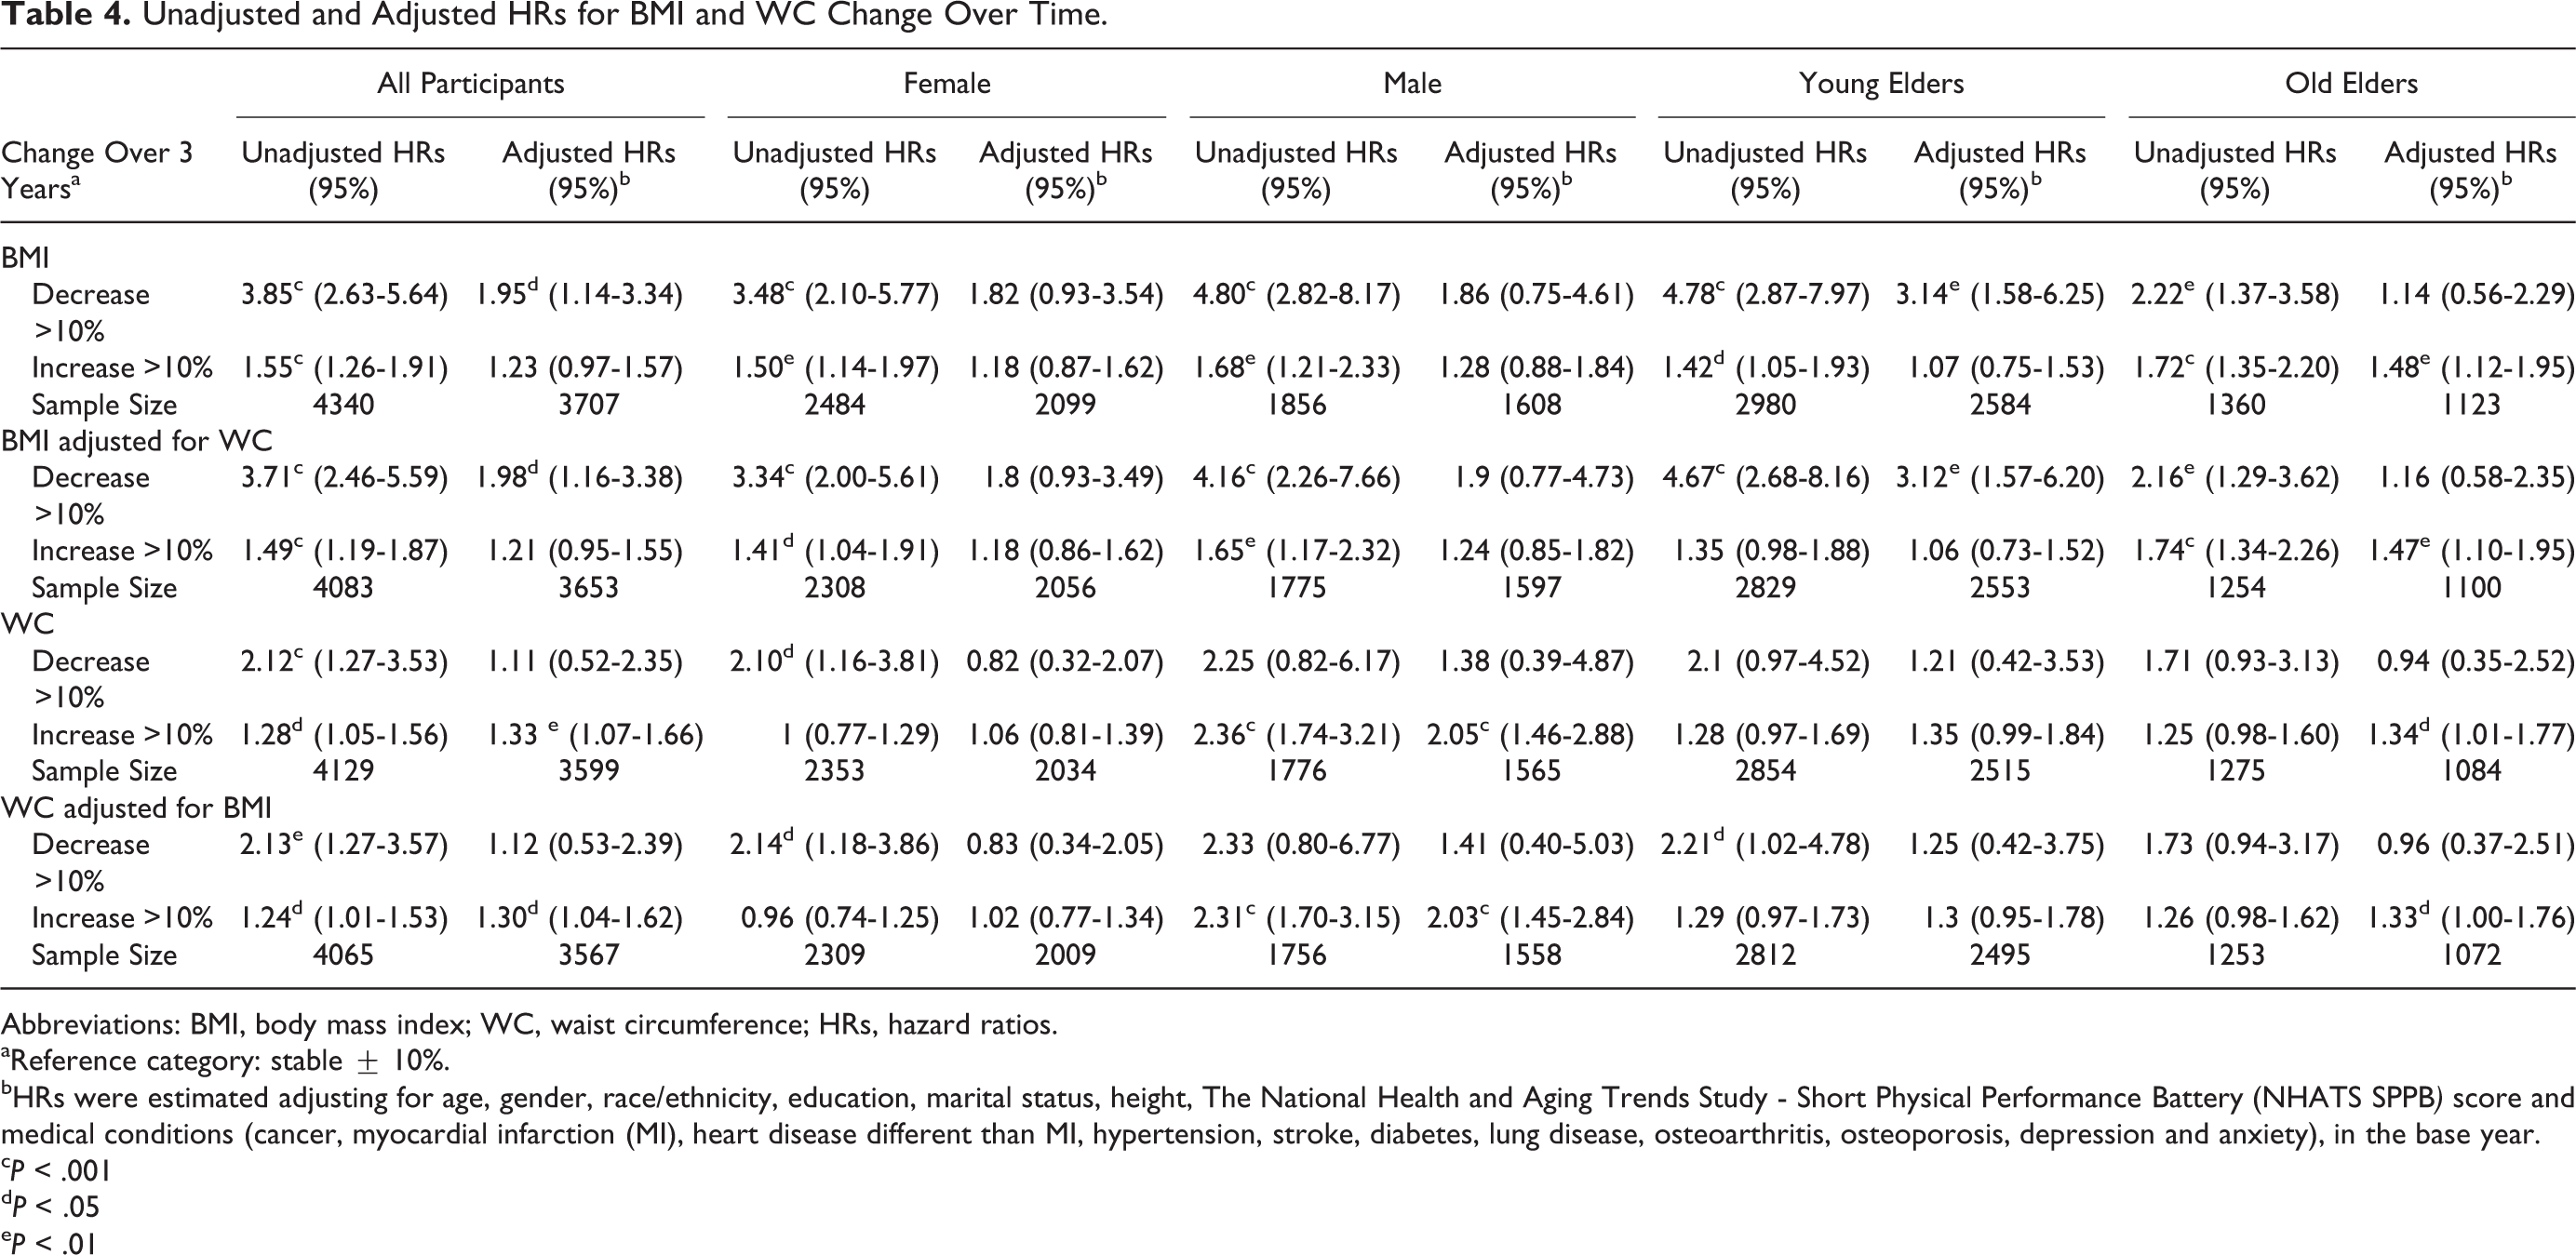
Abbreviations: BMI, body mass index; WC, waist circumference; HRs, hazard ratios.
aReference category: stable ± 10%.
bHRs were estimated adjusting for age, gender, race/ethnicity, education, marital status, height, The National Health and Aging Trends Study - Short Physical Performance Battery (NHATS SPPB) score and medical conditions (cancer, myocardial infarction (MI), heart disease different than MI, hypertension, stroke, diabetes, lung disease, osteoarthritis, osteoporosis, depression and anxiety), in the base year.
c P < .001
d P < .05
e P < .01
Stratification by gender revealed the effect of an increase in WC of >10%, adjusted for BMI, to be limited to males who were at an elevated risk of cognitive decline (HR 2.03, 1.45-2.84). Stratification by age revealed decrease in BMI of >10%, adjusted for WC, to be associated with substantially higher risk of cognitive decline in young elders (HR 3.12, 1.57-6.20) but not old elders. Conversely, old elders who had an increase in BMI of >10%, adjusted for WC, had a moderately increased risk of cognitive decline (HR 1.47, 1.10-1.95) but not young elders.
Sensitivity Analysis
We reran all analyses after the exclusion of participants lost in wave 2 because they moved to a noncommunity setting (nursing home or residential care, n = 66), died (n = 132), or were lost in follow-up (n = 765). Results remained unchanged except that the effect of an increase in WC of >10% for old elders was no longer significant (HR 1.30, 0.98-1.73); these results are shown in Supplemental Tables 2 and 3.
Discussion
This study examines the relationship between BMI and WC and the risk of developing cognitive decline over 4 years in a nationally representative sample of 5239 community-dwelling elders ≥65 years old from the NHATS without baseline dementia or cognitive impairment. The use of NHATS provided several advantages: a large, nationally representative sample of older adults; use of comprehensive, validated tests of cognitive and executive function to determine cognitive decline; repeat measurement of BMI and WC; and collection of demographic, comorbid condition, and physical performance data.
Our analysis of BMI and cognitive decline showed, after adjustment for demographic and comorbid condition covariates as well as for WC, an HR of 0.97 (0.95-0.99) for every unit increase in BMI. Our results are concordant with a previous study utilizing the Cardiovascular Health Study (CHS), a multisite study of 4 US communities, which reported an HR of 0.95 (0.92-0.98) per unit BMI 25 as well as a previous study in a Finnish community (HR 0.92, 0.87-0.97). 26
We also found that WC, after adjusting for BMI alone, was associated with an elevated risk of cognitive decline, with an HR of 1.07 (1.04-1.09) per cm increase in WC. However, after adjustment for demographic, comorbid condition and physical performance covariates, this effect was diminished and was no longer significant, similar to results from the CHS. 25 A possible explanation for this is that the effect of WC after adjusting for BMI, which reflects primarily body fat and especially visceral adipose tissue, 27 is primarily explainable through covariates such as comorbid conditions and demographics that are adjusted for in the full model. Along these lines, we found that WC but not BMI was significantly associated with prior stroke and MI, conditions which were themselves highly associated with a greater risk of developing cognitive decline in our cohort.
It has been suggested by previous studies that, after correction for WC, BMI largely reflects lean mass and is inversely related to body fat. 6,27 Conversely, WC adjusted for BMI may largely reflect body fat, especially visceral adipose tissue. 6,27 Therefore, our results suggest higher lean mass to be associated with a lower risk of cognitive decline, even after taking into account demographics, comorbid conditions, and physical function. At the same time, the results of our unadjusted model suggest WC adjusted for BMI, reflecting central adiposity, to be associated overall with a greater risk of cognitive decline but not after taking these covariates into account. Importantly, our results also showed a decrease over time in lean mass to be associated with a substantially elevated risk of cognitive decline, while an increase in WC adjusted for BMI was associated with a moderately increased risk.
Although our work needs to be confirmed in a study using direct measures of adiposity, our findings are consistent with previous work by Nourhashémi et al using dual-energy X-ray absorptiometry to measure adiposity; this study also found lower lean mass to be associated with cognitive impairment in late life. 28 Another study by Burns et al similarly showed that loss of lean mass was present in early or preclinical Alzheimer disease and was associated with decreased brain volumes. 29 At the same time, high central obesity has been associated with late life dementia. 5,30,31 Patients with Alzheimer disease having mild to moderate cognitive impairment were shown to have both low lean mass and high fat mass in 1 study; of note, this same study also reported an accentuated effect of decreased lean mass among women, a finding which we echo. 32 Although both lean mass and fat mass have been previously shown to be markers of dementia, our results, in line with some previous studies, 28,29 seem to suggest lean mass to be a better predictor for risk of cognitive decline than fat mass.
Of note, after stratification of our fully adjusted models, our results indicated lean mass to have a protective effect in females and young elders. While these findings require further study and confirmation, one possible explanation for the observed gender difference may be that females have a lower physiological reserve of lean mass overall, thus accentuating the effect of any decrease in this reserve. 33,34 Another hypothesis may be that differences in hormonal influences on cognition during aging, especially estrogen levels, may help explain this gender difference. 35 Lean mass may be particularly important among aging females in preserving estrogen levels and preventing cognitive decline. 36 Regarding the differences between young and old elders, a possible explanation is that lean mass is particularly important in determining risk of earlier onset dementia in young elders; similar results were recently obtained in another US cohort. 29 Few studies have looked at the effect of body mass on dementia in elders >80 years. Our finding that in this age-group, a gain of BMI or WC—both were associated with elevated dementia risk, while decreases in BMI or WC had neutral effects, was surprising. This finding highlights the importance of stratifying by age in studies of BMI and dementia and suggests that old elders should be considered as a separate population than the larger majority of elders younger than 80. Physiologically, old elders may have undergone a greater degree of skeletal muscle atrophy and a concomitant replacement with fat and connective tissue; furthermore, old elders may have a decreased ability to gain lean mass, and thus any increase in mass and BMI, regardless of waist circumference, among old elders may be disproportionately composed of fat. 37,38 Other clinical measures, such as muscle strength and functional testing, may ultimately represent more informative markers in old elders. 39
It has been shown previously that elders who lose weight are predisposed to cognitive decline, 14,25,40 which may be due to sarcopenia, 41 hormonal factors, 42 or may reflect a prodromal phase of dementia, 43 which has been associated with altered eating behavior, decreased appetite, change in food choices, and decreased olfactory function. 44 At the same time, a high WC may reflect low physical activity or poor mobility, 45 leading to sedentarism and sarcopenia as well as an increase in vascular risk factors for cognitive decline. 46,47 From a pathophysiologic perspective, it is possible that low lean mass and high visceral fat share some common mechanisms in relation to cognitive decline 48 ; for example, particular interest has been given to inflammatory and metabolic abnormalities associated with both low lean mass and high visceral fat, specifically in relation to insulin and interleukin 6. 49 -54 In addition, in both cases it is plausible that a decrease in physical activity precedes and contributes to cognitive decline; for example, the recent concept of motoric cognitive risk (MCR) describes a predementia syndrome involving slowed gait and cognitive complaints. 55 It is also possible that reverse causation is true, and cognitive decline in the late life impairs planning and control of movement, leading to physical decline and loss of lean mass and/or gain of central fat. 56 However, we attempted to account for reverse causation by relating baseline BMI, WC, and physical function, as well as change in BMI and WC over time, in elders without prior cognitive dysfunction to future risk of cognitive decline. Our findings demonstrated an association between increased risk of cognitive decline and low baseline NHATS SPPS score, implying that early screening for poor physical function may be an appropriate tool for distinguishing those at risk, especially in old elders
Thus, in line with previous studies of physical activity and cognitive decline, 57,58 our results indicate that a multidomain approach promoting lean mass through exercise and diet may be effective in maintaining cognitive function and reducing cognitive decline. 59,60
To our knowledge, this study is the first to examine the relationship between late life BMI, WC, change in BMI and WC, and incident all-cause cognitive decline in a community-dwelling nationally representative sample within the United States. One of the strengths of the NHATS is the relatively high response rates across multiple rounds of data collection. The response rates of our cohort were greater than 80%. Nevertheless, selective attrition may have occurred which may have introduced bias to our results; individuals who were more ill at baseline or who developed serious illness during the study may have been more likely to drop out.
The current study has the following limitations: First, BMI was derived from self-reported height and weight, which might be subject to error and bias; however, measured BMI has shown to correlate with self-reported BMI. 16,17 Second, the comorbid health conditions variable was limited to self-report and were not validated through medical record review. While the wording of the NHATS data instrument asked respondents to report medical conditions diagnosed by a physician, nevertheless self-report of medical conditions may have led to underreporting, due to misremembering, minimizing, or due to limited understanding of their medical history; thus, some of the effect of comorbid conditions may not have been captured in our models. Third, direct measures of body adiposity and lean mass were not assessed in NHATS, and further studies utilizing more direct methods of measurement are warranted.
Clinicians should be sensitive to our finding that a BMI decrease in elderly individuals <80 years of age predicts a substantially elevated risk of cognitive decline and that females may be particularly sensitive to decreases in lean mass. Overall, our findings support an approach wherein BMI and lean mass maintenance in elders <80 years of age should be encouraged; furthermore, exercise leading to reduction in WC may prove a beneficial approach in decreasing risk of cognitive decline, particularly among men. Our study also raises awareness regarding the impact of BMI and WC together in association with cognitive decline and suggests that both should be measured in the clinical setting. In addition, we stress the need to avoid any considerable lag time in transmitting these findings to health-care professionals, in order to have a more immediate impact on the recognition and prevention of cognitive decline. Finally, the results of this article highlight the importance of taking age and gender into account when investigating the association between BMI, WC, and cognitive decline as well as the utility of using BMI adjusted for WC, and WC adjusted for BMI as measures of lean mass and fat mass, respectively, in this context.
Footnotes
Declaration of Conflicting Interests
The author(s) declared no potential conflicts of interest with respect to the research, authorship, and/or publication of this article.
Funding
The author(s) received no financial support for the research, authorship, and/or publication of this article.
References
Supplementary Material
Please find the following supplemental material available below.
For Open Access articles published under a Creative Commons License, all supplemental material carries the same license as the article it is associated with.
For non-Open Access articles published, all supplemental material carries a non-exclusive license, and permission requests for re-use of supplemental material or any part of supplemental material shall be sent directly to the copyright owner as specified in the copyright notice associated with the article.