
Abstract
Purpose
This study examined relations between four late-life depression subgroups (recent, >2 years ago, chronic, no depression) and regional brain volumes using structural MRI data from the National Alzheimer’s Coordinating Center (n=1,551).
Data Analysis
Multiple linear regressions evaluated the effects of depression on 30 MRI biomarkers, while moderation analyses assessed how APOE ε4 and depression shape the connections between cognitive status and brain structure volumes.
Results
After adjusting for covariates and applying Hochberg’s method, recent depression (< 2 years) was associated with reduced total cerebrum cranial volume and left frontal lobe cortical gray matter volume. Chronic depression correlated with larger right lateral ventricle volume.
Conclusion
These findings suggest that recent depression is linked to brain atrophy across specific regions and ventricular enlargement. Future research should investigate age-related impacts on these associations and whether restoration of brain volume occurs after depressive symptoms subside.
Introduction
Depression is a mood disorder with symptoms including loss of pleasure in usually enjoyable activities, fluctuations in weight and appetite, insomnia or hypersomnia, psychomotor changes, such as restlessness or tension, and loss of energy, and potential feelings of hopelessness among other negative thought patterns. 1 Late-life depression (LLD) has been linked to a greater risk of Alzheimer’s disease (AD), 2 but whether it represents a prodromal symptom, a contributing factor, or both remains uncertain 3 due to questions of reverse causation. 4 Studies indicate that between 8% and 16% of older adults experience depression, 5 so it is critical to clarify the role of depression in late-onset AD to inform potential clinical interventions and reduce the profound human and financial costs associated with the disease. Existing evidence suggests that the pathogenesis of major depression involves inflammatory processes and neural-immune activity, which generate serotonergic and adrenocortical interactions. Increased levels of proinflammatory cytokines and other inflammatory biomarkers have been detected in individuals with depression. 6
External or environmental stress may contribute to effects on major pathophysiological pathways of depression by introducing stressors that contribute to inflammatory processes, resulting in neurodegeneration and impeding neurogenesis. 7 As a result, psychosocial factors, such as appropriate or inappropriate reactions to stressful situations, impact the inflammatory system by increasing the level of proinflammatory cytokines. 6 Researchers have hypothesized that depressive symptoms in older adulthood may be linked to AD through a mechanism affecting hippocampus volume.4,8 In addition, some have hypothesized that factors that affect the hypothalamic-pituitary-adrenal (HPA) axis, the presence of certain apolipoprotein (APOE) ε4 alleles, and damaging cortisol levels may be responsible for increased AD risk, but the exact causal mechanisms remain under study. 9
The APOE ε4 allele is a known risk factor for AD. 10 Individuals with APOE ε4 (ε4 carriers) have abnormal metabolic patterns within regions of the brain that are susceptible to the development of AD manifestations prior to experiencing memory loss. 11 Memory loss can start as early as late middle age for these individuals.12,13 Approximately 20% of individuals in North America and Europe are APOE ε4 carriers. 14 Meanwhile, of the three APOE alleles, APOE ε2 has been most strongly correlated with depression in one meta-analysis, 15 while a larger follow-up meta-analysis 16 determined that while ε2/ε3 resulted in an odds ratio (OR) of 0.76 compared to ε3/ε3. The results were ethnicity and age-specific; however, the presence of an ε2 allele provided protection in White non-Hispanic, but not in Asian samples, and in older adults, the ε3/ε4 genotype appeared to confer an increased risk of LLD. Despite associations with depression, APOE ε2 is considered to be protective with respect to AD. 17 The increase in the risk of AD with the ε4 allele and the decreased risk with the ε2 allele are in relation to the risk of AD in people homozygous for the most common allele, APOE ε3. 18 By contrast, our previous work 19 found that ε3 presented a statistically significantly greater hazard of future AD development among those with depression and/or sleep disturbance. Finally, it has also been reported that APOE ε4 has an impact on hippocampal atrophy. 20
Vascular contributions to LLD have also long been suspected by researchers, who identified correlations between cerebrovascular disease (CVD) and stroke, including previously undetected ‘silent’ strokes and depressive symptoms in the 1990s. 21 CVD and stroke pathophysiology may contribute increased vulnerability to depression in older adults; above a threshold, changes to the vasculature, including the presence of ischemic brain lesions, may exhibit a direct effect on brain tissue/function that contributes to depressive symptomology. 22 In addition to inflammation that occurs as part of aging and CVD processes and promotes pro-inflammatory changes in immune activity, white matter lesions (appearing as white matter hyperintensities in scans) may disrupt neural connectivity in fronto-subcortical-limbic regions, affecting mood and cognition. 23 Studies have also identified reductions in cerebral blood flow, indicating impaired perfusion and cerebrovascular autoregulation deficits; white matter hyperintensities may serve as a biomarker of this vascular dysregulation. 22 However, outcomes from a recent analysis of data from the Harvard Aging Brain Study, Alzheimer’s Disease Neuroimaging Initiative (ADNI), and Dominantly Inherited Alzheimer Network (DIAN) found that after adjusting for age, gray matter volume, cerebral microbleeds, and amyloid burden, no significant association was found with systemic vascular risk. Rather, WMH were linked to parenchymal and vessel amyloidosis – a specific aspect of AD’s pathophysiological process – as well as gray matter reductions. 24
While some studies have indicated that AD-prone areas of the brain are not influenced by factors such as psychological states, other studies suggest that this is not the case, including those exploring if, and how much, depression affects hippocampal volume. In one study, a depression diagnosis (n = 248, >60 years) predicted a decrease in right hippocampal volume within four years. 25 An meta-analysis of 12 studies found that the total number of depressive episodes correlated significantly with reduced right (but not left) hippocampal volume. 26 Du et al.’s 27 meta-analysis found significant grey matter reductions in the right lentiform nucleus, which extended into the parahippocampus, hippocampus, and amygdala, as well as in the bilateral medial frontal gyrus and the right subcallosal gyrus. Gray matter atrophy in depressed older adults has also been observed outside of well-documented AD-prone areas, but these results have not been consistent. Sexton and colleagues 28 conducted a meta-analysis and noted that frontal atrophy in older adults with a history of depression had been identified elsewhere using ROI (region of interest) methodology29-32 as well as voxel-based morphometry.33-35 Gray matter volume differences have been observed in parietal,35,36 temporal, 36 amygdalar, 34 and thalamic regions, 36 and the caudate36,37 and putamen, 37 while other studies identified no such differences.38,39 Sexton et al. 28 suggested that methodological differences may have contributed to the variety of results: sample sizes were frequently small (and ROI studies often examined fewer than three regions), study populations varied, and data collection and analysis methods were different.
In our study, we sought to investigate the influence of depression on regional brain volumes using data from the National Alzheimer’s Coordinating Center (NACC), which allowed for the use of a large, well-powered sample to evaluate 30 regional MRI biomarkers in older adults who had experienced depression recently (<2 yrs), more than 2 years ago (>2 yrs prior), or chronically (<2 yrs and >2 yrs) compared to healthy controls. Given the links between APOE genotype and AD, our study also sought to determine the effect of depression on regional brain volumes by cognitive and APOE ε4 status.
Methods
Using data acquired by NACC from June 2005 to June 2019, we conducted a cross-sectional secondary analysis of the NACC Uniform Data Set (UDS), using complete structural imaging data from over 1500 participants. The sample included participants reporting a history of depression (>2 yrs ago; n = 101), recent depression (<2 yrs; n = 173), chronic depression (<2 years and >2 years; n = 183), and no depression (n = 1094). Initiated in 2005, the NACC UDS is a longitudinal dataset comprised of data collected from approximately yearly assessments from participants in the National Institute on Aging-funded Alzheimer’s Disease Research Centers (ADRCs) across the country. 40 The participants are voluntary or referral-based and, as a result, are not a nationally representative sample.
UDS data were collected by trained clinicians and personnel using standardized evaluations and uniform methods for each study subject. Participants were required to be accompanied by a knowledgeable ‘study partner,’ whom were most often a family member or close friend with significant weekly contact with the study participant. 40 The UDS incorporates longitudinal demographics, family and health history, clinical, neuropsychological evaluations, and diagnostic data, including medications. 41
Depression Status
Depression status was assessed during a medical interview with the participant and their co-participant. Active depression in the prior 2 years and depressive episodes more than 2 years ago were recorded in a binary fashion (yes/no) if they had been diagnosed or treated by a physician. The depression status was then categorized into four groups: depression >2 years ago (depression episodes occurring more than 2 years ago = yes), recent depression (active depression in the prior 2 years = yes), chronic depression (both = yes), and no depression (both = no).
Structural MRI Biomarkers
We examined correlations between recent (<2 yrs), prior history of depression (>2 yrs), chronic (<2 years and >2 years), and no depression and structural MRI biomarkers, including total brain volume, total gray matter volume, white matter volume excluding white matter hyperintensities (WMH), WMH volume, hippocampal volume, frontal, occipital, parietal, and temporal lobe volumes, and frontal lobe white matter volume. Imaging data were voluntarily submitted to NACC from a subset of ADRCs, are considered a convenience sample, and predate the Standardized Centralized Alzheimer’s & Related Dementias Neuroimaging (SCAN) initiative. As such, the protocols for imaging varied by ADRC and include T1-weighted, FLAIR, DTI, T2, or other sequence types. Volumetric summary data for these regions were obtained from NACC, while the IDeA Lab performed the calculations (Director: Charles DeCarli, MD; University of California, Davis; https://idealab.ucdavis.edu/), following Alzheimer’s Disease Neuroimaging Initiative
Cognitive Status
Each ADRC determines the cognitive status of its respective participants at the local level using guidelines set forth by the 2011 National Institute on Aging-Alzheimer’s Association (NIA-AA).41,44 There are four cognitive status categories, including (1) normal cognition, (2) impaired not MCI (which is defined as participants who are cognitively impaired based upon their neuropsychological assessment, but this impairment does not rise to the definition of MCI set forth by NIA-AA, (3) MCI, and (4) dementia. 42
Apolipoprotein E
APOE genotype was determined independently by each ADRC, the Alzheimer’s Disease Genetics Consortium (ADGC), or the National Centralized Repository for Alzheimer’s Disease and Related Dementias (NCRAD). The samples were obtained from ADRC participants using either a buccal swab or a blood draw. Data for all six possible genotypes were available from NACC (ε2/ε2, ε2/ε3, ε2/ε4, ε3/ε3, ε3/ε4, or ε4/ε4). For the analyses in the current study, the genotypes were collapsed into ε4 carriers (ε2/ε4, ε3/ε4, and ε4/ε4) or non-ε4 carriers (ε2/ε2, ε2/ε3, ε3/ε3).
Statistical Analyses
Descriptive analyses were used to calculate the mean and standard deviation for continuous variables, and frequency distribution for categorical variables. We compared participants across four depression status groups. We used the one-way ANOVA for continuous variables, the chi-square test, and Fisher’s exact test for categorical variables. Multiple linear regressions were used to estimate the adjusted effect of depression status on the MRI volumetric variables. The control variables were intracranial volume, age, sex, years of education, race, and Hispanic ethnicity. The moderation effect of APOE ε4 on the association between the MRI volumetric variables and depression status was explored by testing the interaction effect between APOE ε4 and depression status in the multiple linear regressions. The moderation effect of depression status was also examined on the association between the MRI volumetric variables and cognitive status by testing the interaction effect between depression status and cognitive status. Participants with normal cognition were the reference group. Hochberg’s 45 method was employed to adjust the P-values for multiple comparisons. The 0.05 level of significance was used to determine statistical significance. All analyses were conducted in SAS 9.4. 46
Results
Participant Demographics
Demographic Composition for Participants by Depression Status.
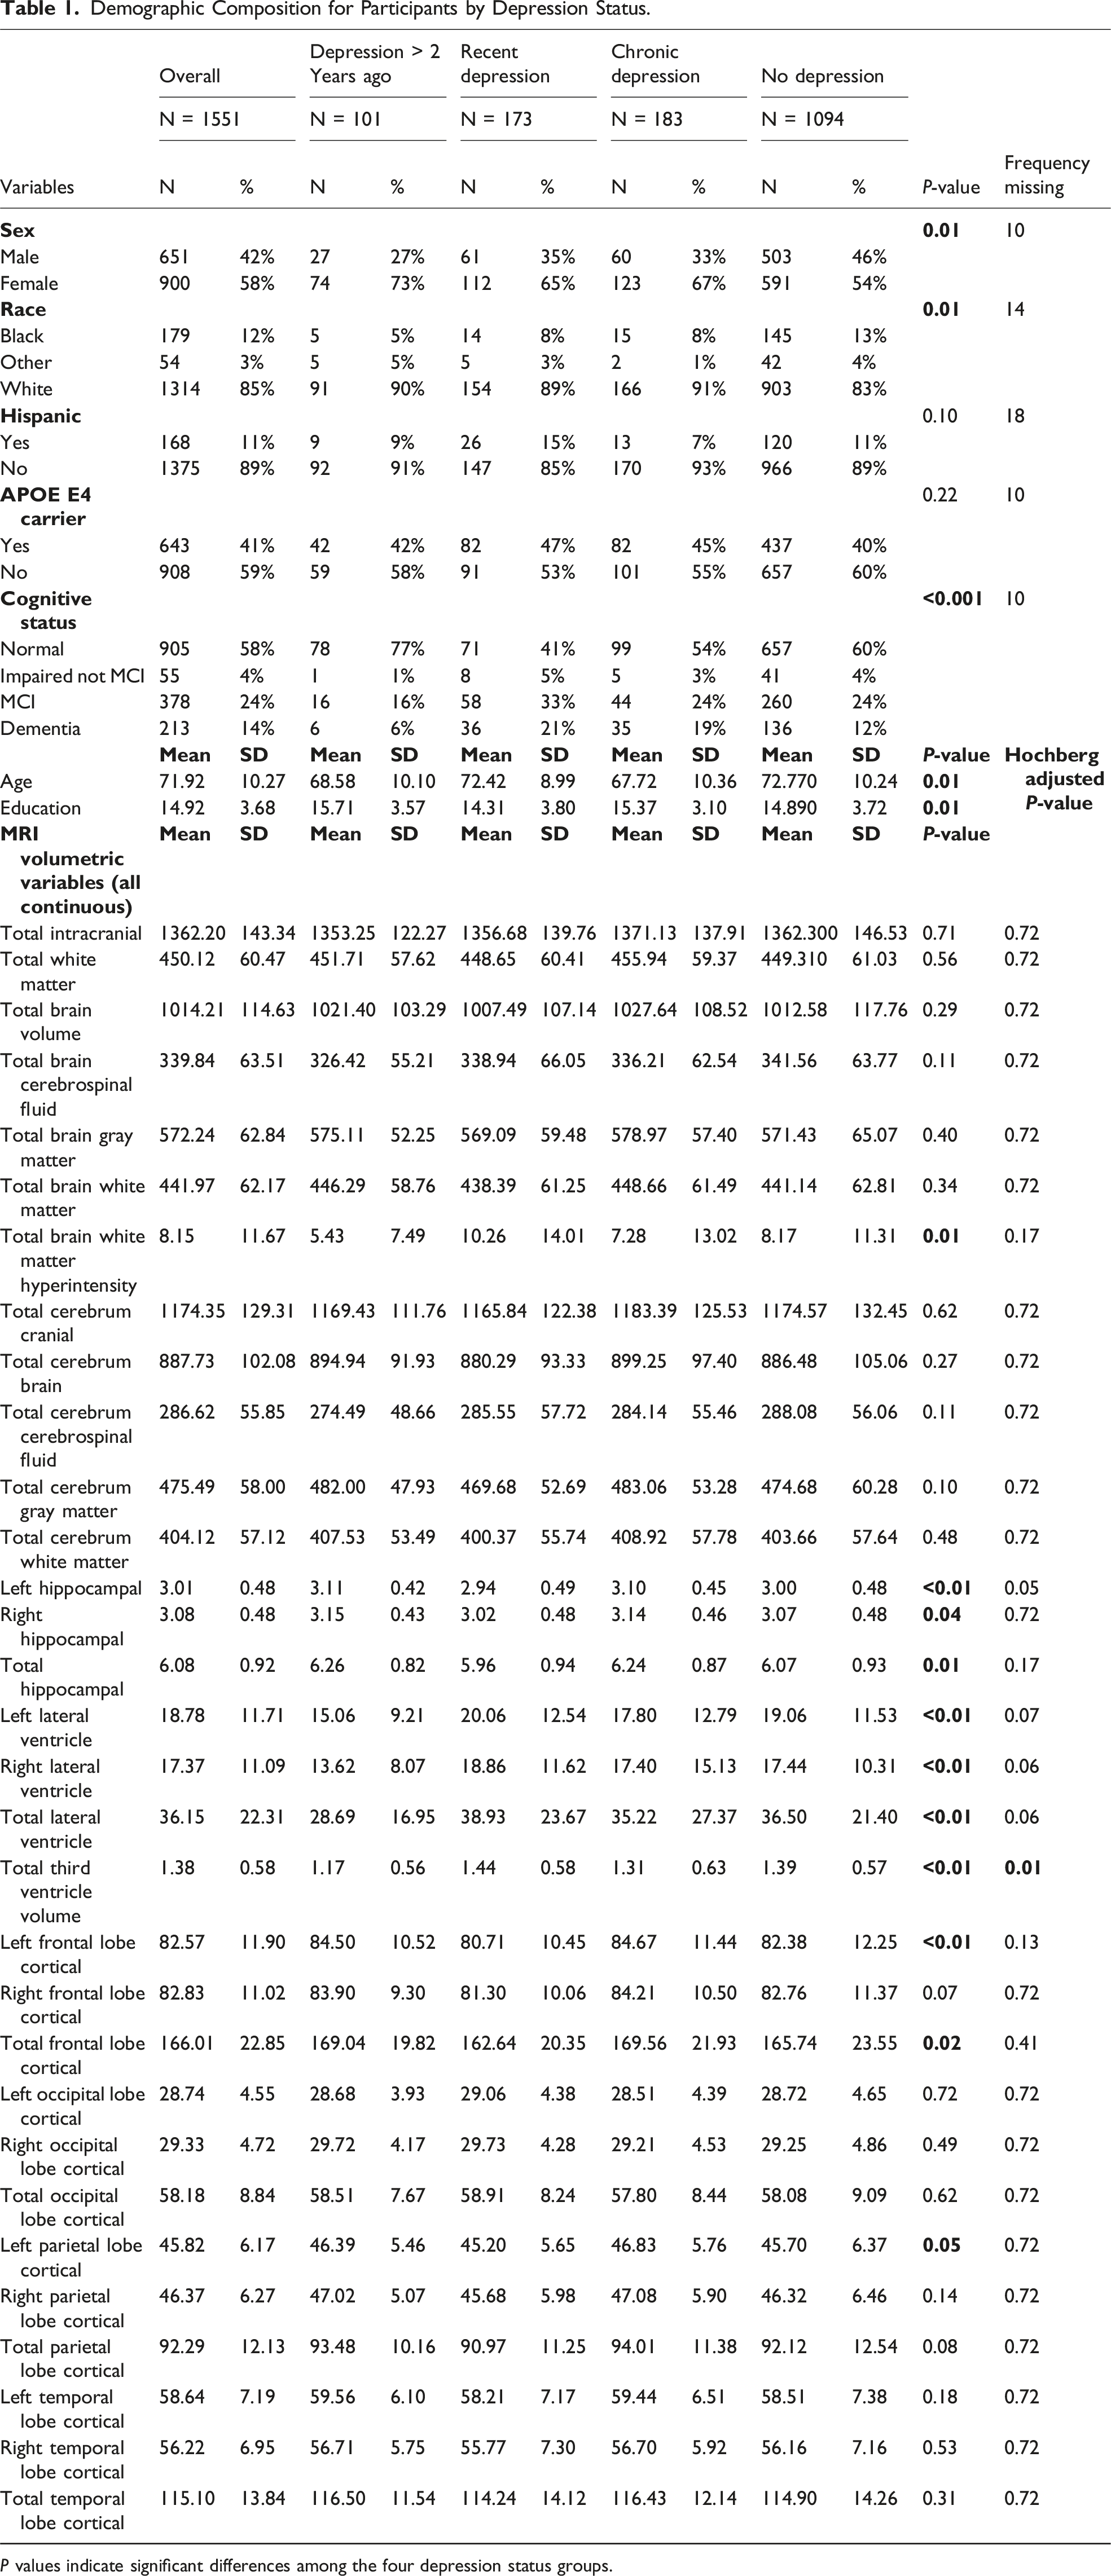
P values indicate significant differences among the four depression status groups.
In terms of ethnicity, 91% of the depression > 2 years ago group, 85% of the recent depression group, 93% of the chronic depression group, and 89% of the non-depressed group identified as non-Hispanic (P = .10). Forty-one percent (41%) of all participants were carriers of the APOE ε4 allele, making up 42% of the depression > 2 years ago group, 47% of the recent depression group, 45% of the chronic depression group, and 40% of the group reporting no depression (P = .22). Over half, or 58% of participants, had a normal cognitive status, 4% had impairment but not MCI, 24% had MCI, and 14% were diagnosed with dementia. The distribution of cognitive statuses was different across four depression groups (P < 0.001); the recent depression group comprised the highest percentage of participants with MCI and dementia. (Table 1).
Significant age differences between the groups were observed. The depression > 2 years ago group had a mean age of 68.6 years (SD = 10.1), the recent depression group, 72.4 years (SD = 9.0), the chronic depression group, 67.7 years (SD = 10.4), and the group reporting no depression, 72.7 years (SD = 10.2) (P < .01). Average years of education also differed significantly, with the depression > 2 years ago group averaging 15.7 years of education (SD = 3.6), the recent depression group 14.3 years (SD = 3.8), the chronic depression group 15.3 years (SD = 3.1), and the group reporting no depression 14.9 years (SD = 3.7) (P = .01) (Table 1).
Results of Structural MRI Biomarker Analysis
Adjusted Effect of Depression Status on the MRI Volumetric Variables.
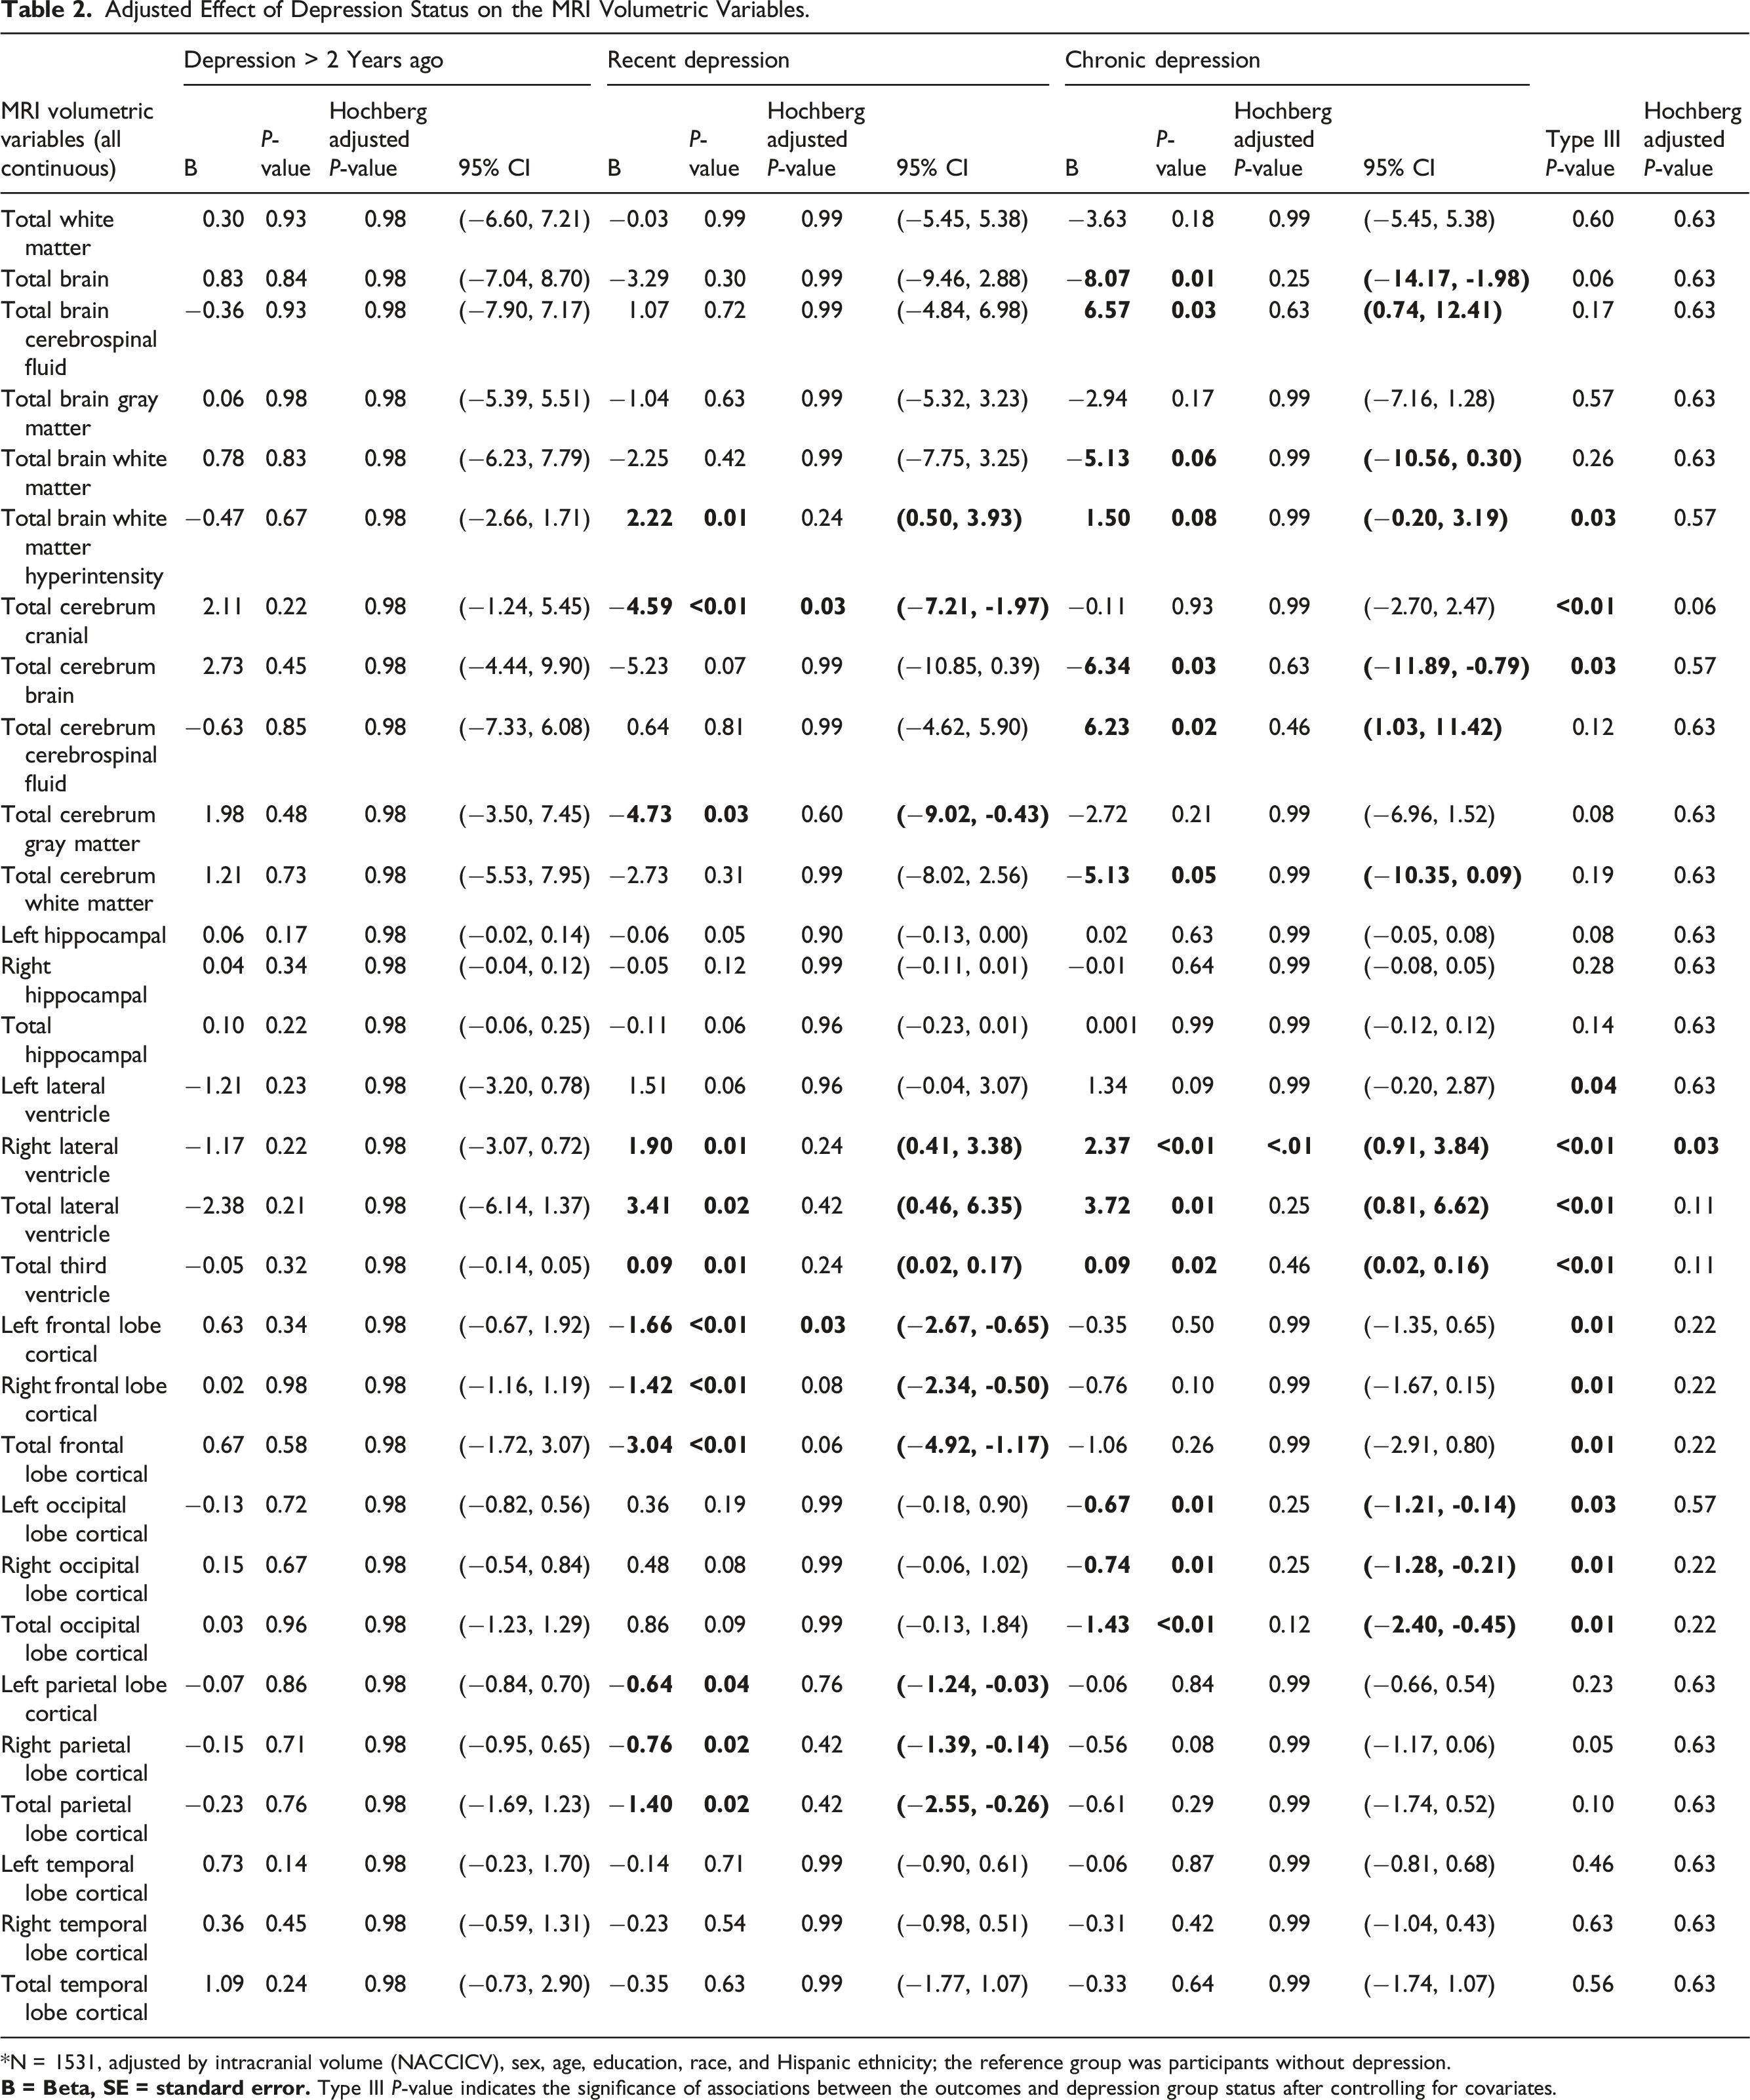
*N = 1531, adjusted by intracranial volume (NACCICV), sex, age, education, race, and Hispanic ethnicity; the reference group was participants without depression.
Results for Participants Reporting Chronic Depressive Symptoms
Of the total sample, 12% of the participants reported chronic depression (depression > 2 years ago and depression within the prior 2 years). Participants with chronic depression exhibited a significantly higher average right lateral ventricle volume post-Hochberg’s adjustment, highlighting the consequential effects of chronic depression on the structures of the brain (Table 2).
Results for Participants Reporting Recent Depressive Symptoms
Eleven percent (11%) of all study participants reported having depressive symptoms within the past 2 years but not historically. Following Hochberg’s adjustment, this group presented with a significantly lower average total cerebrum cranial volume and left total frontal lobe cortical volume (Table 2).
Results for Moderation Analysis
Moderation Effect of APOE E4 on the Associations Between Depression Status and the MRI Volumetric Variables.

*N = 1531, adjusted by intracranial volume, sex, age, education, race, and Hispanic ethnicity. B = Beta, SE = standard error.
Moderation Effect of Depression Status on the Associations Between the MRI Volumetric Variables and Cognitive Status (Cont.).
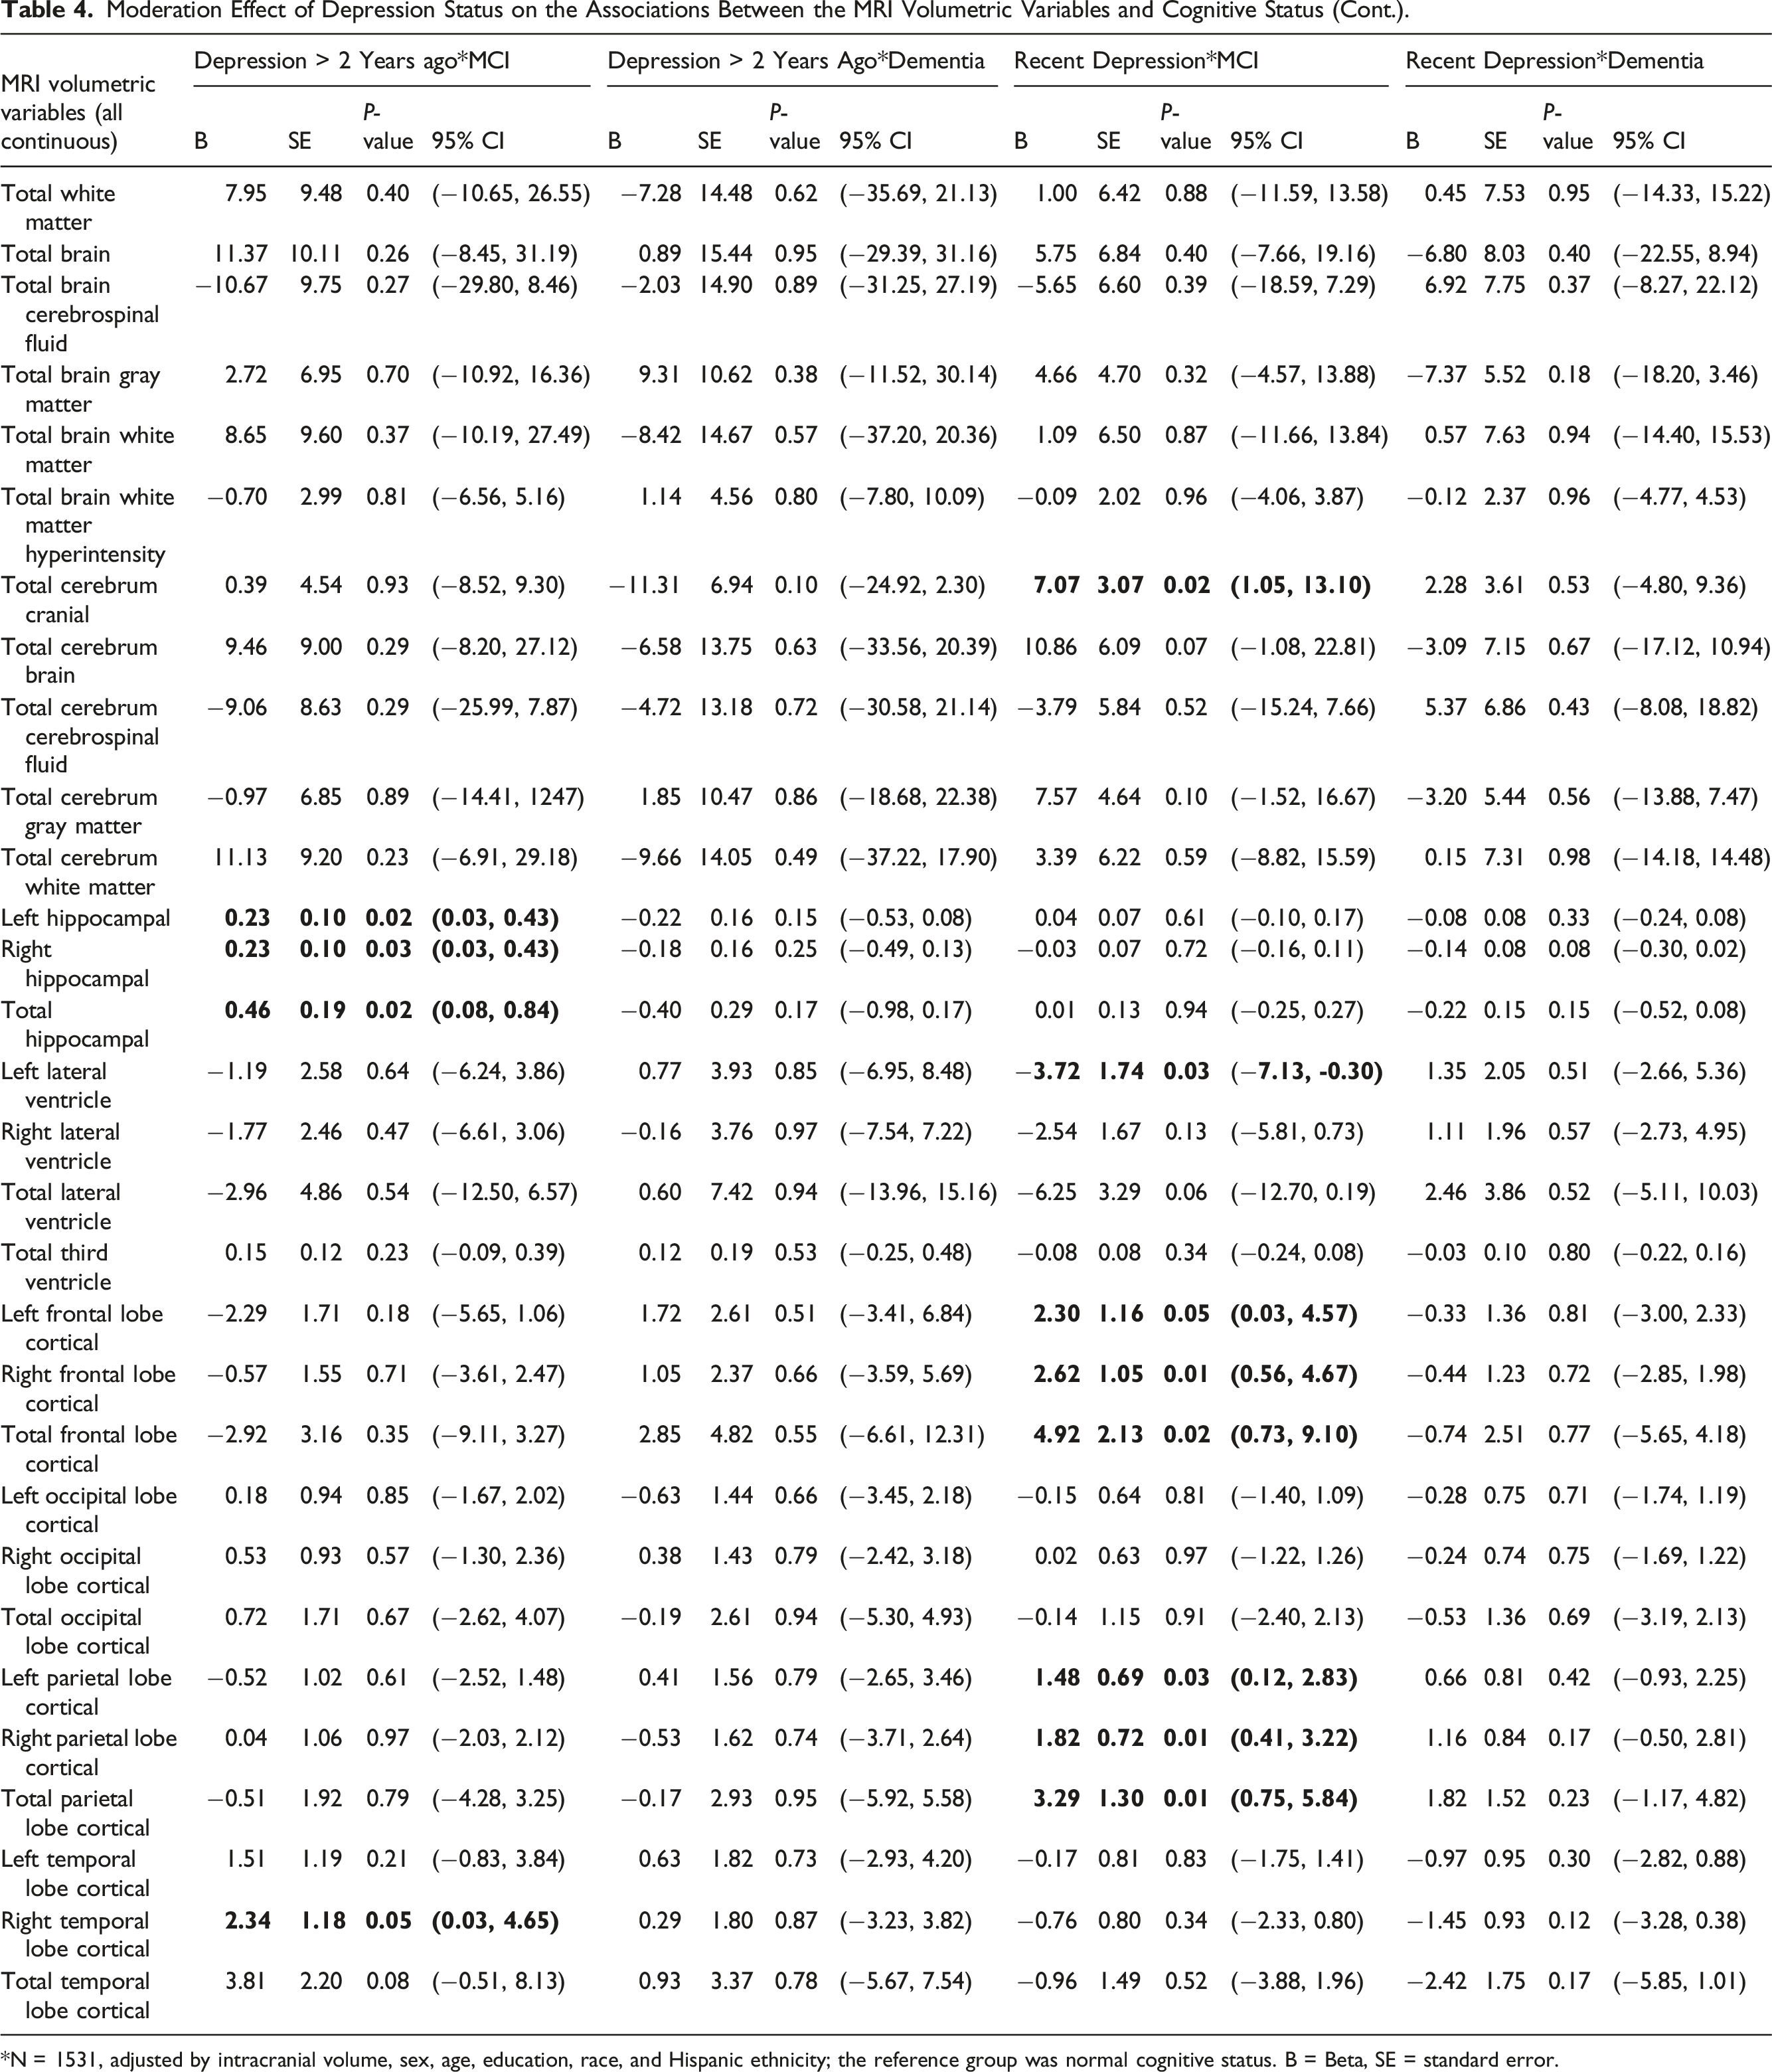
*N = 1531, adjusted by intracranial volume, sex, age, education, race, and Hispanic ethnicity; the reference group was normal cognitive status. B = Beta, SE = standard error.
Moderation Effect of Depression Status on the Associations Between Cognitive Status and the MRI Volumetric Variables.
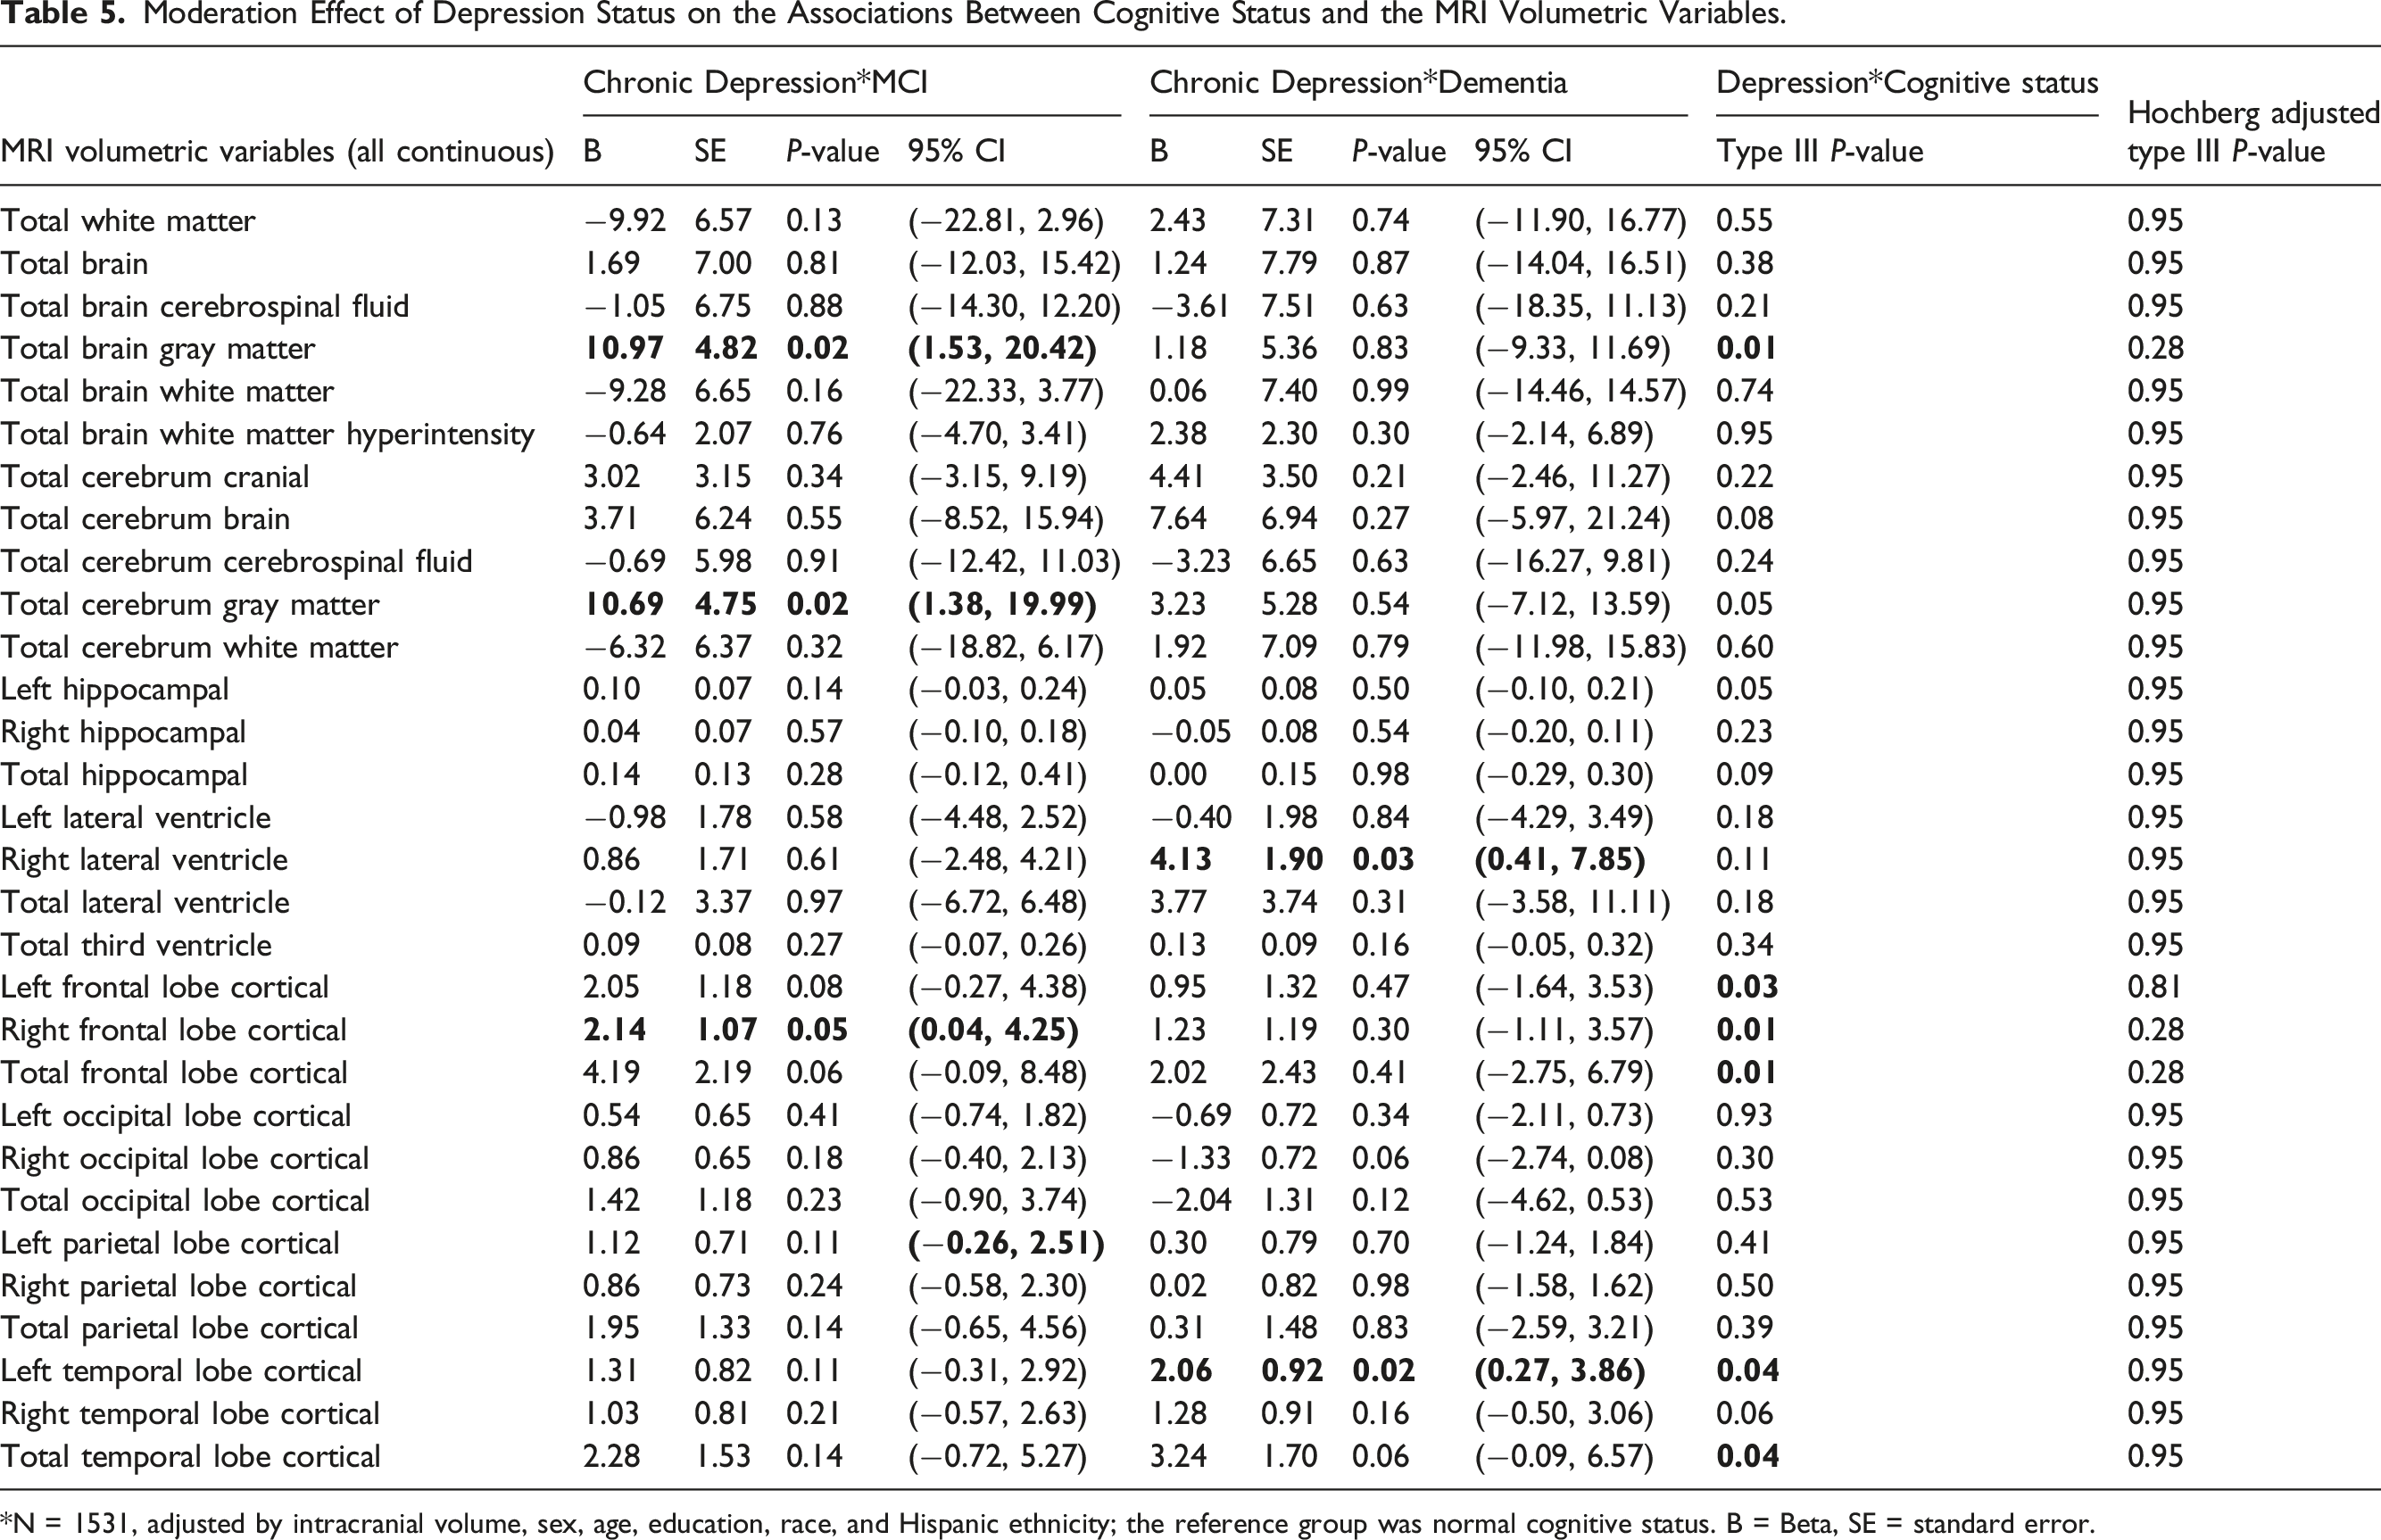
*N = 1531, adjusted by intracranial volume, sex, age, education, race, and Hispanic ethnicity; the reference group was normal cognitive status. B = Beta, SE = standard error.
Discussion
This study aimed to determine the effect of depression on regional brain volumes. It also explored the moderating roles of depression on cognitive status and regional brain volumes, as well as the influence of APOE ε4 on relations between depression and brain structure volumes. Use of the NACC data set allowed for the analysis of participants who reported depression in the past 2 years, those who reported experiencing depression more than 2 years prior, and those who reported chronic depression (both recent depression and depression > 2 years ago). Results indicate that regional brain volumes are differentially associated with depression based on when depressive symptoms occur. Among participants who reported recent depression, two biomarkers had statistically smaller means after controlling for demographics, intracranial volume, total cerebrum cranial volume, and left frontal lobe cortical matter volumes. Right lateral ventricle volume was larger in those with chronic depression. Among those who reported depression > 2 years ago, no statistically significant regional brain volume differences were identified.
A large systematic review and meta-analysis of 101 MRI studies (all age groups) by Arnone et al. (2012) (n = 7663) found that regional brain volumes in participants with unipolar depression exhibited lower total frontal, left and right orbitofrontal, and hippocampal volumes, as well as the right anterior cingulate cortex and striatum, and greater WMH volume compared to healthy controls. While this study identified differences in left frontal cortical volumes similar to Arnone et al., we did not observe differences in WMH, which have been associated with a greater risk for MCI and dementia 48 and observed more frequently among depressed older adults, especially those with late-onset depression. 49 Arnone et al. 47 suggest that the correlation between WMH and depression may be specific to older adults, as the mean sample age for this aspect of the meta-analysis was 68 years. Recent evidence linking WMH with AD pathophysiology, rather than systemic vascular risk, 24 challenges the assumption that LLD is primarily a consequence of vascular dysregulation. This suggests that while the vascular depression hypothesis remains relevant, it accounts for only one of several potential mechanisms underlying LLD.
No differences in the volume of total cerebral or ventricular volumes were identified by Arnone et al., 47 in contrast to our findings in participants with recent depression and chronic depression, respectively (unlike this study, Arnone et al did not evaluate total cerebrum cranial volume). Like their meta-analysis, this study documented lower frontal volumes in the recent depression sub-sample. Arnone et al 47 did not distinguish the timing of onset of depression in either group but did examine the influence of time since diagnosis, which was associated with a smaller effect size. Unlike our results, which did not identify significant volumetric differences in hippocampal measures (left, right, total), hippocampal volumes were negatively influenced by age at onset, time fraction since diagnosis (duration of illness/age), and the number of participants who were currently depressed. McKinnon et al. 50 found that those who reported MDD symptoms lasting for two or more years or had at least two episodes of MDD exhibited lower hippocampal volumes compared to participants who had only one episode or controls. Unlike Arnone et al., 47 the age of onset did not influence results.
Sexton and colleagues’ 28 systematic review and meta-analysis of 31 regions of interest (ROI) and voxel-based morphometry (VBM) MRI studies identified small effect size differences in orbitofrontal cortex, hippocampal, putamen, and whole brain volumes, and a medium effect size difference in the thalamus in the late-life depression group. A 46-study review of depression’s relationship to hippocampal volumes (n = 13,867) found that late-onset depression, rather than early-onset depression, was most closely associated with smaller hippocampal volumes. 51 Other, earlier meta-analyses produced similar results.26,52
A previous meta-analysis of late-life depression did not distinguish between treated and treatment-naïve samples in their analysis, 28 but a 14-study VBM meta-analysis with 824 younger (mean age = 32.4), treatment naïve MDD patients and healthy controls revealed a correlation between MDD and reduced gray matter volume in the prefrontal and limbic regions, including a sex effect in right hippocampal volumes. 53 Similar results were found by Szymkowicz et al. 54 (n = 80) who used the Beck Depression Inventory (2nd ed. 55 ) to evaluate subclinical depressive symptoms in middle-aged and older adults (mean age = 70.7) in the fronto-limbic regions. Differences were observed in the hippocampus, as well as the amygdala, caudal and rostral anterior cingulate cortex (ACC), and cingulate gyrus (both ACC and posterior cingulate cortex [PCC]) regions. Greater somatic but not affective or cognitive symptoms were associated with lower hippocampal and PCC volumes. Total depressive symptoms correlated with hippocampal volume but not ACC, PCC, or amygdala measures.
Our study sought to determine if APOE ε4 carrier status interacts with depression to influence regional brain volumes. APOE genotype has been correlated with a greater number of depressive symptoms and an increased risk of cognitive decline, 56 including AD in depressed older adults. 57 To our knowledge, this is the first study to examine the influence of APOE ε4 carrier status on white matter volumes in individuals reporting current or depression > 2 years ago. In contrast to Yuan et al., 58 who observed that left middle frontal gyrus, right medial frontal gyrus, and left inferior occipital gyrus regional gray matter volumes were lower in ε4 carriers (vs non-carriers) who experienced late-life onset depression but were currently in remission, our analysis did not find that APOE ε4 influenced frontal lobe gray matter results. O’Brien and colleagues 59 noted lower hippocampal volumes in depressed ε4 carriers at baseline, but not at six-month follow-up. The lack of ventricular volume differences identified by this study in participants with depression more than 2 years ago contrasts with previous findings, 60 but no studies exploring the role of APOE ε4 status were identified.
Unlike the current study, research examining the influence of depression on regional volumes by various stages of cognitive decline has noted some limited differences. Using the Geriatric Depression Scale 61 with healthy controls and individuals diagnosed with MCI or AD (n = 156), Son et al 62 found lower volumes in the left inferior temporal gyrus in participants with depression and AD but no significant differences in those with MCI, compared to healthy controls. In light of ongoing questions of whether depression represents a risk factor for AD or an AD prodrome, Boccia and colleagues 63 completed a meta-analysis of VBM studies to compare regional volumes of participants with late-life depression and those with AD. They found that while “both conditions are linked to a reduction of the bilateral hippocampal volume,” late-life depression “correlated with great atrophy in the precuneus, superior frontal gyrus, and ventromedial frontal cortex” whereas AD produced the greatest atrophy in “the left anterior hippocampus and bilateral posterior cingulate cortex.” Based on their meta-analysis, Boccia et al. 63 suggested that while late-life depression and AD appear to influence regional atrophy differently, overlap in hippocampal volume effects indicates that depression represents a risk factor for AD. Further research, they conclude, is still necessary to determine whether late-life depression and AD represent a ‘continuum’ of late-life cognitive degeneration. Our results, which identified gray matter atrophy in two regions in those with recent and chronic depression, but no atrophy in those with depression >2 years ago, when juxtaposed with evidence of regional brain volume differences in depressed young and middle-aged adults, suggest that late-life depression represents a differential diagnosis from AD. However, regional volume differences in late-life depression reflected in our data, when compared to ‘any age’ depression (i.e., Arnone et al. 44 ), indicate that age of diagnosis influences gray and white matter volumes, which may impact risk for AD. Interestingly, our analyses did not result in a significant interaction between recent depression and cognitive status, but this does not/cannot rule out that depression is a prodrome of AD.
The current study was cross-sectional, which is one of several limitations. As a secondary data analysis, the selection of additional or alternate measures was not possible. The binary classification of depression symptoms, both recent and > 2 years ago, does not allow for the collection of data on specific cognitive and somatic complaints associated with depression and limits comparison with other studies. In addition, depression was not necessarily measured at the time of the MRI scan. Depression is assessed at the time of medical interview. Finally, this study was underpowered to examine differences by race and ethnicity, given that the sample was predominantly White non-Hispanic. This is an important note given that the APOE ε4 clinical phenotype may be different for distinct ethnic groups. 64
Longitudinal studies to provide additional data about regional volume change across time and progression from healthy cognition to MCI and dementia are needed. In this study, we used MRI calculated summary data that focused on gross brain volumes. Future studies using this data source may also wish to analyze the regional gray matter volumes and regional cortical thickness variables that were not available at the time we undertook our study. The accumulation of harmonized or comparable regional brain volume data is essential to inform the development of interventions to treat late-life depression, reduce the risk for, and ultimately, prevent AD and its devastating consequences.
Availability of data
The NACC data is publicly available at https://naccdata.org/.
Footnotes
Acknowledgements
The NACC database is funded by NIA/NIH Grant U24 AG072122. NACC data are contributed by the NIA-funded ADRCs: P30 AG062429 (PI James Brewer, MD, PhD), P30 AG066468 (PI Oscar Lopez, MD), P30 AG062421 (PI Bradley Hyman, MD, PhD), P30 AG066509 (PI Thomas Grabowski, MD), P30 AG066514 (PI Mary Sano, PhD), P30 AG066530 (PI Helena Chui, MD), P30 AG066507 (PI Marilyn Albert, PhD), P30 AG066444 (PI David Holtzman, MD), P30 AG066518 (PI Lisa Silbert, MD, MCR), P30 AG066512 (PI Thomas Wisniewski, MD), P30 AG066462 (PI Scott Small, MD), P30 AG072979 (PI David Wolk, MD), P30 AG072972 (PI Charles DeCarli, MD), P30 AG072976 (PI Andrew Saykin, PsyD), P30 AG072975 (PI Julie A. Schneider, MD, MS), P30 AG072978 (PI Ann McKee, MD), P30 AG072977 (PI Robert Vassar, PhD), P30 AG066519 (PI Frank LaFerla, PhD), P30 AG062677 (PI Ronald Petersen, MD, PhD), P30 AG079280 (PI Jessica Langbaum, PhD), P30 AG062422 (PI Gil Rabinovici, MD), P30 AG066511 (PI Allan Levey, MD, PhD), P30 AG072946 (PI Linda Van Eldik, PhD), P30 AG062715 (PI Sanjay Asthana, MD, FRCP), P30 AG072973 (PI Russell Swerdlow, MD), P30 AG066506 (PI Glenn Smith, PhD, ABPP), P30 AG066508 (PI Stephen Strittmatter, MD, PhD), P30 AG066515 (PI Victor Henderson, MD, MS), P30 AG072947 (PI Suzanne Craft, PhD), P30 AG072931 (PI Henry Paulson, MD, PhD), P30 AG066546 (PI Sudha Seshadri, MD), P30 AG086401 (PI Erik Roberson, MD, PhD), P30 AG086404 (PI Gary Rosenberg, MD), P20 AG068082 (PI Angela Jefferson, PhD), P30 AG072958 (PI Heather Whitson, MD), P30 AG072959 (PI James Leverenz, MD).
Authors’ Contributions
SLB, AG, TL CB, and KH conducted the study, and TL and NG conducted the statistical analyses. All authors contributed to the drafting of this manuscript. STDeK provided manuscript editing and expert consultation on structural MRI biomarkers.
Declaration of Conflicting Interests
The authors declared no potential conflicts of interest with respect to the research, authorship, and/or publication of this article.
Funding
The authors disclosed receipt of the following financial support for the research, authorship, and/or publication of this article: Funded by Florida Department of Health, Ed and Ethel Moore Alzheimer’s Disease Research Program (9AZ07), National Institutes of Health/National Institute on Aging (L30 AG060524), National Institutes of Health/National Institute on Aging (P30 AG066506), & the National Science Foundation (CNS-1920182).
Ethics Approval
This was a secondary data analysis, and as such, participants were consented by their respective Alzheimer’s Disease Research Centers. This analysis received IRB approval (IRB-18-0357) from the Florida International University Institutional Review Board and was conducted in accordance with the Declaration of Helsinki.