
Abstract
The schools in the United States undergo reforms that involve the integration of data-intensive improvement process known as strategic improvement plans (SIPs). This process requires digital systems to set goals, create interventions, use and analyse student data, monitor and report SIPs. A challenge with digital systems is the integration of a highly diverse set of data sources and identifying users who are engaged with the processes. This study explored how teachers and principals carry out SIPs currently. We applied the sociotechnical walkthrough, a qualitative method that combines a modelling notation and focus group interviews to understand the current workflows, technology use and interactions of teachers and principals developing SIPs. The results illustrate a variety of existing activities and indicate how a newly developed technology may have an impact as well as propose design recommendations to fill a gap in managing SIPs.
Keywords
Introduction
In its 5-year strategic plan, the US Department of Education (DOE) has identified a number of goals to guide its ‘cradle-to-career education strategies’ implementation across all levels of the education system (2014: 5). One of the goals aims to advance the school’s ability to improve student learning through systematic planning and data-driven decision-making. Such a data-intensive improvement process known as a strategic improvement plan (SIP) is federally required for all schools in order to meet the educational goals and outcomes described by the DOE. SIPs mostly target student achievement improvements (Butler, 2008; Mandinach and Honey, 2008). The process typically follows a series of ‘plan–do–check’ cycles that specify goals and action plans guided by urgent needs in schools. Therefore, while SIPs focus on school improvements aligned with DOE’s strategic directions, the expected outcomes for each school may vary and schools are expected to rely on the extensive amount of data (Maye, 2013).
Despite its positive impact on systematic school improvements, the SIP process constitutes a challenging task for education leaders and stakeholders in school communities (LaFrance and Beck, 2014). There are no clearly defined steps to create SIP goals and actions, which makes the creation and monitoring of the SIPs difficult (Donoff and Rosser, 2016). Research also indicates that administrators and teachers are not ready to use multiple data sets to track student performance (Mandinach and Gummer, 2013; Wayman, 2005). In addition, while SIPs ideally involve collaboration among administrators, teachers, students and even parents at both district and school levels, some districts and schools find it difficult to coordinate collaboration and communication (Wamba, 2008). Accordingly, every year, school districts and schools end up with an SIP document containing more than 100 goals that are oftentimes inconsistent with DOE’s goals and difficult to manage and achieve (LaFrance and Beck, 2014).
To address these challenges, there have been increased calls for the use of digital technology that can properly and readily support multiparty collaboration and data sharing through each step of the SIP (Halverson and Smith, 2009; Mandinach et al., 2005; Schifter et al., 2014). Districts and schools have already adopted many different systems to manage instructions, testing and administration. However, problems have been reported in coordinating such systems seamlessly to collect data that may support decision-making (Means et al., 2009). Research has proposed solutions that considered either human factors such as teacher training for data management and analysis (Mandinach and Gummer, 2013) or technical aspects such as unified dashboard to access different systems (Wayman and Stringfield, 2006). We define this problem as a sociotechnical design problem that can be only solved through coordinating the social and the technical together. As the first step to a sociotechnical design of SIP service systems, the current study invited teachers and principals in different schools to share their experience of SIPs so that we can better understand the existing SIP workflows from users’ perspectives. The research questions are as follows:
What kind of activities exist in current SIPs, in what ways are users (principals, teachers and others) involved and what kind of digital systems are connected to the SIP workflows?
What challenges do principals and teachers face while carrying out the SIP in schools?
To answer the questions, we detail SIP activities along with the primary user roles and resources such as technology and data sources. We discuss the findings to propose a new design of SIP support systems.
Related work
Literature indicated that schools are in need of guidelines to create and implement SIPs effectively. Participants engaged in organizational change typically experience uncertainty related to strategic directions, collaborative structure and job-related functions (Donoff and Rosser, 2016). Those who are selected to be part of the SIP in schools do not necessarily understand why they are engaged in the SIPs, who they work with and what specific actions they should take. Such uncertainty and the lack of experience lead to a failure in clarity and effectiveness of collaboration and the improvement process (Warren and Giselle, 2015). Research has also shown that school development plans in current practices are anticipated by the school administrators, to be updated yearly instead of creating new systems for better outcomes (Knight, 2014).
In addition, SIPs require schools to collect and use student data to set goals, monitor activities and make further decisions. Schools have relied on a wide range of data sources to assess the quality of their programmes. Using existing data effectively for making improvements is still one of the new challenges for those enacting strategic planning in schools (Calhoun, 1994; Devos and Verhoeven, 2003; Mandinach and Honey, 2008). Schools typically gather more data than they can use effectively and wisely (Wallace, 1995). Guides on data use have been largely theoretical; administrators often face the challenge of investing limited resources to ensure teachers gain the needed capabilities (Marsh and Farrell, 2015). Therefore, though data can inform decision-making for schools, a data-driven approach overwhelms administrators and teachers with statistical information; it distracts bureaucracy from more important issues when preparing school improvements (Karagiorgi et al., 2015).
In sum, existing studies show that stakeholders in SIPs have difficulties understanding the planning details and end up repeating what has been done previously. SIPs often follow a top-down approach and do not involve teachers and staff in that process effectively. Data collection and use process is another factor that overwhelms participants in SIPs.
Theoretical framework
In this study, we adopted the lens of sociotechnical systems (STSs) (Fischer and Herrmann, 2011) to better understand the current SIP practice and to give design recommendations for further systems. This view of STSs has been mainly applied to IT systems design for organizations (Baxter and Sommerville, 2011). The literature presents many definitions of STSs; in our study, we refer to it as an interwoven network of work processes, organizational roles and technology use (Orlikowski and Scott, 2008). As the term suggests, STS is a system comprised of social and technical elements, while the human work processes are the starting point for analysing existing practices in order to identify user needs and task distribution (Herrmann et al., 2004). We follow Herrmann et al. (2007), in a fully integrated STS, human communication is partly or entirely computer-mediated; in other words, communication is performed through controlling operations (human–computer interaction) and that means human communication is influenced and limited by the rules of the technical system. Without the technical system, the social system would not exist in the same form, quality or structure. However, the STS perspective evenly highlights that it is the social system that operates and changes such technical systems. Whereas the technical elements can be designed and engineered, the social component involving participants and their social interaction cannot be designed in the same capacity as the technical component: social rules and conventions cannot be engineered; rather, they evolve (Jahnke, 2015). The social aspect makes the STS a nondeterministic system.
Given such a highly interwoven and nondeterministic nature of an STS, the integration of the social and the technical is a matter of design for co-evolutionary growth (Herrmann et al., 2004). As Grudin (1988) illustrated, an STS tends to fail because (a) it is difficult to know all the requirements of a system, (b) learners and groups have diverse perspectives and aims that may not be clear or intuitive for designers, and (c) it is a dynamic system with boundaries that change over time. For successfully functioning STSs, designers need to consider the interplay between communicative human interaction (the Social), human–computer interaction and interaction between the technical elements (the Technical) (Jahnke, 2015). Moreover, designers should note that the functioning and understanding of STS depends on the position of the observer as different people in different roles ‘see’ the system differently and they may not always have the same shared understanding of what elements belong to the system. In addition, their understandings can vary. Herrmann, therefore, noted that ‘rules can be designed, but conventions evolve’ (as cited in Jahnke, 2015: 47). Such a perspective of an STS has established an approach to capturing and designing human interaction technically mediated and human–computer interactions, which are neither totally random nor predetermined.
One method for preparing a fully integrated STS is the sociotechnical walkthrough (STWT) (Herrmann, 2009), which is an example of a collaborative design approach. STWT combines focus groups and modelling notation. Stakeholders who own the key workflows are invited to a series of workshops to share their perspectives and experience. While the interviewer has a central question, she or he encourages participants to talk about their experience, while a modeller documents the responses. In that way, existing workflows will be visualized in a graphical diagram that represents the model (Prilla and Jahnke, 2011). During the interview, the participants are asked to reflect on whether or not their contributions are depicted accurately in the model. The main interview question was: ‘Please tell us, how you do conduct the SIP’. STWT uses the modelling notation of SeeMe (Herrmann, 2006). Responses will be visualized using three basic elements: Roles (individuals or groups), Activities (existing workflows and processes) and Entities (resources, tools, data and technologies) and the interrelationships of these elements with Arrows. Roles (e.g. a person or a group) conduct Activities while using Entities. SeeMe allows flexibility with semi-structured notation elements. For example, the participant response ‘I do it this way or the other way’ can be modelled and graphically represented for two activities. The facilitator walks stakeholders through the documentation again to validate and revise the model as needed. In such a way, a shared understanding of an STS evolves; designers and users of the STS engage in the co-design process. STWT typically uses a modelling tool to document the workflows (Herrmann, 2006). After modelling, the visualized diagrams can be used as a starting point to discuss what the new technology can look like and how new workflows will be shaped if new tools are implemented.
Research method
We adopted the STWT methodology to better understand the current SIP workflows and technology use (Fischer and Herrmann, 2011; Herrmann, 2009). As STWT suggests, we combined focus group interviews (Vaughn et al., 1996) and SeeMe modelling (Herrmann, 2006). While we conducted the focus group interviews, the interviewees created a model of the SIP workflows with the help of a modeller. Then the participants were asked to confirm the model. Until the model represented SIP workflows properly, we continued to revise the model. We detail our data collection and analysis methods below.
Participants
We created two focus groups – school teachers and school principals – as key informants of SIP practices in schools. Participants were recruited using a snowball sampling technique in a Midwestern state in the United States. For each group, we sought three participants who were currently employed in schools and had experience in SIP creation and implementation.
The final sample size was six, all from public school systems. Depending on the problem, user experience researchers suggest small sample size as an appropriate method to uncover insights and to identify the usability issues (Alfageh and Demir, 2018; Demir and Kul, 2011; Demir et al., 2012). In this research, through focus group interviews, the goal is to understand the existing workflow and to better understand the participants’ mental models. Thus, the research was conducted with a total of six participants, as the first phase of the research, and to better understand the existing workflow in the perspective of participants.
Due to a scheduling issue, however, we had three separate interview sessions instead of two. Session 1 was with a group of three teachers, two male and one female. They were in the 40–45 age range; all taught at elementary schools, having more than 10 years of teaching experience. Session 2 was with two female elementary school principals. Their age was between 45 and 50, and their administrative experience ranged between 5 and 10 years. Finally, one female middle school principal participated in an individual interview session. She was in the 50–55 age range, having more than 10 years of administrative experience.
Data collection and analysis
We collected data from three semi-structured interview sessions and created three models of SIP processes in schools in 2015–2016. Each interview lasted for about 90 minutes and was video-recorded. We used SeeMe for the modelling purpose because of its flexibility. For example, when participants responded, ‘I do it this way or the other way’, SeeMe allowed both activities to be visually represented. Our interview questions were: ‘Please tell us, how you organize or participate in the SIP process from start to finish’, ‘How do you collaborate with your colleagues?’ and ‘What kind of technology do you use to create and manage a SIP?’.
The development of the model through the interviewees’ responses combined the process of data collection and consolidation. During interview sessions, we created three consolidated models out of six different SIP practices. Model A represents three SIP practices of elementary education teachers; models B and C represent SIP practices of two elementary school principals and one middle school principal. During the group interview, participants were asked to verify their consolidated model. While doing so, the researcher and participants examined together similarities and differences in SIP approaches and discussed challenges in each SIP process.
Ultimately, the consolidated models help to analyse and reflect current practices and will inform designers for future SIP support systems to derive design principles applicable across different practices. In that way, teachers and principals served as co-designers for co-evolutionary growth (Fischer and Herrmann, 2011)
The subsequent three models (visualized diagrams) show current SIP practices along the human activities and processes include related roles (individuals or groups) and entities (resources, tools, and technologies). Each model includes direct quotes from participants. While the SIP practice is complex and dynamic, our data analysis and report focuses on the main SIP activities and challenges as indicated by principals and teachers. In the following results section, we provide findings from model A (teachers’ points of view) and models B and C (principals’ points of view).
Findings
Participants have identified various activities and have visualized them in graphical diagrams with SeeMe (Herrmann, 2006); these diagrams represent the interviewees’ models of current SIP practices. The models show how schools rely on various data sets and digital technologies to conduct and implement SIPs during the school year. The models reveal problems and challenges in SIP practices and key points in the workflows where a new sociotechnical system would have an impact. In the following subsections, we describe the results along roles, activities and entities (e.g. use of technologies and data sources) of current SIP practices including challenges and recommendations given by teachers and principals.
Model A: Current SIP practices from teachers’ perspectives
The interviewed teachers identify three primary roles, four main activities including sub-activities, varying sets of data and technology use, especially Data Wall, which is a Google spreadsheet that they used to manage the data sets. Teachers also present problems, challenges and recommendations related to SIP workflows, managing data and communication.
Roles (represented by red ovals)
Teachers identify three primary roles (see Figure 1(a)): (a) principal, (b) data teams by grade and (c) school-wide vertical teams that addressed school issues across grade levels (e.g. community engagement).
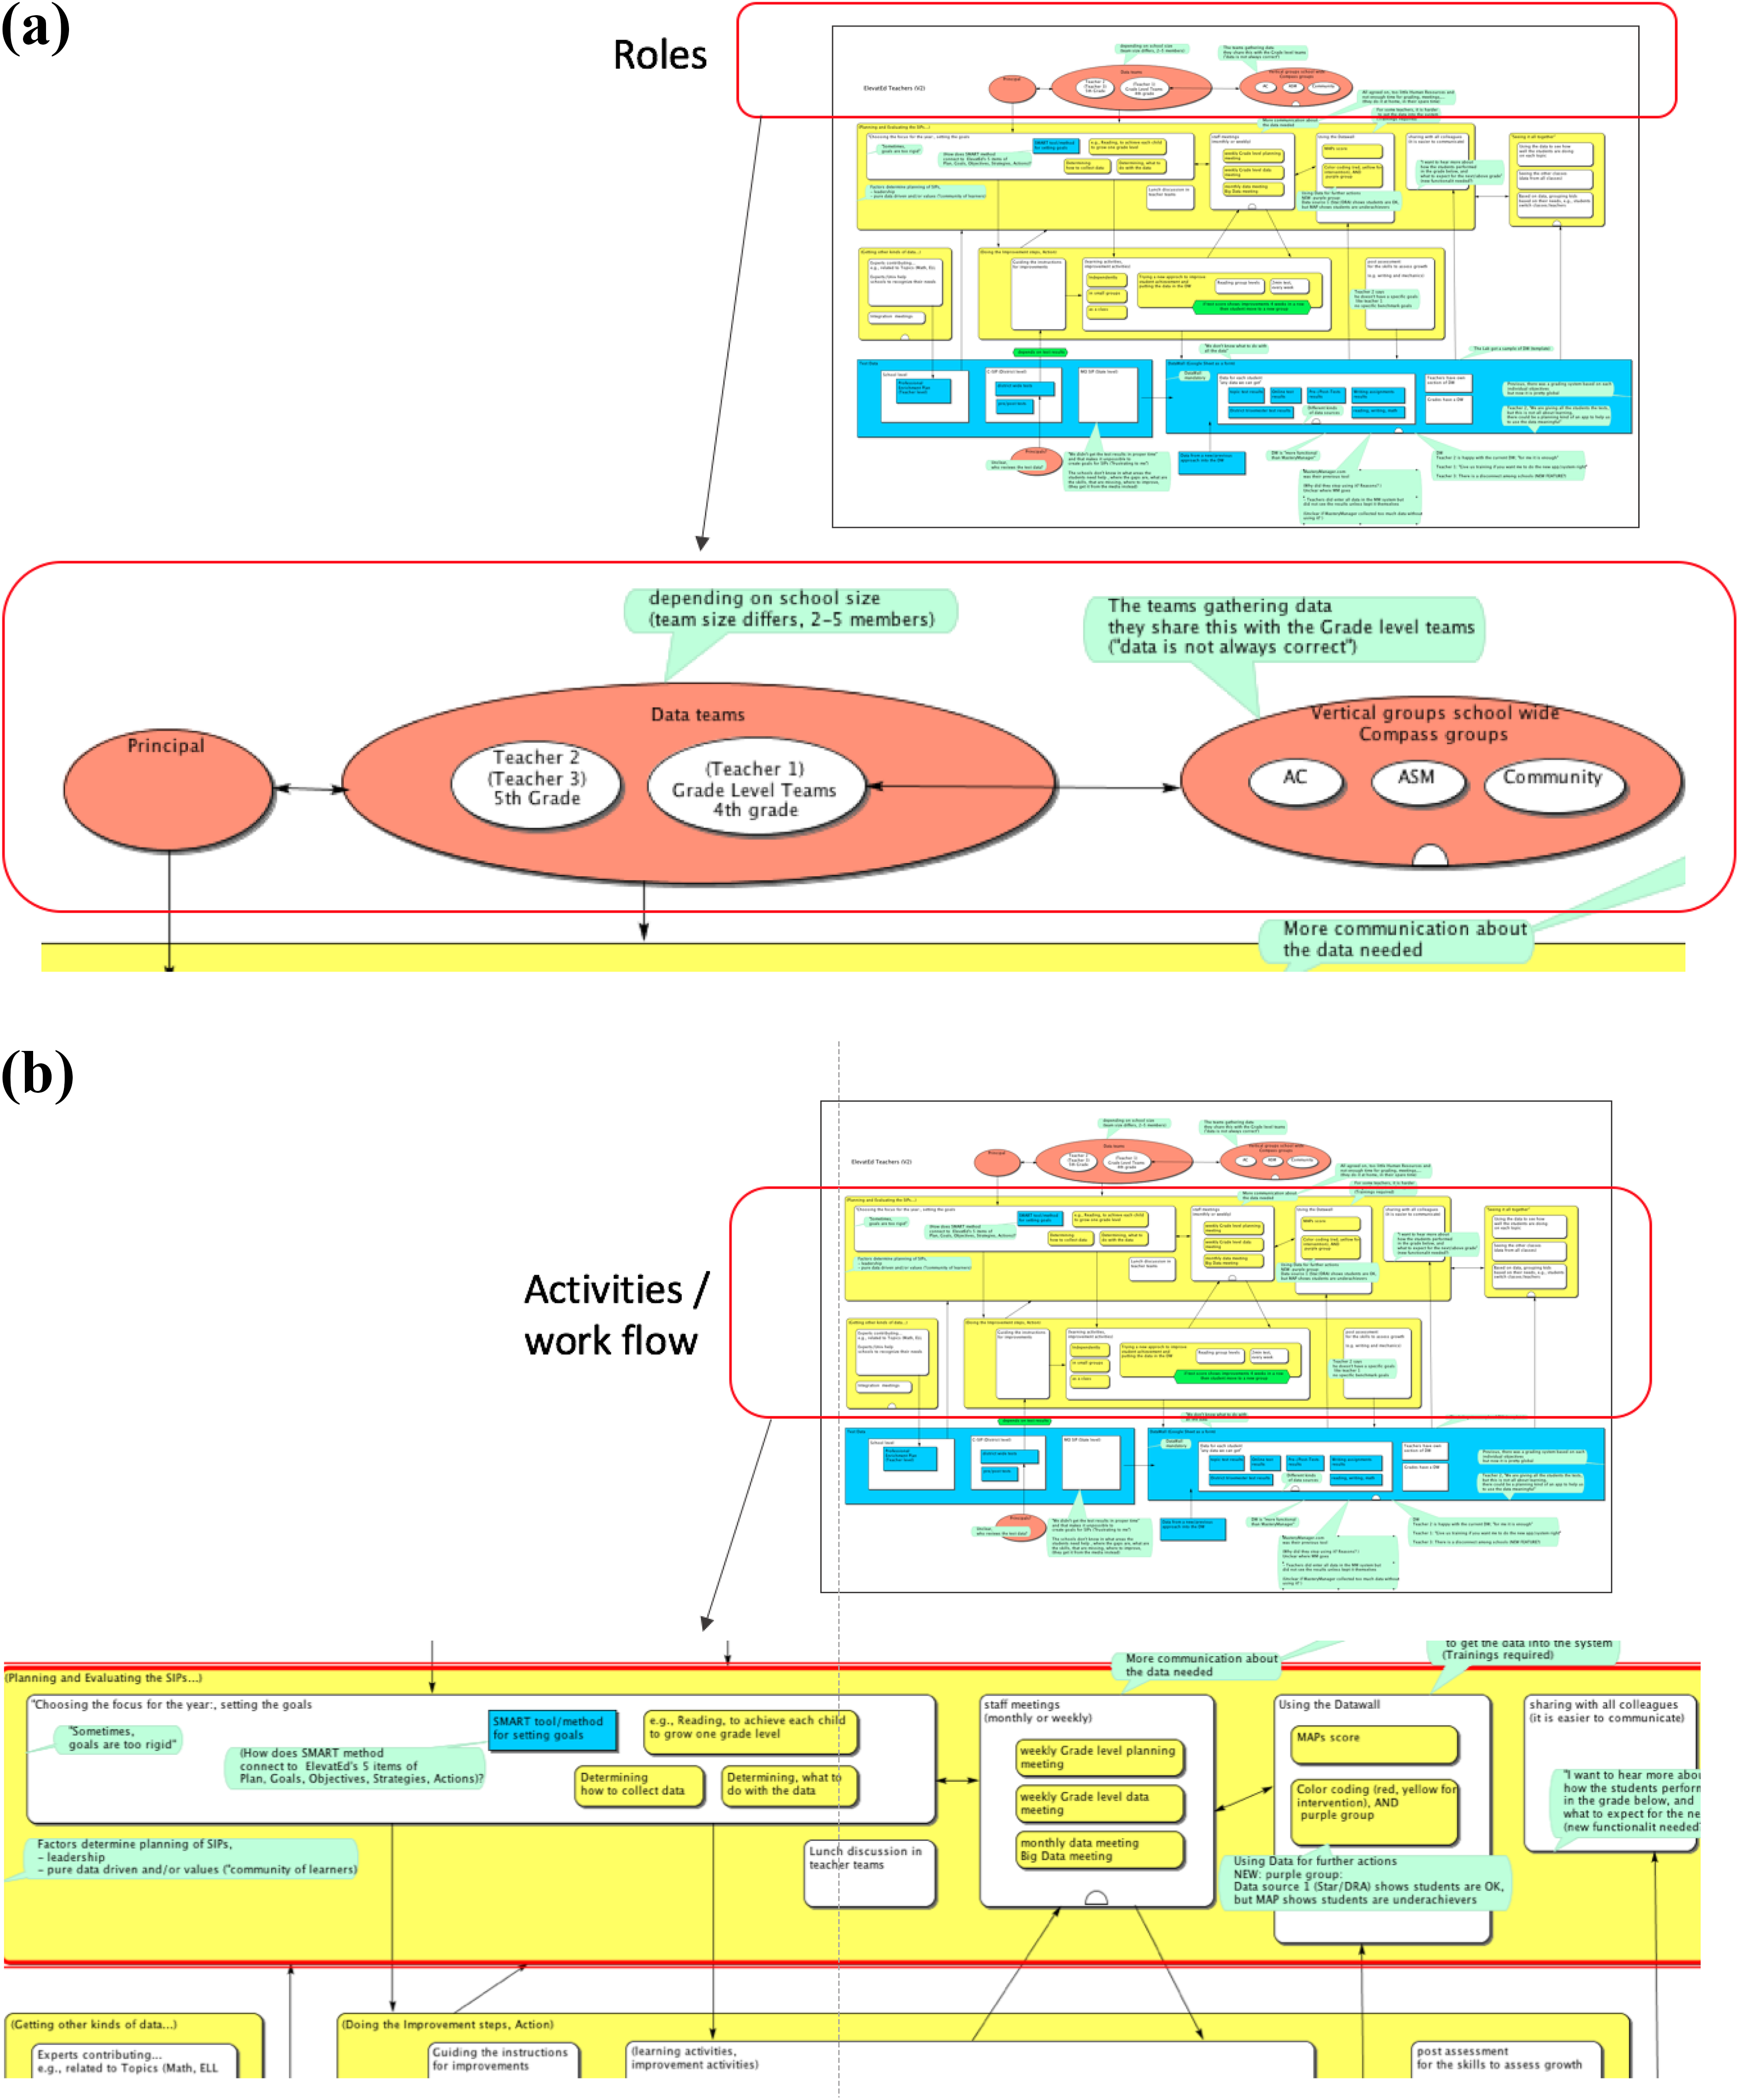
Model A: Teachers’ views on SIPs in their schools – (a) roles, (b) activities, (c) data and use of technologies and (d) challenges. SIP: strategic improvement plan.
Principals were considered by the teachers as the primary catalyst in initiating and guiding the SIP process throughout the school year. The data teams by grade levels consist of two to five members depending on the school size and grade level. School-wide vertical teams are the groups that consist not only of teachers across grade levels but also include students, parents and community members. The interviewees name one group as ‘vertical teams’. Teachers in the data teams usually take part in one of the vertical teams to ensure cohesive information flows in between two groups.
Activities (represented as yellow rectangles with rounded corners)
The current SIP from teachers’ views includes four main activities (Figure 1(b)), marked with (a), (b), (c) and (d), respectively. We present an overview of four activities first and then describe the details.
The central SIP activities are as follows. The teachers identify the first activity as (a) ‘planning and evaluating’, which includes five sub-activities: ‘setting the goals’, ‘meeting in data teams’, ‘having lunch meetings’ for further discussions, ‘using the Data Wall’ (technical support system) and ‘sharing with all colleagues’. The second activity focuses on (b) getting the data and integration of data. Sub-activities include ‘inviting experts’ for helping the schools in understanding the data as well as having ‘data integration meetings’. The third activity is (c) the actual carrying out of the SIP, which means that teachers make changes to their classrooms and improve or revise their teaching and learning. Sub-activities are creating new learning instructions, using them and applying revised instructions, and having a post-assessment if these new instructions work. The fourth activity (d) is called ‘monitoring’; the teachers named it with ‘seeing the bigger picture’, in which student data are used to assess whether the improvement plan has worked.
These four main activities take place at different times, sometimes with overlaps, and each one was separately highlighted from the teachers’ points of view. In detail, the first main activity of ‘planning and evaluating the SIPs’ starts in each school where they ‘choose the main focus for the year’ and set the goals to establish the strategic plan at the beginning of the school year. The interviewees use the SMART method to establish Specific, Measurable, Attainable, Relevant and Timely goals. In this process, they also determine how to collect the data and what to do with the collected data. The teachers describe ‘staff meetings’ as an activity that continues after the goals of the SIP have been set. Data teams hold grade-level planning and data meetings weekly throughout the school year, in which teachers specify SIPs and analyse data specific to each grade level. They have monthly meetings in which data sets were analysed. Information about student progress is communicated and ‘shared with colleagues’. They use the technical system of the Data Wall to communicate and share results. Teachers also made clear that more communication about data, and its interpretation, is necessary, but is missing in the current practice.
During the second main activity, the schools ‘get other kinds of data (advice)’ from external experts. As part of the SIP monitoring process, data teams hold integration meetings with experts, for instance, faculty from the state university, who advised on the most beneficial use of collected data to identify student needs. Additional meetings were also held to discuss the integration of data related to specific issues such as English Language Learners (ELLs).
As part of the third activity, teachers take specific ‘improvement steps’ in their own classes. They apply the SIP, translate this into new instructions and revise their teaching and learning. Teachers develop new learning activities to improve student achievement levels. For example, they group students according to their reading levels; give them a 2-minute reading test each week in order to evaluate student progress. If students show improvements for 4 weeks in a row, students advance to the next-level group.
In a fourth main activity of SIP implementation, teachers emphasize the importance of being able to ‘see it (the student performance progress towards specific goals) all together’ in the big picture. For example, teachers not only monitor individual student progress over time but also compare their student performance across classes. As such, the SIP process involves a series of ‘plan–do–see’ cycles that occur across multiple layers of communication and collaboration.
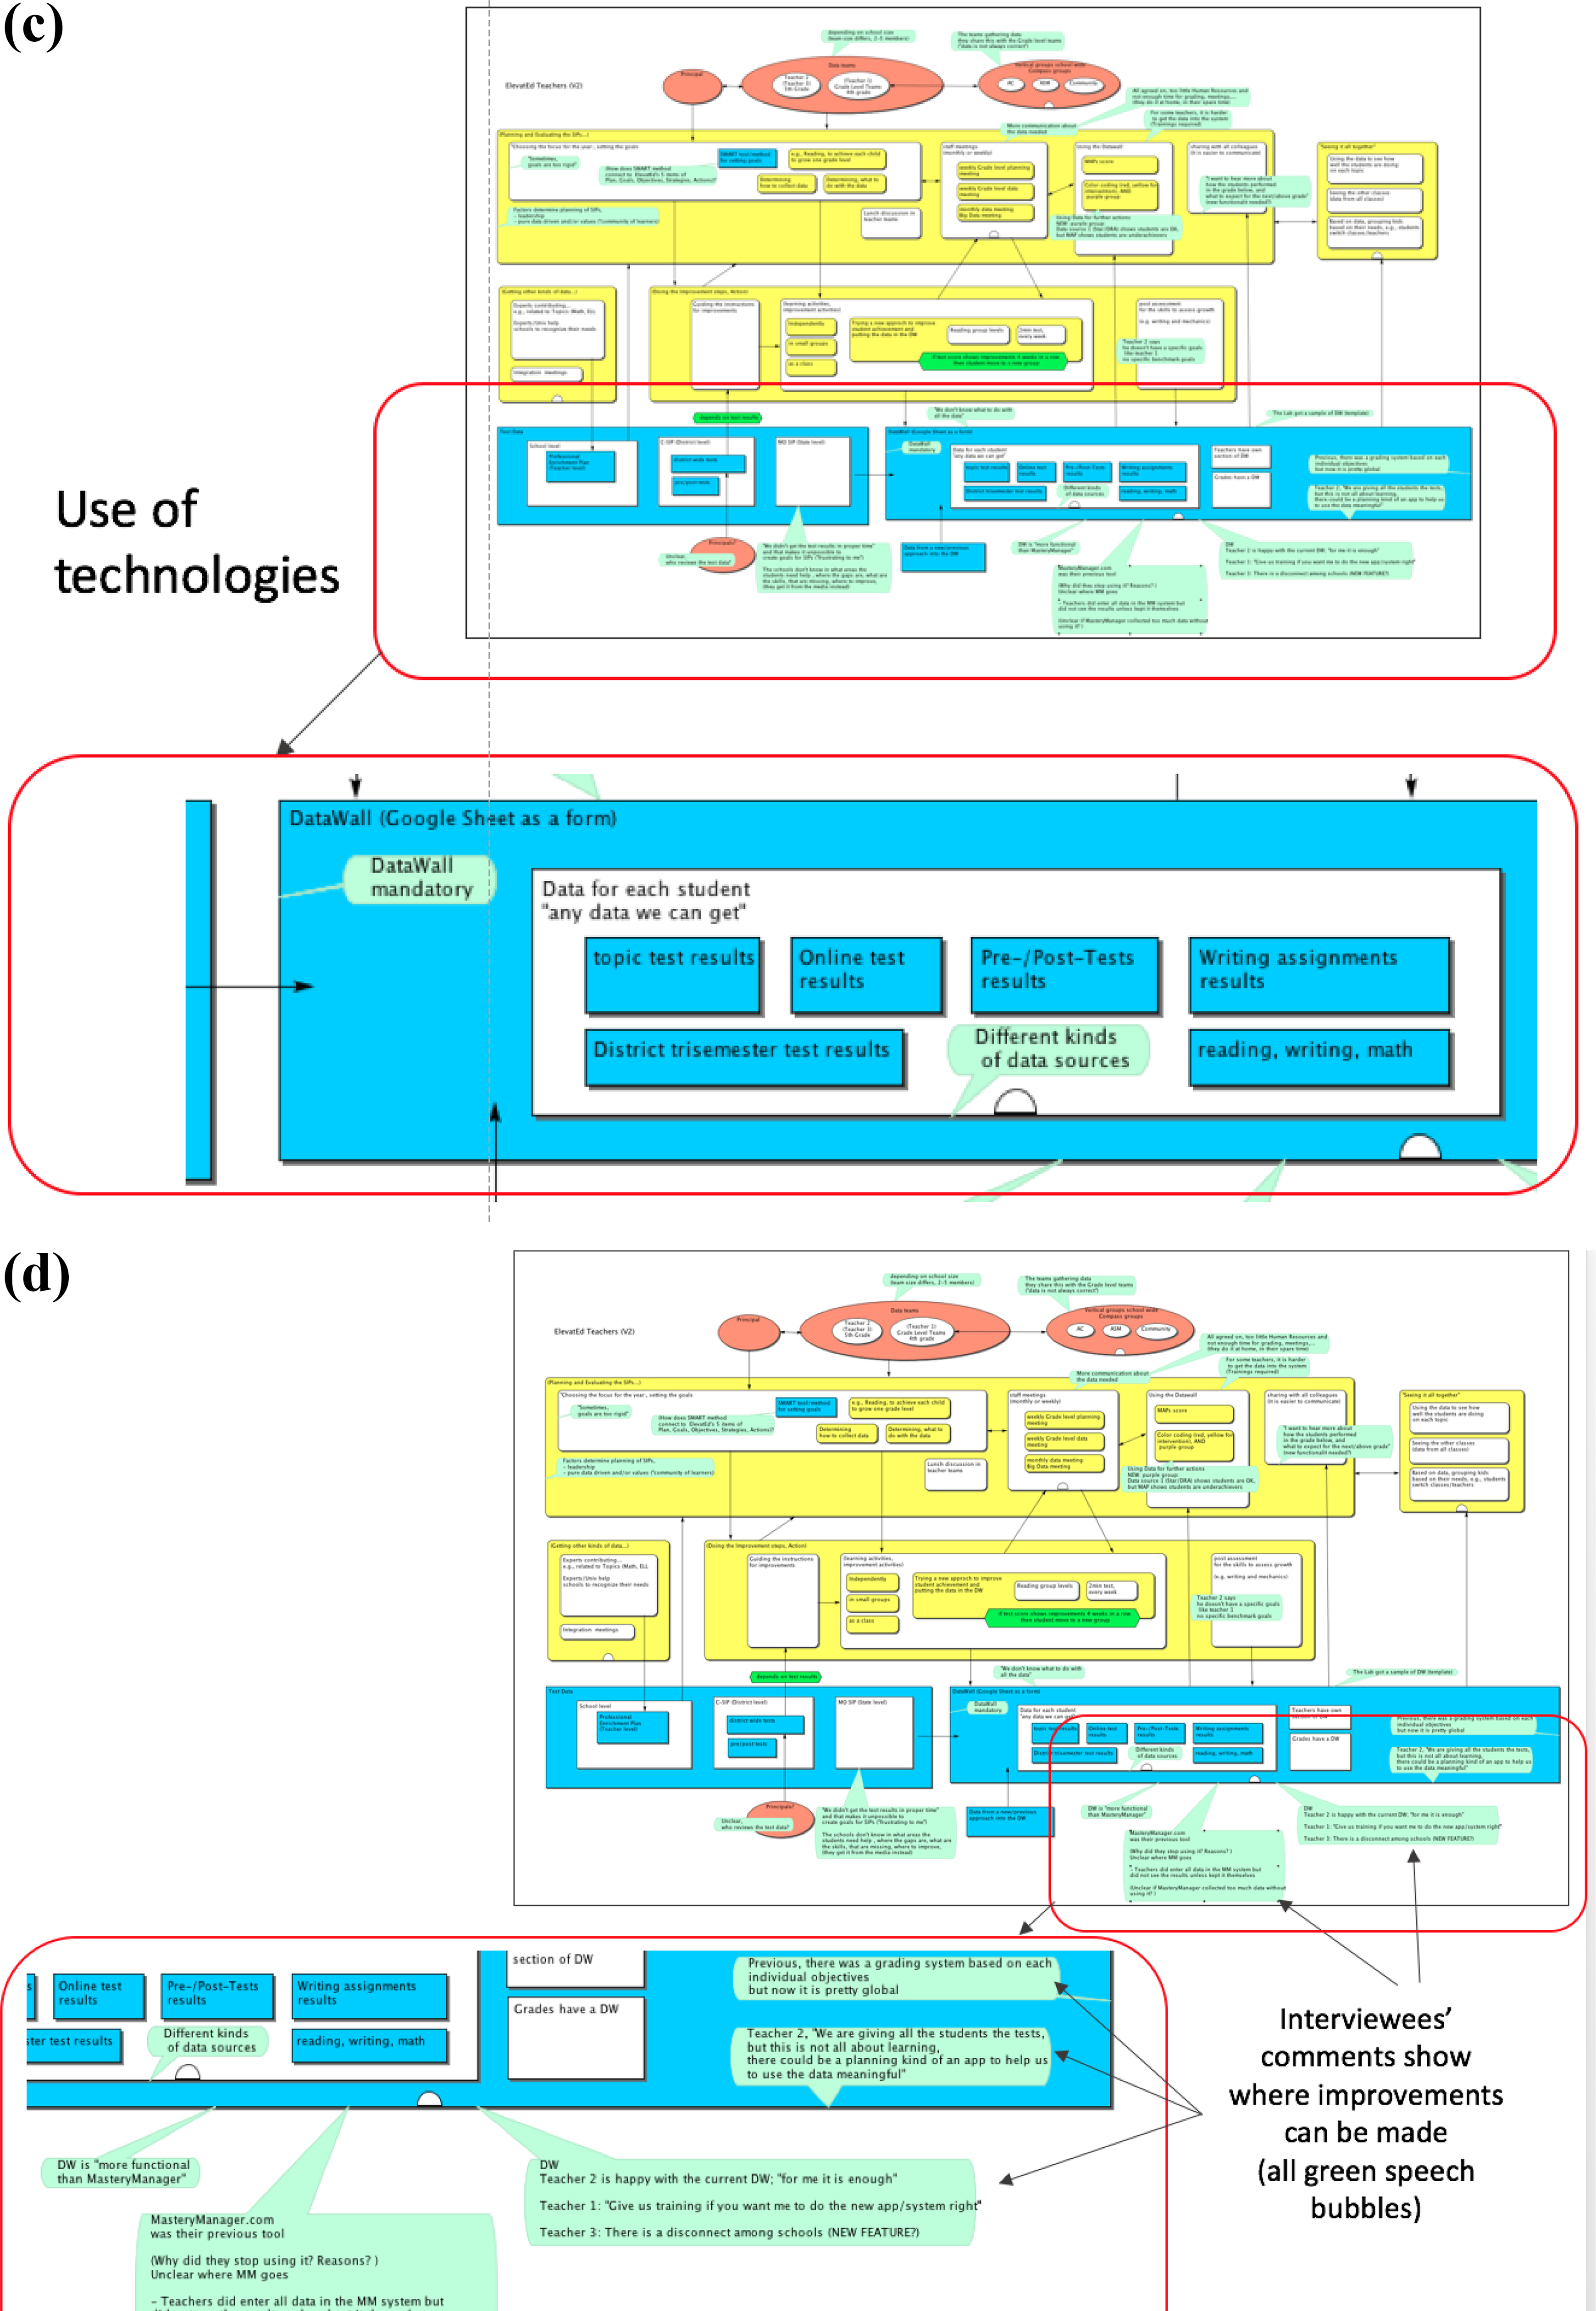
Entities (represented as blue rectangles)
Figure 1(c) shows the use of technologies in current SIP practices. The data are gathered from three levels: the school, the district (e.g. district-wide student test results) and the state. In order to manage the different kinds of data sources, data teams use a ‘Data Wall’ in the forms of a Google spreadsheet; it is a Web-based system to which all teachers have access at the same time and which they can edit at the same time from any place. The schools use data coming from each student and include ‘any data we can get’, for example, data from student test results, pre-/post-test results, topic test results and written assignment results. These tests established mean scores to assess and monitor student progress for a particular grade level at various points throughout the school year.
The SIP process relies on varying sources of data. Technology supports data storage and access. Data are stored in and accessed through the Data Wall, which was implemented district-wide in 2015. The Data Wall mandates each teacher to log and trace student test scores (e.g. Measure Academic Progress (MAP), Developmental Reading Assessment (DRA) and English Language Learners’ (ELL) assessment scores) and assignment results on a given topic. Because the Data Wall is in the ‘cloud’ with Web-based access, teachers are able to retrieve and trace their own student data anytime, anywhere. A previous system, called Mastery Manager, only allowed teachers to input data, not allowing them to use data to monitor student performance. Also, Mastery Manager was only available through the school intranet during school business hours.
Challenges and problems
Figure 1(d) shows where teachers identify needs for improvement. The comment tool (seen as green speech bubble in Figure 1(d)) indicates at which points in the process the interviewees argue for improvements. Overall, teachers comment on difficulties that resulted from the lack of established guidelines for the SIP process. The quality of the SIP process widely varies depending on leadership, and the subsequent improvement goals are often too broad or too rigid, not adapted to specific conditions of each school. More specific challenges related to difficulties in the use of multiple sources of data as well as dealing with collaboration and communication. First, teachers work with varying sources of student data hosted by different databases. This causes problems with data migration, on how to integrate the different data in a unified format to process the data. Without one unified database, teachers are obliged to retrieve student data from various systems and re-enter them into the Data Wall, partly they manually enter the data, which teachers perceive as time-consuming and redundant. Moreover, teachers do not receive test results on time to use them to evaluate student performance. Also, teachers do not gain access to the district- or state-level aggregate data. Therefore, teachers are unable to compare individual student test results to identify areas of improvements.
Another major concern relates to difficulties in communication. Teachers often meet face-to-face. Teachers prefer to communicate via email or Google Docs in order to exchange data with colleagues. Another communication barrier exists between schools in the same district. Teachers want to know how other schools implemented SIPs and, as noted previously, they want to compare their student performance across schools.
Model B: Current SIP practices from principals’ perspectives
In this section, we present the model of current SIP practices that principals 1 and 2 report. In this model, principals describe slightly different roles than the teachers (three vs. five roles). In addition, SIP support systems differ (Access Database vs. Data Wall). Their activities are largely divided into a committee-level practice and a building leadership-level practice. Both principals comment on difficulties in overseeing the SIP process; show strong interests in one unified data although they perceive that it is difficult and time-consuming for teachers to input data into that system. The detailed results will be presented along roles, activities and entities (existing technical systems and data sources).
Roles
The model created by principals 1 and 2 consists of five major roles: (a) principal, (b) committees, (c) school building leadership teams, (d) secretaries and (e) student groups (principal 2 only) (see Figure 2(a)). The principals are responsible for overseeing the entire SIP process. Committees consist of data teams, partners in education (e.g. school–business partnership) and teachers. Specific roles of committees vary across schools, but they typically address school-wide issues such as accountability and community partnership and contribute to school-level action planning for each SIP objective. School building leadership teams took charge of grade-level SIP implementation. They also mentioned the secretaries as having important roles in dealing with data input and coordination issues. Additionally, principal 2 involves students in the SIP for goal setting and learning improvements.
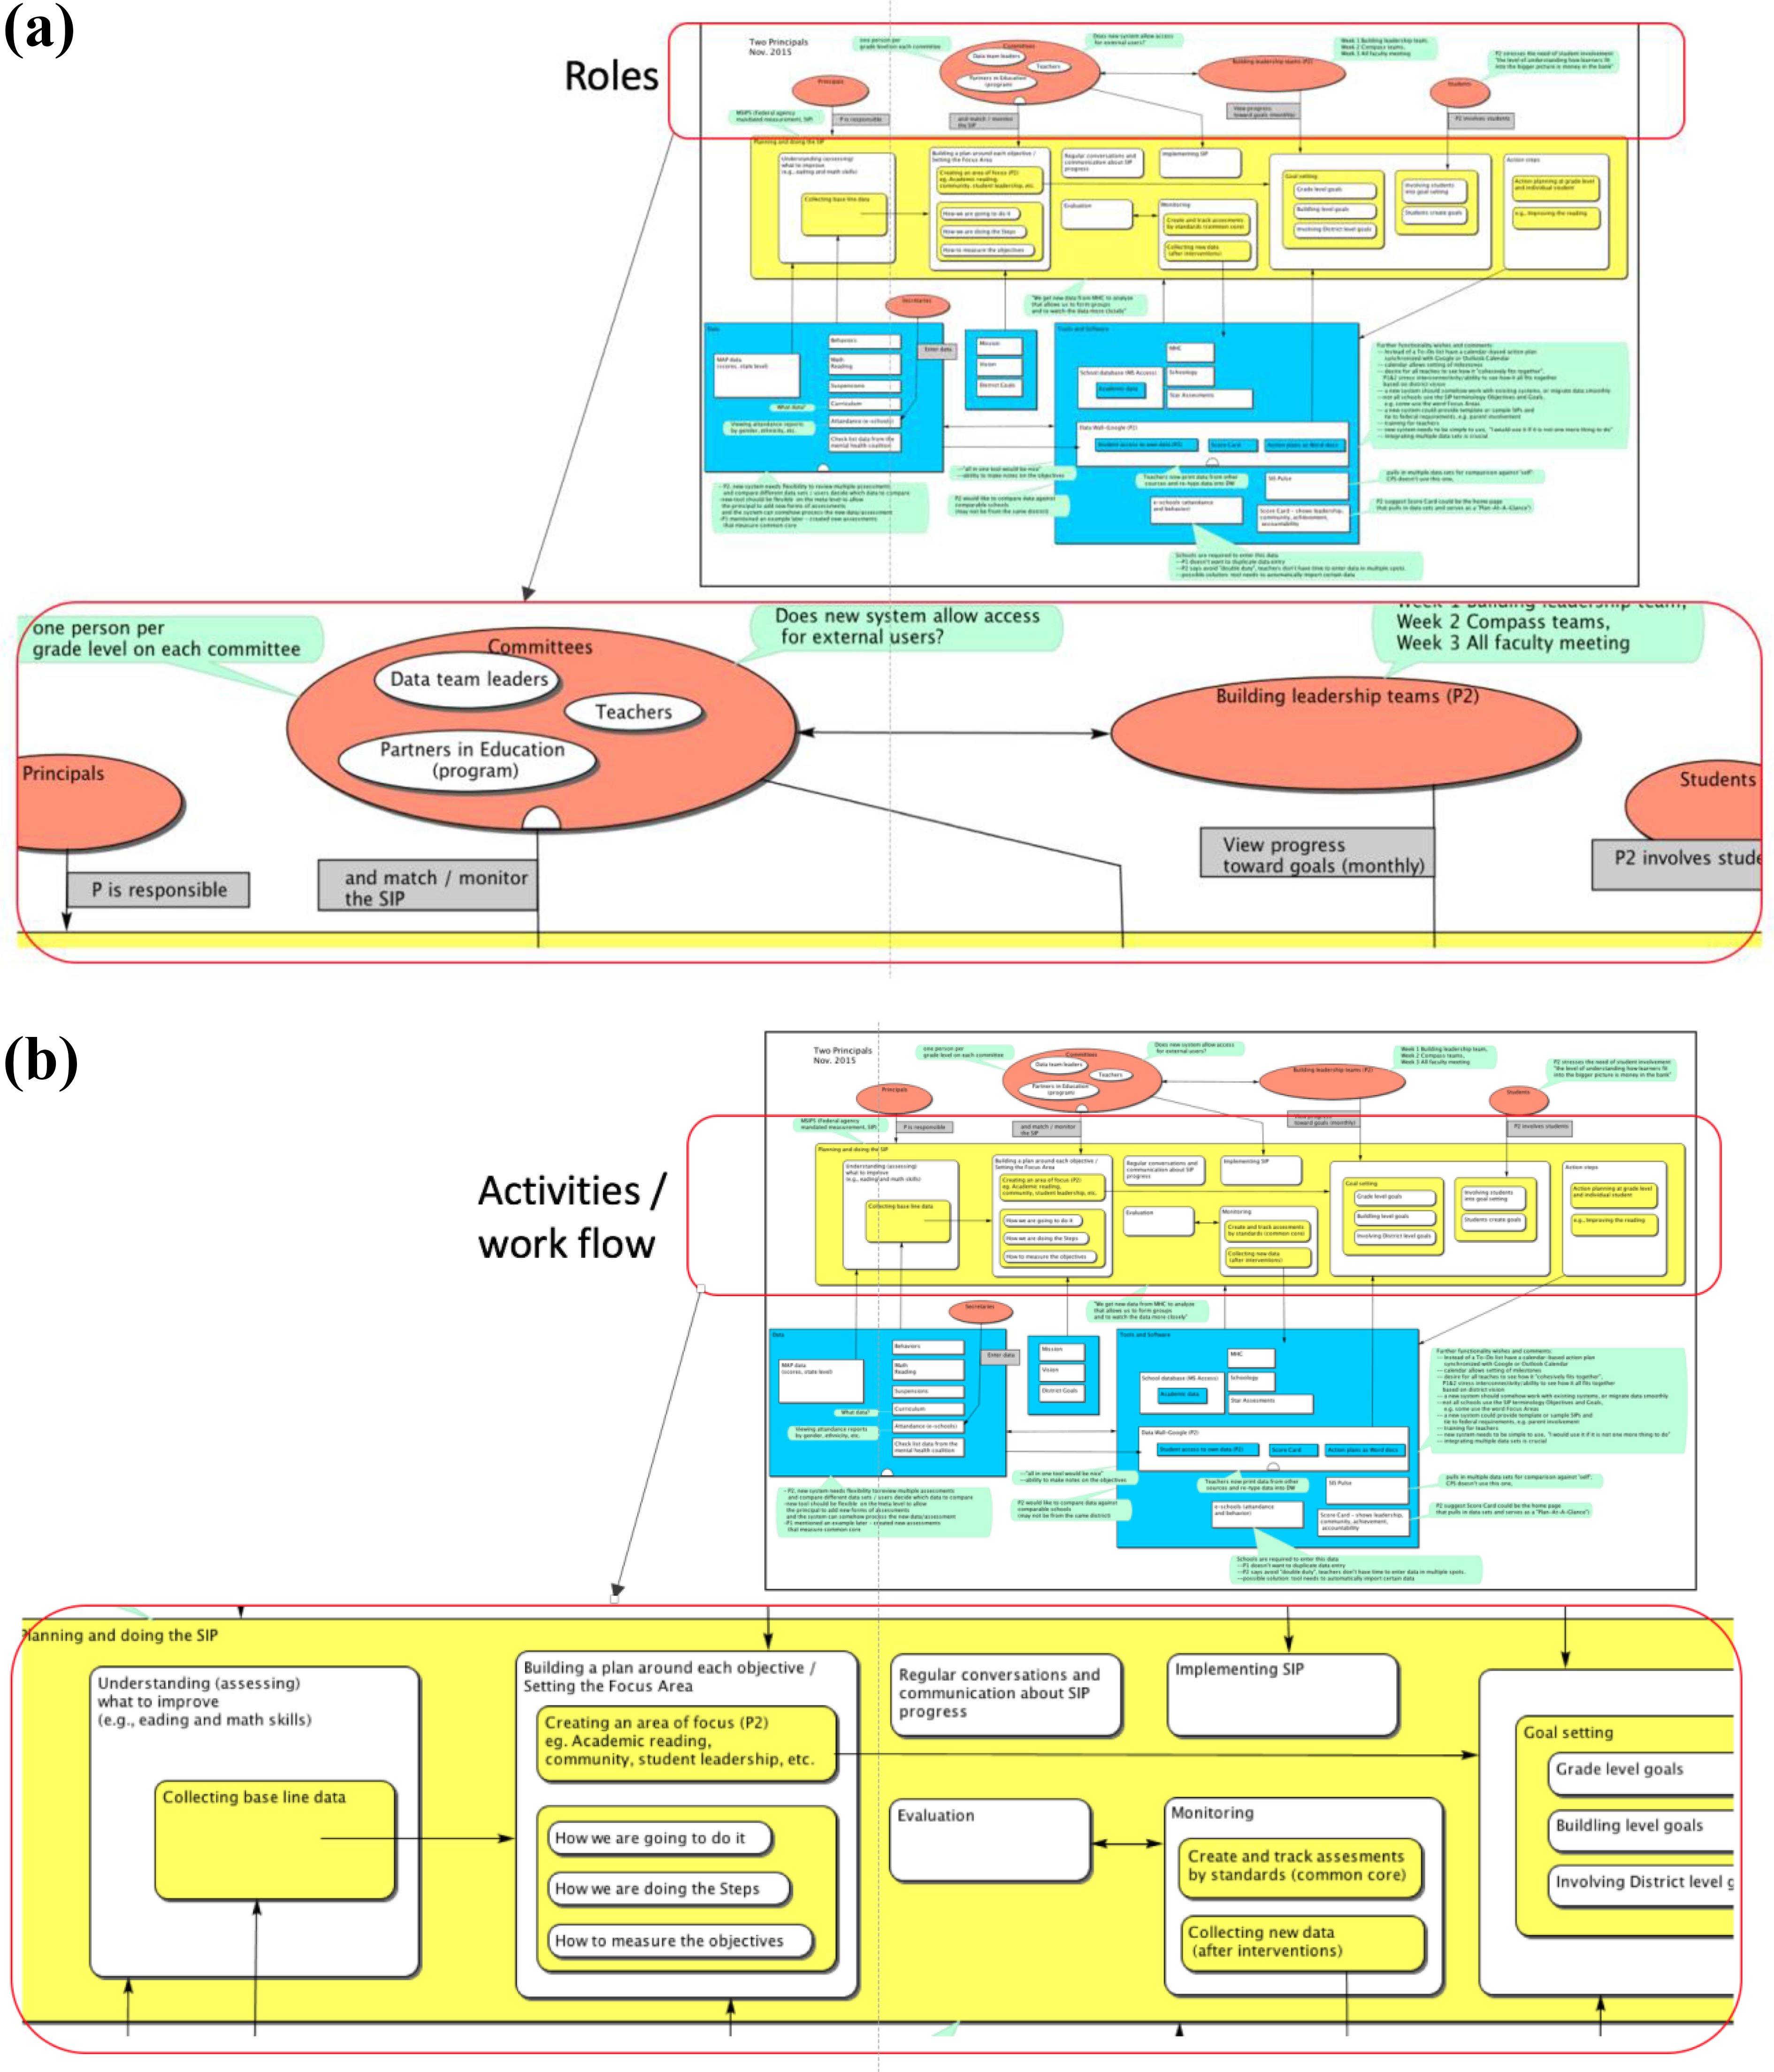
Model B: SIP practice from the view of school principals – (a) roles, (b) activities, (c) entities and (d) challenges. SIP: strategic improvement plan.
Activities
The development and implementation of the SIP involve complex workflows that engage the school personnel (see Figure 2(b)). In order to create their SIPs, both principals spend at least three weeks on their leadership teams ahead of time; they start the SIP process by ‘collecting baseline data’ and ‘understanding what to improve’. Then they engage the entire faculty body in discussing and setting the goals, objectives and actions.
Principals’ descriptions of the following eight SIP activities can be separated into two parts. Part 1 consists of three activities: (a) understanding what to improve, (b) setting a focus area and (c) goal setting. Part 2 focuses on implementing, monitoring by tracking student assessments, evaluation of the action steps and regular conversations about SIP progress. These activities are interwoven and do not follow a strict chronological order, rather it is a back and forth and the activities inform each other.
Like part 1, the principals ask the committees to ‘build a plan around each objective’ in which they create an area of focus on what to improve, how to do it (creating action steps) and how to measure objectives and SIP success. In order to learn what to improve, they use and analyse baseline data.
In part 2, leadership teams are responsible for specifying goals related to (a) grade-level goals (b) building (school-wide)-level goals and (c) district-level goals. Principal 2 additionally mentions that the school involves students and goals ‘created by students’. The action steps include specific actions for grade levels and for individual students, for example, how to improve reading. Once this is set, the committees implement the plan, monitor and evaluate it after the teaching interventions have been conducted. Committees monitor the progress by checking classroom evaluation results, tracking standardized tests and having ‘regular conversations and communication about the SIP progress’.
Entities
To create SIPs, principals capture an extensive amount of baseline data including student suspensions, attendance, mental health data and MAP, a computerized adaptive test that helps school administrators make informed decisions in order to set focus areas and goals (Figure 2(c)). SIP monitoring involves varying sources of data. These data are retrieved from a wide variety of technologies – for instance, Schoology (learning and assessment management system), eSchools (student attendance system), SIS Pulse (student information system that assists with the analysis of assessments), STAR Reading Assessment database and Score Card (school report system that shows metrics pertaining to school leadership, community, achievement and accountability).
To pool and access such extensive data in relation to SIP goals and objectives, principal 1 indicates that her school uses an MS Access-based school database; while principal 2 uses a Data Wall. Both principals 1 and 2 use Google Docs to create action plans.
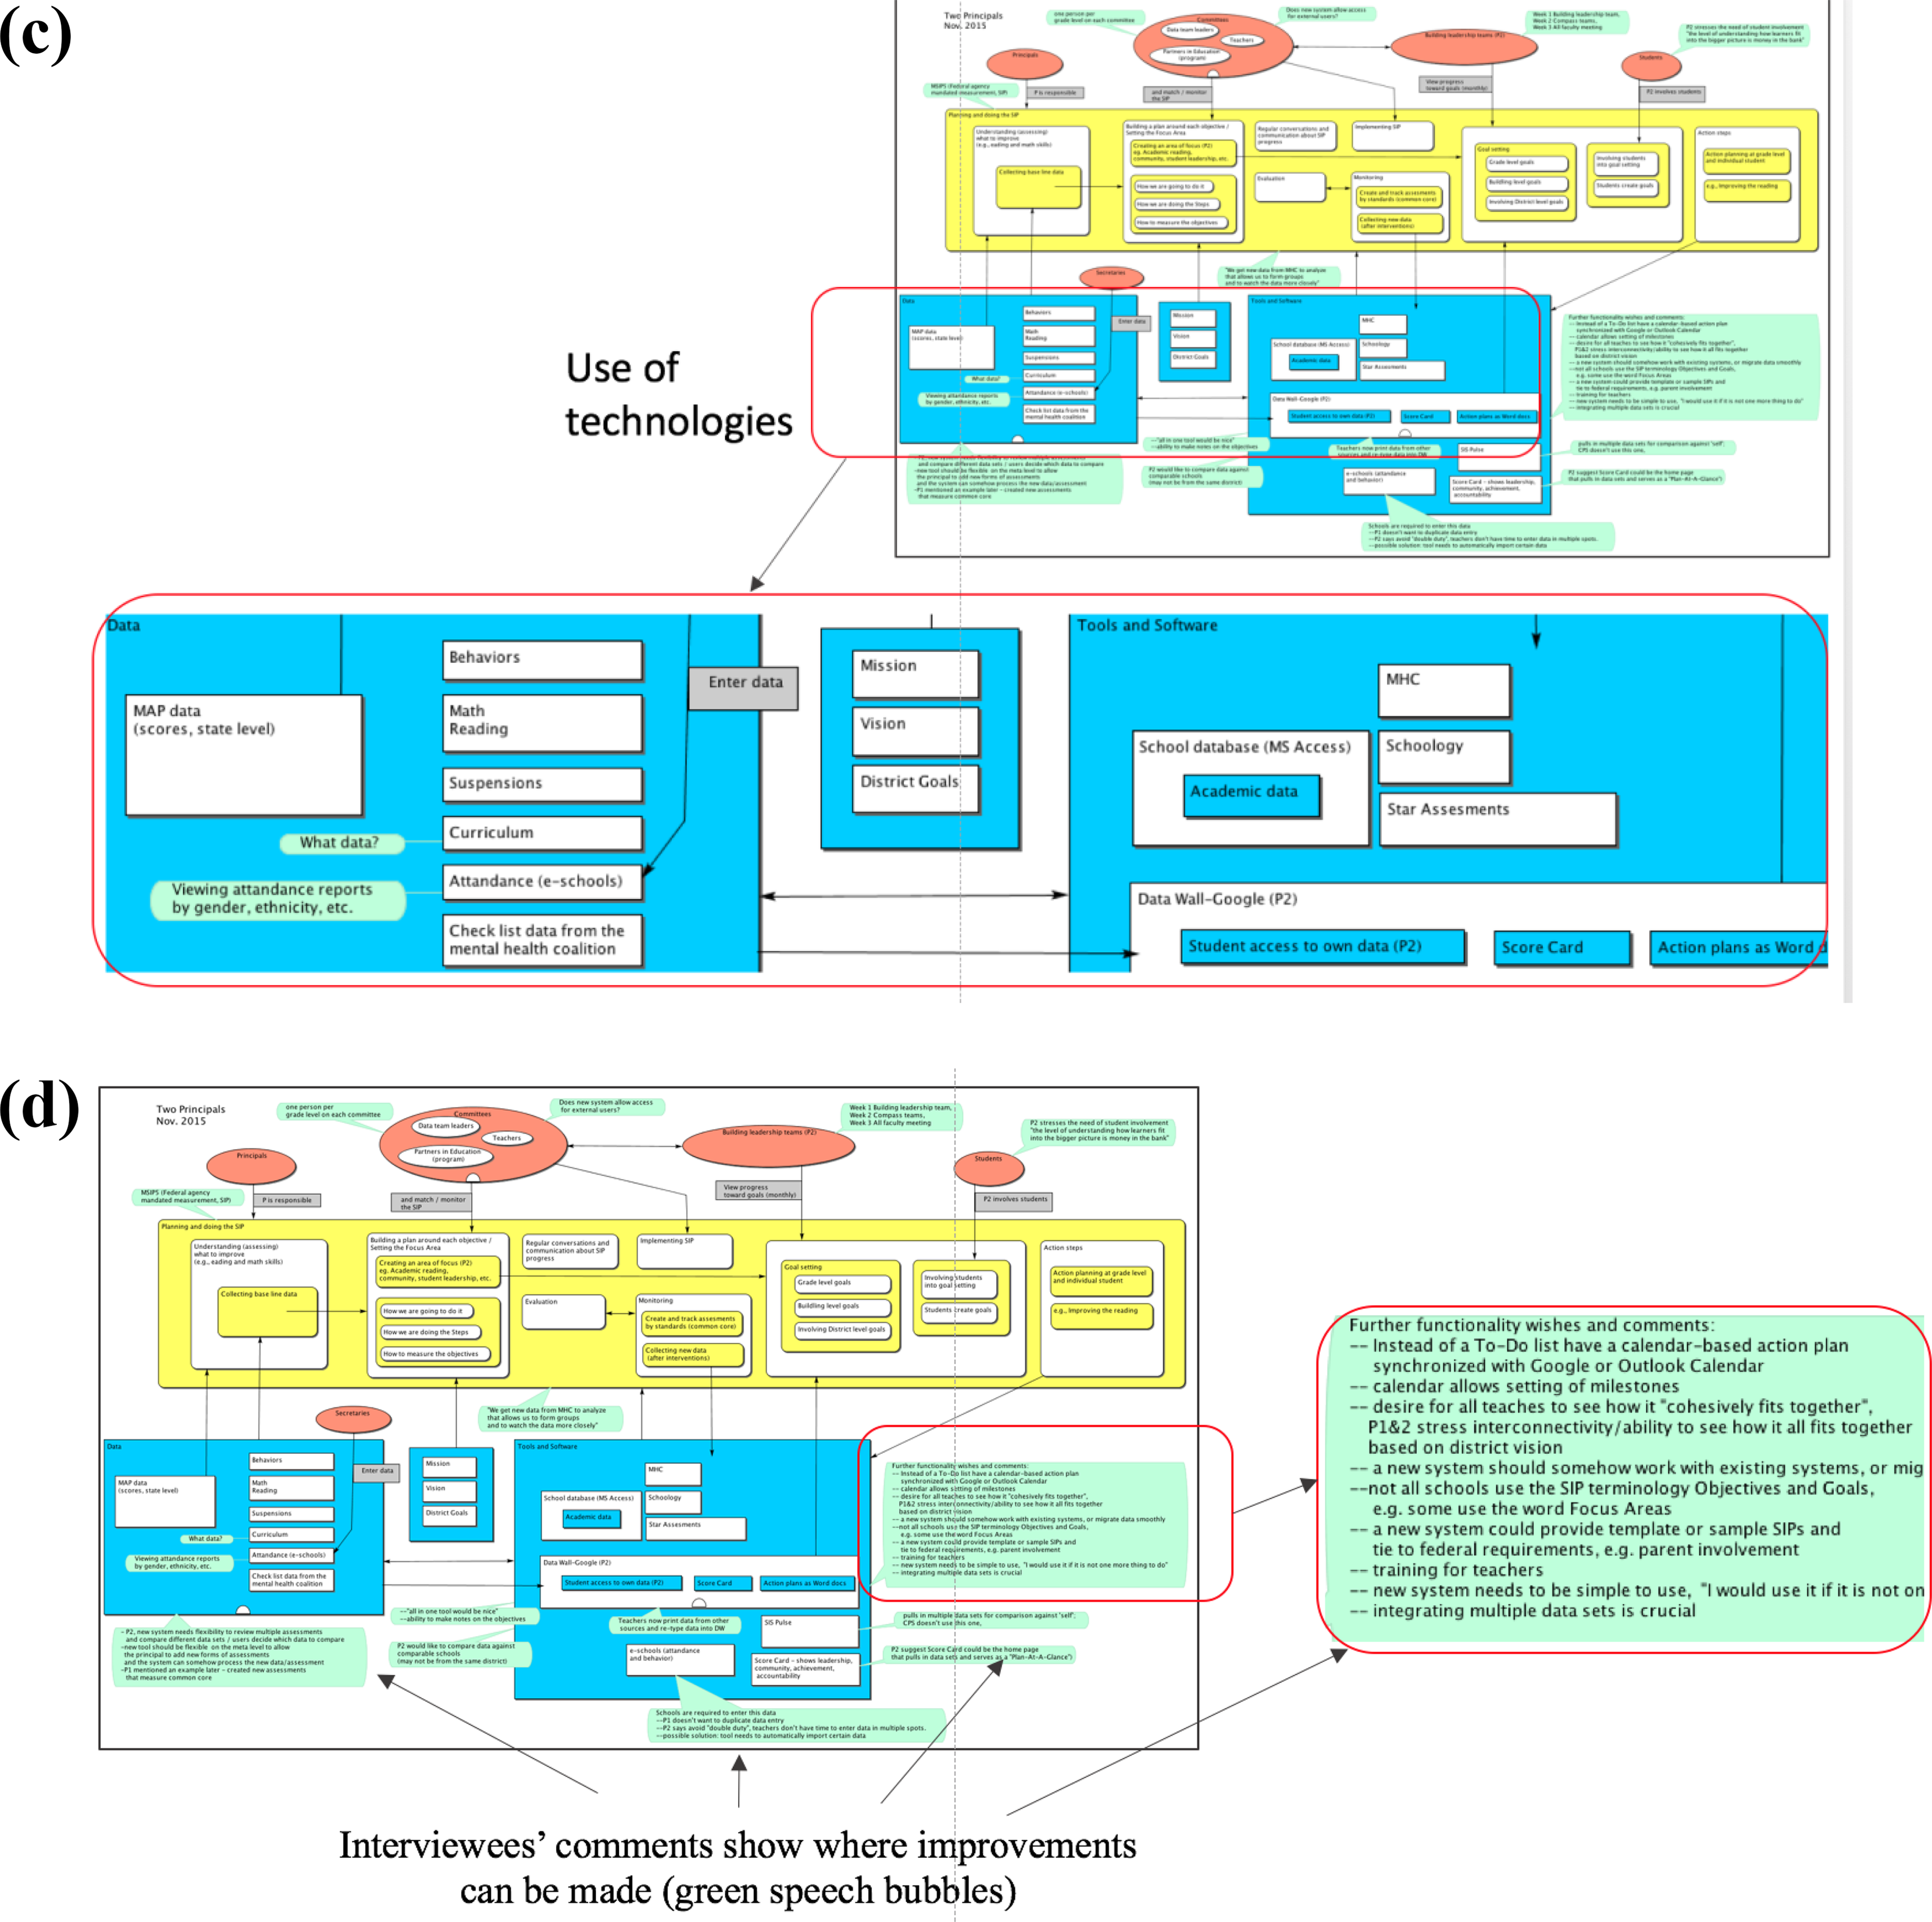
Challenges and problems
Both principals comment on difficulties in overseeing the SIP process and managing data (see Figure 2(d)). Generally, principals 1 and 2 define the SIP process as complex, but with no clear guidance to follow. Accordingly, their description of their SIP practices often exhibits indistinct or unordered activities with unclear or disconnected links between activities. Principals want access to the SIPs of other schools in order to learn from them and possibly simplify their own SIP process; they also want to compare their goals and objectives with other schools of similar standing.
The most serious challenge is related to data collection and management. Both principals mention that their data are retrieved from different sources of databases that do not ‘talk to each other’. Teachers, secretaries and other staff have to print out the data sets from these systems and then retype them into their school SIP database, which was perceived to be an overwhelming extra step for staff.
Model C: Current SIP practice from a middle school principal’s perspective
While the teachers and principals in models A and B are from elementary schools, this principal leads a middle school. As shown in Figure 3, principal 3 identifies three primary roles contributing to her school SIP; her school uses a Google shared folder as SIP support system and follows the six steps of the Decision Making for Results (DMR) model (Kaufman et al., 2014), which is distributed by the Missouri Department of Elementary and Secondary Education. Still managing and using quality data constitute a major concern.

Model C: SIP practice from the perspective of a middle school principal. SIP: strategic improvement plan.
Roles
Principal 3 identifies three roles: (a) principal, (b) leadership teams and (c) specialist groups. The principal forms leadership teams, which are comprised of teachers and experts from academic institutions in the region who provide advice on school SIPs. Specialist groups comprise teachers with a speciality in specific subject areas such as reading. They contribute to planning specific strategies aligned with SIP goals in their speciality areas.
Activities
Principal 3 has received training in the DMR, a data-driven decision-making model. Accordingly, the school mostly follows the DMR process. Her current SIP steps include (1) treasure hunting (collect and chart data), (2) analysing the data (looking at areas of strength and concerns), (3) brainstorming what might cause the concerns, (4) prioritizing, (5) goal setting, (6) creating strategies and selecting, (7) identifying and tracking of result indicators and (8) monitoring.
In detail, the principal and leadership teams initially collect and chart existing data from the previous academic year. Then they analyse the data to check the areas of strengths and concerns; brainstorm to understand contextual factors such as poverty; prioritize expectations by a card-sorting method. After narrowing down their priorities, they set SMART goals for student achievement, which guide the subsequent strategies selection. Strategies include more or less broad organizational directions, resource choice and specific instructional approaches which varied depending on student progress and needs. In this step, specialist groups (e.g. reading specialists) are engaged in proposing targeted instructional strategies (e.g. reading interventions) or resources to improve teaching and learning. With specific goals and strategies established, result indicators are selected and monitored throughout the school year.
Entities
Principal 3 created a progress-monitoring tool using a shared folder in Google Drive to connect all the different data sets, which is a ‘very fragmented, long list of files and long narratives’. A wide variety of data sets are stored there including student behavior data (discipline), attendance, classroom observation data, student achievement data (e.g. STAR reading and math scores; state-level achievement test scores) and special subgroups data (e.g. low reading-level groups). To log and monitor the progress of the SIP, teachers at the school use Word, Google Drive files and Excel spreadsheets, which are retrieved from a variety of external systems such as the STAR assessment tool.
Challenges and problems
Principal 3 reports challenges related to managing and using quality data. First, similarly to principals 1 and 2, principal 3 faces challenges related to managing the vast amount of data. Although her school uses Google documents and shared folders, there were still varying sources of data stored across different systems. Principal 3 indicated that the data retrieval across multiple platforms is a time-consuming task as the first step and as the second step she needs to enter the data into Google Docs. ‘It feels like an extra step’ she says. Even for the pooled data, principal 3 is concerned about this kind of technical solution, it is fragmented, has long lists of files and long-narrative Word documents in unorganized subfolders, which proliferate throughout the school year. Another problem derives from difficulties in access to legacy data. Although her SIP is built on data from the previous year to set priorities and goals, the previous year SIP data, which were in charge of the past principal, are not properly archived. These data sets are stored in various systems, making it difficult to transfer the data into one meaningful SIP structure or migrate data to a unified system, identify goals and result in indicators and track them seamlessly. Finally, a more serious problem results from a mismatch between indicators/data (testing) and SIP actions (curriculum). As principal 3 comments ‘there is a disconnection between what we (the school) are testing and what we do in teaching in reality’.
Discussion
With the help of a modeller and an interviewer, the interviewees created three models from six different SIP practices in their schools. The results reveal that schools have overlaps in the same roles, activities and technology usage but also have differences. All participants made similar comments on the need for a streamlined guideline for SIPs, unified data management and access to technical systems. Such similarities and distinctions enable sociotechnical negotiations and co-evolutionary growth for future service support systems. We summarize the findings around important themes and then, in the next section, we discuss the implications in terms of design recommendations for an STS with a human-centred design approach.
The range of SIP practices from ‘very clear’ to ‘not clear’
While model C (principal 3) clearly demonstrates a high-level process with transparency in each SIP activity, models A and B contain relatively unexplained or disconnected activities. The owners of activities and their roles are somewhat unclear; data input, processing and its feedback loops are also relatively unclear. We argue that such lack of clarity or lack of transparency results from social and technical elements that are not ‘playing together’ rather than from a lack of management (Herrmann et al., 2007). For instance, model C shows an SIP that is streamlined following the six steps of the DMR model. The first step builds on the previous year’s data (input); principal and leadership teams (roles) determine the school strengths and weakness (output), which feed the next step of goal setting and action steps for improving teaching and student learning. Principal 3 created her own ‘progress monitoring tool’ to support data flows. On the other hand, activities in model B are relatively redundantly described for the committee and building leadership levels. There is a lack of clarity in terms of communication and data links between two levels. As a result, principals 1 and 2 report difficulties in overseeing the process. Overall, the lack of transparency of a clear SIP process supports the need for a sociotechnical solution that coordinates the social and the technical components together.
Multiple roles and activities
Each school practice involves various roles and SIP activities. Such diversity indicates the need for leadership and coordination as well as flexibility in system support. For instance, roles range from principals, committees of teachers, secretaries and external experts to students and parents. Activities include goal setting, data collection, staff meetings, expert advice, SIP implementation and monitoring. Because such involvement of multiple roles and activities increase complexity in communication and collaboration, leadership and coordination are needed to create requisite structures to oversee the entire process. All principals comment on creating teams and providing strategic directions; however, principal 3 is following straightforward processes in terms of streamlining her school SIP practice following her training in a data-driven decision-making model.
The findings also support the need for flexibility in SIP support systems. Roles and activities in each model are organized differently to address specific needs and distinctions in each school culture. However, existing systems lack such flexibility. For instance, some participants complain about their prior system because it either did not allow teachers to use data to track student achievements or it was not possible to have Web-based access from places outside the school such as cloud technology can offer. When schools want to involve certain roles (e.g. students), then related systems should be programmed to allow different roles to gain access. Also, the data show that schools need flexibility in adding activities (e.g. conversations and advice with experts) into the technical system, which means that the technology should have the functionality to add new forms or activities. New systems require the flexibility to adjust to different activity chains being included.
Complex, yet missing: SIP data analysis
All participants perceive their SIP workflows as complex; however, they all agree that data integration is key to each step of the SIP process. Model A includes integration meetings as part of their SIP workflows, in which they sought external expert advice on data usage. Models B and C all start their workflows by ‘collecting baseline data’. Still, most of the participants miss the step of data analysis; they are not able to articulate how they integrate the data or say that they enter the data manually. For instance, schools set most of their goals in terms of student success (i.e. reading and math skills), but participants argue that they need support on how to make sense of student data. Their technology usage is limited to data collection and consolidation; there is no comment by the interviewees on technology usage for data analysis, for example, learning analytics tools.
Extensive data and lack of overall technical support
All of the models show that schools are already using technology for coordinating SIPs, for example, Data Wall and MS Access database. However, the current work process lacks an overall technical support system. In models A and B, participants perceive the process of creating, implementing and monitoring school improvement plans as complex without an existing well-formed procedure. Moreover, the current SIP workflows suffer from a mix of different data sources. Participants complain about accessing, collecting and processing quality data in time for proper decisions to be made. The findings supported the potential benefits of a new technical system that (a) streamlines and guides the process of planning, implementing and monitoring school improvements and (b) overcomes the diverse set of data sources by unifying data access and guiding analytic approaches.
Participants’ wish list
This study was conducted with six teachers and principals demonstrating six school practices. Although the usability literature argues that as few as five users are enough to determine the majority of design problems (Demir et al., 2017; Nielsen, 2012), more participants would be beneficial in order to generalize research results. However, this study with its small sample size addressed the complexity of the current practices and demand for a new digital tool for more straightforward SIP management.
The participants of the study give a list of wishes that refer to the technical functionalities or organization and coordination of the SIP process. Figure 4 lists some of the details. For example, a calendar-based action plan synchronized with the existing calendars of teachers, principals and other involved roles, allowing for setting milestones and due dates. There is strong desire to see the bigger picture of the SIP, how the teachers’ classroom action contributes and how their revised teaching and learning practices contribute to overall school improvement; they want to see how it all cohesively fits together. Technically, they want to see examples of good SIP practices and they want a new system that offers them a template or gives them ideas. The technical system should be simple to use, at best without any training.
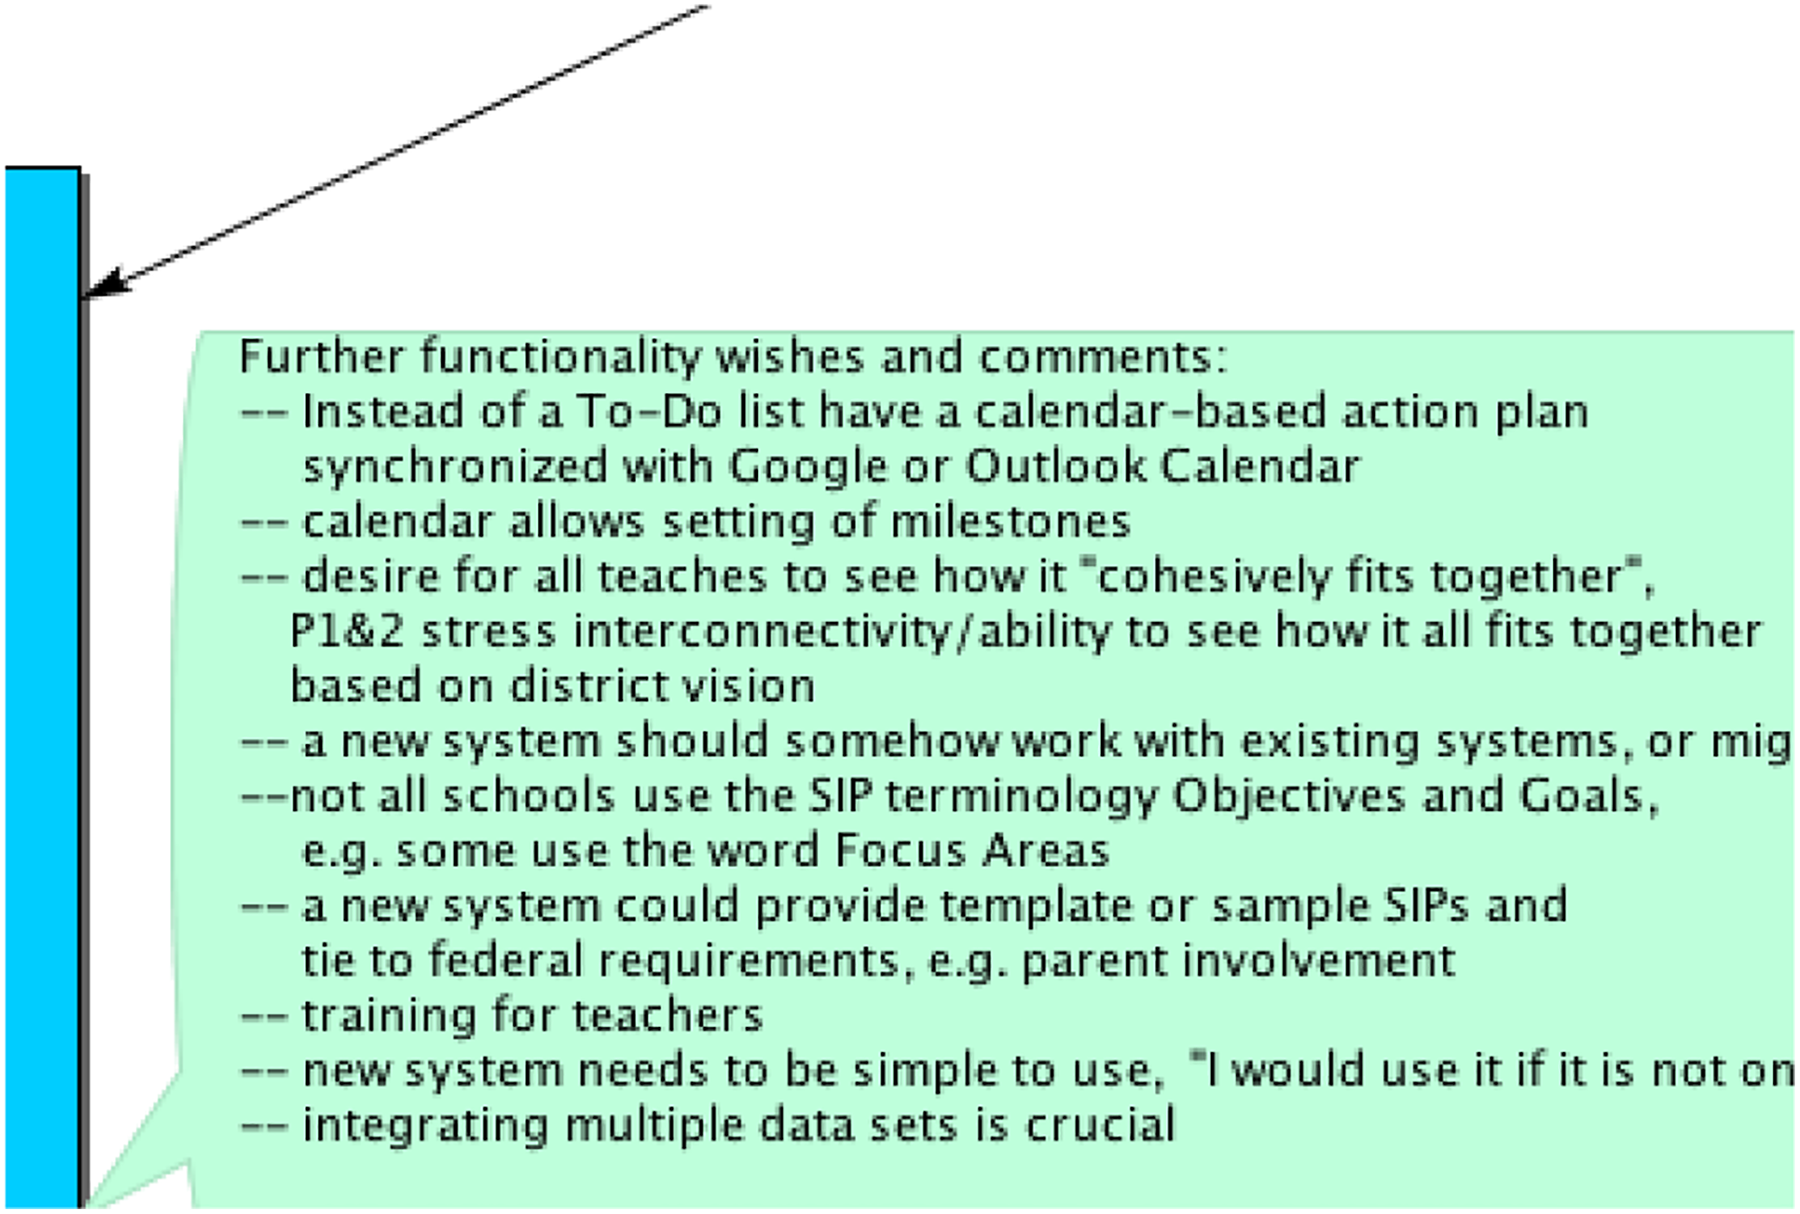
Principals’ and teachers’ wishes when creating a new sociotechnical system.
Implications and limitations
The analysed current SIP practices indicates that there is room for improvements regarding a new STS as well as a collaborative approach to such a design with users. We discuss study implications and limitations in the following subsections.
Design recommendations
Five of the SIP practices show various different types of processes by each individual participated in this study, which indicates that an organizational guide is needed to help to create, implement and monitor SIPs. The guide can be provided in the form of (a) a separate training opportunity, (b) an asset in the SIP support system and (c) a clear but adjustable structure integrated into the system. The last point of flexibility is important for future success. Each school has slightly different cultures, and therefore, in order to be successful in terms of teacher and user adoption, a new STS cannot be managed only with the orders from the top-down but rather needs social conventions and rules in which the technical system has functionalities for adjustments.
The structure of the system should meet the five requirements as suggested by participants in this study: clarity, flexibility, communication, no redundancy and data analytics. First, all of the required SIP activities or steps, related roles and entities need to be clearly communicated and streamlined. Goals, plans, actions and results need to be seamlessly connected such that anyone can easily trace their history to find and predict areas of strengths and improvements. Related data need to be properly indexed as well. Second, the system structure needs to be flexible enough for users to customize (add or drop) roles, activities and entities in the generic workflow. This is because each school practice involves different roles, activities and entities, and the SIP workflows are dynamic and changeable over time. Third, the system structure needs to allow interaction between different technical systems and communication between different roles. Technical communication between different data sources is the most highly suggested functionality. Such functionality allows users to track student performance and devise interventions in time. In addition, communication of SIPs between state-, district- and school-level systems is needed, so that each school can easily identify district goals and strategic directions and customize them accordingly. Schools also can benchmark other schools to find the best SIP practices. In terms of communication between different roles, participants suggest having multiple means to organize meetings and share data. The fourth recommendation, which is also related to the third one (communication), is to decrease redundancy in the process. Participants complain about having to retype data in a shared space to create unified data access. The new system structure may automatize some of the redundancy and support data migration from a variety of different sources. Finally, data analytics is the least clear component in the current SIP workflows. A new system needs functionalities to retrieve, process and analyse data from different data sources. Specific methods and techniques can be included to identify students in need of help ahead of time and monitor their growth over time.
Collaborative design approach
The collaborative design approach aimed to create collaboration between designers and end users during the design process of a system (Demir, 2011). Users’ satisfaction is one of the key factors that denotes the success of a product and the collaborative design approach seeks user satisfaction during the designing activity (Demir et al., 2012). According to the user-centred design philosophy, users’ demands, needs and expectations should be the main focus while designing products (Demir and Hernandez, 2018).
The current study argues the need for a collaborative approach to the design of an SIP support system as a sociotechnical system. The design approach not only helps to capture diverse user experience, shared understandings and different perspectives but also allows users to be ready for the upcoming transition to changes in roles, activities and entities. This approach can be also utilized to build leadership. While sharing experience, for example, participants in this study had opportunities to articulate and reflect on implicit workflows, to exchange practices in different schools and to comment on new system functionalities. All stakeholders together have contributed to designing and understanding a new emerging, sociotechnical system.
As is shown in the cited examples in this study, a successful collaborative approach to creating a new sociotechnical design needs to be implemented by the participation of end users, those including education professionals who are in charge of creating SIP, implementing, monitoring and reporting. The demands of the users would enlighten the processes, requirements and guidelines and hence lead to creating a useful and usable product for all.
Limitations
The research has been conducted as a pilot study of a larger design study. The goal was to provide a concise picture of the current practices of strategic improvement planning (SIP). Therefore, the sample was limited to six teachers and principals representing six school practices. Usability literature argues that five users are enough to find 80–90 per cent of the major problems in technologies (Demir et al., 2012; Nielsen, 2012). Nevertheless, for a more comprehensive understanding, a stratified sample needs to be recruited to represent different populations and school levels (e.g. high schools). District leaders can also share different perspectives. However, this small sample already points to major issues for a new SIP support system. More participants would probably verify them.
Conclusion
It is well known that schools use a variety of data sources from various information systems. When schools conduct strategic improvement planning (SIP) activities during each academic year, one of the central challenges has to do with integrating the highly diverse set of data sources. Another challenge is the creation of a technical system with an interface that enables different users to add and manipulate data and to create a learnable STS. The success of such a new SIP system depends on how well the different social and technical elements are integrated and aligned with each other.
We have analysed the integration of technology in schools from a process view by using the STWT method, which has the flexibility to integrate different perspectives of participants. The documentation of the results shows a shared understanding and integrated view of different participants which helps to identify and to promote the development of a new sociotechnical system or make adjustments to existing systems (Herrmann et al., 2007). By applying this method, our results have shown the variety of processes, overlaps and differences of current SIPs in schools as well as the challenges schools encounter when implementing SIPs. Finally, we identified major design recommendations that may help to develop a new ‘coherent whole’ towards a new sociotechnical SIP system in schools including its underlying processes and roles. These design requirements may inform usability and user experience studies as well.
Footnotes
Acknowledgements
The authors thank the SeeMe development team at the Ruhr-University of Bochum, Germany, and especially Thomas Herrmann, the founder of the SeeMe modelling method, who gave them access to the SeeMe software tool. The authors also thank the Hook Center at the University of Missouri for this study that was part of their larger project called ElevatEd.
Declaration of Conflicting Interests
The authors declared no potential conflicts of interest with respect to the research, authorship and/or publication of this article.
Funding
The authors received no financial support for the research, authorship and/or publication of this article.