
Abstract
With proliferation of web surveys, the relative affordability of recruitment, and increasing nonresponse in other survey modes, nonprobability methods are increasingly being considered by researchers and government offices alike. However, research needs to more fully understand how the demographic characteristics of respondents may depend heavily on the source of sample, mode of recruitment, and context of the survey experience. As a first step in exploring the potential implications of recruitment source on response quality, we use data from a web survey fielded in 2013 to compare data quality indicators in survey data from the two recruitment platforms (Google and Facebook advertisements). In so doing, taking into account demographic differences that may arise from various steps in the recruitment process, we explore the effect of demographics, device and technology usage, incentives, and recruitment platform on data quality and response strategy. Our results show differences between platforms in comparability to national benchmarks, breakoffs, completion time, nonsubstantive answers, and numeric response strategies. Importantly, some variation in substantive responses was explained by demographic differences related to mobile device usage, which varied by recruitment platform. With the use of nonprobability samples on the rise, future work should build from these results to more directly assess the role of recruitment source in data quality.
The rapid evolution of web-based technologies, coupled with the decline in response rates across traditional modes of data collection, has left social scientists asking how to best adapt to changing times while retaining the quality of the data collected (Stern, Bilgen, & Dillman, 2014). While new modes of data collection and potential sampling frames abound, the question of how to balance the need for representativeness with the efficiencies and opportunities provided by online nonprobability samples remains. Although considerable research has investigated methods of adjusting such data to match probability-based “gold standards” and assessing cost savings and fitness for use among particular populations and research aims (see Link et al., 2014), less energy has focused on understanding differences in outcomes between recruitment sources, particularly with respect to data quality.
Lines of research into nonprobability sampling methods and the use of emerging technologies in survey research have expanded rapidly on their own; both fields inform a discussion of how best to utilize the online habits of most Americans in reaching them for survey participation. Internet recruitment of self-selected participants in a web survey can reach a specific population quickly, cheaply, and efficiently (Stern et al., 2014). However, key demographic differences often emerge when assessing characteristics of the general population versus Internet users, Internet users versus those targeted via a specific site or method, and those targeted versus those who decide to respond (Stern, 2013).
Using data from a series of experiments conducted by NORC at the University of Chicago in 2013, we assess the implications of using recruitment techniques designed to reach one portion of the online population: Advertisements placed on Google and Facebook. Search engine and social network site use are two of the most popular online tasks, with Google and Facebook dominating traffic in each. However, while fielding a survey in these two settings is typical of multichannel nonprobability efforts, it also places the survey invitation in specific, and different, contexts. In this analysis, we explore whether these differing contexts might produce data of varying quality across recruitment platforms, assessing their viability for use going forward.
Theoretical Background
Social media and search engines can be used for two purposes in the context of survey research: to gather and analyze data through both passive means (data scraping, organic/big data analysis) and to actively collect data from users (see Stern, 2013; Couper, 2011). We focus on active data collection, leveraging cost and efficiency benefits while assessing compatibility with more traditional modes of data collection. Recruitment and collecting data from hard-to-reach populations is particularly suited to such online, nonprobability techniques (e.g., Mook, Wood, Harrington, & Skaff, 2013). Birnbaum (2004), for instance, notes that nonprobability samples may provide advantages in recruiting hard-to-reach samples over probability designs, but mixed results prevail. Graham, Bock, Cobb, Niaura, and Abrams (2006) noted low yield rates for a given amount of effort compared with off-line recruiting methods; in contrast, Gordon, Akers, Severson, Danaher, and Boles (2006) found Google ads to be more effective than e-mail contacts. Dewaele, Caen, and Buysee (2014) have shown that even among hard-to-reach populations, the within-group variation can be profound when samples are drawn nonprobabilistically as compared to probabilistically. In the case of recruitment via Craigslist (an online site in the United States where individuals sell used goods and services among other uses), the technique proved more cost effective in gathering survey participants than other platforms but less so in representing eligible target populations (Ramo, Hall, & Prochaska, 2010).
Even though the vast majority of Americans use search engines and social networking sites, nonprobability designs desiring results that generalize beyond a specific community of site users may fall short. Ninety-one percent of online adults (73% of all Americans) used search engines; of search engine users, 83% reported using Google most often (Purcell, Brenner, & Rainie, 2012). Social networking sites attract similarly high numbers of users, with 73% of all online Americans using one as of 2013; 71% of all online Americans use Facebook (Duggan & Smith, 2013).
However, selection bias introduces differences in surveyed populations even before the survey request is administered. High proportions of young (83% of 18- to 29-year-olds and 77% of 30- to 49-year-olds), female (71%), and urban (70%) Internet users use social media (Duggan & Smith, 2013), but notably, not all social media sites reach the same population. Women, younger adults, and those with some college education were significantly more likely to be Facebook users as of 2012, while similar patterns tend to hold across social networking sites, other sites (e.g., Twitter, Instagram, Tumblr) garner significantly different distributions on race/ethnicity, income, and urbanicity (Duggan & Brenner, 2013). Overall, both Facebook and Google attract young, affluent, and educated Americans to an extent; gender differences in users between the sites have specifically been uncovered (Morales, 2011).
Implications of nonprobability samples for data quality
Numerous studies have sought to compare accuracy of nonprobability and probability samples along key measures (e.g., Chang & Krosnick, 2009; Yeager et al., 2011), with many finding deficiencies in nonprobability sources that tend to exacerbate demographic differences already found in Internet studies (younger, more “professional” respondents). However, others (particularly in the political research realm) have found that opt-in panels and other nonprobability sources can be advantageous in terms of both costs and quality, particularly when advanced statistical techniques are carefully used to adjust for bias (e.g., Vavreck & Rivers, 2008). Generally, a key limitation is the confounding of results from sampling techniques with results of mode effects: With few probability Internet samples for benchmarking, many studies rely on telephone surveys for comparison. Regardless, some positive results of nonprobability surveys combined with benefits such as cost savings and quick turnaround have perpetuated their use. Less research has examined data quality across nonprobability sample types or has focused on assessing multiple indicators with the cross-source setting.
Potential indicators
Paradata (Couper, 1998) are useful in understanding the survey experience of nonprobability respondents, though the existence of such data often relies on foresight by the researchers and study staff to collect it. If opt-in surveys yield professional respondents who take surveys frequently and satisfice (Krosnick, 1991; Krosnick & Alwin, 1987) by taking shortcuts and expending minimal effort to complete the task, these respondents may differ from their more traditional ways beyond just panel conditioning and selection bias (Dennis, 2001). However, some recent studies have found results to the contrary, at least in terms of “speeding” through surveys (Zhang et al., 2014).
Completion time
While a longer completion time does not necessarily indicate better or worse data quality than a shorter one, and such server-side information can be hard to interpret given multitasking and multiple logins, some research has suggested that extremely fast completion times could be a good indicator of satisficing behavior (Malhotra & Kuo, 2008). The metric is almost always available from the web survey system and has been used as an indirect indicator of data quality for comparing several web survey designs (e.g., Couper, Traugott, & Lamias, 2001).
Breakoffs
Breakoffs, occurring when participants begin the survey but do not fully submit it, are common in web surveys, where participants may reconsider the participation decision at each page. Breakoff rates may introduce bias when correlated with specific subgroups, as such rates are often influenced by respondent characteristics (Peytchev, 2011) but have received relatively less attention in the literature than full unit nonresponse (nonparticipation) or item nonresponse among survey completes until recently, given their prevalence on mobile devices (Peytchev, 2009).
Don’t know/refuse to answer
Two types of nonsubstantive answers—the reporting of “don’t know,” which may be a “nonattitude” (Converse, 1964, 1976) or true value, and the decision to “refuse to answer”—are explored. Particularly in the case of don’t know responses, there is evidence that they do not necessarily improve data quality—yet are used more frequently by low-education respondents, on questions late in a survey, and by respondents putting in low levels of cognitive effort (Krosnick et al., 2002). No work to our knowledge has examined these items’ usage in a nonprobability setting.
Rounding/heaping
Rounding to convenient values or heaping at “prototypical” values may serve as useful response strategies when faced with numeric answers (Schaeffer & Presser, 2003; Zhang & Schwarz, 2012), but both often lead to loss of precision. Such behavior may or may not reflect satisficing (Holbrook et al., 2014; Kaminska, McCutcheon, & Billiet, 2010), and considerable research has focused on the data quality implications of using the strategy to estimate time (e.g., Huttenlocher, Hedges, & Bradburn, 1990).
Impact of mobile device use
The use of mobile devices to complete web surveys is rapidly increasing as smartphones and tablets become more widely used (Callegaro, 2012; Kelly, Johnson, & Stevens, 2012; Link et al., 2014). Such device use may negatively impact data quality as well, with existing research noting that mobile device users have high breakoff rates (Buskirk & Andrus, 2013; Callegaro, 2013; Mavletova, 2013) and take longer to complete surveys (Zahariev, Ferneyhough, Ryan, & Bishop, 2009). While research on response strategies, order effects, and other phenomena related to measurement error is less prevalent, recent results have found few differences between mobile and PC respondents in these areas (e.g., Mavletova, 2013; Peytchev & Hill, 2010). Given the ability to collect data via both Google and Facebook on smartphones, their impact is relevant for the present analysis.
Impact of incentives
The differential effectiveness of different amounts and types of incentives differ by the targeted population. While preincentives are more effective than postincentives and cash incentives are more effective than electronic incentives, both do require email addresses of the members/respondents, which is not often available in Internet samples. Hence, many Internet studies use electronic incentives or lotteries/sweepstakes/drawings. While lotteries can be effective for certain populations (for instance, younger adults prefer drawings to electronic incentives; Ramo et al., 2010), a meta-analyses by Singer and Ye (2013) reported that several studies found that lotteries were less effective (or ineffective) in comparison to electronic incentives. As a result, we have mainly focused on the use of electronic incentives in our study.
We draw from the above theoretical framework to focus on comparisons between Google and Facebook to compare data quality across the two recruitment sources, taking into account issues of demographic representativeness. We first compare the distributions of responses received from each recruitment platform. Based on previous research on the present data (Stern, 2013) and prior research on demographic and motivational factors unique to social networks as compared with other online behavior, we expect that Facebook and Google data will look different from each other and from General Social Survey (GSS) benchmarks. While the small amount of research on these sites’ user populations suggests some demographic similarity, we hypothesize that recruiting respondents to a survey via these platforms may attract different types of users. Given the statistical issues involved in making comparisons between probability and nonprobability data sources, we focus on the existence rather than the magnitude of differences and expand upon what trends might mean for comparing the usefulness of various sources in the discussion section.
Method
Advertisements recruiting users to a web survey were placed on Facebook from January through March 2013 and on Google from February through March 2013. They invited users to take part in a web survey for either US$5 or US$10, depending on treatment. The advertisement was titled “Free [Amount] Gift Card” and included the URL (techsurvey.norc.org) and a brief description (NORC at the University of Chicago Technology Survey). Google advertisements were placed along the top of the screen on Google websites, Facebook’s along the right side. Figure 1 displays example screenshots of the advertisements.

Example screenshots of advertisements on Facebook and Google.
On all ad platforms, when and where the ad appears and which ad is shown (in cases where more than one advertisement per campaign is provided) are controlled algorithmically by the ad platform and are often based on specifications outlined by the purchaser. Both Facebook and Google have the most up-to-date information regarding user demographics and ads that perform most successfully on their sites. The platforms, working within limits set by the purchaser, work to maximize the success of the advertisements by examining several measures such as click-through rate, cost per click, and cost per acquisition. In essence, they perform numerous miniexperiments in order to determine the optimal placement to maximize the campaign’s overall effectiveness. Accordingly, in this study, we have used and monitored these measures daily to determine the most effective times and ads to be used in our study.
Facebook allowed the advertisements to be posted with no targeting, reaching a “general population” of users; since Google required the selection of key words to drive bids and ad placement, the top 20 “trending” (popular) key words were used in efforts to gain access to a broad cross section. Bidding was kept steady across the study field period until close to the end. Given the bid for the US$10 Google advertisement were more effective, the bid for this treatment was increased in volume in efforts to improve efficiency. Once a user clicked on the advertisement, he or she was directed to the survey landing page, containing information about the study, contact information, and frequently asked questions. The web survey itself contained 20 questions pulled from the 2010 GSS that covered demographic characteristics and technology use. Respondents were asked for their e-mail address at the end of the survey and were e-mailed an Amazon.com gift code within 1–2 business days after completion.
Technology use
For the purposes of our study, we identify heavy technology use by selecting those who answered “daily” to the question “How often do you spend time on the computer?” and selected the Internet as their primary source of current events information (We are interested in how people get information about events in the news. Where do you get most of your information about current news events—newspapers, magazines, the Internet, books or other printed materials, TV, radio, government agencies, family, friends, colleagues, or some other source?).
Paradata indicators
We draw from server-side paradata collected within the web survey to assess the survey experience of respondents. All data were collected at the survey level, though not the page level.
Mobile device usage was assessed by parsing the full user agent string captured by the survey system to locate key terms that may indicate that the survey was taken on a mobile device. “iPhone,” “iPod,” “iPad,” “Android,” “BlackBerry,” “Mobile,” or “Windows Phone” in the string indicated mobile usage.
Breakoffs were identified based on the final disposition and separated based on whether the respondent provided any data versus only logged into the survey.
Completion times assessed who logged into the survey only once (to help ameliorate biases from multitasking or session time-out) and who were excluded as potential outliers (more than three standard deviations from the original, unadjusted mean). While many outside factors may influence completion time, the total elapsed time provides a rough benchmark of survey behavior for comparative purposes.
Nonsubstantive answers were assessed using “prefer not to answer” or don’t know responses, analyzed together due to the small sample size. To stay consistent with the GSS, all survey questions were required, so respondents were presented with a forced choice including these two response options.
Rounding to hours was assessed for the two questions requesting a numeric frequency (“About how many minutes or hours per week do you spend sending and answering electronic mail or e-mail?” and “Not counting e-mail, about how many minutes or hours per week do you use the web?”). Respondents could answer each question with a number of hours, minutes, or a combination of both. Values were assessed for whether or not they were given in whole hours (divisible by 60).
Heaping was also assessed for the web use questions just discussed that were given as a prototypical value (terminology drawn from Huttenlocher et al., 1990). For the purposes of this study, these values were defined as divisible by 10 or 25 (since the maximum value was approximately 100); we included 1 and 5 as well to adequately represent low-volume users. An initial examination of the distribution showed that peaks in reporting tended to occur at such values.
Analytic Strategy
Each indicator was then examined with a separate three-stage sequential multivariate model: Stage 1 including only recruitment platform as a predictor, Stage 2 incorporating nondemographic variables relevant to the survey-taking experience (incentive amount, whether the respondent was using a mobile device, and technology use), and Stage 3 incorporating the prior variables plus demographic controls. Interactions between site and incentive amount, site and technology use, and incentive amount and technology use among others were tested to assess their usefulness but did not add information to the model and are not reported. We used a generalized linear models approach, specifying the type of distribution for each dependent variable. Given the binary nature of the variables measuring breakoff, rounding, and presence of item nonresponse, a binomial distribution was used and logistic models run; the continuous and skewed nature of the completion time measure necessitated the use of a negative binomial model. Each model was assessed for model fit using the log likelihood and the Akaike information criterion (AIC); collinearity of predictor variables was also assessed.
The three models were run for each dependent variable identically, except for in the breakoff analysis. Because the vast majority of breakoffs occurred before any data were included, both technology usage (questions were located near the end of the questionnaire) and most demographics were not suitable for use. Given, however, that a fair number of respondents breaking off answered the first few questions, we included age, marital status, and gender in the model; these were the first 3 items in the survey and contained data for about 80% of breakoffs who provided any data. With few breakoffs in the Facebook data, the Stage 3 model was run for all data and then for Google only. Results did not change substantially.
Results
Turning first to descriptive statistics on outcome and predictor variables, presented in Table 1 below, we note a number of significant differences between sites. Without controlling for demographics or other relevant variables, we find significant bivariate differences on three of the four outcome variables. Google respondents break off more often and take longer to complete the survey. Notably, Google respondents were much more likely to attempt the survey on a mobile device, and consequently the vast majority of Google-recruited breakoffs occurred on mobile devices. Significant patterns are uncovered for response strategy on the first numeric question (e-mail use), with more heaping of prototypical values on Facebook but no apparent significant findings for rounding for hours. No differences are found with regard to the level of nonsubstantive answers in either case, though levels are low overall. Overall, the US$10 incentive was much more successful than the US$5 incentive in speed of recruiting respondents. While not presented in detail here, analyses of demographic variables by incentive level reveal only a few significant distributional differences within recruitment platform.
Descriptive Statistics of Dependent and Control Variables.
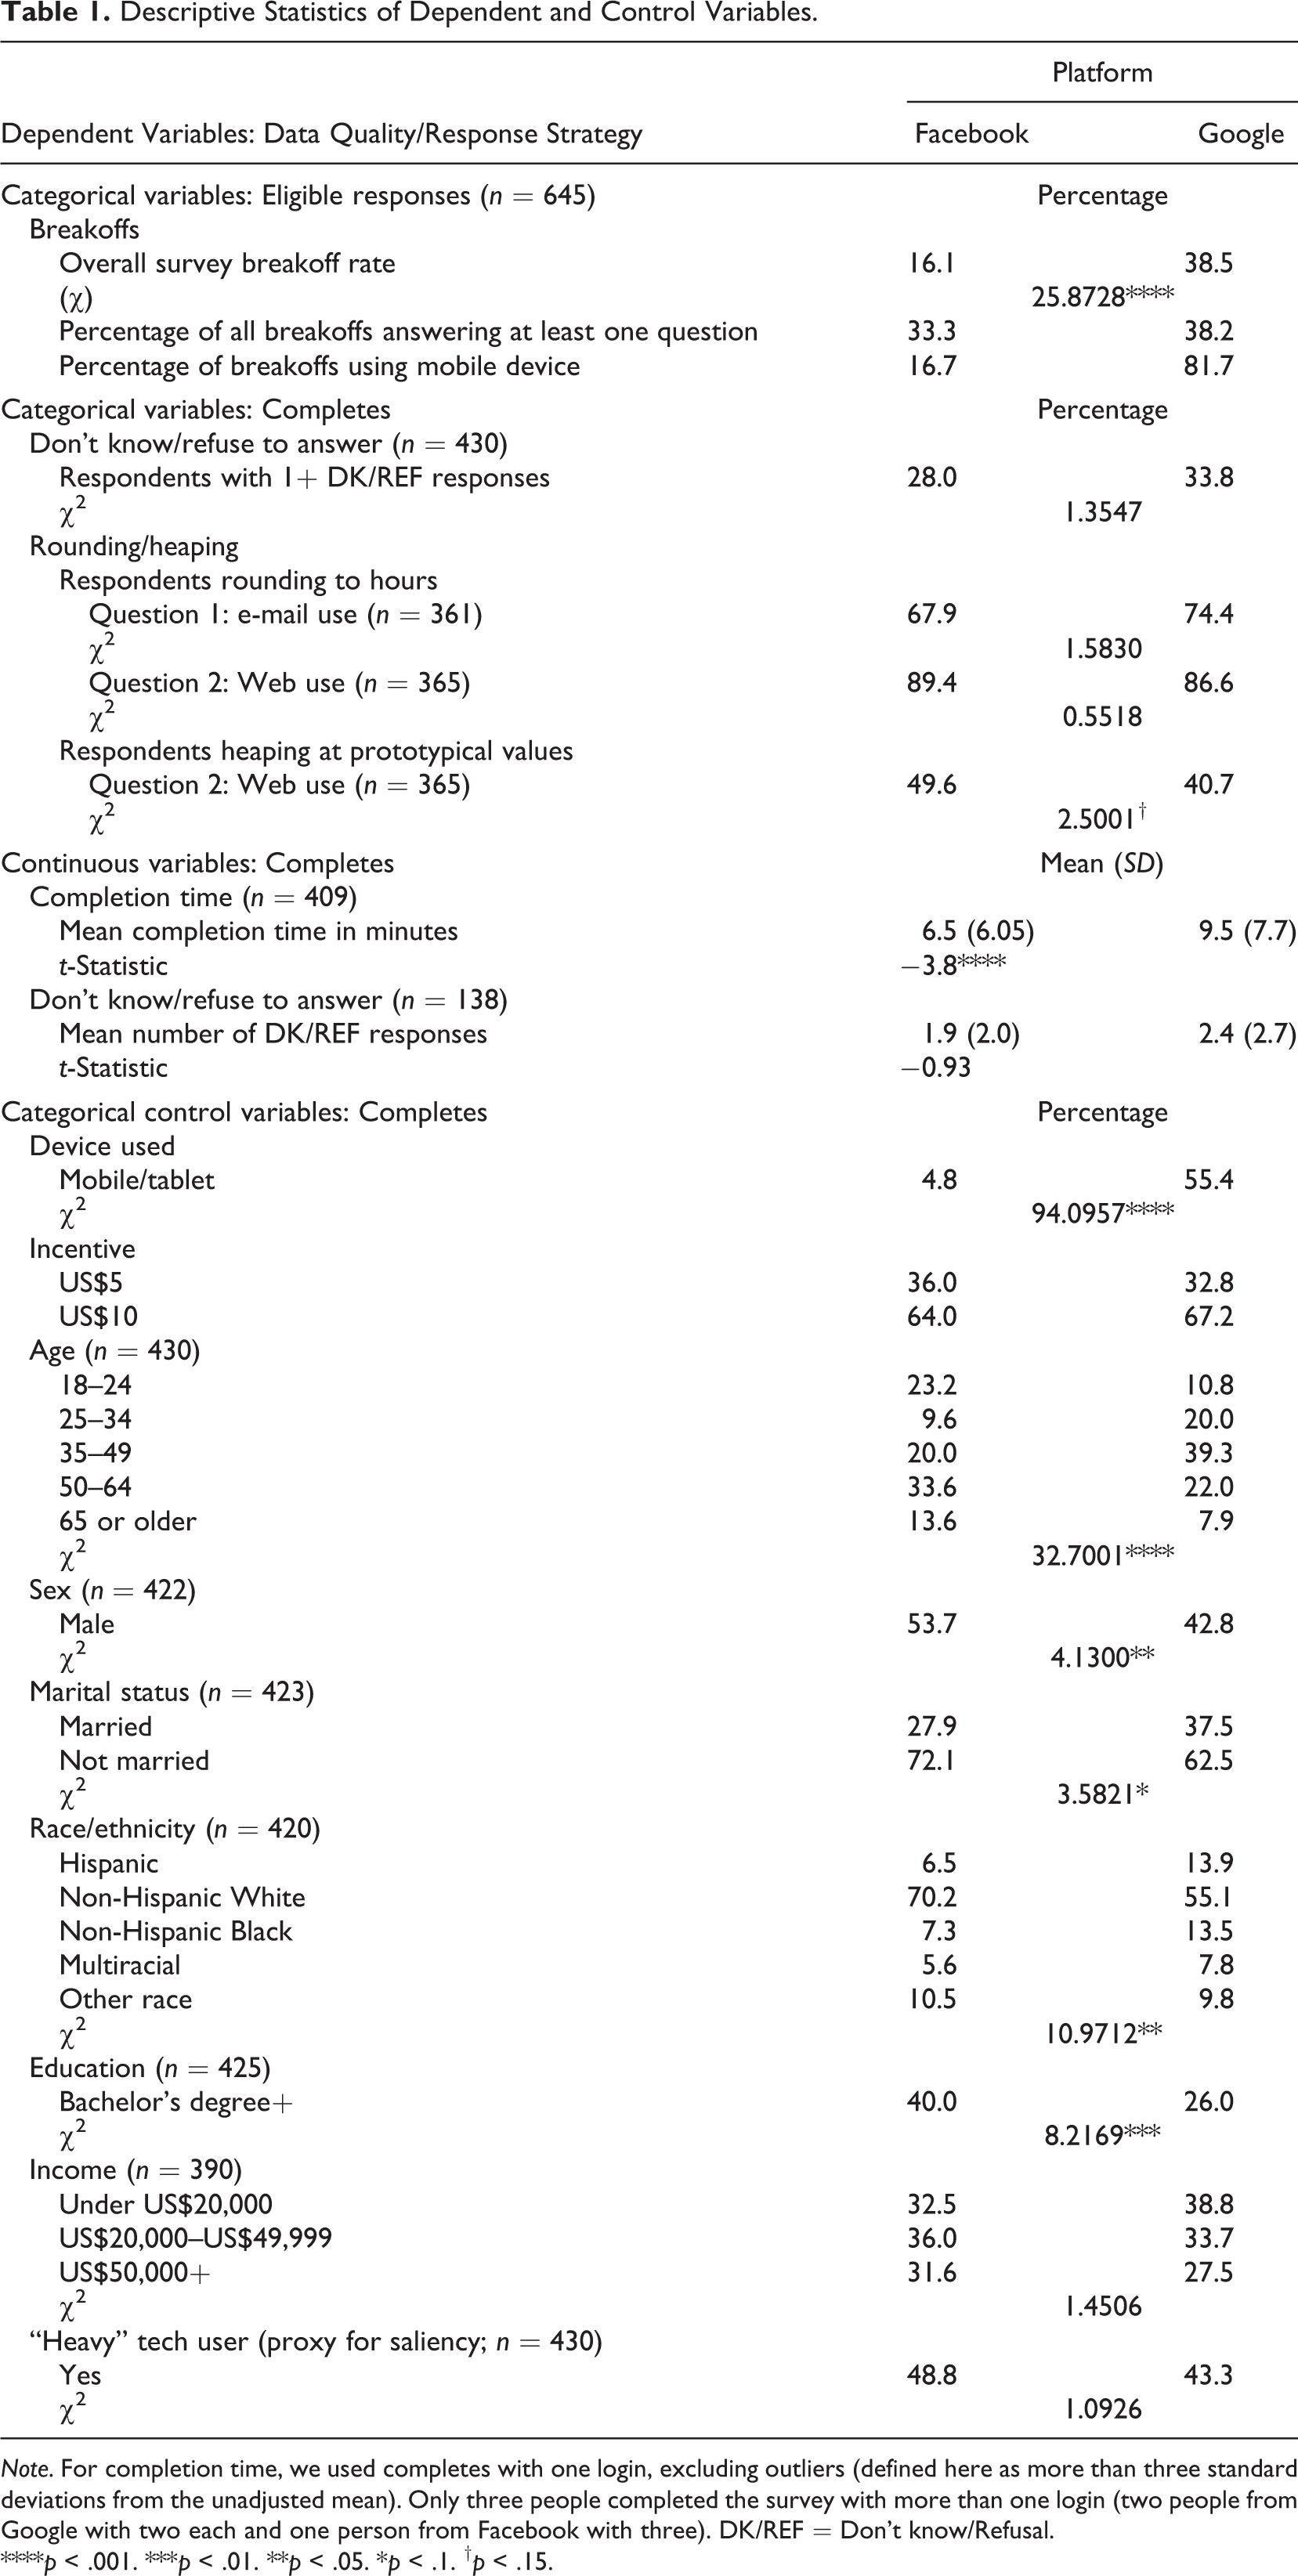
Note. For completion time, we used completes with one login, excluding outliers (defined here as more than three standard deviations from the unadjusted mean). Only three people completed the survey with more than one login (two people from Google with two each and one person from Facebook with three). DK/REF = Don’t know/Refusal.
****p < .001. ***p < .01. **p < .05. *p < .1. † p < .15.
Demographic differences between recruitment platforms
Examining the demographic differences between sites, we note many significant relationships. Facebook has both very young (18–24) and very old (50–64, 65 and older) respondents, while Google respondents tend to fall into the middle of the age range (25–34, 35–49). The Facebook respondents were also more frequently male, White, and highly educated (attaining a bachelor’s degree or higher). While there were no significant differences between sites on income distributions, both sites’ respondents were skewed quite low with only 30–40% of the respondents earning more than US$50,000 a year. Finally, similar levels of heavy technology use were found between sites.
GSS comparisons
For the GSS comparison, we built on prior work (Stern, 2013) examining differences in demographics between Facebook survey completes, Google survey completes, and general population estimates (represented by weighted GSS data). We further assessed demographic differences at an additional stage of the sample definition process by including data on a subset of Internet users from the same weighted GSS data. To identify Internet users represented in the 2012 GSS, we selected respondents reporting any of the following: that they had Internet access at home, that they had Internet access at home through an Internet-enabled mobile device, or that they spend any amount of time sending/answering e-mail or using the web.
Each demographic varied somewhat on the progression from general population proxy to Internet user population proxy to survey complete. Considering age first, displayed in Figure 2, we observed a slight trend toward younger members of the Internet user group (34.4% being under the age of 35) as compared with the general population (30.9% under the age of 35). 30.8% of Google-recruited completes fit this age category as compared with 32.8% of Facebook-recruited completes. However, Facebook-recruited completes skew younger with more 18- to 24-year-olds (a 9.7 percentage point increase over the GSS Internet user proxy in 18- to 24-year-olds and a 12.4 percentage point increase over the same category of Google-recruited respondents) and overrepresent 50- to 64-year-olds. Google completes overrepresent 35- to 49-year-olds compared to both the general population and Internet user proxies and underrepresent those 65 and older. On the other three age categories, though, the Google completes appear to match the distribution of GSS general and Internet respondents fairly closely.
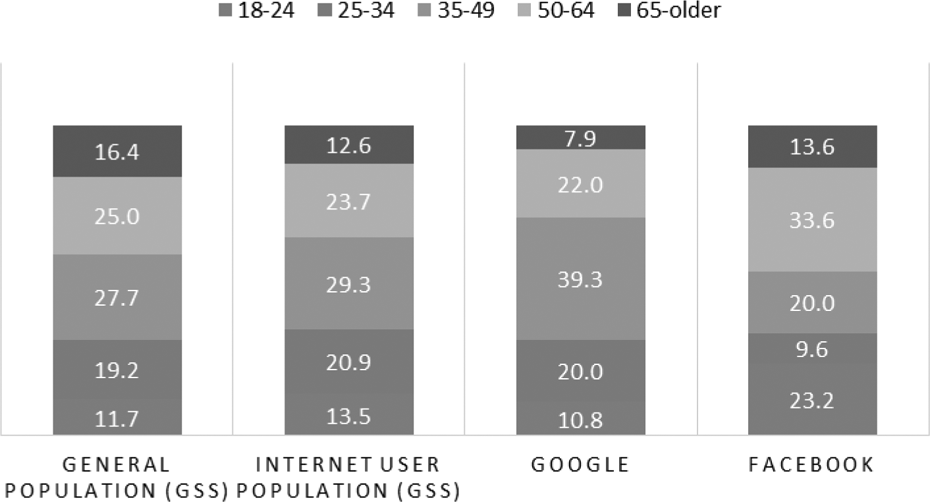
Age distribution of General Social Survey (GSS) general, GSS Internet, Google completes, and Facebook completes.
The gender distribution across the four sources of data, displayed in Figure 3, also showed slight differences. The GSS Internet user group displayed a nearly identical gender distribution as the overall data set. The Google-recruited completes overrepresented females, though they came closer to the GSS benchmarks than the Facebook-recruited completes (underrepresenting females compared to the three other data sources).

Gender distribution of General Social Survey (GSS) general, GSS Internet, Google completes, and Facebook completes.
Next, examining race in Figure 4, we observe a slightly more White, less Hispanic, and less non-Hispanic Black set of Internet users than is represented in the general population estimate. Overall, we note that neither Google-recruited nor Facebook-recruited completes match the GSS benchmarks well; namely, the Google-recruited completes underrepresent Whites by 9.2 percentage points from the general estimate and 12.6 percentage points from the Internet estimate. Facebook, in contrast, overrepresents Whites compared to the general population estimate (by 5.9 percentage points) and compared to the Internet user estimates (2.5 percentage points). The set of Facebook-recruited completes also underrepresents non-Hispanic Blacks. One point of consideration in the racial comparison is the “multiracial” category, coded if a respondent selected two or more races (and did not identify as Hispanic). Effects of mode or survey administration may explain the large jump in responses between the GSS and the present data source.
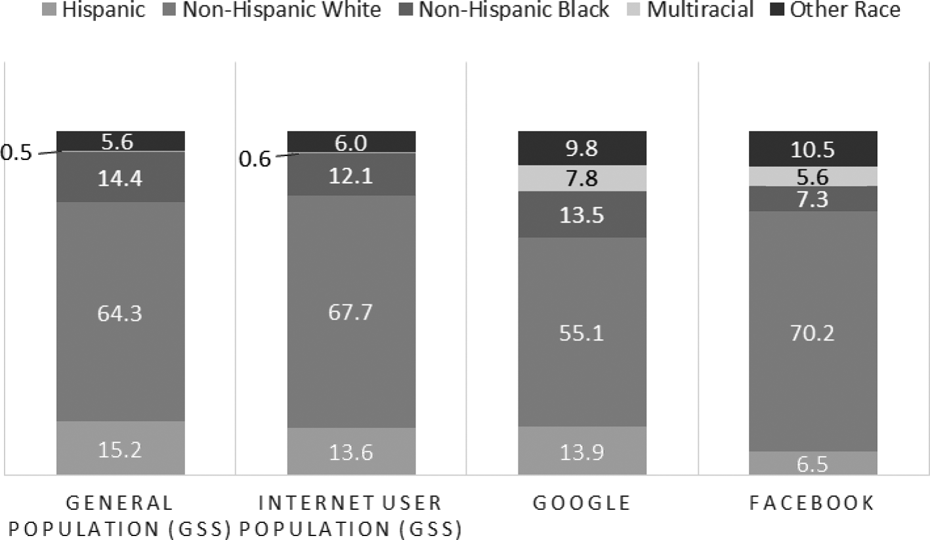
Racial distribution of General Social Survey (GSS) general, GSS Internet, Google completes, and Facebook completes.
Turning to income, both Facebook-recruited and Google-recruited completes drastically overrepresented low-income respondents. The age skew of these respondents may explain the trend, displayed in Figure 5.
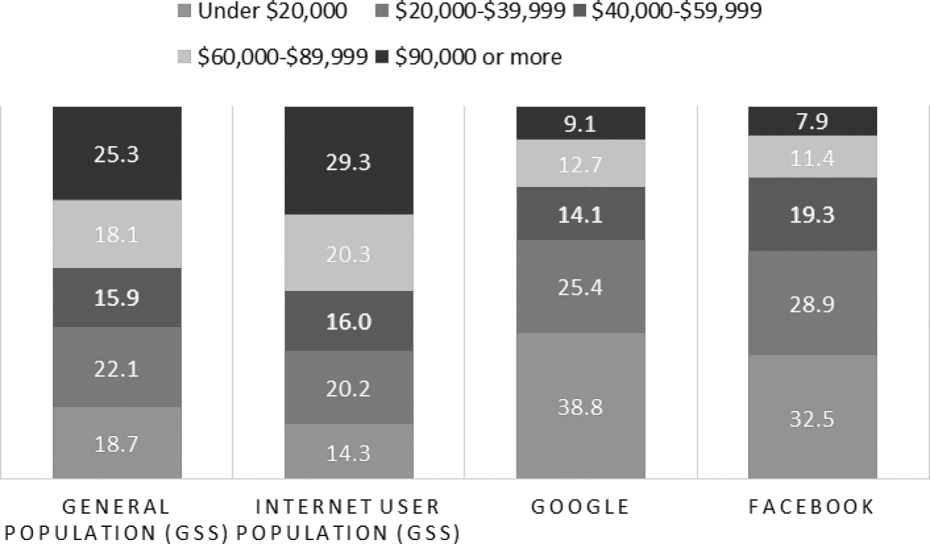
Income distribution of General Social Survey (GSS) general, GSS Internet, Google completes, and Facebook completes.
Finally, while the GSS general and Internet estimates of married respondents were similar (52.3% vs. 53.8%), both Google and Facebook underrepresented married users, with Google closer to benchmarks than Facebook (37.5% and 27.9%, respectively). The GSS Internet estimate skewed somewhat more highly educated than the general estimate (32.8% vs. 27.9% having a bachelor’s degree or higher), and Google-recruited completes came closer to these benchmarks (underestimating bachelor’s education or higher at 26%) than Facebook (overestimating it at 40%).
Multivariate analysis: Data quality and response strategy
Next, we turn to the results of the three-stage sequential multivariate models. Results are presented in turn for breakoffs, completion time, nonsubstantive answers (don’t know and refuse to answer), and strategies for numeric estimation. Overall, while initial differences were present between recruitment platforms, upon adding controls to the models, the platform’s impact disappeared in many cases (though remained significant for some response strategy indicators). Completing the survey on a mobile device was the most consistent predictor of nearly all of our data quality outcomes (more breakoffs, longer completion times, more item nonresponse, less rounding/heaping). Incentive amount, technology use, platform, and selected demographics also contributed to models, as outlined below.
Breakoffs
As noted above, the overall breakoff rate was over twice as high for Google-recruited respondents as for Facebook-recruited respondents. Among both Google-recruited and Facebook-recruited respondents, nearly two thirds of breakoffs occurred before answering the first question (66.7% of Facebook breakoffs and 62.8% of Google breakoffs). However, those who did provide data broke off throughout the questionnaire, including at the last question. Breakoffs most frequently occurred at the Hispanicity, education, and income items.
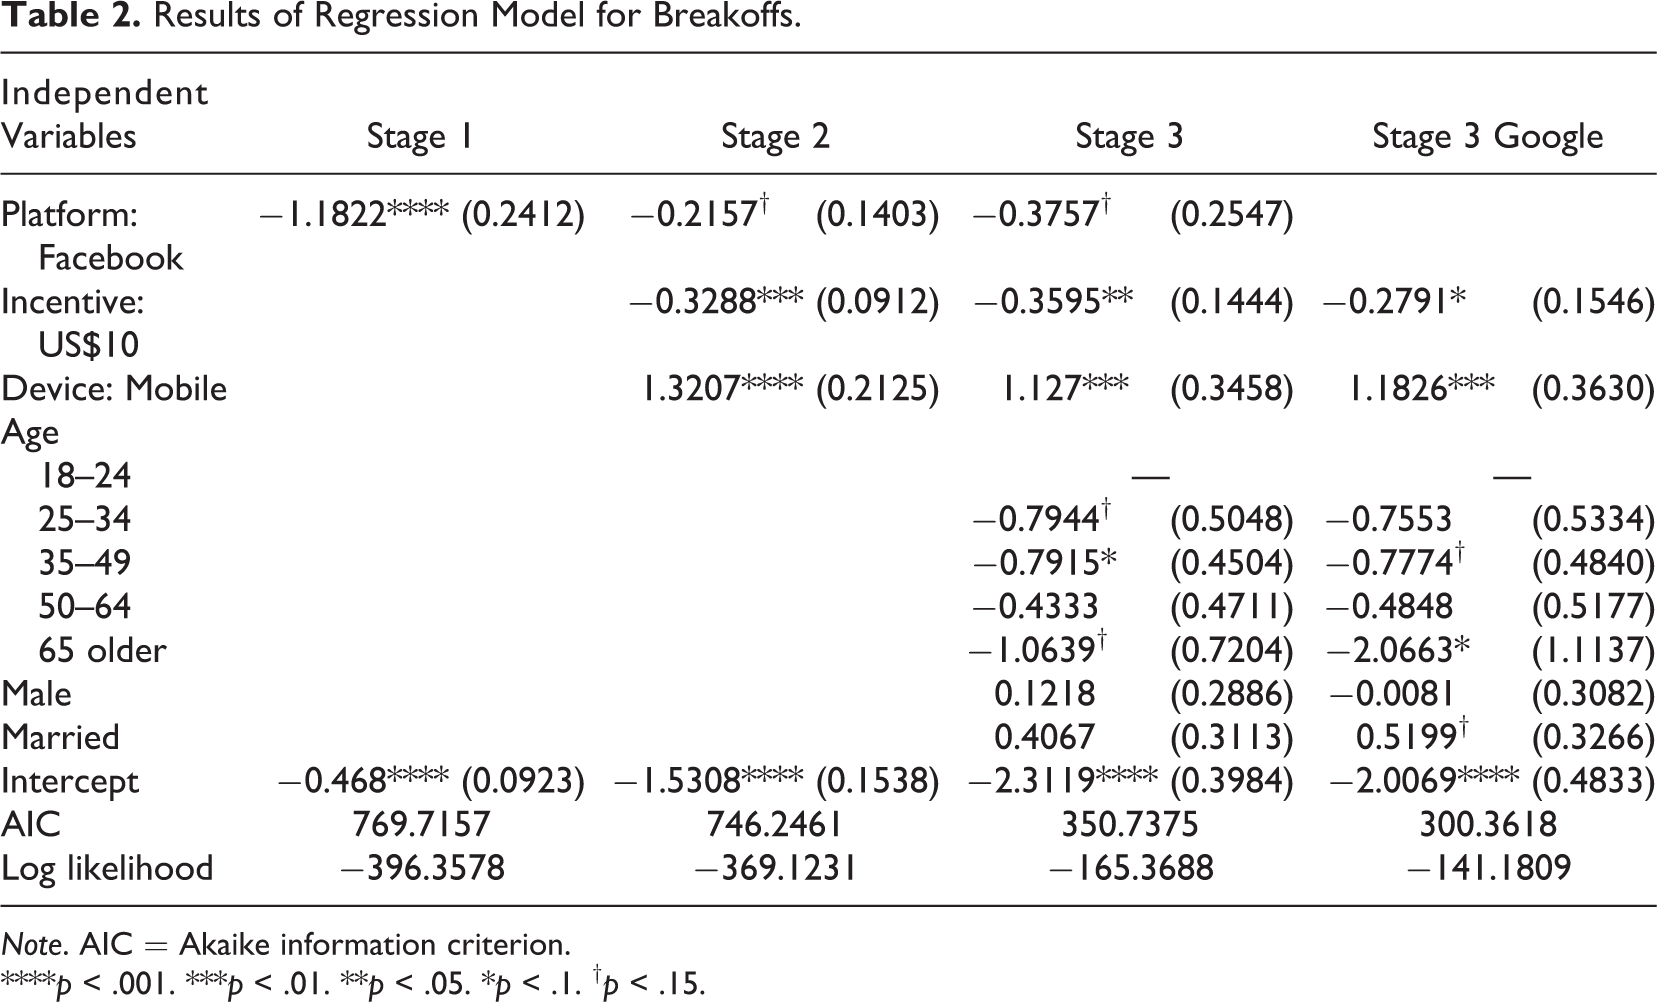
While breakoffs initially appear to be much more prevalent among Google-recruited respondents than among Facebook-recruited respondents, much of the difference can be explained by differences in the sample composition and the devices used to take the survey across recruitment platforms. As shown in Table 2, recruitment platform was highly significant in our first-stage model without controls (respondents on Google were much more likely to break off than respondents on Facebook). Upon adding control variables, the effect of recruitment platform only approaches significance (p ≤ .15). With controls included, those on mobile devices were more likely to break off than those on computers (p = .001). This result supports the descriptive finding that the vast majority of these Google breakoffs occurred on mobile devices. Those with a US$10 incentive were additionally less likely to break off compared to those with a US$5 incentive (p = .01). Given that the vast majority of the breakoffs in the study occurred in Google-recruited cases (partially due to their larger share of the sample overall), we additionally ran the third-stage model for Google respondents only. All effects remained in the same direction, though some statistical power was lost (several estimates only approached significance).
Results of Regression Model for Breakoffs.
Note. AIC = Akaike information criterion.
****p < .001. ***p < .01. **p < .05. *p < .1. † p < .15.
Completion times
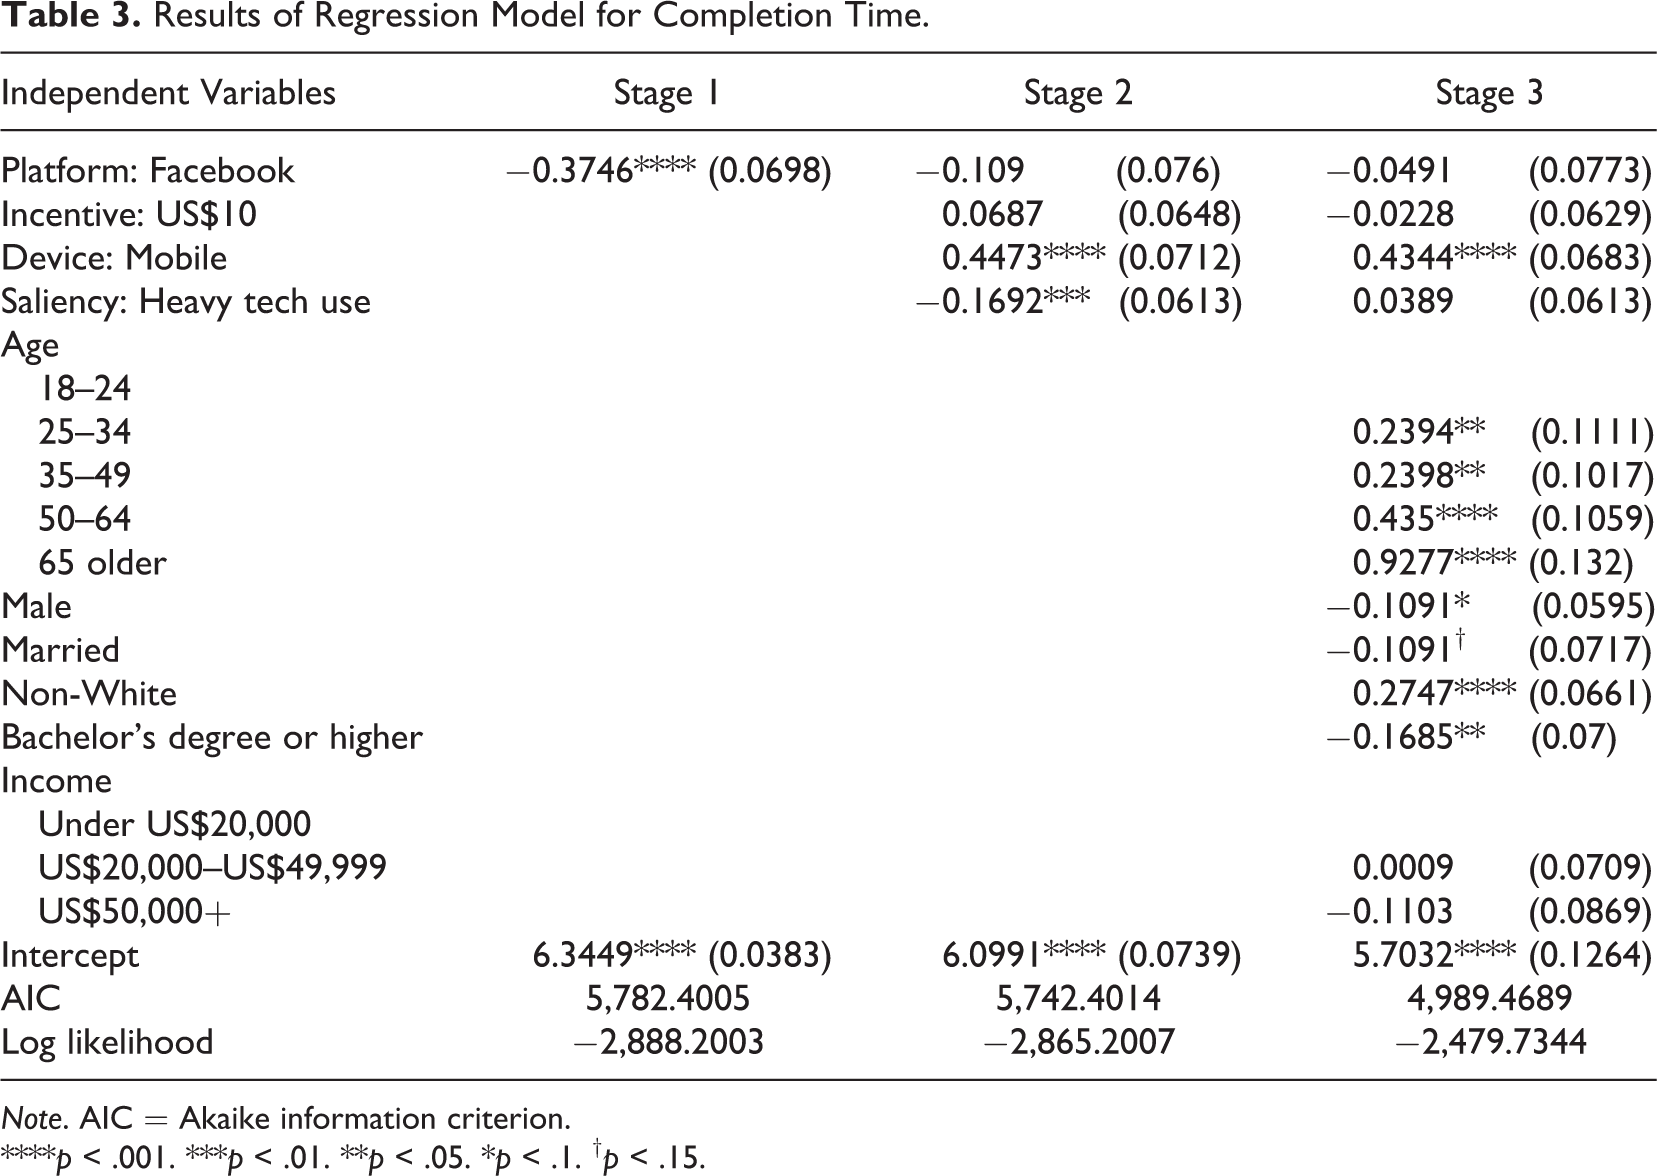
Results, presented in Table 3, show that Facebook respondents completed the survey more quickly when controls were not considered, but this significance also disappeared after the inclusion of control variables. Overall, respondents on mobile devices took longer to complete the survey (p < .001), as did older respondents (all p < .05), non-White respondents (p < .001), those without a bachelor’s degree (p = .016), males (p = .08), and married respondents (p =.12).
Results of Regression Model for Completion Time.
Note. AIC = Akaike information criterion.
****p < .001. ***p < .01. **p < .05. *p < .1. † p < .15.
Don’t know/refuse to answer
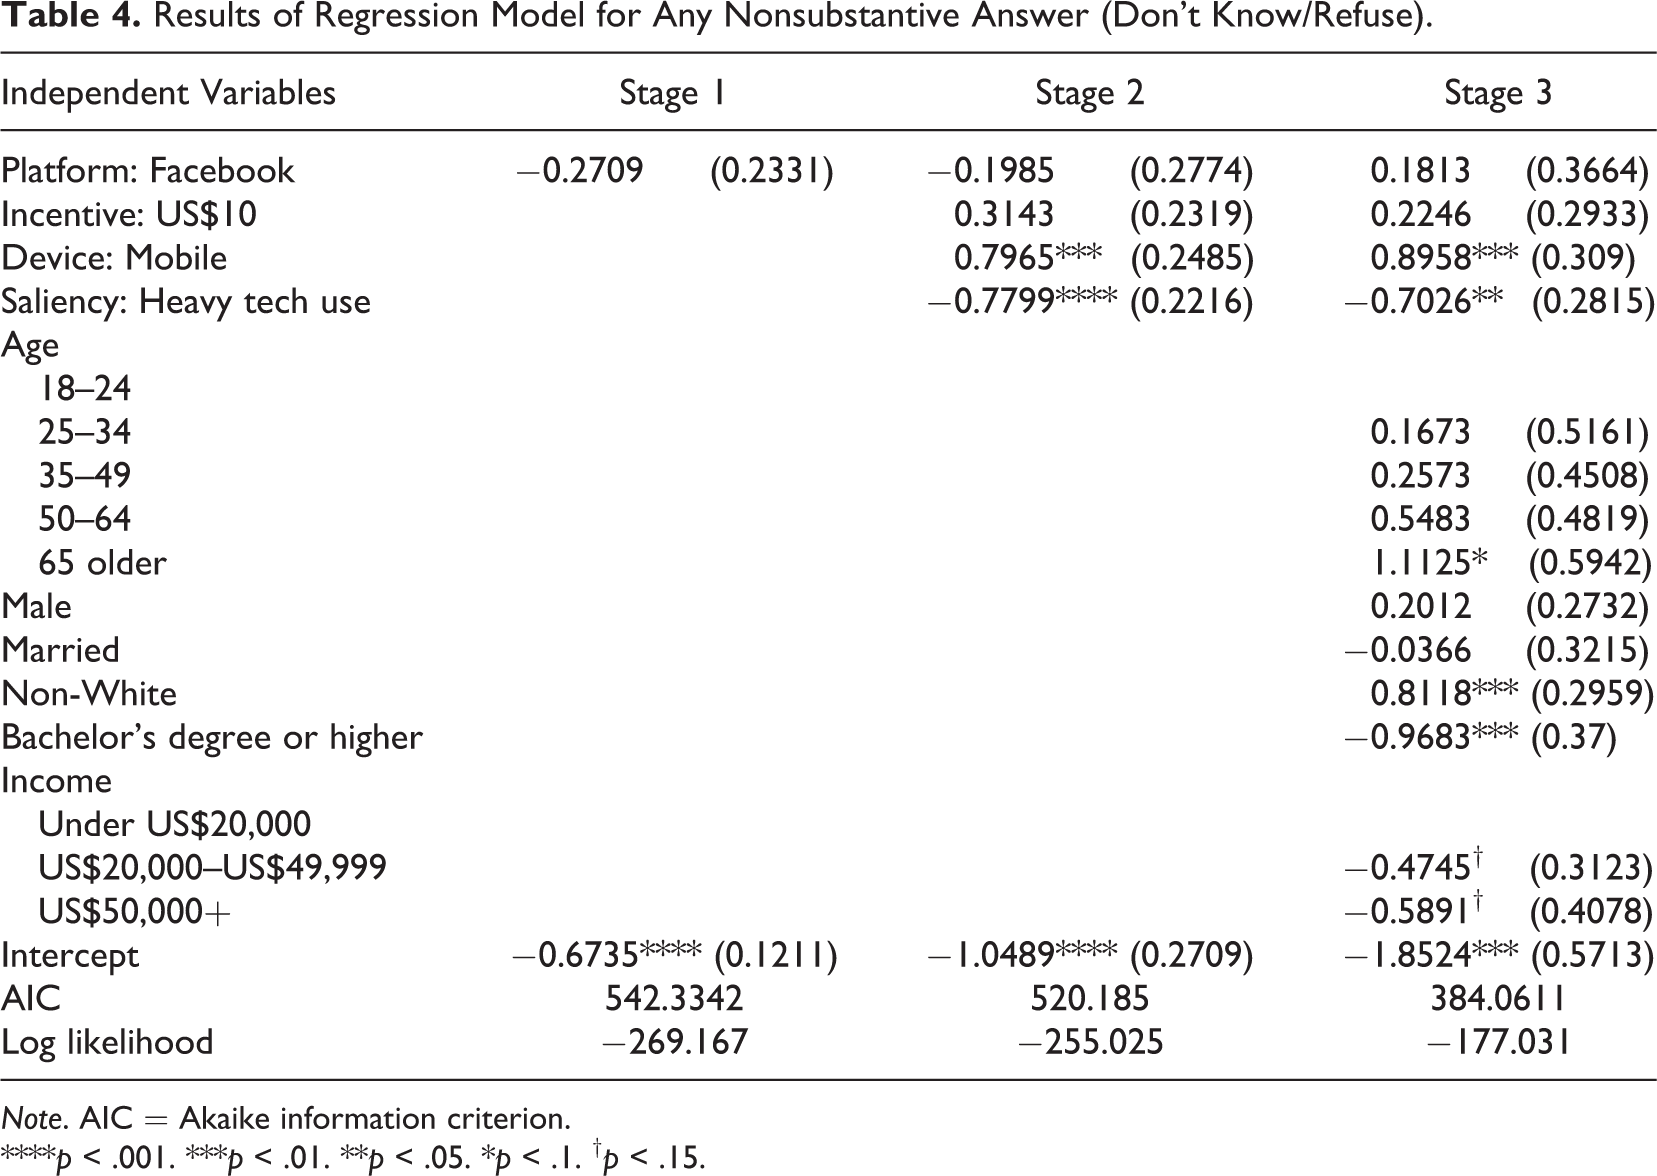
The results of this model are summarized in Table 4. No differences by recruitment platform are discovered in the initial model without controls, confirming the lack of significant bivariate relationships. However, we observed respondents on mobile devices as more likely to provide at least one don’t know or refuse to answer response; controlling for device usage, users for whom the survey topic was salient (self-reported heavy technology users) were in contrast less likely to provide at least one of these same responses. Both mobile device use and saliency remained significant after the inclusion of demographic variables (both significant at p = .01). Furthermore, older respondents were more likely to provide such a response than younger (p = .06) and non-Whites were more likely to provide such a response than Whites (p = .01). We see mobile device use playing a significant role in the final model in the expected direction, namely, mobile device is associated with more item nonresponse. Further, we see saliency play a significant role as demographics are added to the model (p = .01). Incentive is not influential, and there is no additional impact of platform.
Results of Regression Model for Any Nonsubstantive Answer (Don’t Know/Refuse).
Note. AIC = Akaike information criterion.
****p < .001. ***p < .01. **p < .05. *p < .1. † p < .15.
Rounding
We focus on two potential response strategies for the numeric estimation questions: first, rounding to hours (values divisible by 60 min). Because the order of the two questions was not randomized and the second question involved a computation from the first (“not counting e-mail, about how many minutes or hours…”), we present the results from both questions below.
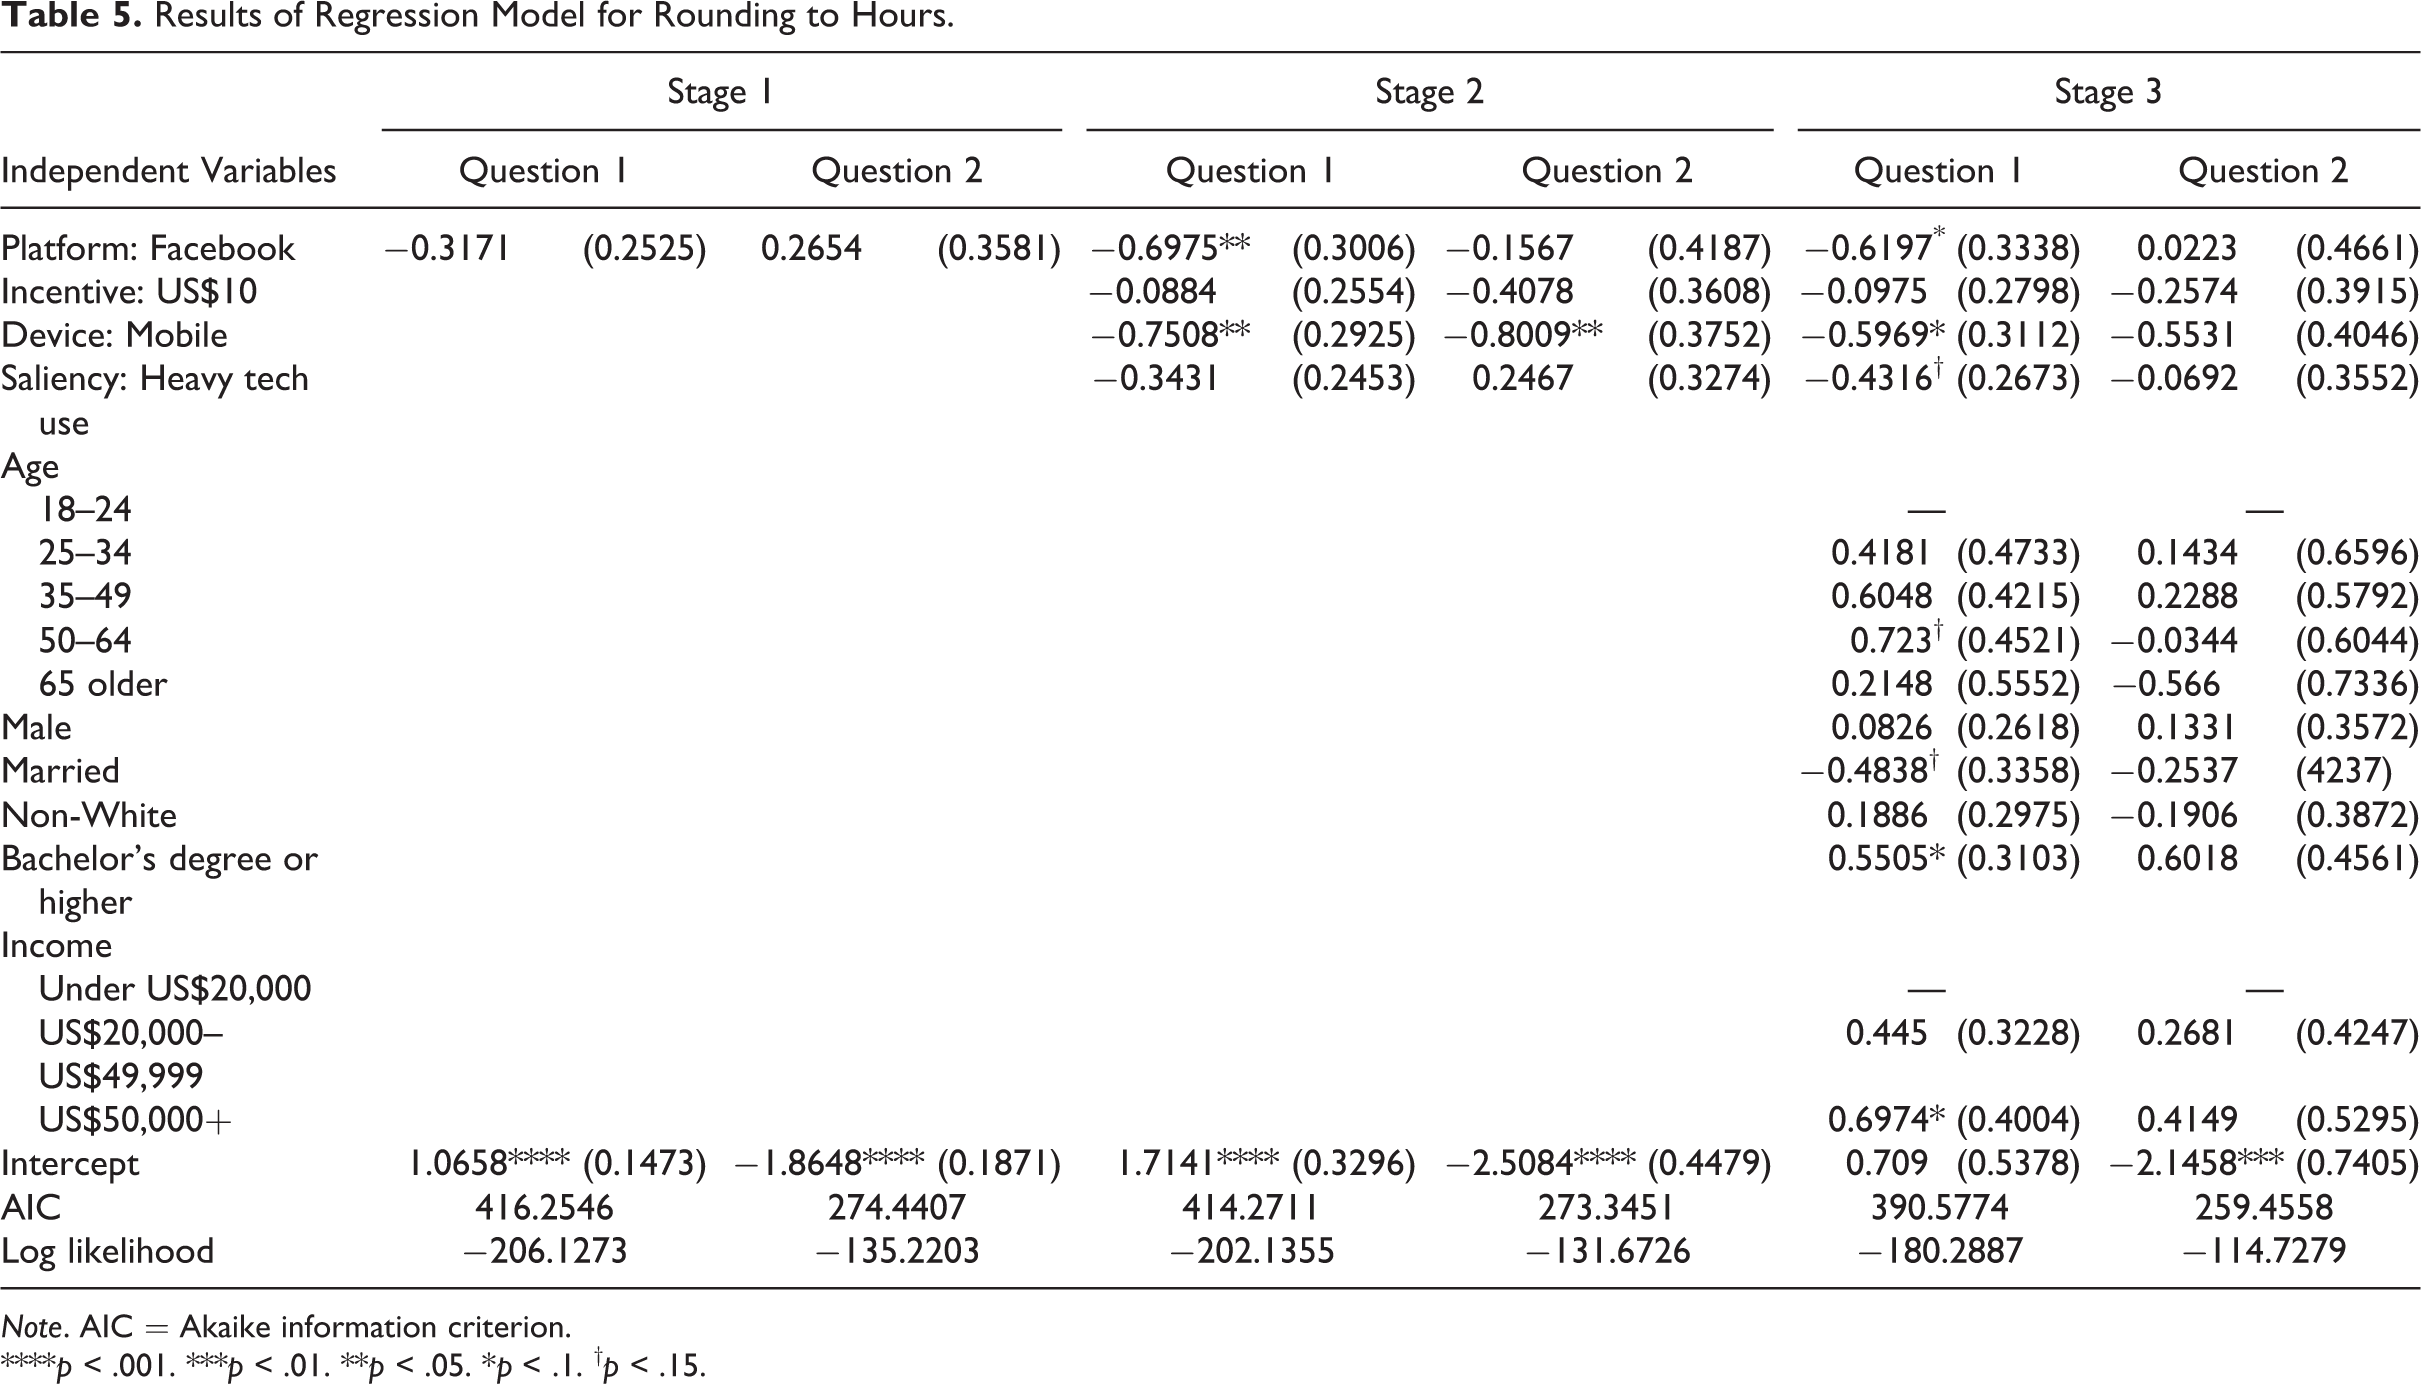
As Table 5 displays, no differences are apparent in rounding rates before incorporating controls. However, after incorporating control variables into the model, on the first question (e-mail use), Facebook-recruited respondents were less likely to round to hours than Google respondents (p = .06). Additionally, respondents answering on mobile devices were less likely to round to hours (p = .05) as were heavy technology users (approaching significance at p = .10). Demographically, we further observe approaching significance effects of the oldest age category (p = .10) and marriage (p = .13), while we see marginal effects of higher education and higher income respondents who were more likely to round to hours (p = .07 and p = .08, respectively). On the second question, no significant parameters were identified after controls were incorporated.
Results of Regression Model for Rounding to Hours.
Note. AIC = Akaike information criterion.
****p < .001. ***p < .01. **p < .05. *p < .1. † p < .15.
Heaping
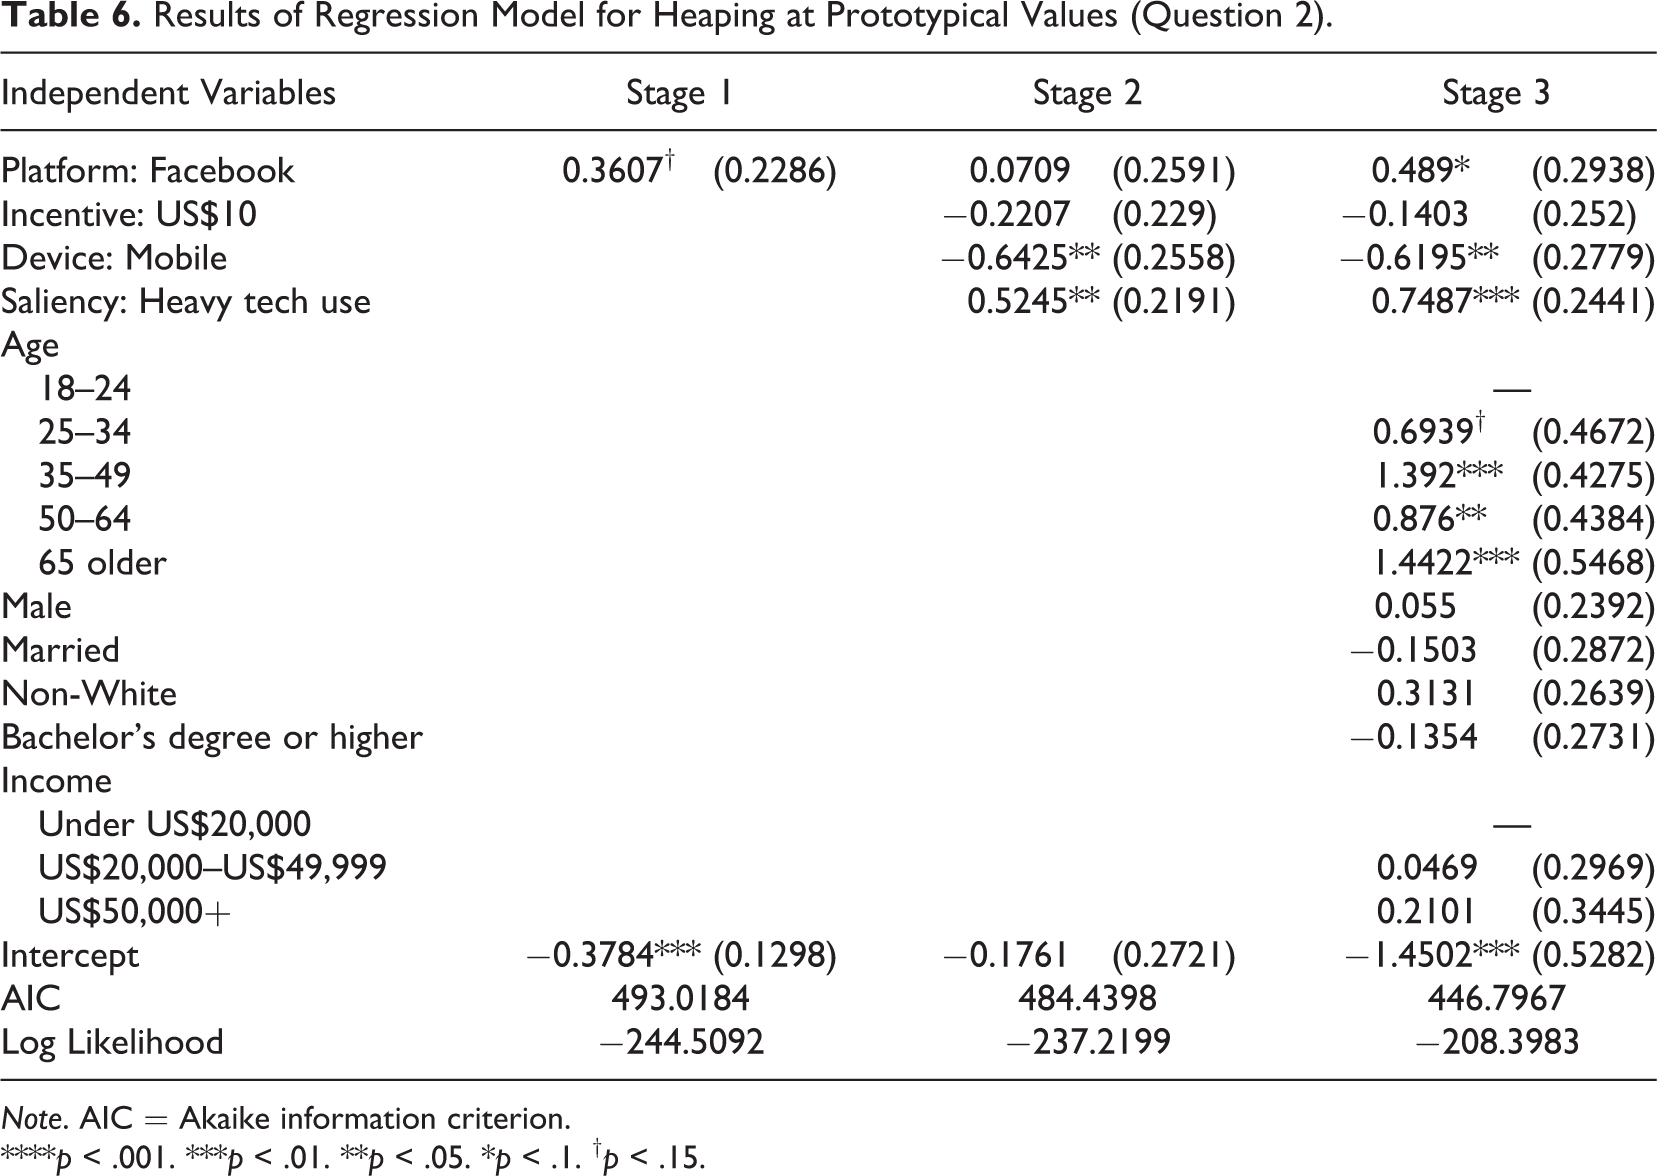
Finally, examining heaping/reporting prototypical values, presented in Table 6 for Question 2 (e-mail use), we do observe a marginally significant impact of recruitment platform after including controls, with Facebook-recruited respondents more likely to report in this way than Google respondents (p = .09). Additionally, we observe mobile users less likely to report prototypical values (p = .02), heavy technology users more likely to do so (p = .01), and older respondents more likely to do so (p < .05 or better for three of four categories). The results suggest that there may be different strategies for numeric responding by saliency and mobile device usage as well as that the context of a search engine versus social network might matter; but they do not offer a definitive answer on what those strategies might be for our nonprobability respondents.
Results of Regression Model for Heaping at Prototypical Values (Question 2).
Note. AIC = Akaike information criterion.
****p < .001. ***p < .01. **p < .05. *p < .1. † p < .15.
Considering response strategies together, we find on the first question (e-mail use), Google respondents were more likely to round to hours; on the second question (web use), Facebook respondents were more likely to report prototypical values controlling for all else. Although we do not have the cell sizes and statistical power to reliably test interaction effects and tease out differences, we believe further work is needed in this area and expand on what results may mean in our discussion below.
Discussion
Data from this study reveal that recruitment platform matters but mostly in ways we can predict and based on knowledge of survey methodology and careful tracking of demographic information. While results do not support the theory that there is an effect of recruitment context above and beyond demographics, device usage, and survey design, significant results on some moderating variables and significant results for response strategy underscore the importance of careful choice of recruitment platform. They suggest directions for further work, particularly building upon our limitations. With increasing use of these nonprobability designs, understanding how user populations, survey motivations, and recruitment context interact is key to the ongoing use of this data.
Taking our results together, we only find two indications of recruitment platform with a marginally significant impact above demographics and other relevant variables on response strategy. These findings are interesting given the cognitive demands of the questions and raise the possibility of strategic responding. However, they could be explained spuriously as well.
Two key features of the Facebook advertisement—that it could not be displayed on mobile devices overall and it had a longer field period that Google—could further impact results. Although the first was controlled for and the second should theoretically have only affected rate of recruitment, it is possible that unintended effects were introduced. Understanding who tends to use mobile devices to complete such surveys is a key task for future work. Furthermore, while the present study did not collect information on psychosocial variables, trust levels, attitudes toward Google and Facebook, or levels (and types) of engagement with the sites, future research should explore the association between these covariates, survey participation, and data quality.
The results of the present study do make it clear that factors associated with design decisions for a nonprobability study may impact the representativeness of data collected. Demographically, Facebook- and Google-recruited respondents are different from each other, from the general population, and from the population of Internet users (as measured by benchmarks from a nationally representative survey). Determining exactly how and to what extent they differ is a limitation of both this study and analysis of nonprobability data in general. Our benchmark (the GSS) was a face-to-face probability effort, which introduces differences in both survey mode and sampling design into any comparison. Further, we lacked adequate data on the user populations of Facebook and Google to assess differences between those who may have seen the advertisement and those who clicked on it. While analytics data provided from both sites help to understand who is clicking on the advertisements and can be helpful in determining how “breakoffs” occur before the survey is even started, such data are often inferred by algorithms or dependent on users’ willingness to provide it. These limitations, however, reflect the nature of nonprobability efforts and underscore the importance of making purposeful sampling decisions. For researchers seeking to recruit a general population sample, or generalize to any population that relies on a certain demographic distribution, attention to these differences is key. Pilot tests on various recruitment platforms, the inclusion of adequate demographic items in the survey for benchmarking and use as statistical controls, and careful attention to the demographics of survey completes as they come in may be key in making design decisions for nonprobability studies.
In line with previous work (Ishii, 2004; Stern, Bilgen, & Sterrett, 2016), the use of a mobile device to complete the web survey proved to be the most consistent predictor of our data quality outcomes, with those on mobile devices breaking off more frequently, taking longer to complete the survey, and providing nonsubstantive answers (don’t know, refuse to answer) more often. With the effects of recruitment source largely explained by mobile device use, the restriction of Facebook advertisements to be only shown on computers becomes an important consideration in the data eventually collected. Any web effort—probability or nonprobability—must carefully consider the impact of mobile device usage on data quality, and ongoing research into these effects is plentiful (Link et al., 2014). Our preliminary examination of response strategy revealed mixed results but some interesting outcomes; mobile users also rounded to even hours and tended to report prototypical or “heaped” values less often than computer users perhaps because they were moving more rapidly through the survey as a result of being away from home or because using a nonstandard keyboard promotes rounding and heaping. The results suggest further work on response strategy in a nonprobability context.
Key to further development of nonprobability surveys is the identification of factors that may make such data collection more efficient, representative, and accurate. We found incentive amount to have minimal effects; further work should explore optimal incentive types and amounts for achieving a desired set of completes while remaining cost efficient. While we expected that the high technology use might impact data quality indicators, its influence was mostly explained by demographic characteristics. High technology use did contribute to fewer nonsubstantive answers, less rounding to hours, and more heaping at prototypical values.
The differences we did see between Google and Facebook mostly explained by device usage and demographics, might change, be magnified, or disappear in a different design. Still it does seem that at the present time, the search engine produced a more diverse, representative sample at a faster pace and at a lower cost than the social media site. The reasons for this would seem to be the sheer volume of people who visit search engines like Google as opposed to social media sites like Facebook. The former is used for a variety of task throughout one’s day, whereas the later has a much more specific intention and audience. If, however, one were looking for a specific, hard-to-reach population, the tables could most certainly be flipped.
While we contribute to the discussion by adding one set of results, we encourage further work on different sources and research questions. Overall, even using commonly visited websites and a strategy for reaching a broad cross section of site users, we did not achieve a sample that worked well for general population comparisons and noted some resulting differences in data quality and response strategy indicators. These differences are difficult to measure and define in a nonprobability study. Given rising data collection costs and declining response rates, these efforts will likely continue to be used for a variety of purposes, especially when the survey requires a quick turnaround or a specific population. Recognizing this trend, we suggest consideration of the impact of recruitment source and further work on ways to design and assess strategies for collecting data in a nonprobability context.
Footnotes
Declaration of Conflicting Interests
The authors declared no potential conflicts of interest with respect to the research, authorship, and/or publication of this article.
Funding
The authors received no financial support for the research, authorship, and/or publication of this article.