
Abstract
This article explores congressional campaigning on the web in 2016. What impact did the unique nature of the 2016 election have on those involved with the creation and maintenance of congressional campaign websites? Did it cause them to alter their approach to online campaigning? Using data from a survey of campaign insiders, we find that the factors that influence how congressional campaigns view and use their websites were largely impervious to the unique electoral environment. Results show that, consistent with previous election years, campaigns maintained a fairly uniform view of likely visitors and target audiences, and they tended to see their campaign websites as digital hubs, best used for capturing the campaign’s overall message. We also find that, as in other years, nonincumbents continued to use their websites to campaign more aggressively than incumbents. Overall, the results suggest that congressional campaigning on the web is primarily driven by stable factors that transcend technological advancements and shifts in the political environment.
Every election cycle provides an opportunity for campaigns to reassess their use of the Internet. As technologies advance and the political environment shifts, campaigns can reconsider their likely visitors and target audiences, the information they post online, and the tools they use to deliver their message—Will they cling to proven online strategies, modify their approach, or adopt new innovations? The ever-changing political and technological environment gives campaigns a chance to continually rethink their approach to web campaigning.
In a recent study, however, we found that U.S. congressional campaigns were fairly consistent in how they viewed and used their websites and other online technologies in the four elections between 2008 and 2014 (Druckman et al., 2017). Survey data show that most campaign insiders saw their websites as digital hubs, ideal for presenting the campaign’s overall message but less than ideal for communicating directly with voters. Meanwhile, incumbency was a consistent determinant of website goals and online negativity. In short, despite the changing political and technological context between 2008 and 2014, there was little change in how congressional campaigns viewed and used the Internet.
What effect did the 2016 election have on congressional campaign insiders? Did it cause them to finally rethink their approach to online campaigning? The 2016 election was unique in certain ways, giving it the potential to upend established behavior. To begin with, there was a lot of attention to social media, particularly at the presidential level, in 2016. YouTube, Facebook, Twitter, and other platforms had been gaining momentum for some time, but 2016 seemed to represent a firm commitment to this trend. Social media had gone from cutting-edge technology to campaign necessity, being implemented and discussed more widely than ever before (Hess, 2016). Some even suggested that 2016 was “the year that social media changed everything” (Romano, 2016: p. 1). This could have changed the way campaigns viewed their online options, possibly allowing social media to supplant websites as the primary tool for communicating broad messages.
The 2016 election also featured intense partisanship and issues of incivility, populism, and party (dis)unity at the presidential level (Leonhardt, 2016; Soergel, 2016). This electoral context was decidedly different, forcing congressional campaigns to consider ways they might alter their online strategies. They had to decide, for example, whether they would continue to target their websites at voters in general over partisan supporters and whether they would keep promoting issue positions over other website goals. This new political context could have affected how congressional campaign insiders viewed and used the web. That said, these novel incentives were competing with a number of well-established factors that have driven online decisions for some time. In what follows, we explore whether or not campaigns altered their strategies.
We start in the next section by describing our survey and data. We then present our results in two parts. The first looks at how congressional campaigns viewed their websites in 2016 compared to previous years. This includes analyses of perceived visitors, target audiences, and the website’s relative effectiveness compared to other forms of communication. The second part looks for possible changes in how congressional campaigns used the web in 2016. Here we analyze website goals and whether websites were used to go negative against opponents. We conclude with a brief discussion of our findings.
Campaign Survey Data
Between 2008 and 2016, we conducted five separate surveys of those involved with the creation and maintenance of online congressional campaigns. Each survey captured basic information about the candidate, the race, and how respondents viewed and used the Internet. 1 We followed the same procedure during each election cycle. We started by creating a list of all major party general election congressional candidates, before searching each candidate’s website for contact information, such as the names, e-mails, and phone numbers of possible respondents (e.g., campaign manager and communications director). Between mid-September and mid-October of each election year, we sent an e-mail request either to the specific contact or to the campaign more generally asking for someone “involved in the construction and/or maintenance of the [campaign] website” to complete a brief, confidential survey via an online link or e-mail. We repeated our request up to three more times either by e-mail or by phone (when available), including a final request in the days immediately following the election.
We sought to contact every campaign over the course of five election cycles. Between 2008 and 2014, we received 500 responses from the 3,060 campaigns for which we had a workable e-mail address or online inquiry form, resulting in an overall response rate of 16.34%, which is not far off the typical range for these types of web surveys (see Couper, 2008, p. 340). We did nearly as well in 2016, receiving 118 responses from the 830 campaigns we contacted, yielding a 14.22% response rate. 2
To confirm that we had contacted appropriate individuals, each survey posed an initial screening question asking respondents to indicate the extent to which they were informed about how the content of the site was determined, on a 7-point scale with higher scores indicating more knowledge. The average response between 2008 and 2014 was 6.51 (SD = .97, n = 494), with 69.43% of respondents rating themselves at the very top of our 7-point scale. Similarly, the average response in 2016 was 6.57 (SD = 1.00, n = 115) with 76.52% of respondents rating themselves as “very informed.”
Respondents were then asked about the campaign for which they worked. This included questions about race competitiveness and the candidate’s office level (House or Senate), party, gender, and incumbency status. Our sample characteristics have been consistent over time and have tended to reflect the actual population of congressional campaigns fairly well (for details on samples between 2008 to 2014, see Druckman et al., 2017). Our 2016 sample of respondents, for example, came from campaigns that were generally in line with the population in terms of race competitiveness (toss-up: 15.52% sample, 6.81% population), office level (Senate: 11.02% sample, 7.67% population), party (Democratic: 55.56% sample, 50.16% population), candidate gender (male: 80.17% sample, 79.03% population), and incumbency status (challengers: 52.99% sample, 41.60% population). 3 While there have been some discrepancies between our sample and the population, the modes have always been the same in all categories except candidate status, where we have had a slightly higher number of responses from challenger campaigns. Nevertheless, we have always had plenty of responses from incumbents, sufficient variation between incumbents and nonincumbents, and no clear basis to believe that incumbents who responded systematically differ from those who did not.
Our surveys also asked respondents to indicate their perception of how often average members of several groups (e.g., undecided voters, supporters, journalists) visit their sites, on a 7-point scale, with higher scores indicating more frequent visits. Respondents used a similar scale to rate the priority of these same groups as target audiences of the website, with higher scores indicating higher priority. We also asked respondents to assess, again with a 7-point scale, how they thought campaign websites compared to other communications (e.g., direct mailings and television ads) in terms of “capturing the campaign’s overall strategy,” how websites compared to e-mail and social media in terms of communicating directly with voters (2014 and 2016 only), and to rate the importance of various content goals for their site (e.g., persuading undecided voters, increasing awareness of issue positions, and fund-raising). Respondents additionally noted whether their sites included any negative mentions of their opponents.
It is important to reiterate that all responses were given on the promise of complete anonymity, so we have no way to know exactly which campaigns responded. This means that we are unable to determine whether specific campaigns responded in multiple years or match individual survey results to other measures such as actual website contact, fund-raising data, or district partisanship. We believe a survey of those involved in campaign website design and maintenance has particular advantages over relying on content analysis data of the websites (e.g., Druckman, Kifer, & Parkin, 2014; Foot & Schneider, 2006). Specifically, it allows us to isolate the expressed motivation of campaign insiders. Moreover, repeating the survey over multiple years allows us to assess how these motivations might have changed over time and in different electoral contexts.
Congressional Campaigning on the Web in 2016
In this section, we analyze how campaign personnel view and use their campaign websites. We address each topic—views and uses—in turn. For each, we compare the stable trends we uncovered from 2008 through 2014 to data from 2016 to answer the question of whether this particular election affected (e.g., interrupted) what had become typical. This is an interesting question, given the unique nature of the 2016 campaign. As mentioned, there is the possibility that 2016 changed congressional campaigning on the web. For example, intensifying polarization and incivility might have led congressional campaigns to shift their website target audience such that they put less priority on voters in general and more priority on supporters (Soergel, 2016). The campaign context could have also stimulated greater negativity such that even incumbents—who historically avoid negative campaigning (Kahn & Kenney, 2004)—go negative more frequently. Additionally, the growing emphasis on social media may have led campaigns to see websites as relatively less effective as hubs for communicating the campaign’s overall message (Heckman, 2015; Patterson, 2016). The bottom line is that 2016 appears to be a strong test case for stability. If campaigns maintained their traditional strategies in 2016, it would be powerful evidence that the place of websites in congressional campaigns is quite stable.
Views of Websites
Despite the uniqueness of 2016, we do expect some stability due to three fundamental premises. First, campaigns have limited control over the audiences that visit their websites. Regardless of technological advancements and attempts to drive traffic to the site with social media posts and targeted ads, the decision to visit a campaign website still requires deliberate choice and action by individuals. The implication is that those following the campaign most closely—engaged voters, journalists and bloggers who write about the campaign, and supporters and activists who selectively expose themselves to media (Taber & Lodge, 2006)—will visit much more often than average voters. This is true even in 2016: The same subgroups should be relatively more or less likely to visit despite a changed context.
Second, this lack of control does not constrain who campaigns target. Campaigns realize that any items placed on their websites can potentially become central to the campaign narrative—it takes only a journalist or an opponent to make it so (see Gruszczynski, 2015; Ireland & Nash, 2001, pp. 14–15; Owen, 2011). For this reason, campaigns need to be cognizant of the latent audience of all voters, regardless of the frequency with which average voters access the site. The main targets will thus be voters, generally, and more specifically, undecided voters. Again, there is no theoretical reason to expect this changed in 2016.
Third, websites are a relatively unique media insofar as they provide a platform for unmediated and virtually unlimited presentation of information (see Druckman, Kifer, & Parkin, 2009). This contrasts with other media (e.g., television news) that do not allow campaigns to communicate directly or communications that face finite time and space limits (e.g., speeches, mailers, most other digital media such as e-mail and Twitter). This means websites, relative to other media, can serve as digital hubs that encapsulate their entire campaign message. Other social media may be playing an increasingly important role in campaigns, but it does not change what information can be provided on the distinct media (see, e.g., Bode & Dalrymple, 2016; Jungherr, 2016).
We further note that these three premises should be invariant, not just across years but also across candidates and context. For example, all candidates, regardless of incumbency status, party, or gender, must deal with the fact that they lack control over website visitors, and this lack of control persists, despite technological innovations and changing political environments.
In Figure 1, we present the averages and standard deviations from our question about the perceived frequency of website visits in previous years (average scores from 2008 to 2014) and 2016. Recall this was measured on a 7-point scale with higher scores indicating greater frequency and that we are interested in respondents’ perceptions, which we believe drive their behaviors. Both the gray (2008–2014) and black (2016) bars show that campaigns perceived highly engaged voters, supportive voters, supportive activists, journalists, and then bloggers as the most frequent visitors. There is then a statistically significant drop to voters in general and undecided voters, with opponent’s voters and nonvoters considered the least likely to visit (e.g., comparing bloggers to voters in general in 2008–2014 gives t417 = 7.306, p = .000; comparing bloggers to voters in general in 2016 gives t98 = 1.767, p = .080). 4 Figure 1 also shows that results in 2016 are virtually identical to those found between 2008 and 2014. In fact, all differences between 2016 (black bars) and earlier years (gray bars) are statistically insignificant except for the drop in perceived visits by opponent’s voters (comparing opponent’s voters in 2008–2014 to 2016 gives t520 = 2.187, p = .029) and a marginal drop in perceived visits by bloggers (comparing bloggers in 2008–2014 to 2016 gives t520 = 1.618, p = .106).
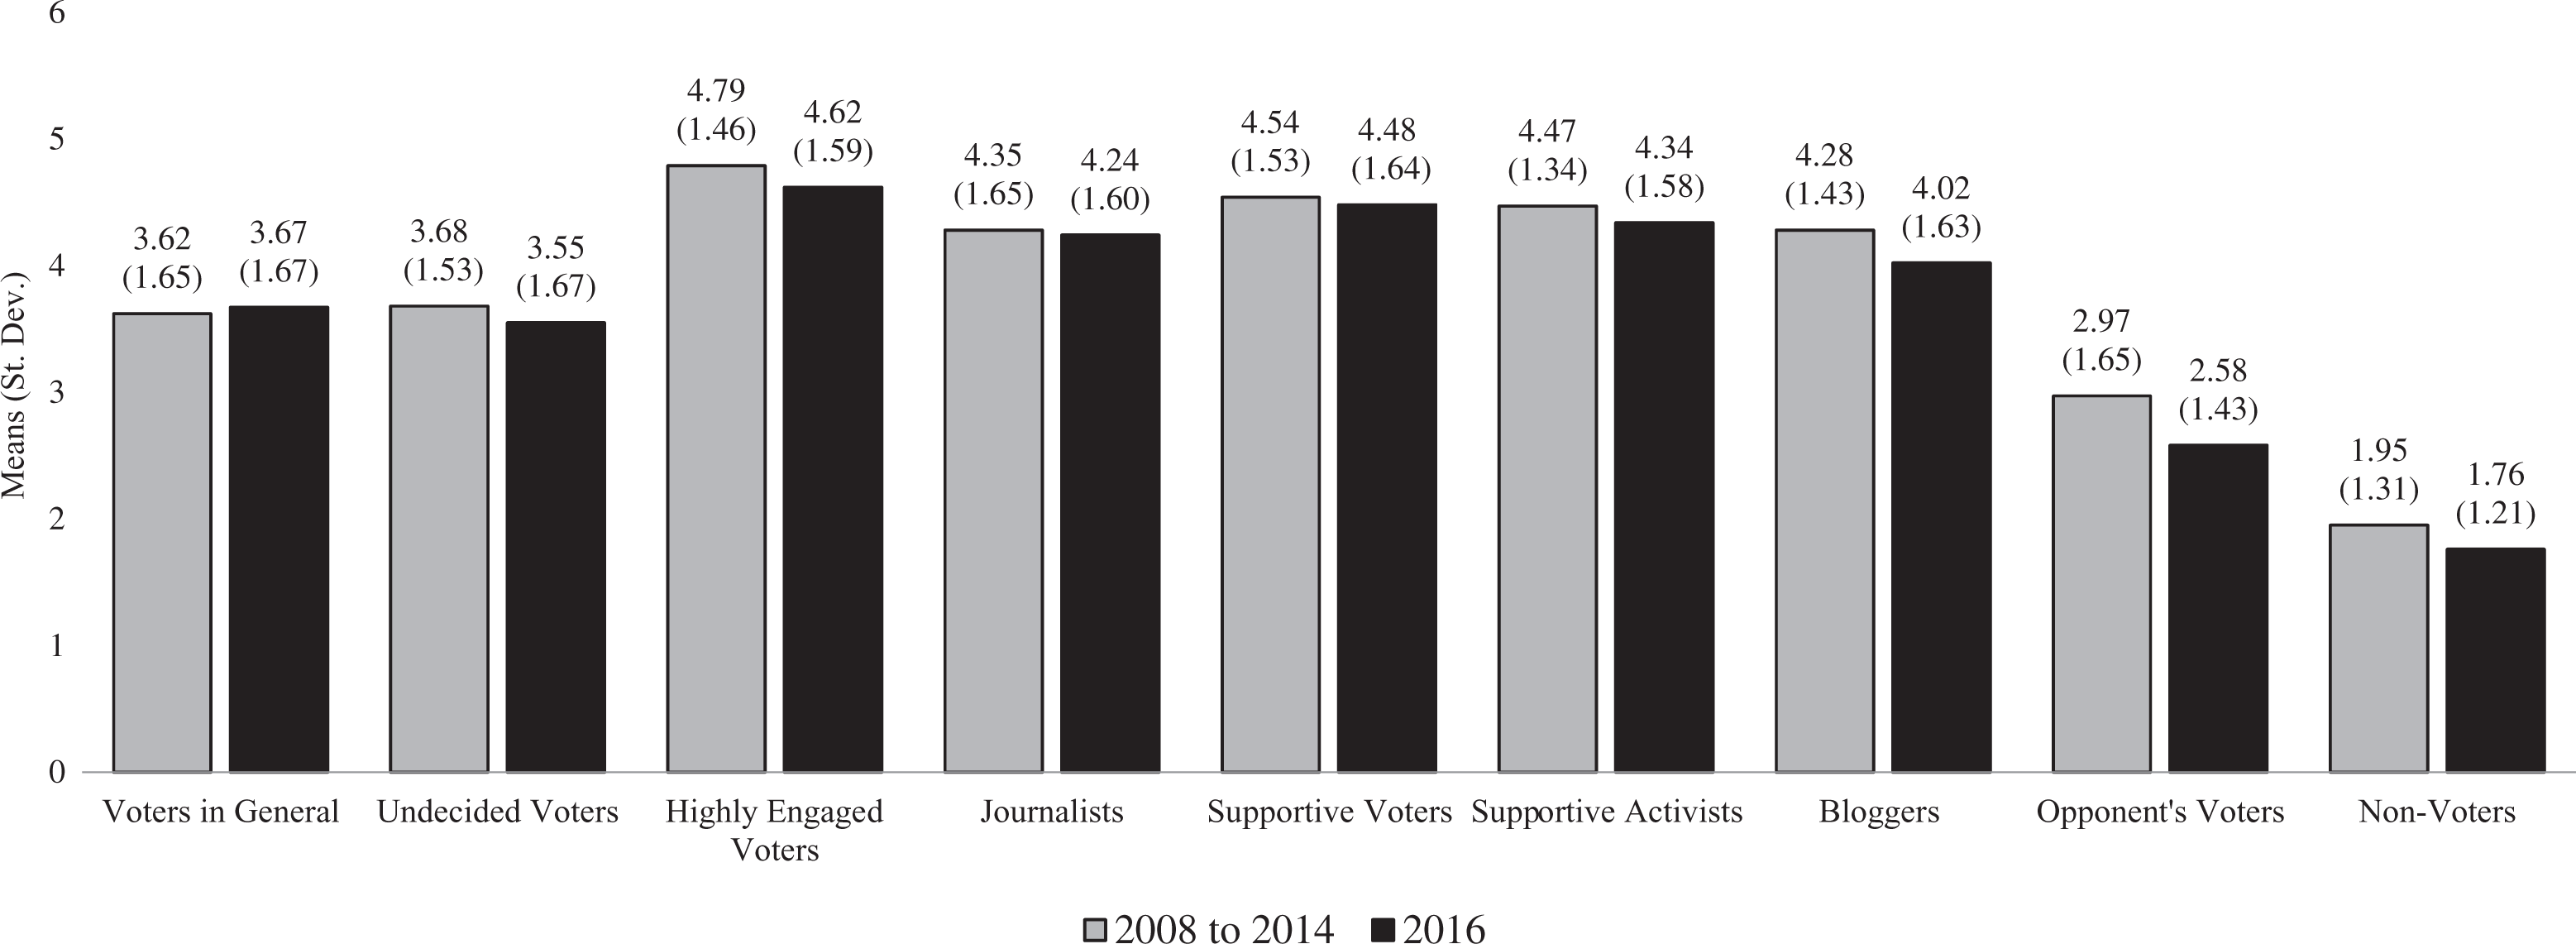
Perceived website visitor frequency.
In Figure 2, we present the same information from our question on primary target audiences. The results show that campaigns consistently targeted voters in general and undecided voters over all others (e.g., comparing undecided voters to highly engaged voters in 2008–2014 gives t457 = 6.271, p = .000; comparing undecided voters to highly engaged voters in 2016 gives t100 = 1.767, p = .020). Campaigns play it safe by targeting general audiences, even if they visit less frequently, over supporters who represent their base. Additionally, we find that there are no significant differences in perceived targets between 2016 and earlier years (e.g., comparing opponent’s voters in 2008–2014 to 2016 gives t559 = 1.419, p = .157). This suggests that even the polarized nature of the 2016 campaign, when people may have been more selective in media exposure, did not change congressional campaign strategy when it came to website targets. The reality of “potential” access to all meant all possible voters remained the primary target. 5
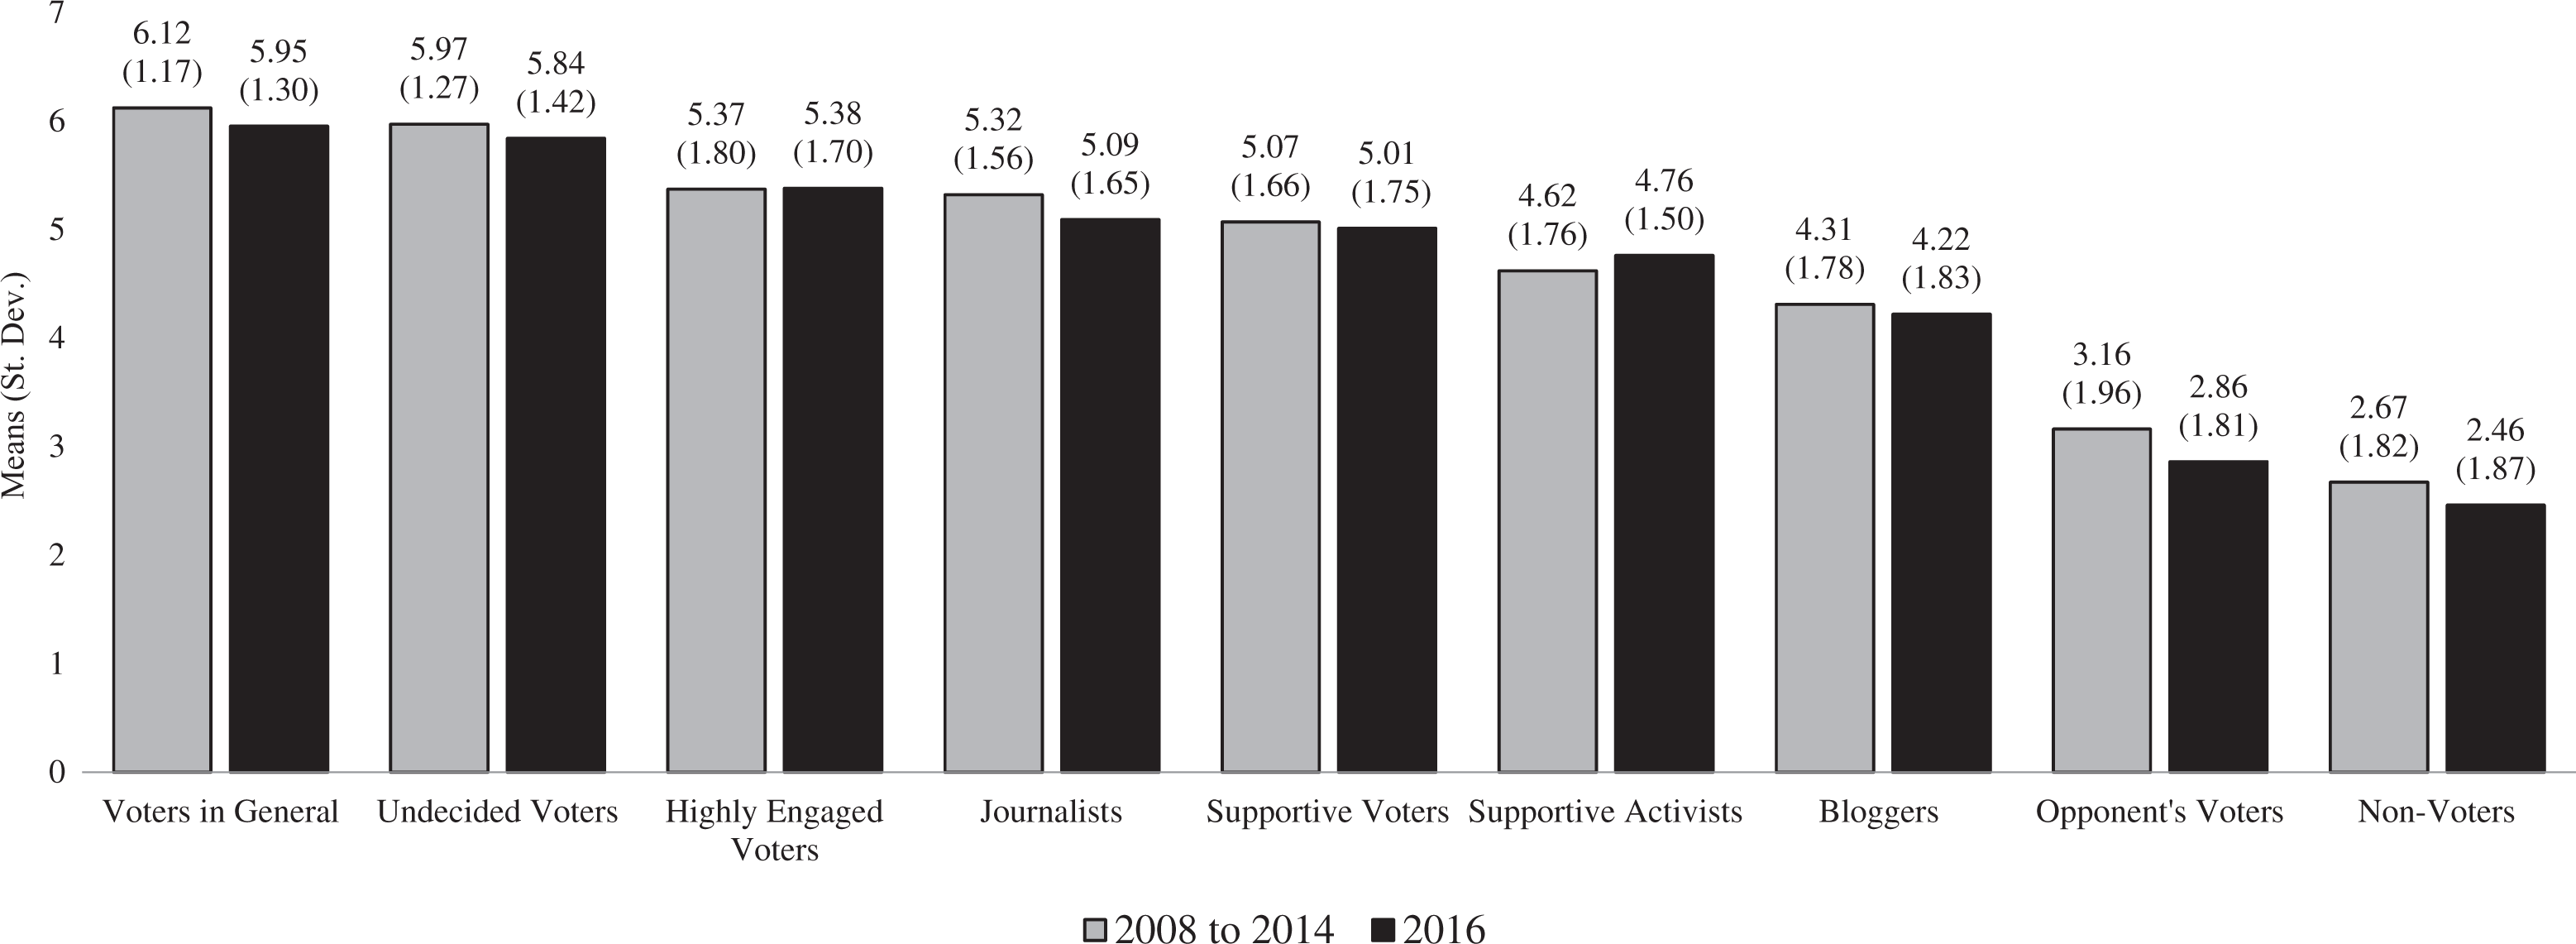
Website targets.
Congressional campaigns did not change how they viewed their likely visitors and targets in 2016. Clearly, the realities of voter behavior and technological limits and opportunities, and not the uniqueness of the 2016 campaign, drove views of websites. Moreover, the consistency of the approach is an important reminder to avoid confounding the perceived frequency of visitors with the intended targets of the website. Certain groups may be seen as more important even if they visit less often (cf. Trent, Friedenberg, & Denton, 2011, pp. 368–369). This disconnect also demonstrates the danger, particularly in a highly polarized environment like 2016, of targeting supporters with websites that might alienate some other crucial group of voters. Focusing the website on a broad audience may do little to fire up the base, but it ensures that potentially persuadable voters will not be turned off, even if they do not visit all that often. 6
How did campaigns view their websites in comparison to other media and forms of communication in 2016? We suspect that technological realities would lead campaigns to continue to view their websites as digital hubs reflecting their entire campaign message. This is the case both because of the unmediated and nearly infinite information capacity of websites and because the main target audience of voters in general would be most likely persuaded by full information, rather than potentially contrary targeted information.
To test this, we asked respondents to rate how well campaign websites, candidate speeches, informal conversations, mailings, media coverage, and television ads “capture the campaign’s overall strategy.” Figure 3 presents averages and standard deviations and shows that respondents in 2016 (black bars) estimated websites to be more representative of their overall strategy than all other forms of communication. Campaign websites are rated slightly higher than candidate speeches and informal conversations while clearly outpacing the ability of mailings, media coverage, and television ads to capture the campaign’s overall message. 7 Moreover, comparing the black bars to the gray bars shows that the 2016 results match those from previous years. In fact, the only change over time that approaches statistical significance is with television ads, which dropped from 4.75 to 4.28 (comparing television ads in 2008–2014 to 2016 gives t354 = 1.661, p = .098). Campaign insiders clearly still value websites for their ability to present an unlimited and unmediated portrait of their entire campaign strategy.
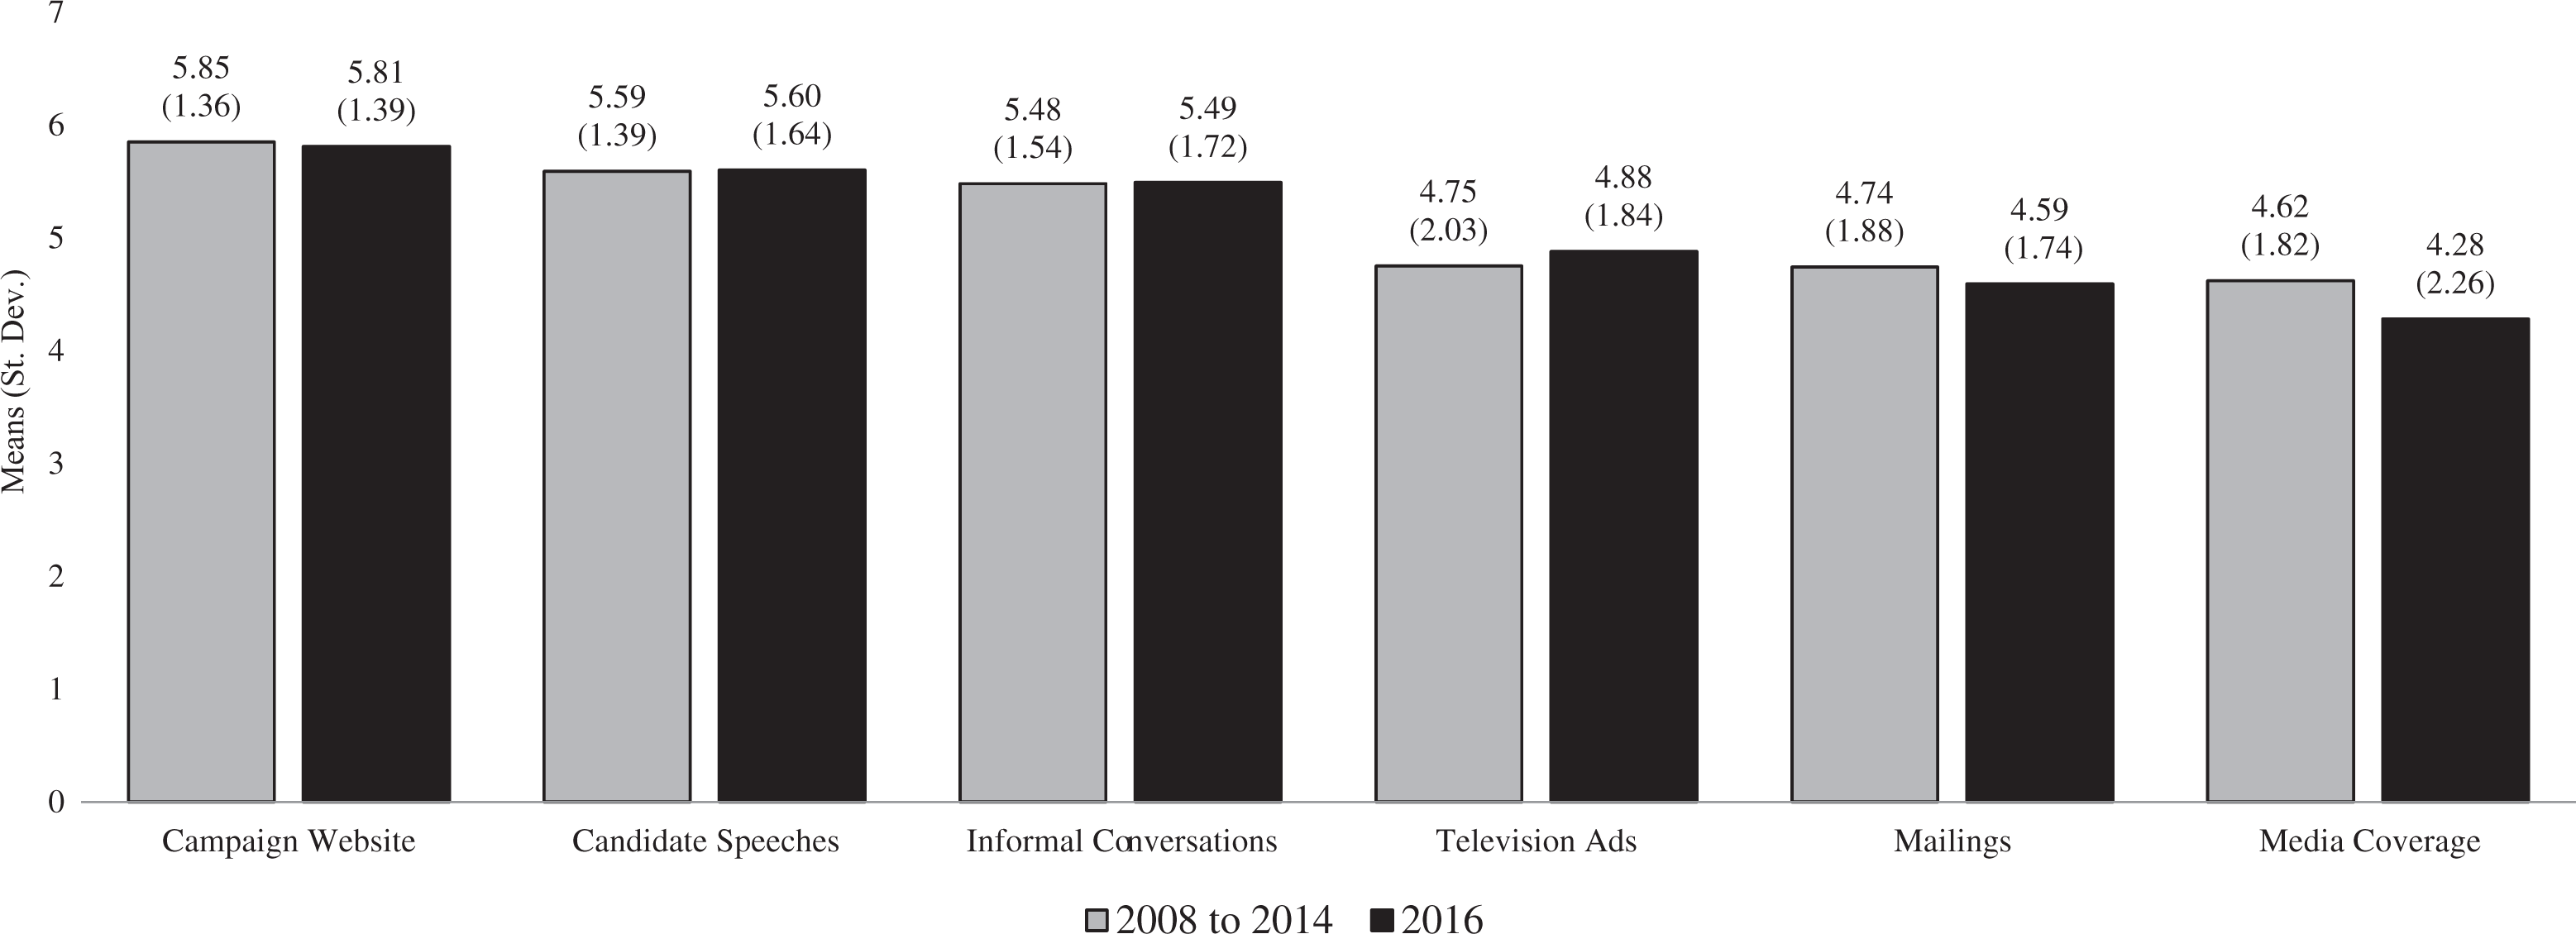
Communicating the campaign’s overall strategy.
Our last inquiry into how campaigns view their websites concerns the relative effectiveness of different new media. We expect that campaign insiders will continue to see their websites as inferior to Facebook, e-mail, Twitter, and possibly other social media when it comes to communicating directly with voters. This is because, unlike e-mail and social media, campaign websites present passive information that cannot be directly delivered to those who have joined an e-mail list or subscribed to a social media feed (see, e.g., Bimber, 2014; Gerodimos & Justinussen, 2015). Moreover, this difference in perceived communication capacity should remain stable in 2016, given that the inherent qualities of these media are largely unchanged. Even if the importance of different media shifted, the effectiveness (e.g., reach to communicate with voters) should not have changed.
We asked respondents to estimate how well campaign websites, e-mail, and various social media worked to communicate with voters in 2014 and 2016 (question not asked from 2008 to 2012). The results in Figure 4 show that respondents saw websites as moderately useful although significantly less effective than Facebook and e-mail (e.g., comparing e-mail to campaign websites in 2016 gives t93 = 5.090, p = .000). While congressional campaigns used Twitter moderately in 2016, they reported (not shown) much less reliance on YouTube (3.10), Instagram (2.59), LinkedIn (1.73), and other social media (2.18), indicating a nuanced view of social media as a direct communications tool (e.g., comparing campaign websites to Twitter gives t92 = 0.362, p = .718; comparing campaign websites to YouTube gives t91 = 5.806, p = .000). Perhaps campaigns do not see social media with length (Twitter) or written content (Instagram) constraints as particularly effective for communicating with voters. This pattern may also reflect an understanding of social media use in that, according to the Pew Research Center, 79% of online adults use Facebook compared to 32% for Instagram, 29% for LinkedIn, and 24% for Twitter (Greenwood, Perrin, & Duggan, 2016).
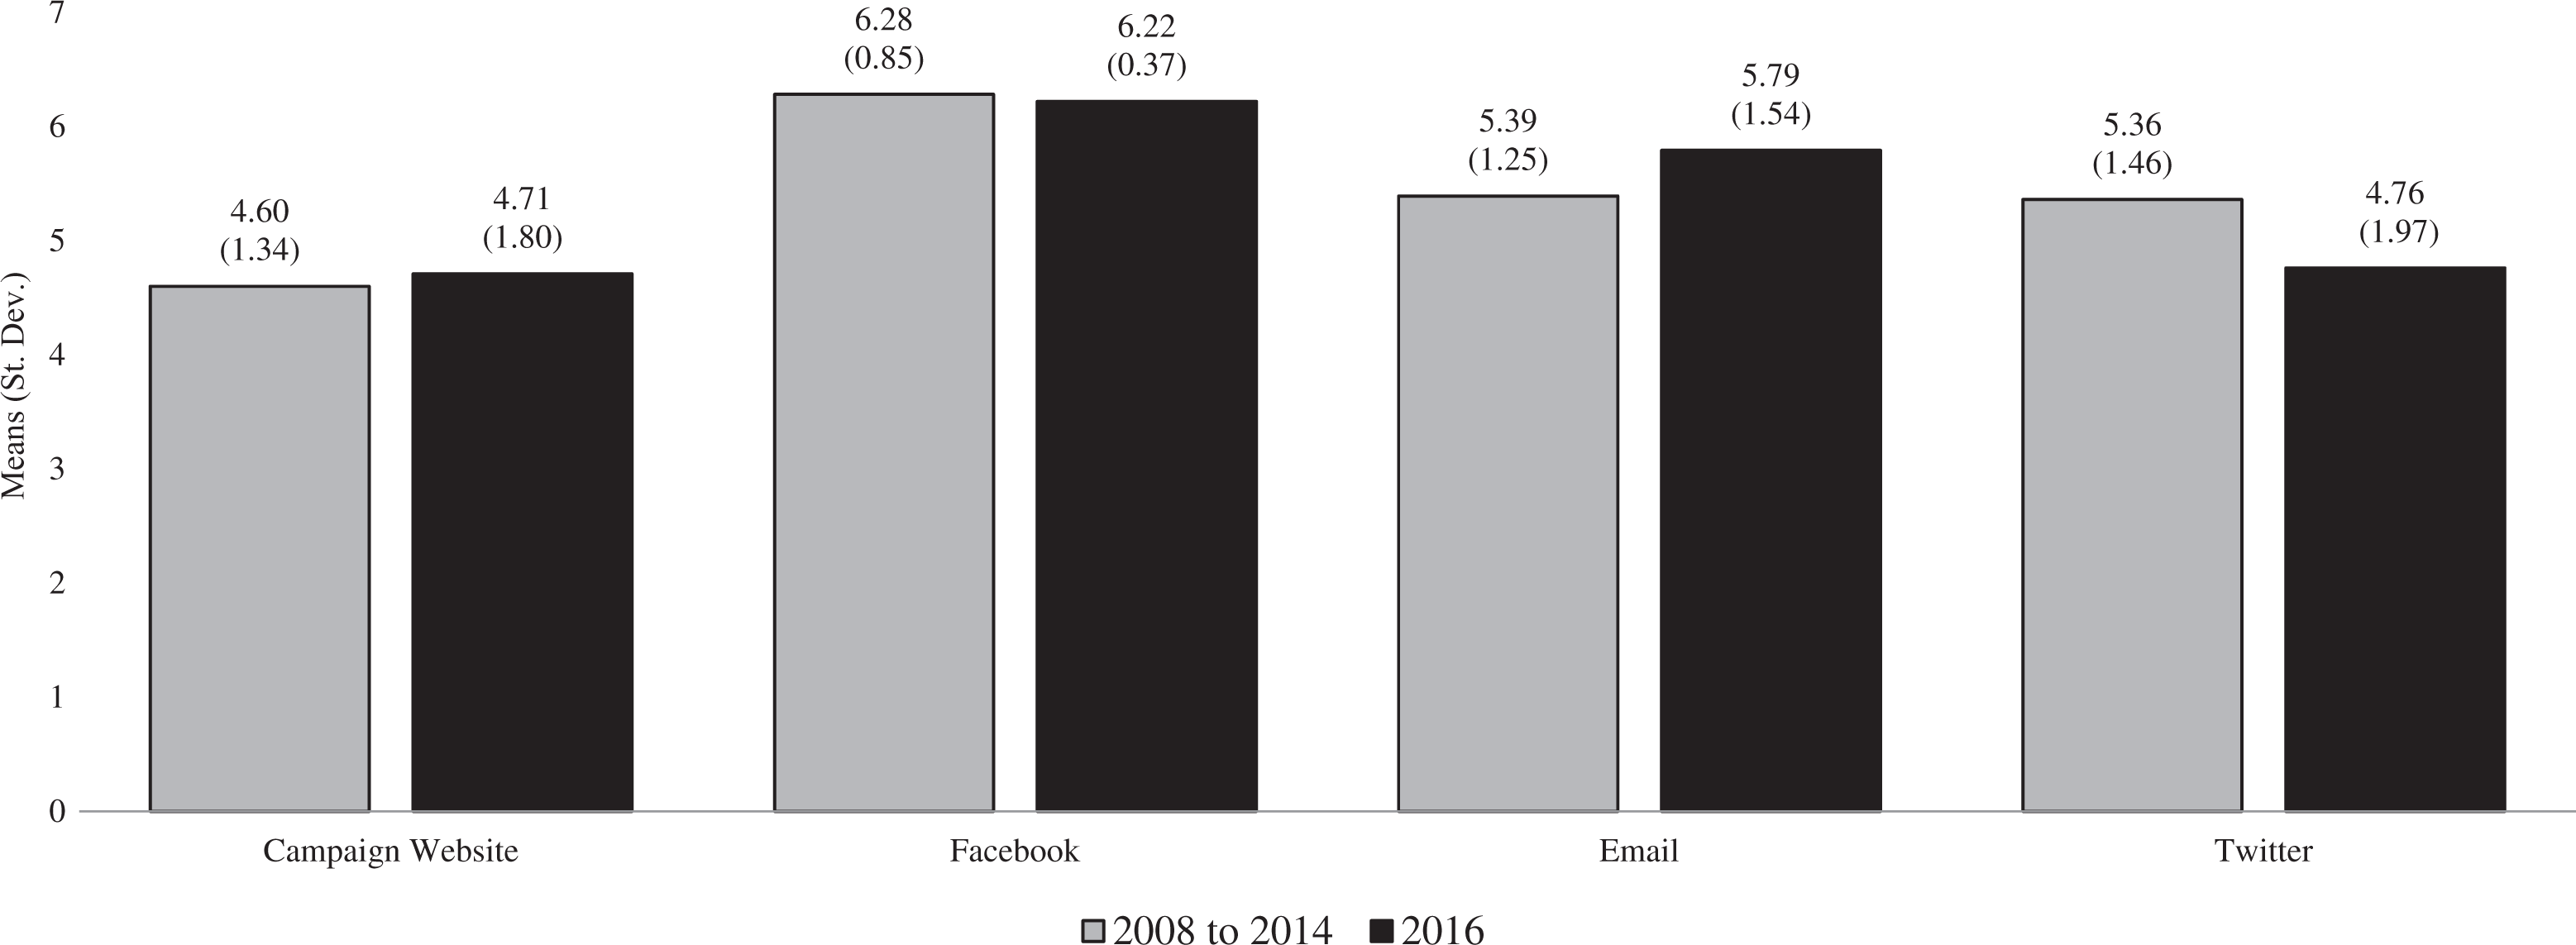
Effectiveness of various media in communicating with voters.
Figure 4 also shows consistency over time in the perception of media effectiveness. The only significant differences between 2014 and 2016 are with the perceived communicative effectiveness of e-mail increasing marginally from 5.39 to 5.79 (comparing e-mail in 2014 to 2016 gives t177 = 1.879, p = .062) and Twitter dropping from 5.39 to 4.76 (comparing Twitter in 2014 to 2016 gives t176 = 2.508, p = .013). The fact that websites maintained a relatively lower ranking than Facebook and e-mail is sensible insofar as websites, despite providing an opportunity for holistic messaging, are limited in terms of reach and less effective in terms of actively communicating. In other words, websites are effective as repositories of information to which campaigns may refer interested voters through other mechanisms (e.g., social media, signs, and handouts). This stability means that although 2016 was purported to be the ultimate social media campaign (McCabe, 2015; Romano, 2016), little changed in terms of congressional campaign websites being used to reach voters. This is likely due to the foundational premises that drive online strategies and the fact that the inherent qualities of various media changed very little in 2016. It may take a more dramatic technological shift for congressional campaigns to rethink how they communicate with voters online.
All of these results present a virtually unchanged view of congressional campaigning on the web in 2016. Those who design and maintain campaign websites clearly resisted the opportunity to reassess their approach in the context of a historic election, which speaks to the power of fundamental strategic incentives over changes in the technological and political environment. Campaigns continue to see their websites as digital hubs, ideally suited for presenting broad messages to voters in general while favoring e-mail and Facebook for communicating directly with supporters and engaged voters. Moreover, in regressions available from the authors, we find limited variability in these results across campaign types—the views of websites reported here are virtually constant regardless of race competitiveness, candidate party, office level, incumbency, or gender. The realities of voter behavior and technology apply across campaigns, which speaks to the fact that these views are based on powerful premises that are largely constant across both time and electoral context. Even the 2016 campaign could not dislodge views of websites, at least at the congressional level. This also speaks to perhaps the potentially limited direct impact that presidential campaigns have on congressional campaigning (Jacobson, 2013). The lesson is continuity.
Website Uses
While campaigns may have a fairly uniform and stable view of their websites, this does not necessarily mean that they all use their websites in the same way. Indeed, the fundamental logic underlying website usage differs from the aforementioned key points about how they view their websites. This is because different types of candidates—even if they all view voters in general as the primary target—have distinct incentives on what type of message to put forth. The central point of variation in message preference concerns incumbency status.
It is well known that incumbents enjoy an edge over challengers, all else constant. Their status alone can generate up to a 10% advantage in vote share (Abramowitz, Alexander, & Gunning, 2006; Ansolabehere & Snyder, 2004, p. 487; Hainmueller, Hall, & Snyder, 2015; Jacobson, 2013) which has meant that House and Senate incumbents have historically won more than 85% of the time (Davidson, Oleszek, Lee, & Schickler, 2016, p. 94). This gives average incumbents fewer incentives to actively campaign. Instead, they would be best served by focusing on what makes incumbents preferable, namely, their backgrounds, which involves having ties to the district, experience, and records of service to their constituents (e.g., Fiorina, 1989; Gronke, 2000, p. 142; Jacobson, 2013; also see Druckman, Kifer, & Parkin, 2009, 2010). In contrast, challengers need to get voters’ attention, which they can do by going negative (Druckman & McDermott, 2008, p. 2; Marcus, Neuman, & MacKuen, 2000), and they must mobilize voters to vote and persuade them to focus on issues and other items that can counter the incumbency advantage. Again, 2016 may have shifted incentives, given candidates may have thought of alternative strategies in light of the presidential campaign; however, the aforementioned incentives are fairly invariant, which means we may still see stability.
We asked respondents to rate the importance of various website goals (i.e., how they used their websites) on 7-point scales. Figure 5 shows that the primary goal of most campaigns is to increase awareness of issue positions, followed by increasing awareness of the candidate’s background, and persuading undecided voters. The graph then shows a gradual decline from fund-raising to providing information on the opponent’s background. This order is almost entirely consistent with the goals expressed by campaign insiders in previous years (2008–2014). Of the 11 goals listed in Figure 5, we find only 3 statistically significant differences between the gray and the black bars. Respondents reported marginally less emphasis on increasing awareness of issue positions (comparing issue positions in 2008–2014 to 2016 gives t529 = 1.792, p = .074), marginally less emphasis on signing up volunteers (comparing volunteers in 2008–2014 to 2016 gives t528 = 1.720, p = .086), and less attention to providing information on opponent’s issues (comparing opponent’s issues in 2008–2014 to 2016 gives t525 = 2.546, p = .011). Somewhat surprisingly, we also find (not shown) a significant drop in negativity with 63% of congressional campaign websites featuring negative information about their opponent between 2008 and 2014 compared to only 38% going negative in 2016 (comparing negativity in 2008–2014 to 2016 gives t541 = 4.583, p = .000). This is an intriguing finding insofar as the incivility and negativity of the presidential campaign may have led congressional candidates to avoid being connected with such a negative and polarizing environment. Aside from negativity, the website goals pursued by congressional campaigns changed very little in 2016.
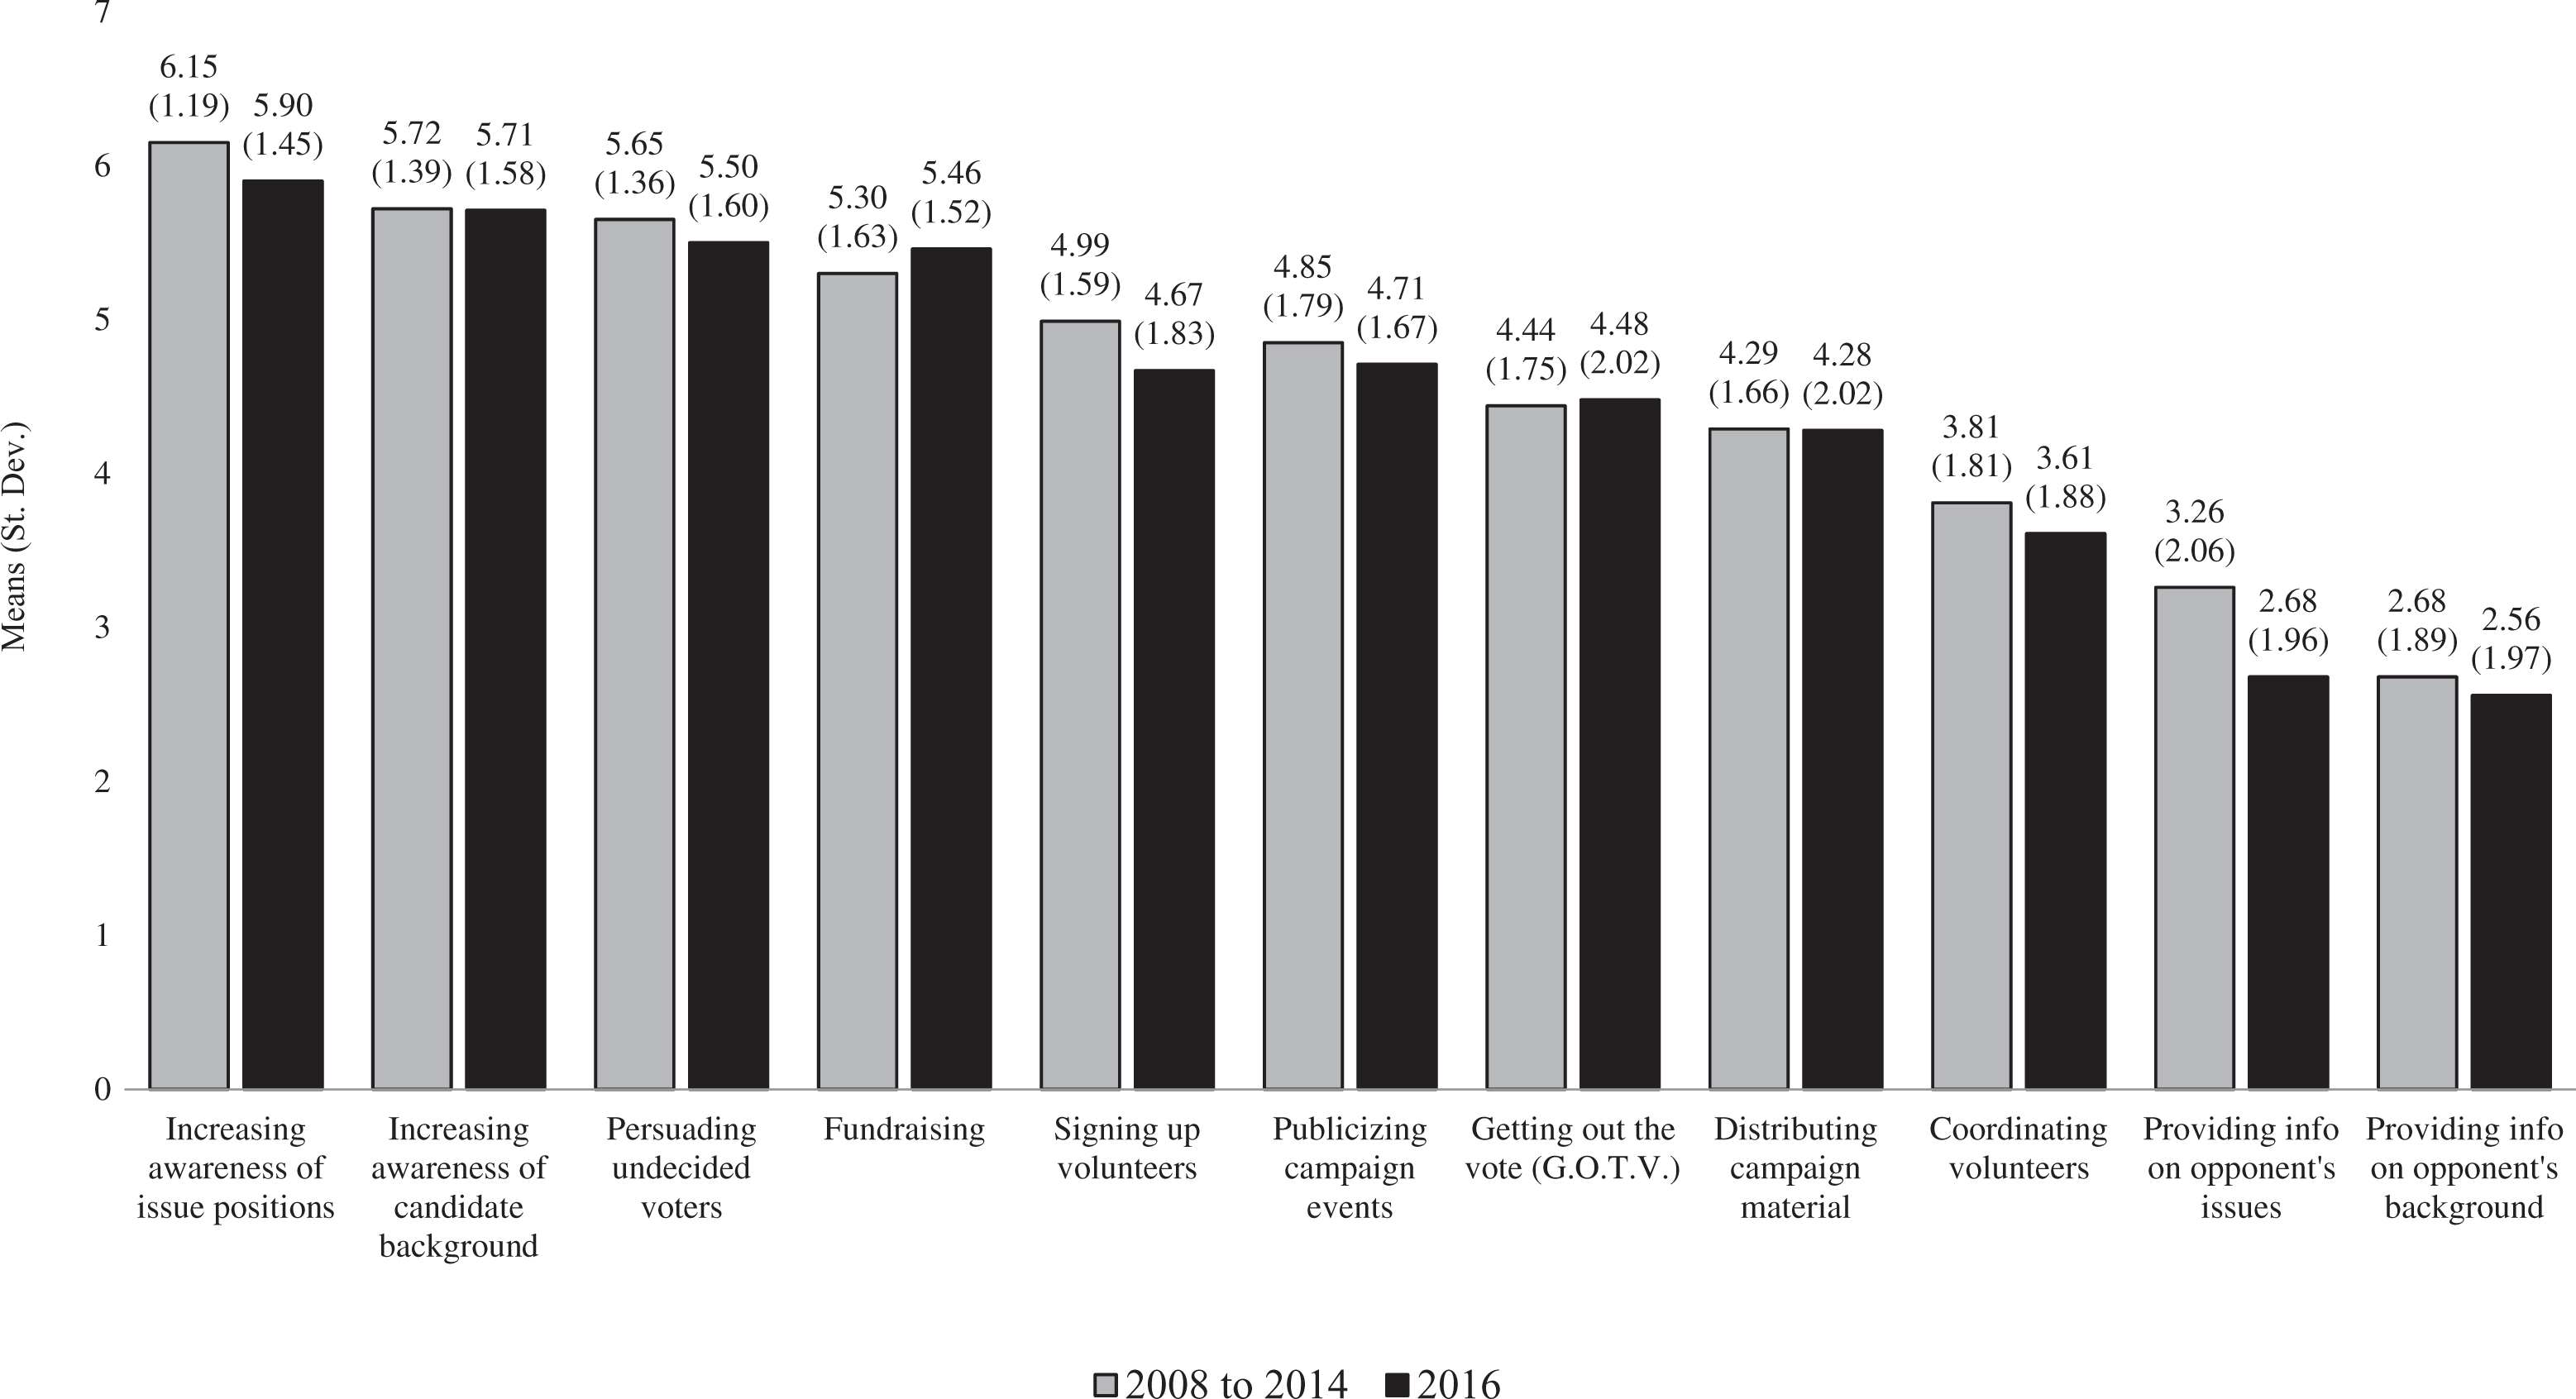
Campaign website uses.
Additional analysis confirms our expectations about the factors that drive campaign website use. In a series of regressions reported in earlier research, we find that incumbency status is virtually the only statistically significant predictor of website goals and negativity between 2008 and 2014. Incumbency is positively associated with promoting the candidate’s background while negatively associated with all other uses, including going negative (see Druckman et al., 2017). The results in Table 1 confirm the same pattern in 2016. Although they are not as robust as past years, the results show that campaign website use is driven primarily by incumbency status and that changes in technology and the political environment have done little to affect this. As in past years, incumbents in 2016 promoted their backgrounds online more than anything else. Results in Table 2, which predict the use of negativity, further confirm the power of incumbency over time. Specifically, we find that, although the absolute amount of negativity in 2016 dropped from past years, incumbents are still consistently less likely to go negative than nonincumbents, all else constant.
Campaign Website Content Goals (2016).
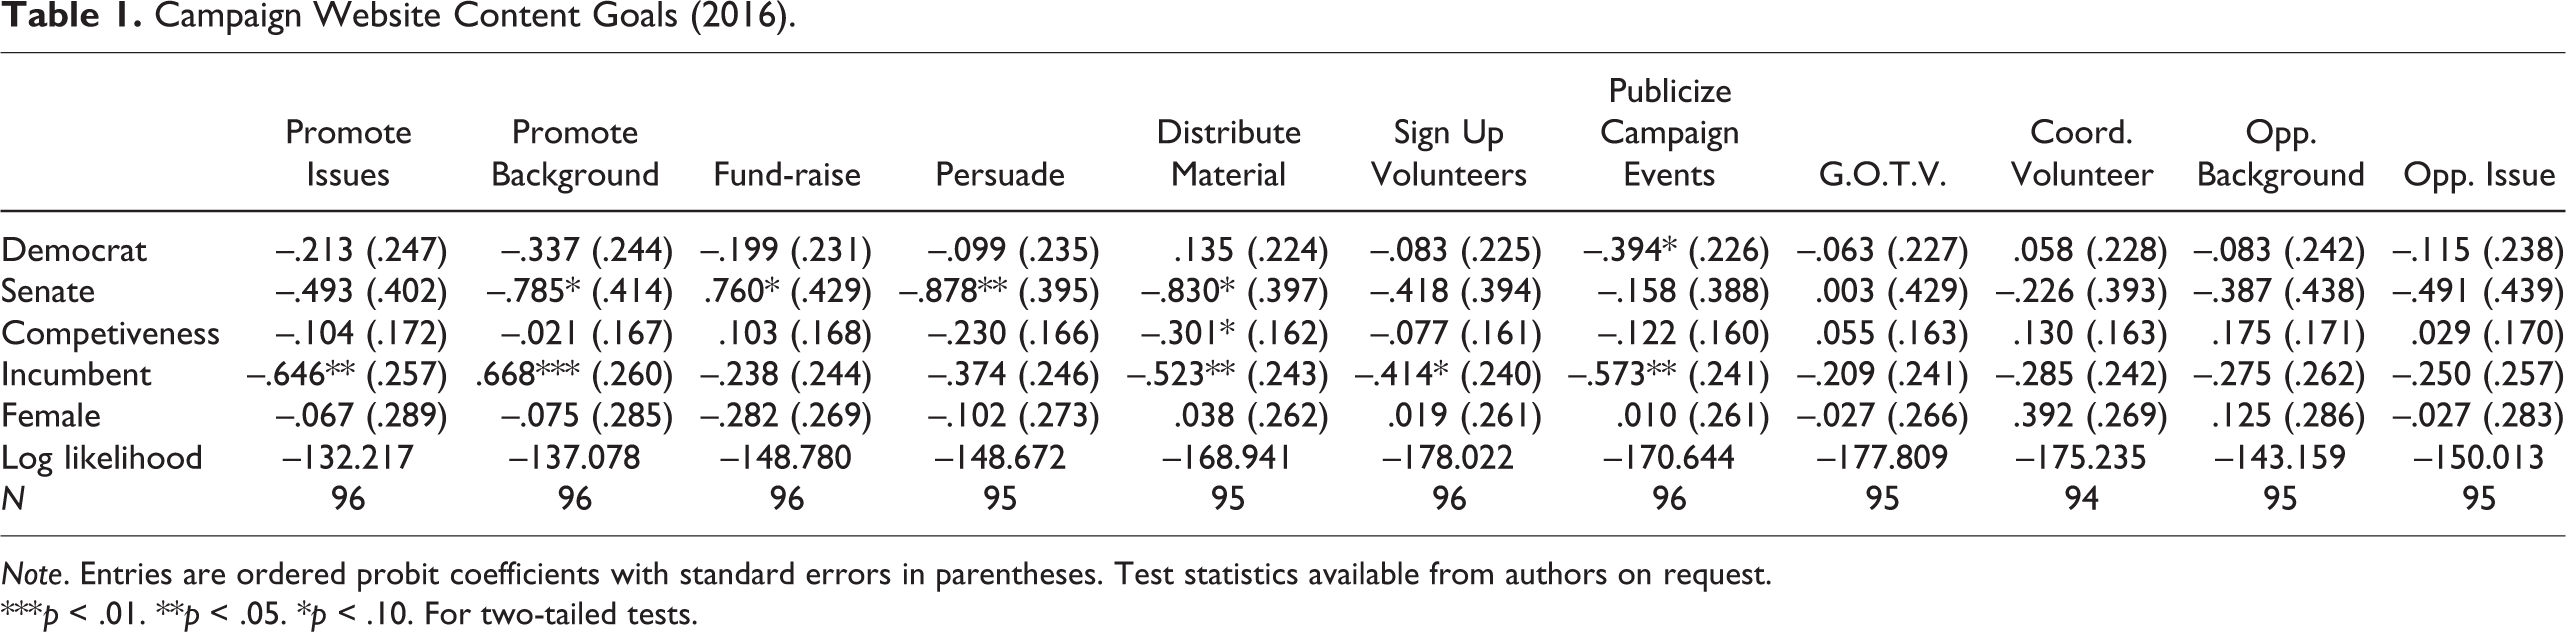
Note. Entries are ordered probit coefficients with standard errors in parentheses. Test statistics available from authors on request.
***p < .01. **p < .05. *p < .10. For two-tailed tests.
Going Negative.
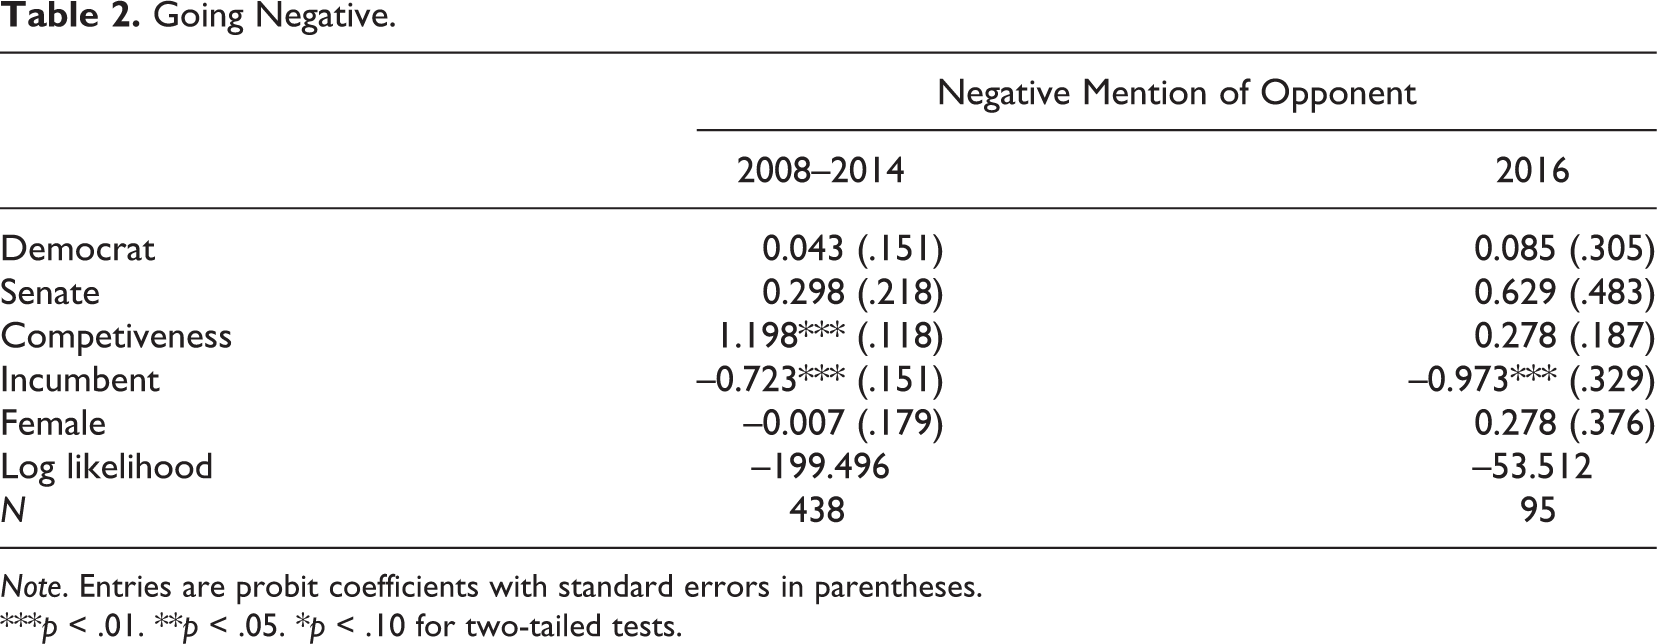
Note. Entries are probit coefficients with standard errors in parentheses.
***p < .01. **p < .05. *p < .10 for two-tailed tests.
Taken together, these results paint a clear picture of how congressional campaign insiders viewed and used their websites in 2016. They targeted voters in general while recognizing that engaged voters and supporters were more likely to visit, and they saw their websites as digital hubs, better suited for capturing their entire strategy than communicating directly with supporters. Nonincumbent campaigns also used their websites much more aggressively than their incumbent counterparts. On nearly every measure, congressional campaign insiders reported almost identical responses to previous years, despite the fact that 2016 provided an opportunity to reassess their approach to online campaigning. Technological change and the unique 2016 campaign context did not change incentives in congressional campaigns. The fundamentals of congressional campaigning seem virtually invulnerable to technological and contextual changes, at least in the face of the historic 2016 campaign.
Conclusion
The Internet has enabled campaigns to reach party activists, journalists, and potential voters in new ways, whether through dedicated campaign websites or through social media. Over time, campaigns have evolved their use of online tools based on perceived communication needs as well as the incentives and constraints imposed by electoral politics (e.g., Druckman, Kifer, & Parkin, 2014). Campaigns have also developed a new class of campaign professionals dedicated to creating and curating online content, with digital directors and others taking a place among the highest level of campaign staffers (Kreiss, 2016). This project tapped this expert group’s knowledge to give an insider perspective on how online campaigning might have changed in 2016. As such, it provides novel insight into how congressional campaigns think about their online decisions.
Every electoral cycle creates a context in which campaigns must operate. The nature and outcome of 2016 surprised most scholars, pundits, and citizens. We sought to assess whether these changing realities altered how congressional campaigns viewed and used the web by following up on our prior surveys of campaign website personnel from 2008 through 2014.
Perhaps surprisingly, we find considerable continuity in how campaigns approached their websites. National-level politics did not dislodge normal campaign practices, at least when it came to web campaigning. Congressional campaign websites continue to serve as digital hubs, capturing a campaign’s overall message and being used strategically depending on a candidate’s status. Despite changes in the technology available to campaigns, a major finding of our research over more than a decade is that the variables that affect the content of campaign communications has remained relatively constant (Druckman, Kifer, & Parkin, 2007, 2014). This shows that even in an increasingly fragmented and micro-targeted environment, websites remain one area aimed at the larger population and thus counter to ostensible trends that could have been even further exaggerated in a polarized election year. Overall, the results of this study and others are clear: Congressional campaign use of the Internet remains consistent and resistant to change.
Footnotes
Authors’ Note
We thank the National Science Foundation (1627413, 1627431) for generous research support. In addition, Martin Kifer and Michael Parkin thank High Point University and Oberlin College, respectively, for sabbatical support to complete this work. We also thank Edward Douglass, Sam Gubitz, Lena Kesden, Kendall Mahavier, Brady Marks, Devon McMahon, Bit Meehan, Jacob Rothschild, Richard Shafranek, Gabe Steller, and Zelda Wengrod for research assistance.
Declaration of Conflicting Interests
The authors declared no potential conflicts of interest with respect to the research, authorship, and/or publication of this article.
Funding
The authors disclosed receipt of the following financial support for the research, authorship, and/or publication of this article: We have received financial support from the National Science Foundation (1627413, 1627431).