
Abstract
This article investigates how mail-based online panel recruitment can be facilitated through incentives. The analysis relies on two incentive experiments and their effects on panel recruitment, and the intermediate participation in the recruitment survey. The experiments were implemented in the context of the German Emigration and Remigration Panel Study and encompass two samples of randomly sampled persons. Tested incentives include a conditional lottery, conditional monetary incentives, and the combination of unconditional money-in-hand with conditional monetary incentives. For an encompassing evaluation of the link between incentives and panel recruitment, the article further assesses the incentives’ implications for demographic composition and panel recruitment unit costs. Multivariate analysis indicates that low combined incentives (€5/€5) or, where unconditional disbursement is unfeasible, high conditional incentives (€20) are most effective in enhancing panel participation. In terms of demographic bias, low combined incentives (€5/€5) and €10 conditional incentives are the favored options. The budget options from the perspective of panel recruitment include the lottery and the €10 conditional incentive which break-even at net sample sizes of 1000.
Keywords
Introduction
Web surveys relying on probability-based samples and mail invitations have become increasingly popular. Increasing internet penetration in developed countries and decreasing landline penetration and ubiquity make web surveys more attractive (Callegaro et al., 2014; Pandita, 2017). Not the least, the approach is cheaper compared with personal interviews (Bosnjak et al., 2015). While cross-sectional surveys have been testing mail invitation web survey designs for a while (Dillman, 2017; Messer & Dillman, 2011), panel surveys have started exploring this trail more recently (e.g., German Internet Panel; Cornesse et al., 2021; European Value Study; Christmann et al., 2019; Understanding Society Innovation Panel; Lynn, 2020; Sakshaug et al., 2020).
There are two critical steps when setting up online panels with the exclusive reliance on mail invitations (Callegaro & DiSogra, 2008; Genoni et al., 2021; Sakshaug et al., 2020). The first one is the transition from the analogous invitation letter to a digitalized online questionnaire. It is rather cumbersome to copy such information as URL and token from paper to an electronic device while a feasible device could be missing altogether at the moment of receiving the invitation (Dillman, 2017). Survey methods, therefore, aim to minimize the effort for users and to increase the attractiveness and the benefits of a potential participation (Dillman et al., 2014). However, nonresponse at the initial wave of a panel survey is not the only critical step to consider. The second critical step is the transition from initial wave participation to panel recruitment. Little is known, however, about the potential enhancement of both transitions, from offline invitation to online participation and to panel recruitment, by means of incentives. This article contributes by investigating how incentives can foster motivation to participate in the initial wave of an online panel and to complete panel recruitment. It explores experimentally how we can improve panel recruitment and intermediate participation in the recruitment survey through conditional incentives and the combination of conditional and unconditional incentives. The tested incentives include cash, vouchers/PayPal®-transfers, and a generous lottery. Furthermore, we address how these incentives affect survey costs and the demographic patterns of survey participants.
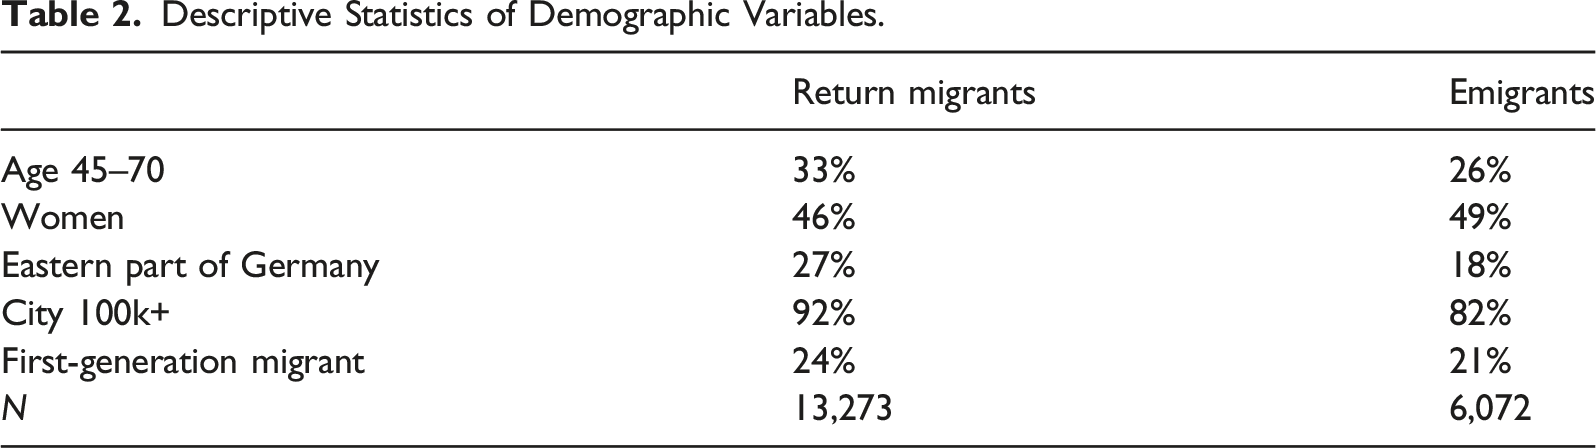
The two related incentive experiments reported in this article were implemented in the recruitment survey of the German Emigration and Remigration Panel Study (GERPS). GERPS relies on two probability-based samples of highly mobile populations that were invited per postal mail for participation in the initial wave of a web panel and for subsequent panel participation (Ette et al., 2020). These populations differ not only in their international mobility from the general population but are also on average younger and positively selected in terms of socio-economic status (Feliciano, 2020). Nevertheless, since there is little evidence for a systematic effect of incentives on sample composition (Singer & Ye, 2013), we do not expect that the fundamental effects of incentives would be any different in the general population. The sampling frame of GERPS encompasses two gross samples, emigrants and return migrants, who were randomly assigned to one of six experimental incentive conditions. We examine how these incentive conditions affect response rates, panel recruitment, the distribution of demographic characteristics, and costs among these highly mobile populations.
Background and Conceptual Approach
Postal invitations to online surveys are a comparably cost-efficient recruitment feature in countries with population registers that yield accurate address information but no alternative contact information like email addresses. While comparatively low costs make them attractive, postal invitations generate less commitment than traditional recruitment modes. Many surveys offer incentives to increase response rates betting on invitees’ willingness to reciprocate the offerings through participation, although they are obviously not the key motive for participation (Groves et al., 2000). There are only few studies investigating the effect of incentives in the context of web surveys with postal recruitment. Findings by Martinsson and Riedel (2015) based on a Swedish sample suggest that even small incentives increase initial postal recruitment for web surveys among more reluctant participant groups although attrition offsets the positive effect on the long run. Incentive experiments in a mail invitation web survey by Gajic et al. (2012) suggest small prepaid incentives and high lotteries as most effective in boosting response and minimizing costs for additional interviews compared with low value lotteries and no incentives.
More research has dealt with the impact of monetary incentives on participation more broadly. A systematic review of studies between 2002 and 2012 shows that monetary incentives are associated with higher response rates than non-cash incentives or vouchers (Singer & Ye, 2013). This finding has been confirmed for various modes including face-to-face interviews (Pforr et al., 2015), mail surveys (Ryu et al., 2005), and web surveys (Becker et al., 2019). The relationship between the cash value and response probability is generally positive, though at a declining rate (Mercer et al., 2015; Singer & Ye, 2013). In terms of rational choice theories (RCT) (Singer, 2011), the individual decision to participate is the outcome of a cost–benefit optimization and consideration of the instrumentality of survey participation. This has two implications for conditional incentives. First, invitees will participate if the (opportunity) costs of participation are lower than the promised incentive and additional benefits. Second, higher promised incentives increase the number of individuals who deem benefits adequate to outweigh the costs of participation because opportunity costs and “reservation incentives” are unevenly distributed.
Studies concerned with the conditionality of incentives find that monetary incentives are most effective in increasing response if they are prepaid “money in hand” rather than non-tangible or promised conditional on participation (Gajic et al., 2012; Göritz, 2008; Guo et al., 2016; Kretschmer & Müller, 2017; Scherpenzeel & Toepoel, 2012; Singer & Ye, 2013). 1 Another option is to disburse part of the incentive unconditionally and the other part conditionally. There is little research on the effectiveness of such combined incentives; incentive experiments for the GGP2020 indicate that combined unconditional and conditional incentives are clearly more effective in increasing response to CAWI than conditional incentives alone (Schumann et al., 2019). These are strong indications that unconditional disbursement, either exclusively or in combination with conditional components, improves response rates relative to the exclusive conditional disbursement. This conclusion is hardly compatible with the postulates of RCT because there are no instrumental reasons to participate if the benefit is not conditional on participation. Survey methodologists usually refer to the norm of reciprocity (Gouldner, 1960; Kolm, 2006, pp. 25–31), bounded rationality (Becker & Mehlkop, 2011; Simon, 1990), or social exchange theory (Emerson, 1976) arguing that unconditional incentives deemphasize the economic character of the exchange supporting intrinsic motivation and reciprocity norms instead (e.g., Becker et al., 2019; Dillman et al., 2014). These theories also make it easier to account for the declining rate of the positive relationship between incentive amount and response (Mercer et al., 2015) because invitees may evaluate excessive incentives as unfair and become less cooperative.
If designed carefully, lottery tickets potentially represent the cheapest variety of incentives. Rational actors, however, should not be attracted by prizes with low likelihoods of success. Indeed, there is evidence that lotteries increase response rates less than cash incentives do (e.g., Pforr et al., 2015; Schröder et al., 2013). Some studies even find that lotteries have little or no positive effect on response rates at all (Göritz & Luthe, 2013; Lengacher et al., 1995). In a systematic review of web surveys, Fan and Yan (2010) conclude that the use of lotteries does not increase the response rate substantially compared with offering no incentives. Most lotteries, however, yield small presents or cash values of maximum €50. The analysis by Gajic et al. (2012) shows that although prepaid cash increases the response rate most, the drawing of high prize money (here, 2 x US$250) is the most cost-effective solution to increase participation. The study by Oscarsson and Arkhede (2020) is another example how attractive lotteries can positively affect response. They promised tickets for a popular national lottery (value €3) conditional on completion and find significantly higher response in the incentive group compared to the control group. Overall, there is some evidence that generous lotteries have the potential to increase response rates. The positive impact is often smaller than that of monetary incentives, but lotteries could be comparatively more cost effective even if they are generous. While risk aversion may explain the preference of monetary incentives over lotteries (Okasha, 2007), there have been various attempts to explain the human affinity to gambles within the RCT framework (McCaffery, 1994). Conlisk (1993), for example, argues that the gamble itself generates individual utility and shows how the standard economic RCT model can be extended through appending a tiny utility of gambling to the preference function of otherwise risk-averse individuals.
While reaching for high response rates is a general challenge for survey research, panel studies also try to recruit first wave participants for the panel (Schoeni et al., 2013). Various studies have experimented the consequences of conditional and unconditional incentives on panel recruitment. After participating in an initial survey, respondents who had received unconditional monetary incentives were more likely to participate in a follow-up web panel than respondents who had been promised conditional incentives (Scherpenzeel & Toepoel, 2012). Similarly, recruitment for the German Internet Panel (Blom et al., 2015; Krieger, 2018, pp. 60–77) was more successful when participants were incentivized unconditionally (€5) compared with conditional incentives (€10). Both participation in the face-to-face recruitment survey and the ensuing registration for the online panel were significantly higher in the unconditional incentive group. In a second incentive experiment in this panel, unconditional incentives (€5) sent with the first mail reminder doubled the online registration rate. Overall, findings suggest that unconditional incentives have a positive impact on panel recruitment compared with conditional incentives.
Incentives hold perils and promises for the demographic composition, which they may bias or balance. Although there are theoretical reasons to expect that incentives have the potential to attract respondent groups that are usually underrepresented in surveys, especially economically disadvantaged groups (Singer & Ye, 2013), empirical evidence is rather mixed. Indeed, several studies show based on multivariate regressions that persons with comparatively low socio-economic resources can be mobilized through cash incentives (Becker et al., 2019; Göritz, 2008; Göritz & Luthe, 2013; Schröder et al., 2013) and lotteries (Göritz & Luthe, 2013). Other studies, however, find no statistically significant demographic differences between various incentive groups (Becker & Mehlkop, 2011; Suzer-Gurtekin et al., 2016). Gajic et al. (2012), for example, do not find statistically significant differences in characteristics like gender, education, or household income in mean comparisons. The only difference is that the average age is higher in the non-incentive group than in the lottery group, where the average age is higher than in the prepaid incentive group. Göritz and Luthe’s (2013) results suggest that lotteries can activate groups of people who are less involved with the survey topic or are socially disadvantaged. In line with this, Pedersen and Nielsen’s (2016) experiment in an online panel yields evidence that lotteries have a positive effect on response rates in surveys where low participation rates would be expected. This echoes with research showing that those socio-economically worse off are more likely to play lottery (Beckert & Lutter, 2012). Overall, the relationship between incentives and social selectivity remains inconclusive (Pforr et al., 2015). Along these lines, RCT and theories of subjective expected utility (Fishburn, 1981) would suggest that it is the subjective utility rather than the objective value of the incentive that matters for potential respondents and the subjective utility of a given monetary incentive or a gamble is likely to vary by socio-economic characteristics.
This review of the literature shows both findings that have been corroborated through repeated studies and findings that are non-conclusive depending on manifold aspects of the population, survey modes, and incentive fine-tuning. This article contributes by studying incentive effects in a highly mobile population. It investigates how (a) response rates in the recruitment survey and (b) panel recruitment rates in a probability-based online panel with postal mail invitation are affected by different incentive schemes. Panel recruitment is defined by consent to participation in the panel and provision of valid email address information, both at the end of the questionnaire. The incentive schemes include a conditional generous lottery of 20 times €500, conditional monetary incentives of varying amounts, and the combination of low unconditional cash incentives with varying amounts of conditional monetary incentives. The incentives primarily aimed at participation in the recruitment survey. Recruitment survey participation, however, is a prerequisite for panel recruitment. Therefore, our hypotheses regarding both outcomes are analogous: Positive effects on recruitment survey participation translate into positive effects on the overall panel recruitment rate. Individual factors like personality traits, willingness to provide one’s email address, or survey experience may affect panel recruitment, but their impact is independent from incentives. They do not motivate diverging hypotheses for both outcomes. Based on the review of the literature and theoretical indications reported above, we have the following hypotheses.
H1a Conditional incentives increase the response rate of the recruitment survey relative to a lottery. H1b Conditional incentives increase the panel recruitment rate relative to a lottery. H2a Combined unconditional/conditional incentives increase the response rate of the recruitment survey relative to a lottery. H2b Combined unconditional/conditional incentives increase the panel recruitment rate relative to a lottery. H3a The higher the total incentive amount, the higher the response rate of the recruitment survey. H3b The higher the total incentive amount, the higher the panel recruitment rate. H4a The partial unconditional disbursement of an incentive increases the response rate of the recruitment survey relative to complete conditional disbursement of the same total amount. H4b The partial unconditional disbursement of an incentive increases the panel recruitment rate relative to complete conditional disbursement of the same total amount.
As the literature review has shown, effects of incentives may vary by social group and may bias or balance sample composition. This aspect is potentially important in the choice of incentive in addition to response and recruitment rates. Therefore, we complement the hypothesis tests with exploratory analyses: We analyze whether (undesirable) effects of sociodemographic characteristics on response and recruitment rates differ by incentive, that is, we model the interaction of sociodemographic characteristics and incentive conditions. The costs associated with each incentive are another factor relevant to survey practitioners. Accordingly, we complement our analysis by calculating the incentive costs as a function of the number of net survey participants.
Data and Methods
Study Design
We use data from the initial wave of the German Emigration and Remigration Panel Study (GERPS) which was online between November 7, 2018, and February 11, 2019. The survey relies on stratified random sampling and two sampling procedures to deal with the highly skewed distribution of emigrants and return migrants across municipalities. The first procedure assigned the top 10 municipalities in terms of the volume of international migrants according to 2015 official statistics to the sample of municipalities. A fixed share of migrants was sampled based on simple random sampling within these municipalities. A second cluster sampling procedure was applied to the remaining municipalities of the sample frame, which were sampled randomly and proportional to the volume of international migration following a balanced sampling algorithm (Lohr, 2010; Tillé, 2006; for details, see Ette et al., 2020). All eligible migrants in this second group of municipalities were added to the sample. The emigrant sample contained German citizens aged between 20 and 70 who deregistered for a move abroad between July 2017 and June 2018. The return migrant sample contained German citizens of the same age bracket who re-registered coming back from abroad during this period. While the provision of current addresses is mandatory for return migrants, emigrants provide their foreign address to public registers voluntarily. 2 Since the address is indispensable for the first contact, only emigrants who provided their address were contacted. 3 If two or more individuals from a moving household were included in one of the samples, we randomly kept one. The final samples included 13,770 return migrants and 6217 emigrants, respectively.
All sampled individuals were invited by postal mail to take part in a web survey. The envelope contained the invitation to access the online questionnaire including a personalized password, information about the personal incentive, and data protection information. The invitation letter listed basic information about the content of the survey and a URL which was provided as a personalized electronically readable QR-code in addition. The conditional incentives were promised in return for survey completion in the form of vouchers or bank transfers, respectively. 4 Following standard procedures in online panel recruitment, we recruited step-wise (Kaczmirek et al., 2019, p. 7): the invitation referred to the survey and becoming part of a project, but did not mention the panel design explicitly. At the end of the online survey, participants were asked for panel consent.
In the recruitment survey, basic information was collected: about the recent move, family and partnership, employment, health and wellbeing, social integration, psychometric indicators, and demographic information. At the end of the questionnaire, participants were asked whether they agreed to participate in the panel, and in case they did, they were asked to provide an email address and additional contact information. The average response rate was 33.1% (RR5; AAPOR, 2016) and 93.1% of respondents consented to panel participation (Ette et al., 2020). The online questionnaire was programed using LimeSurvey® (version 3.14.8). It featured an adaptive layout to ensure flexible use by respondents on both stationary computers and mobile devices. The median completion time was 24 minutes (Ette et al., 2020, pp. 50–51).
Experiment Design
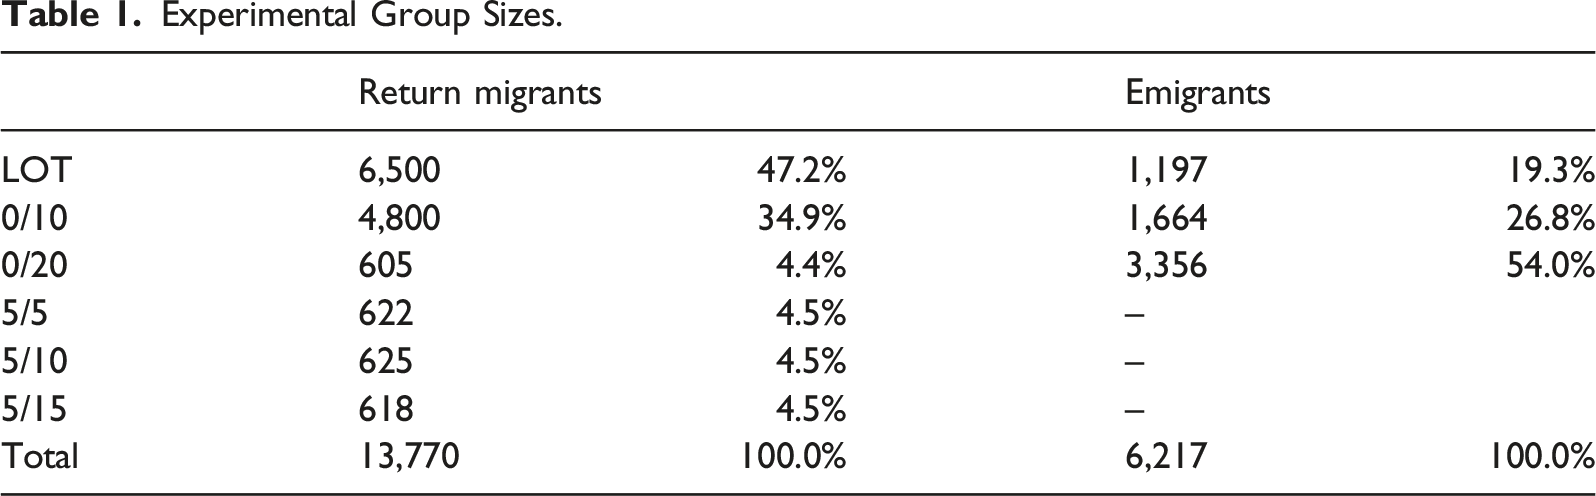
Three kinds of incentives were experimentally tested: a lottery conditional on participation, unconditional cash incentives, and combined unconditional/conditional monetary incentives. Options offered for the disbursement of the conditional incentive included PayPal® and bank transfers, Amazon® vouchers, and donations, whereas the unconditional incentive was delivered as “money in hand” in the invitation letter. In the lottery announcement, the prizes were mentioned, but not the number of invited interviewees potentially participating in the lottery. Among return migrants, we tested the following experimental conditions:
Lottery of 20 times €500, €10 conditional on participation, €20 conditional on participation, €5 cash unconditionally and €5 conditional on participation, €5 cash unconditionally and €10 conditional on participation, €5 cash unconditionally and €15 conditional on participation.
Among emigrants, the disbursement of unconditional incentives was not feasible. First, it was doubtful whether the invitation would reach invitees because the foreign address quality was unknown beforehand. Second, cash incentives would have to be adapted to national currencies outside the Eurozone which would have meant disproportionate efforts for a study of global migrants. We, therefore, tested only incentive schemes LOT, 0/10, and 0/20 in this sample.
The objective value from participant perspective is assumed to be equivalent between the following couples: 0/10 and 5/5 (€10), and 0/20 and 5/15 (€20). Because the main purpose of the project was to set up an online panel of emigrants and return migrants, we refrained from including a non-incentive control group.
Experimental Group Sizes.
Variables
We define response in the recruitment survey according to established standards (AAPOR, 2016; Callegaro & DiSogra, 2008; DiSogra & Callegaro, 2015) as complete when there is information about more than 80% of all applicable questions in the questionnaire, partial when 50 to 80% of questions were answered, and break-off when less than 50% of questions were answered. In total, 92.8% of all interviews are defined as complete; 1.8%, as partial; and 5.4%, as break-offs. The response rate (RR5; AAPOR, 2016) is defined as the ratio of complete interviews to the sum of complete and partial interviews, break-offs, and refusals excluding non-contacts and undeliverable mails.
The variable panel recruitment captures the information whether a person included in the gross sample can be contacted for a follow-up survey. For panel recruitment it is not sufficient that respondents take part in the first survey, but they must give panel consent and provide an email address in addition. The provision of email addresses was essential for panel recruitment since invitations for the follow-up surveys are sent exclusively per email. 5 Respondents were asked for panel consent after the last survey question. In case of consent, respondents were also asked for their email address. Thus, all target persons of the gross sample who participated in the first survey, consented to be contacted again, and provided an email address were classified as recruited for the panel. All others were classified as not recruited. An alternative approach would have been to analyze recruitment only for the net sample, that is, those who participated in the recruitment survey. Such a two-step approach would, however, obscure the overall effect of incentives on recruitment in case of varying incentive effects on participation in the recruitment survey in the first step and recruitment (in case of participation) in the second step. Given our goal to conduct a panel survey, the overall effect is key to the evaluation of different incentive types. Therefore, we focus our analysis on the overall effect and analyze recruitment based on the gross sample.
Descriptive Statistics of Demographic Variables.
Methods
As our baseline model, we calculate logistic regressions on response and panel recruitment by experimental groups controlling for the above-mentioned socio-structural characteristics. We rely on average predicted probabilities based on these regression models to report the rates of response and panel recruitment. In the first round of tests, we adapt the reference groups in order to test the hypotheses regarding differential response rates between experimental groups. In the second round of tests, we add product terms between incentives and socio-structural attributes to test whether the association between experimental conditions and response rates is homogeneous over these attributes. We provide graphical representations 7 of average marginal effects (AME) throughout to facilitate interpretations (Best & Wolf, 2015), that is, AME can be read as percentage point changes in the likelihood of the outcome while the interpretation of odds ratios or logits is not intuitive. The underlying logistic regression models are provided in the online appendix. We test for statistical significance at p < 0.05.
Results
The following figures illustrate the results of the baseline models for response in the recruitment survey and panel recruitment controlling for demographic characteristics (see Appendix Table A1 and Table A2). The model fit is comparatively low for both response and panel recruitment as indicated by McFadden’s pseudo R2 between 0.02 and 0.03. The low model fit reflects that there are unobserved factors next to sociodemographic variables and type of incentive that largely explain the willingness to participate. This unproblematic for this study, however, because we are interested in the causal effects of incentives as opposed to participation more broadly. Figure 1 shows for each experimental condition in both samples the average predicted probabilities of response and their confidence intervals (see Table A3 of the appendix for detailed coefficients). The differences in the size of confidence intervals between experimental groups reflect the large differences in group size. Response probabilities are around 35% for both emigrants and return migrants in the conditions lottery and 0/10, and around 40% in the condition 0/20. Notably, response probabilities are very similar in the two samples for the same incentive type. The highest response probabilities between 44 to 49% are observed for combined unconditional/conditional incentives (5/5, 5/10, and 5/15), which were only offered to return migrants. The predicted probabilities of panel recruitment follow the same pattern as response, only at lower levels (between two and four percentage points lower than response probability). The remainder of this section is organized along the lines of our hypotheses, testing relevant differences in response rates and panel recruitment between experimental groups. Average predicted probabilities of response and panel recruitment over experimental groups. Notes: Based on logistic regression controlling for age, gender, region, urbanity, and migration background. nremig = 13,273 and nemig = 6072. Coefficients reported in Table A3 of the appendix.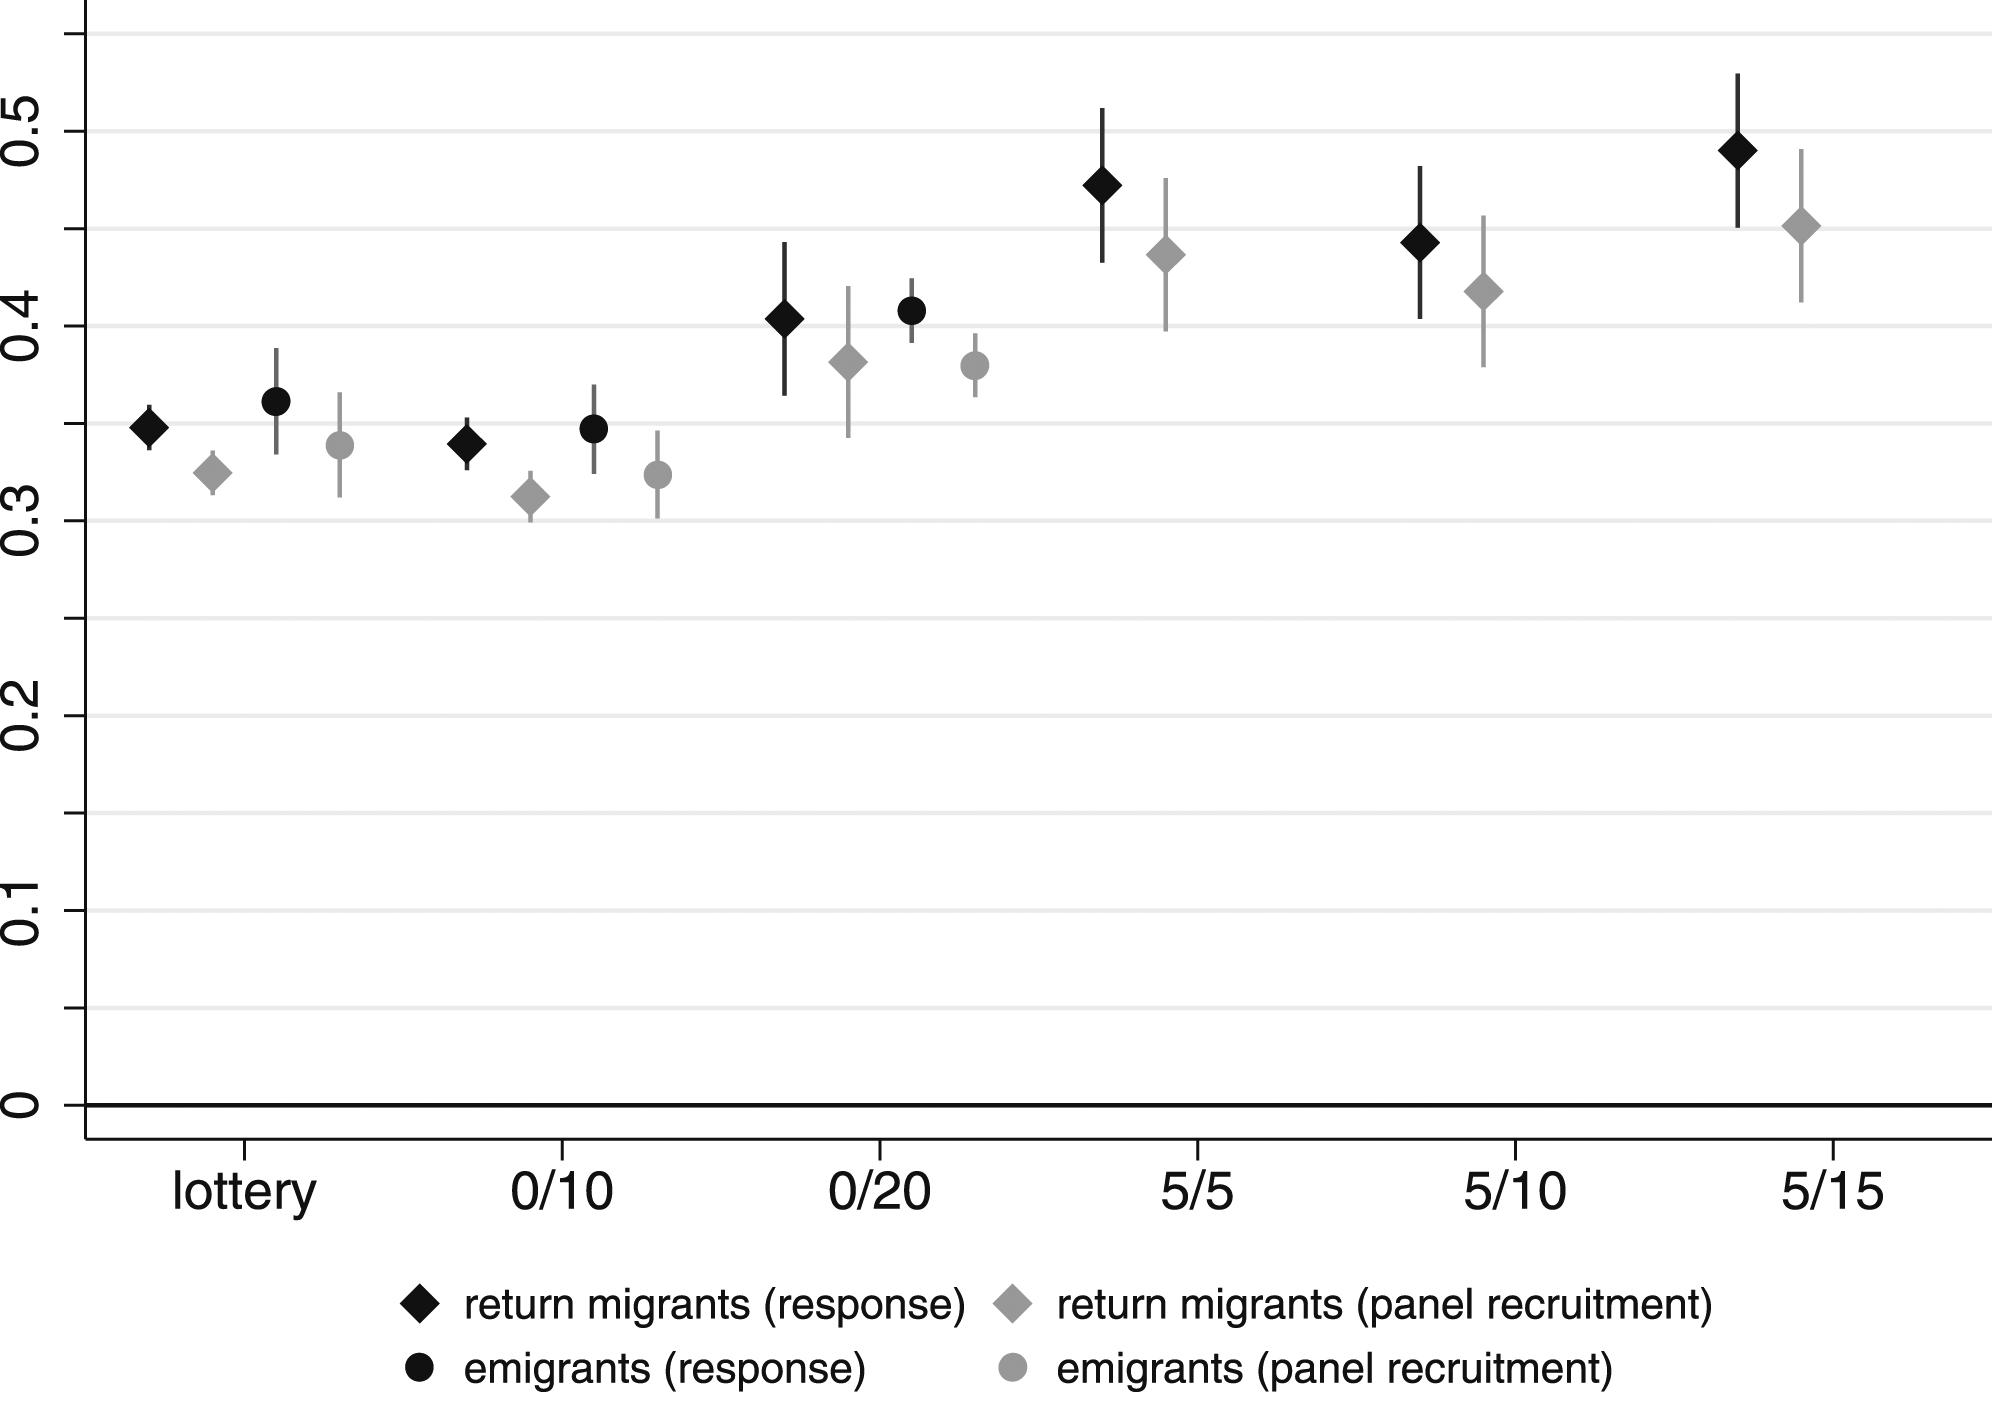
Response Rates
We estimated the baseline model with alternating reference categories for incentive type to test our hypotheses. Figure 2 shows the results for both response and panel recruitment. We first concentrate on the tests for response and aim to determine whether monetary incentives are associated with higher response rates than the lottery (H1a and H2a). Figure 2, Panel (A) shows the AME for the conditional monetary incentives, that is, 0/10 and 0/20, compared with the lottery. Results are similar in both samples. The probability of response is not significantly different between the 0/10 condition and the lottery. The probability of response significantly increases by about 5 percentage points, instead, in the 0/20 condition compared with the lottery. These results partially support our hypothesis that conditional incentives increase the response rate relative to a generous lottery (H1a). They do under the condition that the conditional incentive is high enough. Average marginal effects of experimental groups based on logistic regressions on response and panel recruitment. Notes: Based on logistic regressions controlling for age, gender, region, urbanity, and migration background. nremig = 13,273 and nemig = 6072. Coefficients are reported in Table A1 and Table A2 (Panels A and B), Table A4 and Table A5 (Panels C and E), Table A6 (Panel D), and Table A7 (Panel F) of the appendix.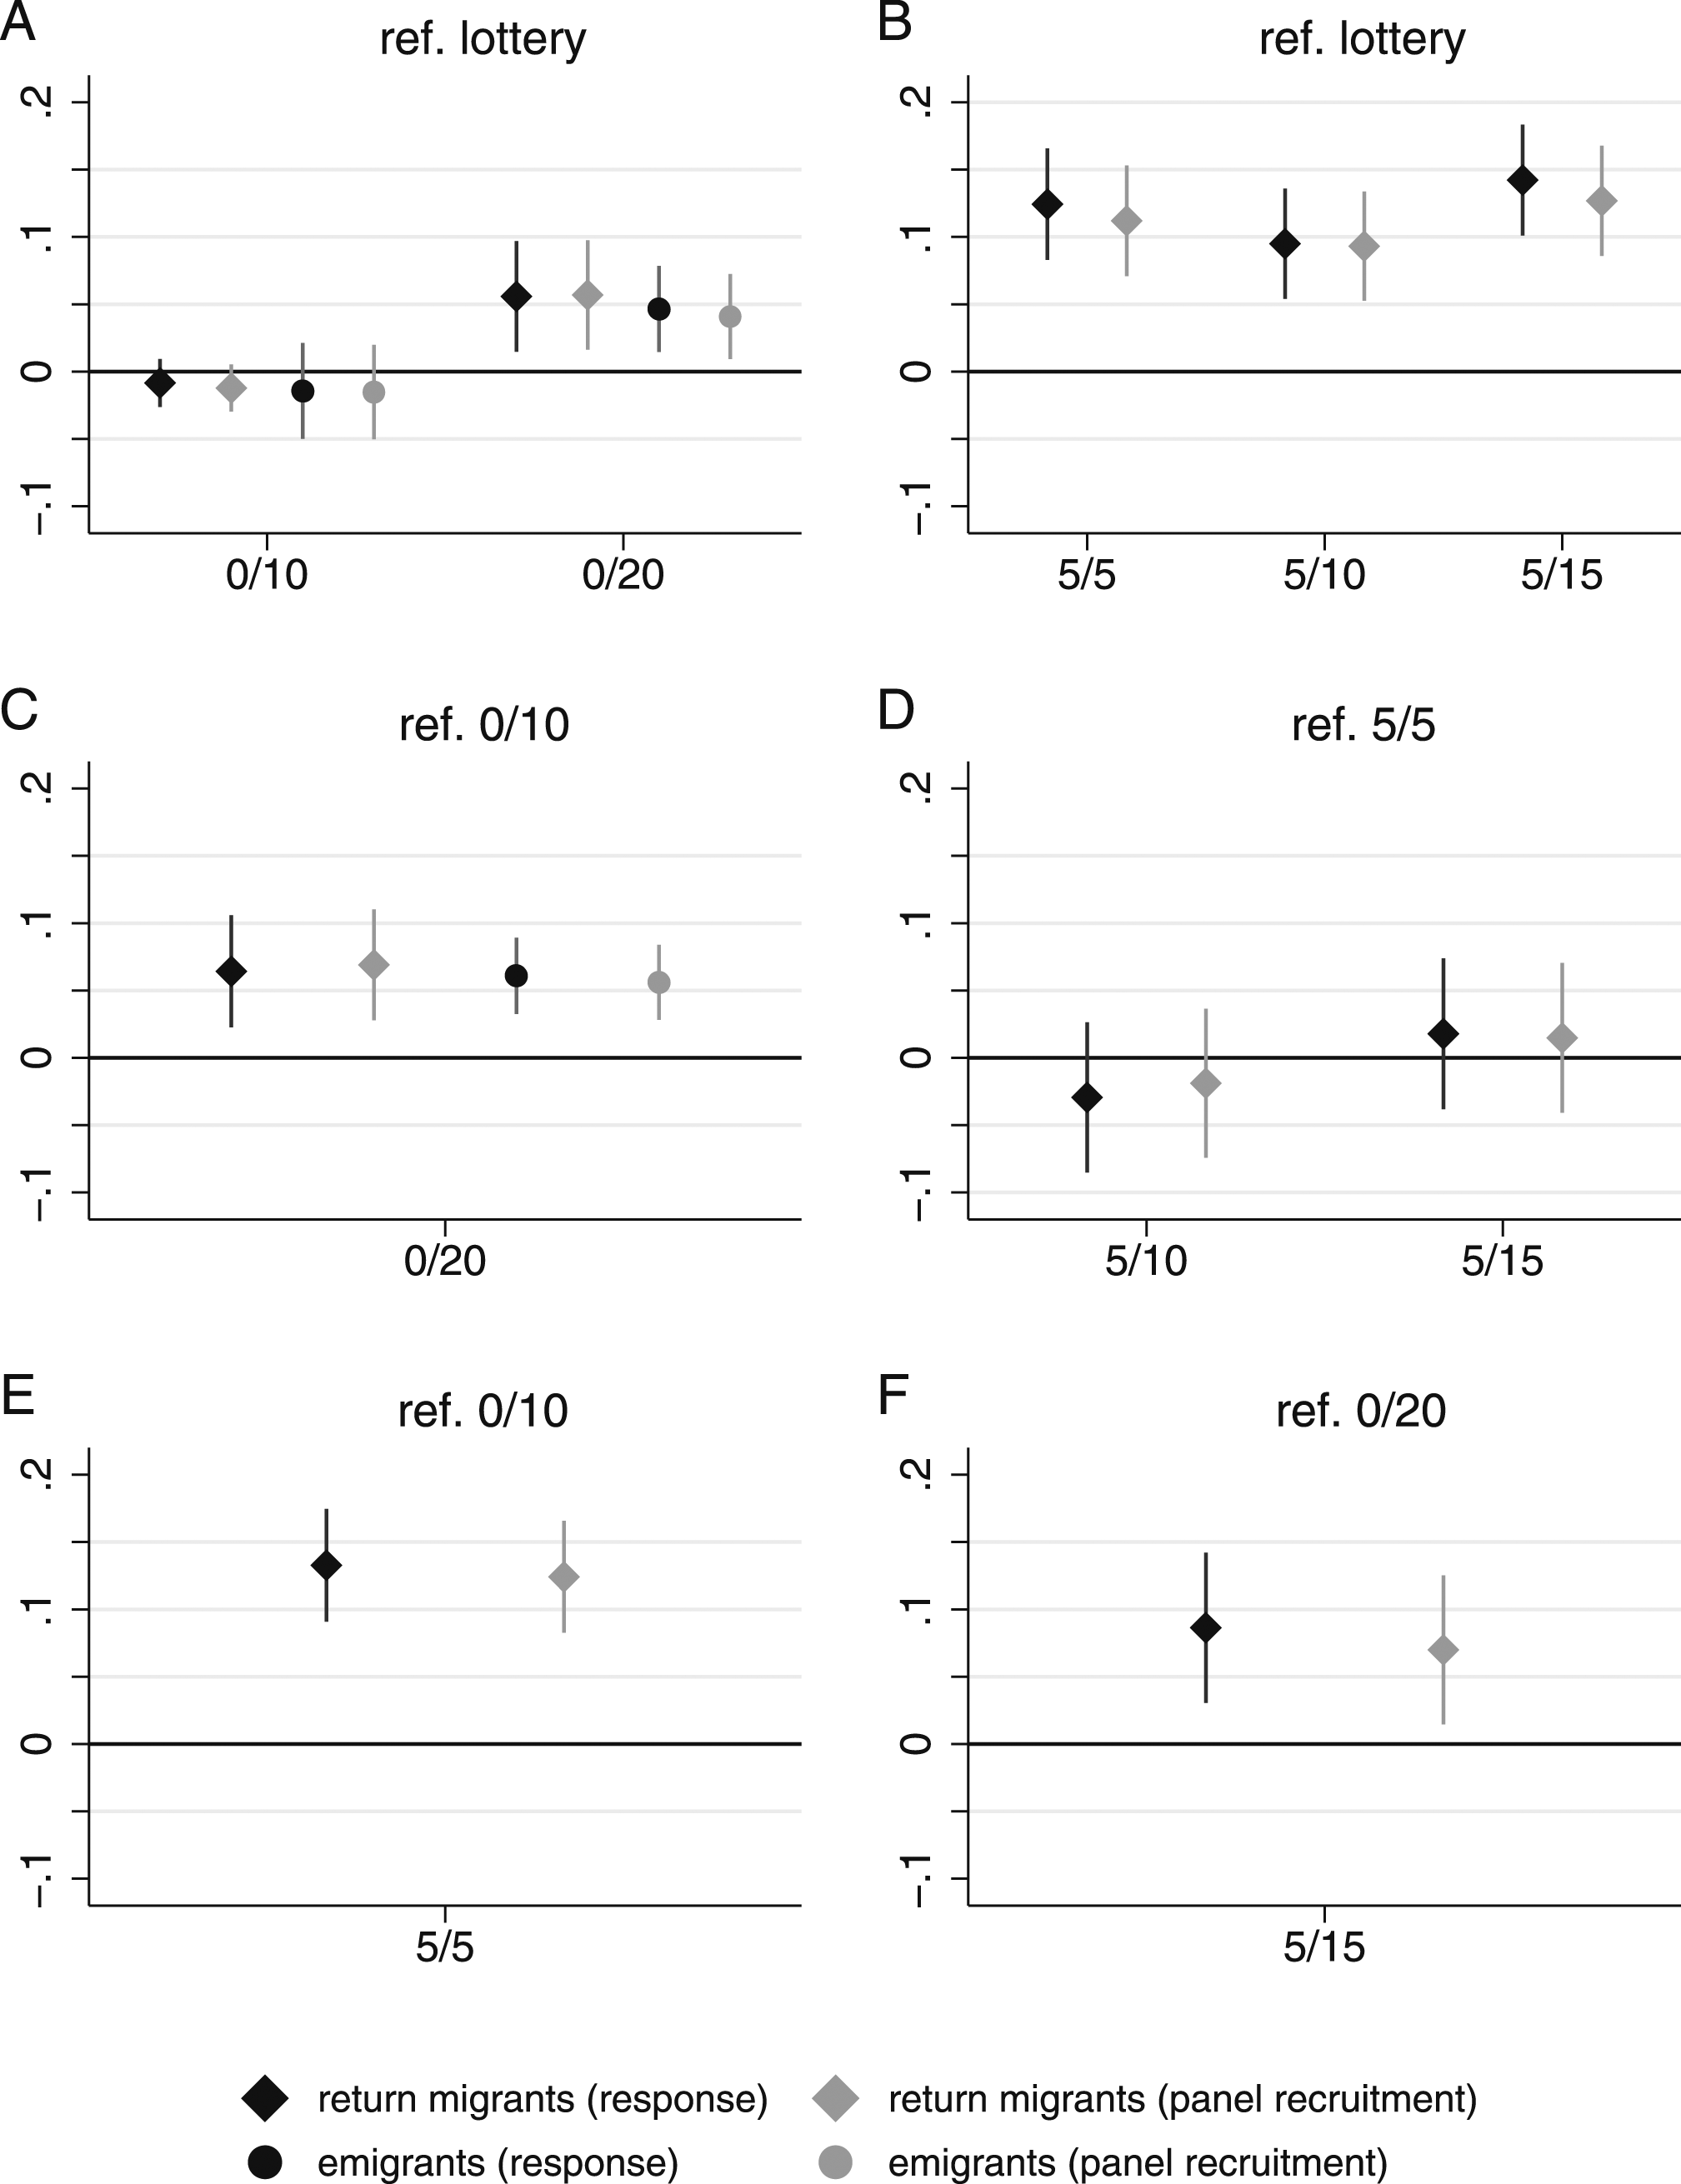
Panel (B) shows AME of three combined incentives against the lottery. The results are only reported for return migrants because the experiment was not feasible in the emigrant sample. Combined unconditional and conditional incentives increase the probability of response by 9–14 percentage points compared to the lottery according to point estimates. Although the standard errors are large, the estimates are statistically significant. These findings support our hypothesis that combined incentives increase the response rate relative to a generous lottery (H2a).
We now turn to the effect of the incentive amount on response rates. Panel C shows the AME of increasing conditional incentives from €10 to €20 and Panel D shows the AME of increasing the conditional component of combined incentives from €5 to €10, or from €5 to €15. Results in Panel C indicate that a conditional incentive of €20 instead of €10 comes with an increase of the response rate by about 6 percentage points in both samples. The point estimates in Panel D indicate that differences in the response rate do not change significantly when the conditional component of the combined incentive is increased from 5€ to 10€ or if it is increased from €5 to €15. Again, Panel D shows results for return migrants only because the unconditional component of the combined incentive was not feasible for emigrants. The results lend partial support to our hypothesis that higher total incentive amounts increase the response rate (H3a). Our hypothesis is supported for conditional incentives alone but must be rejected when it comes to combined unconditional and conditional incentives.
Finally, we address the question whether the partial unconditional disbursement of incentives increases response relative to the complete conditional disbursement of the same amount. Figure 2 reports the AME of response for two pairs of incentives: Those who received €10 in total (Panel E) and those who received €20 in total (Panel F). The reference group in each pair received the entire incentive conditionally and the other group received €5 of the total amount beforehand. This partial unconditional disbursement of the incentive increases the probability of response in both pairs. The likelihood of response increases by 13 percentage points when €5 of the €10 total amount are disbursed unconditionally, and by 9 percentage points when €5 of the €20 total amount are disbursed unconditionally. These findings support our hypothesis that partial unconditional disbursement of the incentive increases response rates relative to fully conditional disbursement of the same amount (H4a). The relative improvement tends to be particularly strong where the total amount is lower.
Panel Recruitment
We tested the hypotheses regarding panel recruitment (H1b–H4b) in the same manner as we did for response. Results follow the same pattern as for response, with only very small deviations (see Figure 2). Overall, effects tend to be a little smaller for panel recruitment than they are for response. Conclusions regarding the hypotheses are, however, the same. The reasons for the similarity of results are illustrated by Figure 3 which shows the average predicted probabilities of panel recruitment conditional on participation in the recruitment survey over experimental groups (see also Table A8 of the appendix). The willingness for subsequent panel participation tends to be high among participants of the recruitment survey, with values between 84 and 90%, and does not differ significantly between experimental conditions, except for the condition 0/10 which generates significantly lower panel recruitment than the lottery, condition 0/20, and condition 5/10 according to Wald tests.
8
Average predicted probabilities of panel recruitment conditional on participation in the recruitment survey. Notes: Based on logistic regressions controlling for age, gender, region, urbanity, and migration background. nremig = 5204 and nemig = 2530. Coefficients reported in Table A8 of the appendix.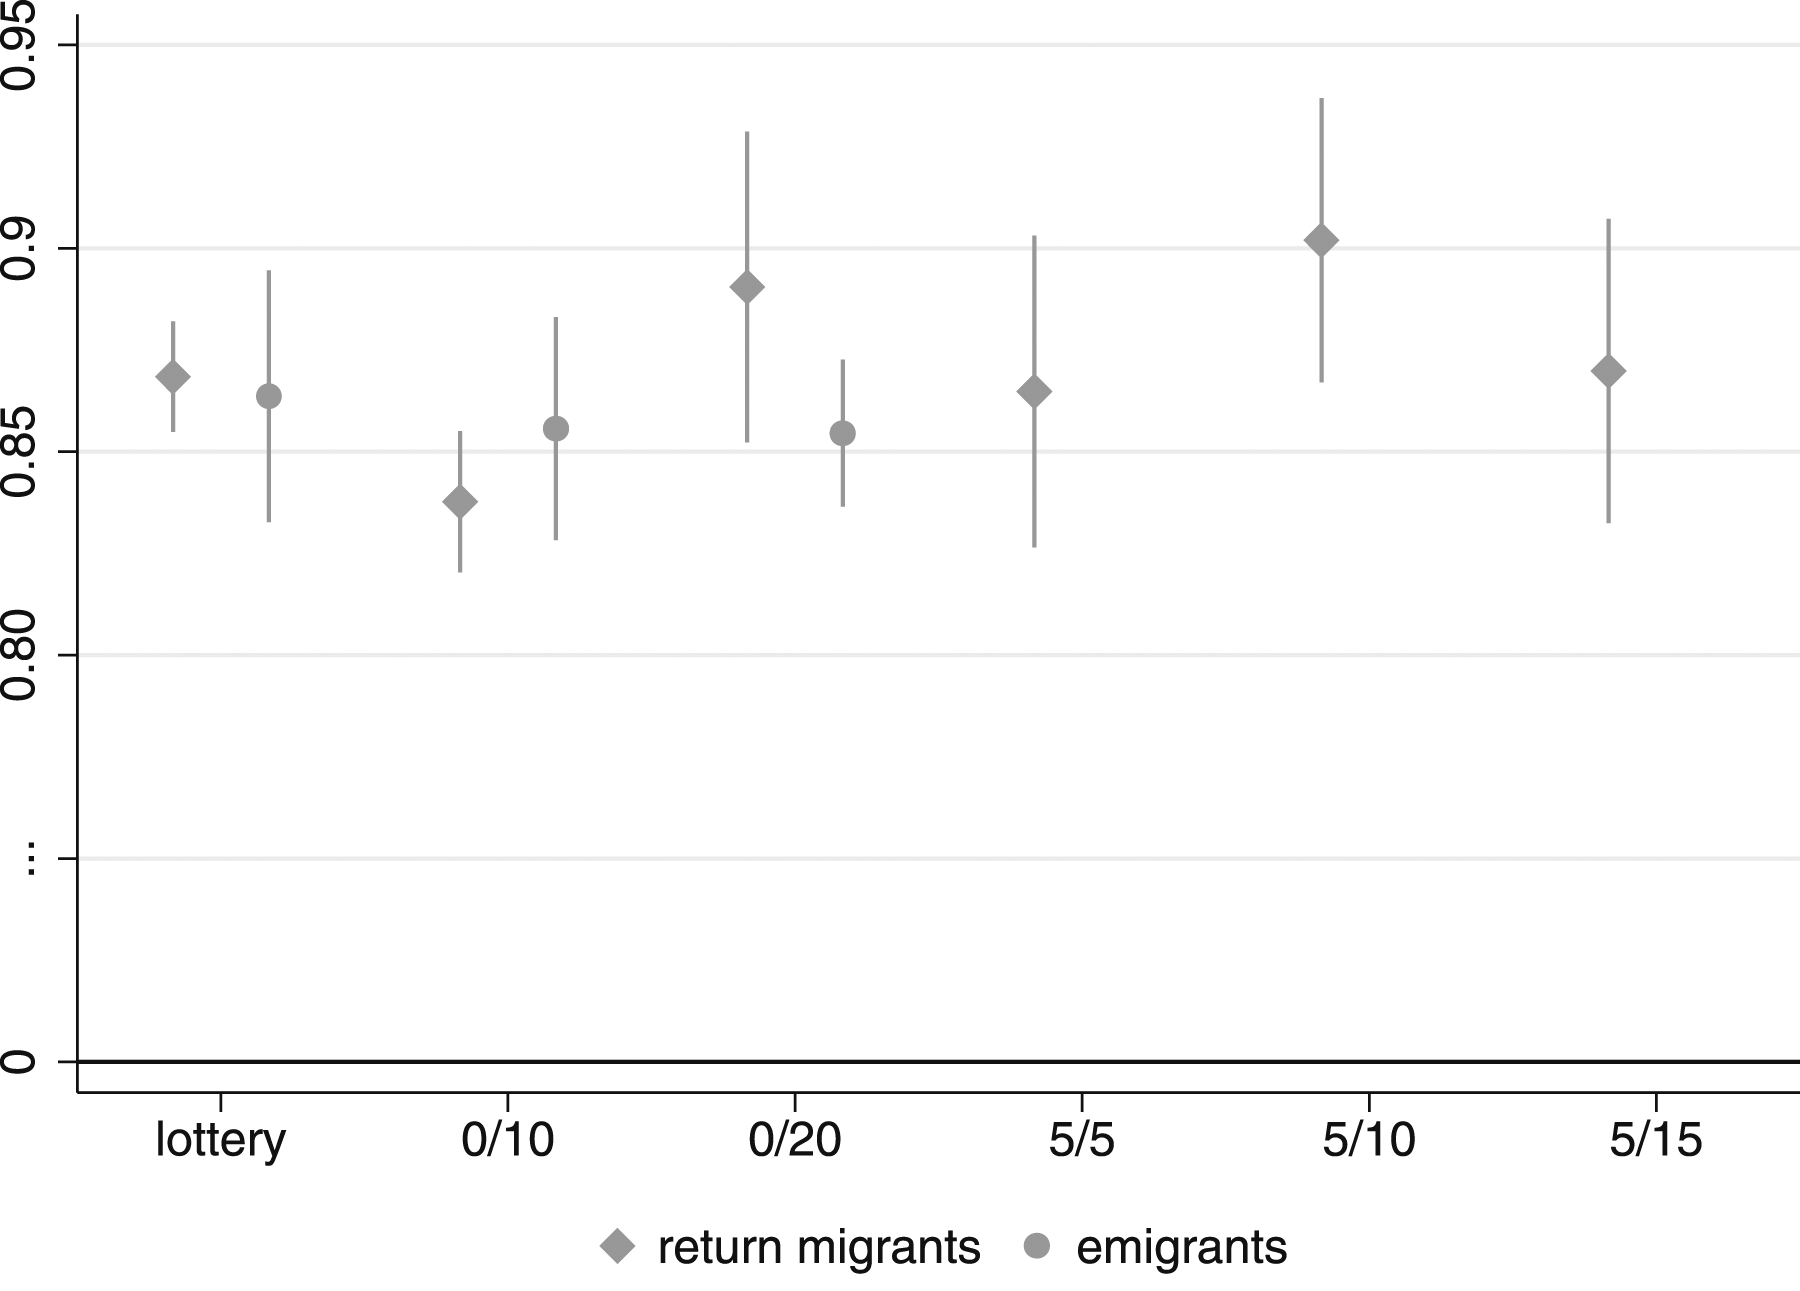
Demographic Differences
Ideally, neither response nor panel recruitment should depend on demographic characteristics given our goal to realize an unbiased sample. In this section, we therefore compare the effects of demographic variables between incentive conditions. We expanded the logistic regression models by including product terms between experimental groups and demographic characteristics. We included the interaction between incentive type and one characteristic at a time which yields five models per sample. The AME of the characteristics in the different incentive groups are displayed in Figure 4 in the following sequence: age, gender, region, urbanity, and migration background. Significance tests for the differences of AME coefficients between experimental conditions are reported in Tables A9–A14 (response) and Tables A15–A20 (panel recruitment) of the appendix. We are aware of the problematic of interaction effects in logistic regressions (Best & Wolf, 2015) and follow Mize’s (2019) advice to present AME of demographic characteristics on outcomes (Figure 4). Average marginal effects of demographic characteristics on response and panel recruitment over experimental groups when remaining outcomes are at means: return migrants (A) and emigrants (B). Notes: Based on logistic regressions on response and panel recruitment. Models include age, gender, region, urbanity, and migration background, and a product term for the variable designated in each plot title and incentives, respectively. Nremig = 13,273 and Nemig = 6072. Coefficients are reported in Tables A9 (response) and Table A15 (panel recruitment).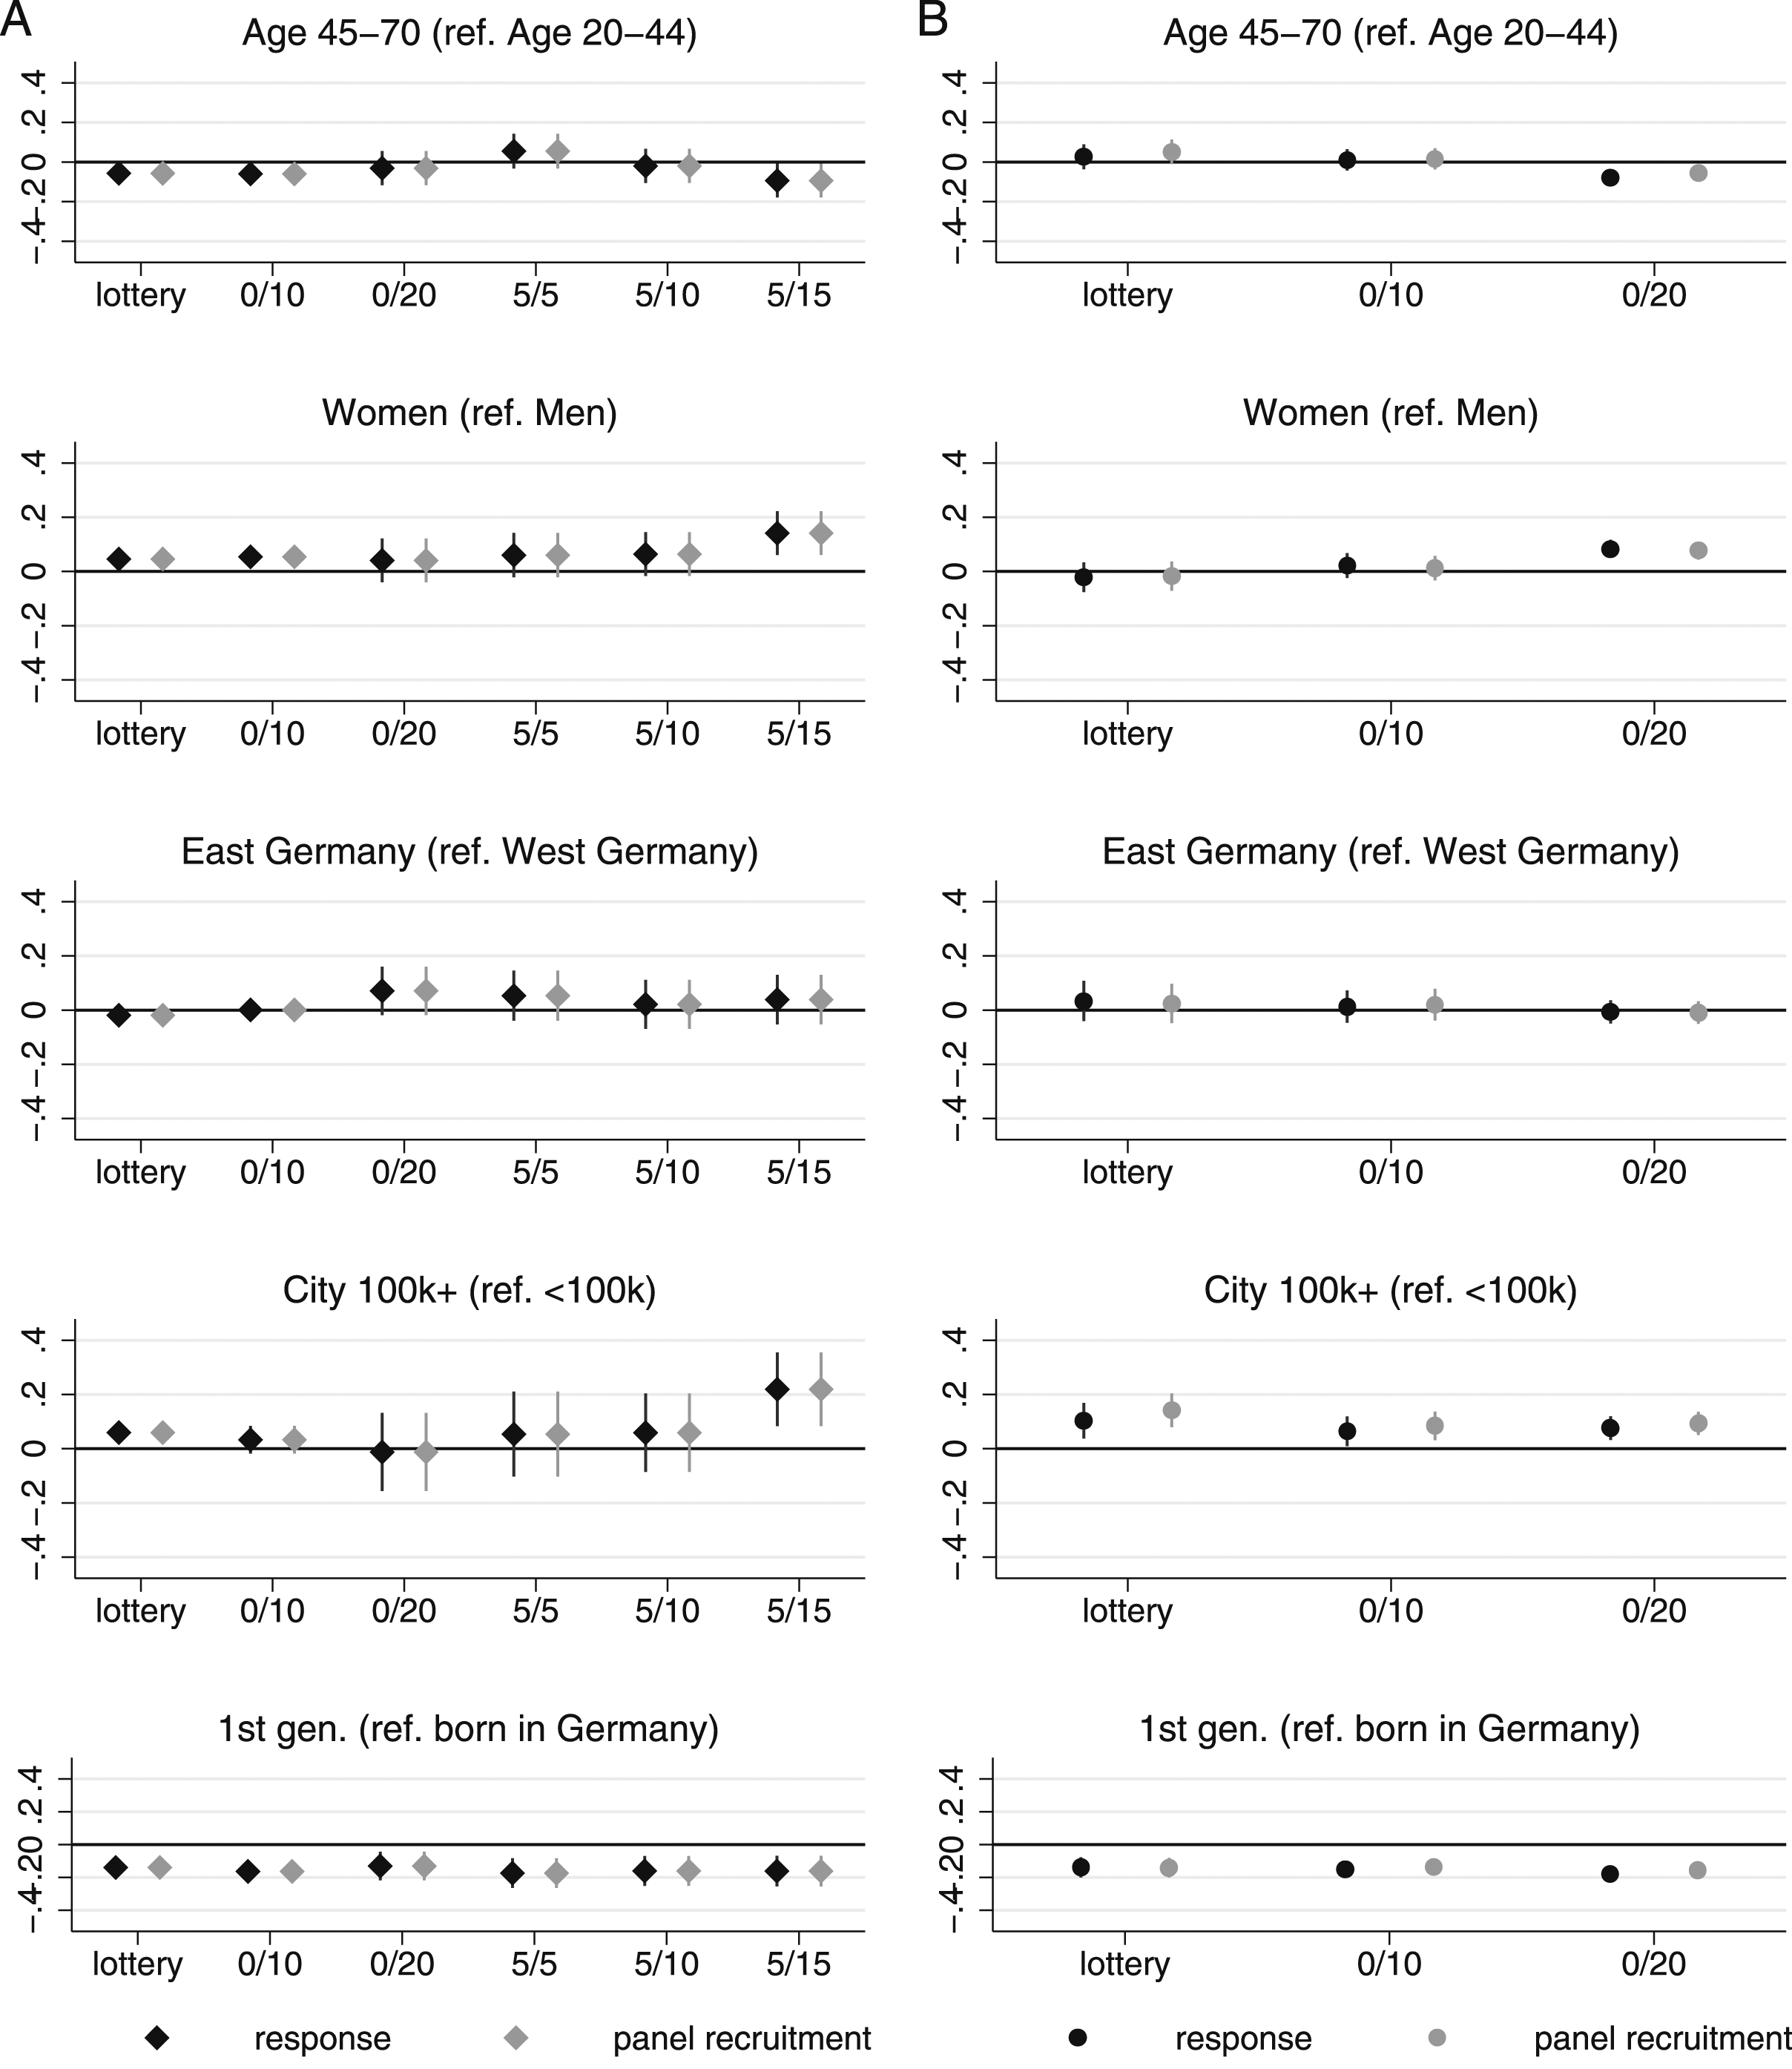
Starting with return migrants (Figure 4, Panel A), we find that in the conditions lottery, 0/10, and 5/15 older respondents have a significantly lower likelihood of response than the younger ones. In the other conditions, age has no significant effect on response. Significance tests of the effect differences between all incentive groups reveal, however, that not all contrasts are statistically significant; only the age effects in the lottery, condition 0/10, and condition 5/15 differ significantly from the age effect in condition 5/5.
Women are significantly more likely to respond in the conditions lottery, 0/10, and 5/15. The gender effect is particularly strong in the condition 5/15 and this effect differs significantly from those in the conditions lottery and 0/10. All other group contrasts are not statistically significant.
For the characteristic region, we neither find significant effects on response nor significant group differences of the region effect. The effect of urbanity, instead, is more heterogeneous and it is particularly strong in condition 5/15, where urbanites are 21.3 percentage points more likely to respond than non-urbanites. In this condition the response gap is significantly larger compared with the conditions lottery, 0/10, and 0/20. Finally, invitees born abroad are significantly less likely to respond than those born in Germany across incentive conditions. Effects are similar across all incentive groups and do not differ significantly.
Turning to the age effect among emigrants (Figure 4, Panel B) we find that older migrants are significantly less likely to respond in the condition 0/20 and that this effect is also significantly different from the effects in the lottery and condition 0/10.
Diverging from our findings among return migrants, in the emigrant sample, women are only more likely to respond than men in condition 0/20. This effect differs significantly from those in the lottery and condition 0/20. When it comes to regional differences, just like for return migrants, we neither find significant effects on response nor significant group differences. Emigrants from large cities are in all incentive groups more likely to respond than those from smaller ones, and natives are generally more likely to respond than first generation migrants, while effect variation over incentive conditions is not statistically significant.
A replication of our analysis where we replace the dependent variable with panel recruitment, yields generally similar results but fewer statistically significant pairwise effect contrasts (see Figure 4 and Table A15 of the appendix). In the sample of return migrants, the direction and statistical significance of all effects is reproduced. When it comes to effect differences between incentive groups, contrary to the models above, the effect of age differs only significantly between condition 5/5 and 5/15 and there are no significant differences in the effect of gender between incentive groups. With regard to the effect of region, however, the contrasts between lottery and condition 0/20 and lottery and condition 5/5 are statistically significant although they were not in the previous models with response as dependent variable. Also diverging from the previous models, none of the urban effect contrasts is statistically significant. In the emigrant sample, all effect directions, their statistical significance, and pairwise effect contrasts are reproduced.
Costs
Costs are usually an important factor of incentive selection. We calculated the panel recruitment unit costs (PRUC) in euros for each incentive in both samples. Cost estimates are based on the predicted probabilities of recruitment (see Figure 1). We attain the PRUC by dividing the total costs by the size of the net sample, where total costs are the sum of unconditional unit costs (postage and unconditional incentives) times the gross sample, conditional unit costs (conditional incentives) times the net sample, and fixed costs (lottery).
9
Only the PRUC of the lottery are discounted for sample size. The ranking starting from low costs is identical in both samples: 0/10, 5/5, 0/20, 5/10, and 5/15. The PRUC are constant at €12.24 (0/10), €18.05 (5/5), €21.83 (0/20), €23.64 (5/10), and €27.63 (5/15) in the return migrant sample, and at €12.78 (0/10) and €22.37 (0/20) in the emigrant sample. In the lottery, instead, the PRUC are variable. Therefore, we determine the cut points between fixed and variable cost functions. The respective points of break-even with the lottery are indicated in Figure 5 through vertical lines indicating the net sample sizes were PRUC are identical. For the sample of return migrants, points of break-even are at net sample sizes of 996 (0/10), 509 (0/20), 627 (5/5), 466 (5/10), and 393 (5/15) recruited participants; for the sample of emigrants, they are at 986 (0/10) and 506 (0/20) recruited participants. The interpretation of the break-even between lottery and condition 0/20, for example, is that their PRUC are identical for gross samples of 509 return migrants or 506 emigrants and lower for 0/20 in smaller samples. The PRUC at this break-even are €21.83 for return migrants and €22.37 for emigrants. The respective results for interview unit costs are very similar and reported in Figure A1 of the appendix. The key finding is that €10 unconditional incentives are the cheapest alternative for net samples smaller than roughly 960 persons while the lottery is cheaper in larger samples. Panel recruitment cost estimation by the experimental group in euros, (A) return migrants and (B) emigrants. Notes: Estimates based on average predicted probabilities of panel recruitment (see Figure 1). Break-even of lottery in Panel (A): 996 (0/10), 509 (0/20), 627 (5/5), 466 (5/10), and 393 (5/15) and in Panel (B): at 986 (0/10) and 506 (0/20).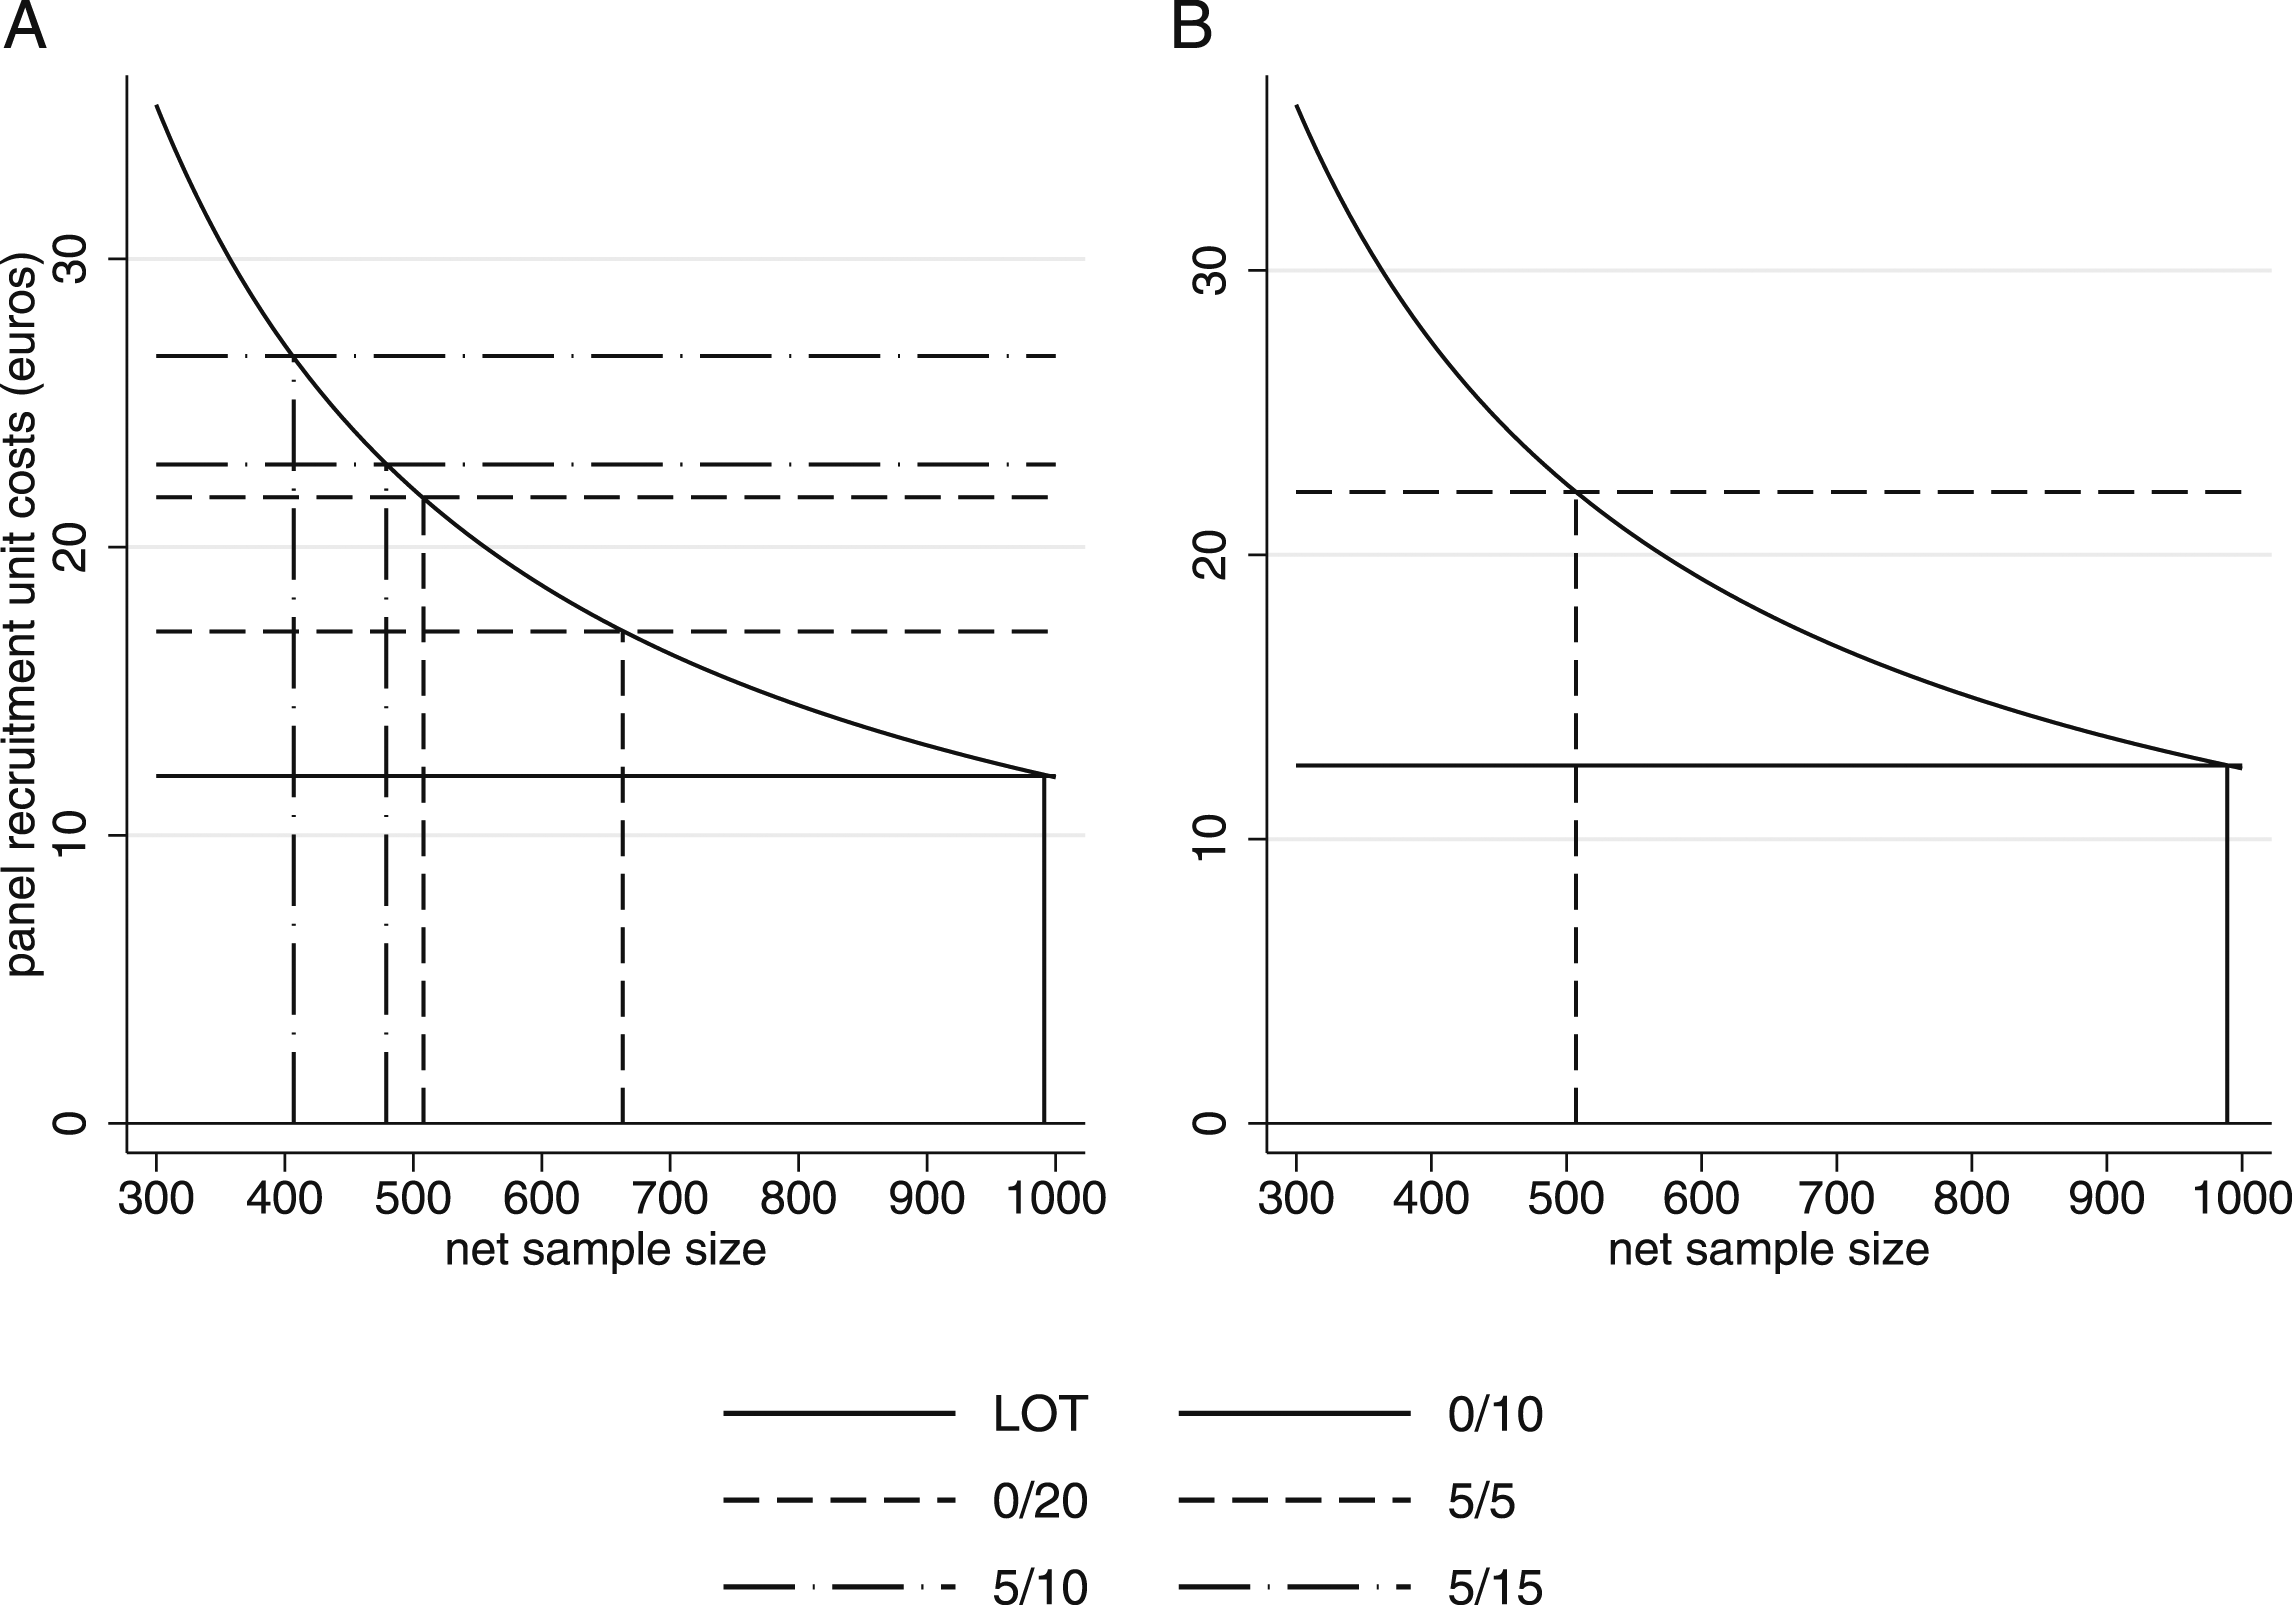
Discussion and Conclusion
This article experimentally investigates how incentives can foster both participation in the recruitment survey and panel recruitment in an online panel with random sampling of two highly mobile populations. The key contribution is a better understanding of how different forms of incentives can support a successful transition from postal mail invitation to online survey participation and panel recruitment. Based on previous research on incentive effects, we do not see any characteristics of the examined highly mobile group that lead us to expect different incentive effects compared to the general population. Web surveys with mail invitation have been explored in cross-sectional studies for a while (Dillman, 2017; Messer & Dillman, 2011), but their adaptation through panel surveys has been more recent (Lynn, 2020). In this final section, we discuss to what extent and at what costs incentives can facilitate the transition from letter to screen and panel recruitment.
Our experiments test the impact of conditional incentives and the combination of conditional and unconditional incentives on two outcomes: response rates and panel recruitment. Our findings indicate that €20 conditional incentives and combined conditional and unconditional incentives of varying amounts increase the response rate significantly relative to the lottery, while €10 conditional incentives do not. This partially supports findings in the German context that cash incentives are more effective in increasing response than lotteries are (Pforr et al., 2015; Schröder et al., 2013). Furthermore, it corroborates findings that high lotteries and low conditional incentives can be equally effective (Coryn et al., 2020). We take that as an indication that the value of (un)conditional monetary incentives tested against lotteries is key to understanding seemingly inconclusive findings. A second finding that conditional incentives of €20 increase the response rate significantly compared to 10€ conditional incentives support findings of a positive relationship between incentive value and response (Edwards et al., 2005; Singer & Ye, 2013). Conversely, increasing the conditional component of a combined €5 unconditional and €5 conditional incentive to €10 or €15 does not significantly increase the response rate. Either unconditional cash incentives generate per se higher subjective value or they activate social norms of exchange and reciprocity unattainable through conditional incentives. The peculiarity of unconditional incentives is also shown by our finding that the partial unconditional disbursement of a given incentive amount significantly increases the response rate over the full conditional disbursement. This finding was particularly strong for the condition €5/€5 versus €0/€10 comparison which is associated with a 13-percentage-point average difference in the response rate. This echoes findings that unconditional incentives are superior to conditional ones (Becker et al., 2019; Blom et al., 2015; Krieger, 2018). In terms of the overall response rate, the €5/€5 combined incentive (return migrants) and the €20 conditional incentive (emigrants) are the most effective strategies. Among both samples, the lower combined incentive was associated with a six-percentage-point higher response than the higher conditional one, again echoing findings for the German Internet Panel (Blom et al., 2015).
Replications of the hypothesis tests with panel recruitment as a dependent variable yield almost identical results as those for response with the only difference that the effects tend to be slightly weaker. For example, the condition €5/€5 versus €0/€10 comparison is associated with 12 percentage point average difference in panel recruitment, a gap that is just one percentage point smaller than for the response rate. Overall, the results of the hypothesis tests reported for response are mirrored for panel recruitment. This supports findings of higher panel participation after unconditional compared with conditional incentives (Blom et al., 2015; Krieger, 2018; Scherpenzeel & Toepoel, 2012).
Demographic differences in the responsiveness to incentives may jeopardize the goal of unbiased samples. We therefore also tested whether demographic attributes are associated with varying response and panel recruitment and whether these effects differ between incentive groups. Our findings among return migrants suggest that the €5/€15 combined incentive is associated with a greater likelihood of participation and recruitment by younger compared to older participants, by women compared to men and by urbanites compared to non-urbanites. With the lottery and €10 conditional incentive likewise younger persons and women are more likely to participate. In contrast, among emigrants, the €20 conditional incentive is associated with higher response and recruitment of younger compared with older migrants and of women compared with men. Although socio-economic information like education and income is unavailable for the sampling data used in this article, research findings suggest that German migrants are positively selected in terms of socio-economic characteristics (Décieux & Mergener, 2021) and that the younger ones are often students (Ette & Witte, 2021), implying lower economic resources. This would explain why high monetary values are particularly effective among the younger age group (see also Becker et al., 2019; Göritz, 2008; Göritz & Luthe, 2013; Schröder et al., 2013). The findings that are not fully consistent for the two samples mirror the inconclusive results of previous research on incentive effects on sample composition (see, for example, Pforr et al., 2015). Thus, it is not possible to give a general recommendation for one or the other incentive scheme.
Next to these important methodological implications of incentives for panel success and sample composition, costs are a crucial criterion for survey practitioners (Mercer et al., 2015). A comparison of the costs per recruited panel participant (PRUC) points to the lottery as the cheapest alternative for net recruitment of more than 962 (return migrants) and 955 (emigrants) persons, echoing findings by Gajic et al. (2012). The cheapest option for smaller samples is the €10 conditional incentive with costs of roughly 12 euros per recruited participant. Thanks to their high effectiveness in generating response, the combined €5/€5 incentive ranks third among the cheapest options among return migrants (PRUC = €18.05), while the €20 conditional incentive, although effective, causes high PRUC of roughly 22 euros in both samples.
Before drawing a bottom line, we want to address the limitations of our incentive experiments and their implications for our conclusions. First, high response and panel recruitment rates in all incentive conditions suggest that other factors mentioned by leverage-saliency theory (Groves et al., 2000) like the topic, questionnaire quality, survey burden, and the survey sponsors were conducive toward higher response. Bosnjak and Batinic (2002) identify four motives of web survey participation: curiosity, willingness to contribute to scientific progress, learn about oneself, and material incentives. This article is concerned with only the last of these four motives while the generally high responsiveness is probably related to the remaining three motives. Second, and related, our sample is peculiar being internationally mobile, younger than the general population, and being positively selected in terms of socio-economic status (Ette & Witte, 2021; Witte et al., 2021). The positive socio-economic selection should reduce the subjective value of incentives, young age may increase it, and spatial mobility should not affect the subjective incentive value. Third, the absence of a non-incentive control group leaves us ignorant of baseline results for response and panel recruitment. Therefore, the lottery’s decent results cannot be attributed unequivocally to the generous trophy money. In spite of these limitations, we are confident that the experiments presented in this article will generate valuable insights regarding the role of incentives for web panel recruitment in general, and for those with postal invitations in particular.
Research on incentives for the mail to web transition and panel recruitment should expand in three directions. One is the exploration of different lottery outfits and their effect through inclusion of control groups. Second, our findings leave little doubt that increases in the conditional component of combined incentives is not worthwhile. However, we did not assess the impact of dropping the conditional component altogether which would save resources. Third, it remains unanswered to what extent our findings regarding panel recruitment translate to actual panel participation. Thus, investigating the long-term effect of the incentive schemes on participation in subsequent waves is the next research step. At the level of theory, the empirical support for lotteries and unconditional incentives calls for developing rational choice approaches to better account for such findings.
Practical Implications
Our findings suggest that low unconditional incentives combined with low conditional incentives are most effective in increasing both response and panel recruitment. Where unconditional cash disbursement is not feasible, as among our emigrant sample, high conditional incentives (€20) were most effective. While condition €5/€5 (return migrants) and €20 conditional (emigrants) were the most effective incentives in terms of response and panel recruitment rates, they are not the cheapest options in terms of panel recruitment unit costs. In addition, the €20 conditional incentive may bias response and panel recruitment in favor of younger persons and women, as shown in our emigrant sample. For practitioners with low budgets, lotteries and €10 conditional incentives are attractive since they have the lowest panel recruitment unit costs among the tested incentives and decent response rates. Our findings indicate, however, that both may bias response and panel recruitment in favor of younger persons and women, as shown in our return migrant sample. This finding could be useful for tailoring incentives to target particular demographic groups known for low response probabilities provided that socio-structural information about the gross sample is available (Lynn, 2017). For those who seek to avoid demographic bias, combined unconditional and conditional incentives of €5 each are the best option among national samples and €10 conditional incentives are the best option when respondents live in various countries.
Supplemental Material
sj-pdf-1-ssc-10.1177_08944393211054939 – Supplemental Material for Enhancing Participation in Probability-Based Online Panels: Two Incentive Experiments and Their Effects on Response and Panel Recruitment
Supplemental Material, sj-pdf-1-ssc-10.1177_08944393211054939 for Enhancing Participation in Probability-Based Online Panels: Two Incentive Experiments and Their Effects on Response and Panel Recruitment by Nils Witte, Ines Schaurer, Jette Schröder, Jean Philippe Décieux and Andreas Ette in Social Science Computer Review
Footnotes
Acknowledgments
We thank two reviewers for their quick and constructive comments. We also thank the Federal Institute for Population Research, Germany (BiB) for funding the incentive experiments. GERPS is funded by the German Research Foundation (DFG) [project no. 345626236]. Thanks to Jonas A. Weik and Antonia Lang for support with the literature and formatting. An earlier version of this paper was presented at the 2020 winter meeting of the “Working Group of German Panel Surveys” at the University of Mannheim.
Declaration of Conflicting Interests
The author(s) declared no potential conflicts of interest with respect to the research, authorship, and/or publication of this article.
Funding
The author(s) disclosed receipt of the following financial support for the research, authorship, and/or publication of this article: This work was supported by the Deutsche Forschungsgemeinschaft, 345626236.
Supplementary Material
Supplementary material for this article is available online.
Notes
Author Biographies
Nils Witte (
Ines Schaurer (
Jette Schröder (
Jean Philippe Décieux (
Andreas Ette (
References
Supplementary Material
Please find the following supplemental material available below.
For Open Access articles published under a Creative Commons License, all supplemental material carries the same license as the article it is associated with.
For non-Open Access articles published, all supplemental material carries a non-exclusive license, and permission requests for re-use of supplemental material or any part of supplemental material shall be sent directly to the copyright owner as specified in the copyright notice associated with the article.