
Abstract
The large number of limited English proficient (LEP) children in U.S. schools and the uncertainty about the impact of bilingual education versus English immersion on their achievement warrant rigorous investigation of the effects of “English immersion laws.” We estimated the impact of Question 2, the Massachusetts English immersion law, and explored whether programs provided to LEP students before and after Question 2 imparted different language and reading skills. The results suggested that Question 2 had no substantial effect on third-grade LEP students’ reading achievement; there was suggestive evidence that pre- and post-Question 2 programs might attach emphasis to different subskills.
With a growing number of people immigrating into the United States in recent decades, the percentage of 5- to 17-year olds who speak a language other than English at home increased from 9% in 1979 to 19% in 2003 (National Center for Education Statistics, 2005). Correspondingly, the number and percentage of state-determined limited English proficient (LEP) children in U.S. schools is on the rise. For example, the number of LEP students enrolled in pre-kindergarten through 12th-grade nationwide increased by 57%, from 3.2 million in 1995-1996 to 5.1 million in 2005-2006, whereas the total PK-12 enrollment increased by only 3.7% in the same decade (National Clearinghouse for English Language Acquisition & Language Instruction Educational Programs, n.d.).
Programs for LEP children can be divided into two major categories: bilingual education and English-only instruction. Within each category, available programs differ substantially. A common misconception that many people, particularly its critics, have about bilingual education is that, in bilingual education programs, “instruction is given in the [child’s] native language most of the school day for several years” (Porter, 1994, para. 1). In reality, there is considerable variation among bilingual education programs in terms of program goals, target populations, languages of instruction, and lengths of stay. The most common bilingual education programs are transitional and two-way bilingual programs. Transitional programs aim to develop minority language learners’ English proficiency. Children in these programs are initially taught mostly in their native language and shifted to English instruction later. In contrast, two-way bilingual programs serve both LEP students and native speakers of English, integrated in the same classroom, with a goal of bilingualism. In these programs, students learn English and the minority language and receive instruction in major subjects in both languages. Two-way bilingual programs are much less common than are transitional bilingual programs in the United States (Brisk, 2005, 2006; Francis, Lesaux, & August, 2006).
Like bilingual education, English-only instruction also assumes different forms. Common models include English as a second language (ESL) and structured English immersion programs. ESL instruction aims to develop LEP students’ English skills and may or may not be content based. In contrast, structured English immersion programs teach content area courses in English at the learner’s readiness level, using methodologies such as simplified language and highly structured lessons (Brisk, 2006; Francis et al., 2006).
Whether bilingual education or English-only instruction serves the best interests of LEP students has remained a topic of fierce controversy. People disagree about the academic pros and cons of bilingual versus English-only instruction, as well as possible psychological and sociocultural effects. Educators claim, at one extreme, that bilingual education “is, on average, the least effective approach to educating limited English children” if measured in English (Rossell, 2000, p. 230), or, at the other extreme, that “bilingual programs offer the best education to many children” (Snow, 2000, p. 255).
Given the large number of LEP children in U.S. schools and the uncertainty about the impact of bilingual education versus English immersion on their achievement, it is worth examining the effects of the current “English-only ballot initiatives” (i.e., Proposition 227 in California, Proposition 203 in Arizona, and Question 2 in Massachusetts) on LEP students’ academic performance. This study estimated the impact of Question 2 on LEP students’ reading achievement and explored whether programs provided to Massachusetts LEP students before and after the implementation of Question 2 imparted different language and reading skills. Our data do not allow us to identify the mediating variables through which Question 2 might affect LEP students’ academic performance. These could include factors other than instructional change, for example, more time spent with English-speaking peers.
Literature Review
Bilingual education advocates and English-only instruction advocates both hold strong opinions about the effects of bilingual education. In support of bilingual education, proponents cite the cross-language transfer of language and reading skills such as phonological awareness, word recognition, print knowledge, and oral reading fluency (e.g., Anthony et al., 2009; August, Calderón, & Carlo, 2001; Domínguez de Ramírez & Shapiro, 2007; Manis, Lindsey, & Bailey, 2004) and, more generally, the transfer of cognitive skills and academic skills developed in first language acquisition (August & Hakuta, 1997; Cummins, 1981, 1991). Bilingual education advocates view native language proficiency as a valuable resource for the acquisition of the English language proficiency. However, English-only advocates claim that bilingual education may disadvantage LEP students. They are concerned that bilingual education program enrollees might suffer from linguistic and cognitive confusion, get stuck in bilingual education programs because of insufficient exposure to English, and underachieve in both English skills and content mastery (e.g., Rossell, 2000, 2003; Tucker & D’Anglejan, 1971, as cited in Diaz, 1983, p. 24).
A large number of studies have attempted to compare the academic outcomes of bilingual education and English-only programs, but several widely cited syntheses of such studies have reported different conclusions. Baker and de Kanter (1981) and Rossell and Baker (1996) showed mixed results, whereas Greene (1998), Rolstad, Mahoney, and Glass (2005), Slavin and Cheung (2003), and Willig (1985) found bilingual education programs consistently superior to English-only programs. Francis et al. (2006), the most recent meta-analysis, also showed results that on average favored bilingual programs over English-only instruction.
Similarly, studies of the California and Arizona English-only ballot initiatives (Proposition 227 and Proposition 203) have shown mixed findings. Amselle and Allison (2000) claimed that Proposition 227 had been successful, based on a comparison of LEP students’ test performance before and after the passage of the proposition. However, both Butler, Orr, Bousquet Gutiérrez, and Hakuta (2000) and Thompson, DiCerbo, Mahoney, and MacSwan (2002) observed similar gains by non-LEP students during the same years. Likewise, Grissom (2004) detected no effect of Proposition 227 on LEP students’ academic achievement. Parrish et al. (2006) found, through a longitudinal study, that the performance gap between English learners and native speakers of English remained virtually unchanged after the implementation of Proposition 227. In Arizona, the Department of Education (2004) reported that structured English immersion program enrollees scored higher than bilingual education program enrollees after the passage of Proposition 203. However, Mahoney, MacSwan, and Thompson (2005) noted several major flaws in the study. More importantly, none of the above studies employed methods that were able to support strong causal inferences.
There is no state-level, quantitative study of the Massachusetts policy change. Of the few published studies about the policy, none was conducted at the state level, and most were qualitative. For instance, de Jong, Gort, and Cobb (2005) described how three school districts responded to the passage of Question 2, and Rennie Center for Education Research and Policy (2007) presented a case study of three schools with large populations of LEP students making great progress 5 years after the passage of Question 2. Tung et al. (2009) and Uriarte et al. (2009), in a quantitative study about the impact of Question 2, examined only the Boston public schools. Even more importantly, they compared only Spanish-speaking LEP students to native English speakers because of the small samples of the four other language groups they studied. Both Tung et al. (2009) and Uriarte et al. (2009) called for a statewide evaluation of the impact of Question 2 on the outcomes for LEP students.
We seek to fill the gap in the literature by exploiting the sudden policy change that took effect in 2003 in Massachusetts to estimate the impact of the English immersion law on LEP students’ academic achievement. Massachusetts was the first state to mandate bilingual education in the United States (Vaishnav, 2002) and has implemented a variety of bilingual and English-only programs over the years. Under the pre-2002 Chapter 71A legislation, school districts were required to offer transitional bilingual programs to their LEP students, who had to remain in the programs for three years unless they had developed English skills sufficient to perform well in English-only classes. The passage of Question 2 in November 2002, however, represented a dramatic move away from bilingual education, as the policy mandates sheltered English immersion (SEI), composed of ESL instruction and sheltered content instruction, as the primary means of instruction for LEP students. Normally students should remain in SEI programs for no more than 1 year (Massachusetts Department of Elementary and Secondary Education, 2006; National Conference of State Legislatures, 2008a, 2008b). The implementation of Question 2 provides a natural experiment, making it possible to employ a strong quasi-experimental research design (Murnane & Willett, 2010) for causal inferences.
Our primary outcome is reading proficiency as measured by scores on the MCAS (Massachusetts Comprehensive Assessment System) test. Testing with MCAS is mandated by the state and is used for the accountability provisions of No Child Left Behind. In addition, we examined whether the policy change affected subsets of skills differentially, which could have happened regardless of whether the policy change had a statistically significant impact on total reading proficiency as measured by MCAS because bilingual education and SEI programs might favor different language and reading skills differentially. One of the central themes throughout the English Language Proficiency Benchmarks and Outcomes for English Language Learners, a document intended to assist the post-Question 2 instruction of LEP students, is “the critical role of vocabulary in language development” (Massachusetts Department of Education, 2003a, p. 4). Consistent with this policy, Smith, Coggins, and Cardoso (2008) noted that, in all three Massachusetts public schools that they studied, the SEI programs provided explicit instruction in vocabulary, by “analyzing words” or “getting students to talk about how the vocabulary concepts link to their lives” (pp. 304-305), among other techniques. This might improve SEI students’ vocabulary performance compared with their performance on other language and reading skills.
Although we were unable to measure directly the curricular emphasis of SEI and bilingual education programs, we explored whether there were differential changes in LEP students’ language and reading skills after the policy change. If present, these might indicate that the English immersion law improved some language and reading skills relative to others.
Specifically, we addressed the following research questions:
(1) Is the reading achievement of third-grade LEP students who were educated in Massachusetts after the implementation of Question 2 higher or lower than the achievement of those educated before the policy change?
(2) Did the third-grade LEP students who were educated after the policy change show strengths or weaknesses in different language and reading skills, relative to their non-LEP peers, than those educated before the policy change?
Data and Method
Data
We analyzed data on the Grade 3 MCAS reading test for 2003 and 2006. The reliability indices (Cronbach’s α coefficients) for the 2003 and 2006 test forms were 0.88 and 0.90, respectively (Massachusetts Department of Education, 2003b, 2006a). The validity evidence for the MCAS tests is available primarily for other grades but one of the grades examined was adjacent (Grade 4). For students in two large urban districts in Massachusetts, Gong (1999) and Thacker and Hoffman (1999) separately examined the relationship between MCAS scores and performance on some other tests: Metropolitan Achievement Test (MAT-7) at Grade 10 and Stanford Achievement Test (SAT-9) at Grade 4 by Gong, and SAT-9 at Grades 4, 8, and 10 by Thacker and Hoffman. Both studies revealed that students performing at higher levels on MCAS also tended to score higher on the commercial tests and that the correlations between similar subject areas (e.g., MCAS ELA and SAT-9 Reading/Language) were higher than those between dissimilar content areas (e.g., MCAS ELA and SAT-9 mathematics). Statewide, third-graders’ Iowa Test of Basic Skills (ITBS) reading scores in 1997 were fairly highly correlated with fourth-graders’ MCAS ELA scores in 1998, with a correlation of approximately 0.75. More recently, a 2005-2006 examination of MCAS and National Assessment of Educational Progress (NAEP) found that scores on the two tests were strongly correlated (Massachusetts Department of Education, 2006a).
The data for this study comprised third-grade students who took the MCAS reading test in 2003 and 2006 (“the 2003 cohort” and “the 2006 cohort”). The 2003 cohort was the last cohort of third graders tested before Question 2 affected the operation of the school districts. It is reasonable to assume that the 2003 cohort had not been affected by Question 2 by the time they took the MCAS test (in spring 2003), since Question 2 would not become effective until academic year 2003-2004 (Chapter 386 of the Acts of 2002, n.d.) and the school districts were supposedly still bound by Chapter 71 and had to provide bilingual education to their LEP students. The 2006 cohort of third graders was the first cohort to have had the new policy in effect for their entire time in school. Third grade is the earliest grade tested in the Massachusetts accountability system. If we had used a test for higher grade, we would have needed two cohorts farther apart in time. For example, the last cohort of fourth graders to have had no schooling under Question 2 was that tested in 2003, while the first cohort to have had all of their schooling after the implementation of Question 2 was the cohort tested in 2007. This longer time span would increase the possibility that policy or other change taking place between the years when the two cohorts took the test might have affected LEP and non-LEP students differentially.
Our original dataset included 146,688 students. We excluded 26,281 students who received special education or were disabled and 391 students whose test status was NTA (Not Tested Absence) or NTM (Not Tested Medically Documented Absence), with 120,016 students left in the dataset. For the first research question, we removed 125 additional students who lacked almost all background information (including LEP status) and resulted in a sample of 119,891 students. As Table 1 shows, the LEP or former LEP students from the two cohorts were similar in terms of the average multiple choice item score, gender, ethnic mix, and percentage of students who were eligible for free or reduced price lunch and for Title I services. The same was true of the comparison between the non-LEP students from the two cohorts.
Estimated Means (and Standard Deviations) of the Multiple-Choice Item Scores and the Control Variables, Separately for LEP or Former LEP Students (LEP) and Non-LEP Students in 2003 and 2006 (N = 119,891)
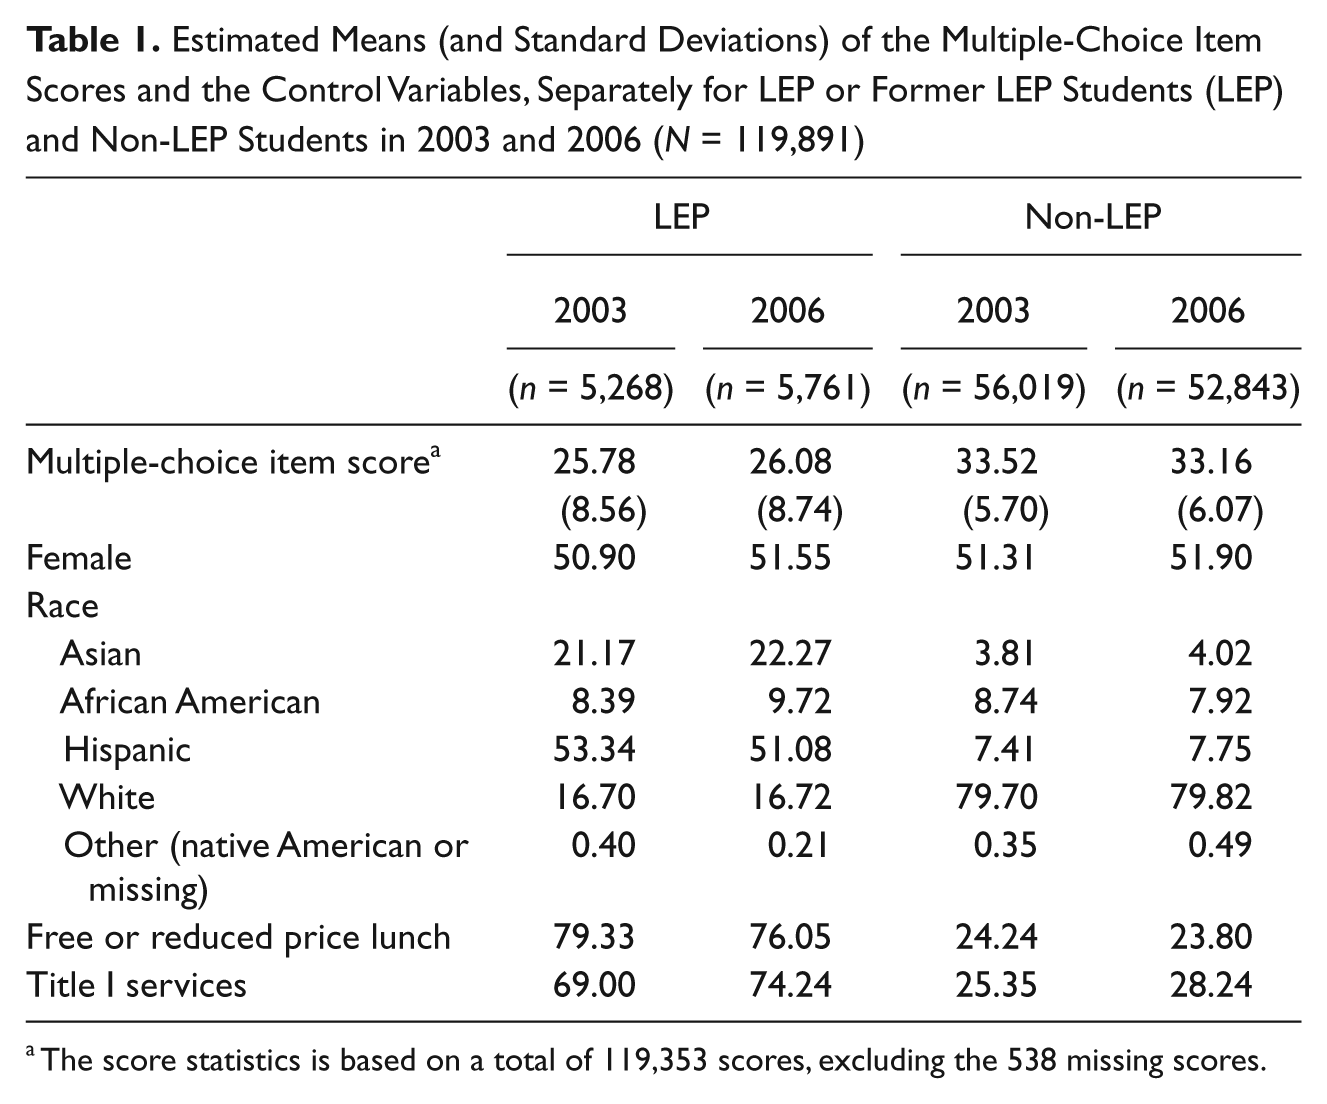
The score statistics is based on a total of 119,353 scores, excluding the 538 missing scores.
For the second research question, removing (from the 120,016 students) 658 students who lacked scores or who did not indicate their LEP status resulted in 119,358 students for the person-item level analysis, with 61,088 in the 2003 cohort and 58,270 in the 2006 cohort. Again, the LEP students from the two cohorts were comparable and so were the non-LEP students from the two cohorts. We provide no table separately for this sample, as it would be very similar to Table 1.
For both research questions, we used the two cohorts’ performance on the MCAS Grade 3 reading test. The test is based on learning standards in two content strands: language and reading and literature. Each test form contains seven reading passages, with altogether 40 multiple-choice items and two open-response items.
Data-Analytic Strategies
To address the first research question, we implemented a difference-in-differences approach by fitting a multilevel model of the following form:

where for the ith student in the jth school, LMC ij is a logit transformation of the proportion of the student’s multiple choice item responses that were correct, POST ij (coded 0 for the 2003 cohort and 1 for the 2006 cohort) represents whether the student received education after the policy change, LEP ij represents whether the student was (formerly) LEP, Sij is a vector of student level covariates (i.e., gender, race, eligibility for free or reduced-price lunch, and Title I services eligibility), υ j is the school-level error term, and ε ij is the student-level error term. We used the multilevel regression model to adjust the standard error to account for the data clustering.
We applied a logit transformation to stretch out the tails of the score distribution so as to get rid of compression of the scale (with over one-fourth of the students scoring at or above 38 out of a total of 40 and more than 5% getting a perfect score). Because the score distribution was more compressed on the high end than on the low end, the logit transformation also reduced skewness, rendering the score distribution more nearly symmetric.
The parameter of interest is β3, the coefficient on the interaction term. It estimates the difference in the performance of the LEP students from the two cohorts, adjusting for the secular trend represented by the non-LEP students’ performance difference. The inclusion of the non-LEP students, the comparison group, ensures that the study results are not affected by factors such as a simultaneous policy change unless the change had differential impacts on the LEP and the non-LEP students. A positive estimate of β3 would indicate that the new policy was beneficial to the LEP students.
To address the possibility of bias from missing data, we tested the sensitivity of the results to missing data with score imputation. The imputation was necessary because the database included LEP students exempted from the MCAS test and there were considerably more such students in the 2006 cohort than in the 2003 cohort. For the 2003 cohort, LEP students in their first year of enrollment in U.S. public schools (first-year LEP students) were exempted only if they received special exemption approval from their principals. For the 2006 cohort, however, schools had the option of excusing all first-year LEP students from the ELA tests (Massachusetts Department of Education, 2003b, 2006b). The more numerous exemptions in 2006 (339 vs. 199) posed a problem because the first-year LEP students who did take the test scored considerably lower on average than the other LEP students and the non-LEP students. The first-year LEP students on average answered about 16.5 (out of 40) items correctly, with about three-fourths of these students scoring below 22. By contrast, the other LEP students and the non-LEP students on average got 26 and 33 items right, respectively, each with a large percentage of students piled at the high end of the score distributions (Figure 1). If the untested students would similarly have scored low, the larger number of them in the 2006 cohort would overestimate the effect of the policy change. Therefore, we imputed scores for the untested first-year LEP students and evaluated the sensitivity of the results to the imputation.
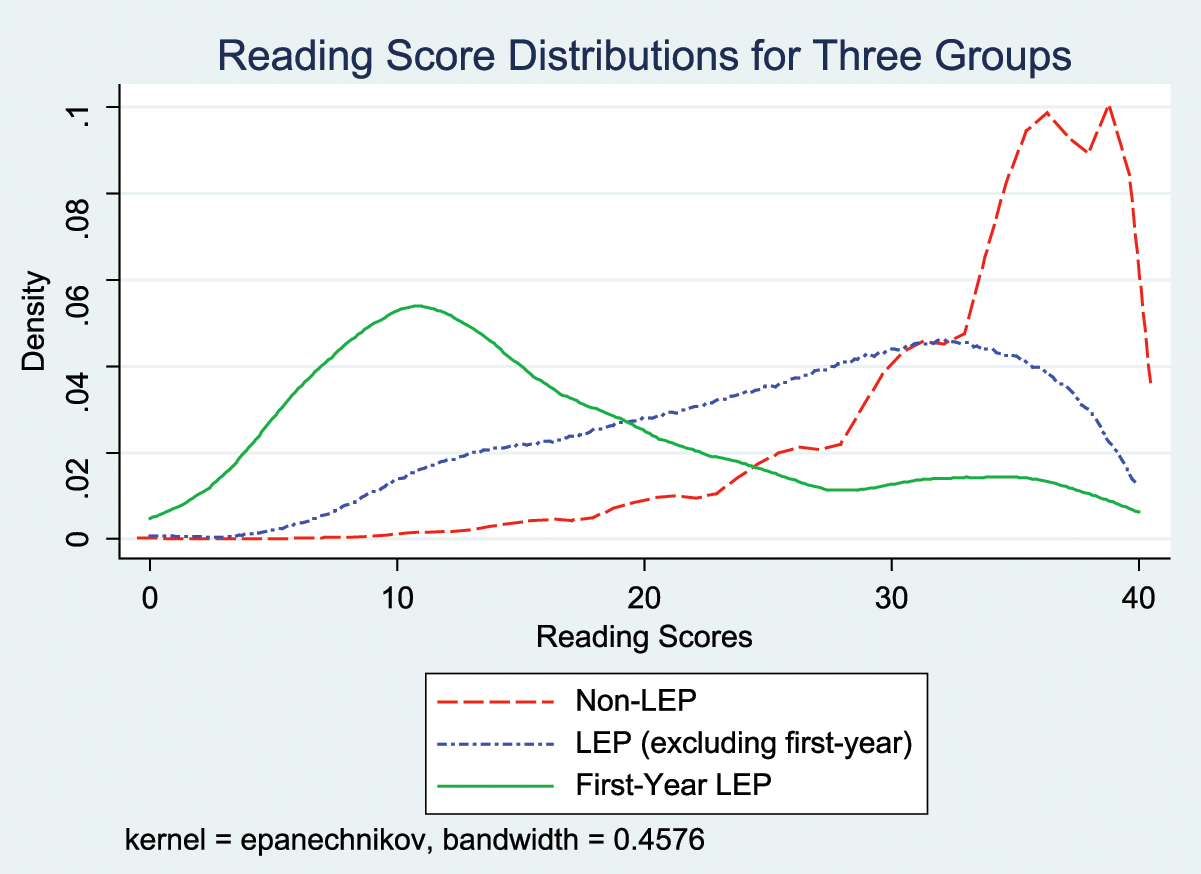
Reading score distributions
We imputed the missing scores with the hot-deck procedure, and then varied the scores we assumed, to test how sensitive the results were to the scores imputed. The hot-deck method provides imputed values for records with missing values by randomly selecting an available value from someone in the study who is similar to the person for whom the variable of interest is missing (Seastrom, 2002; Weisberg, 2005). Specifically, the procedure assigned test scores to the untested first-year LEP students by taking scores from randomly selected, tested first-year LEP students who matched the untested students on the covariates. The score imputation returned a mean score of 16.88 out of 40 for the untested first-year LEP students, only slightly higher than the mean of the tested first-year LEP students (16.5). The slight difference is not unexpected given the random element of the hot-deck procedure.
It seems reasonable to assume that the untested first-year LEP students were on average lower performing than their tested counterparts. Therefore, in the sensitivity analysis, we set the imputed scores resulting from the hot-deck procedure as the upper bound. Then we assumed gradually decreasing values (by subtracting each time the same amount from each imputed score but making sure that no score went below 0) such that the mean score of the untested first-year LEP students was about 10, 5, and finally approximately 0.
To address the second research question, we first conducted a differential item functioning (DIF) analysis, on the basis of which we conducted a differential bundle functioning (DBF) analysis.
An item exhibits DIF if two groups of students, when matched with respect to proficiency on the overall construct measured by a test, have different probabilities of answering the item correctly (Dorans & Holland, 1993). We employed the logistic regression procedure to identify items that exhibited differential difficulty for LEP students, relative to their non-LEP peers, in 2003 and 2006. Specifically, we fitted the following three logistic regression models to the students’ responses to each item:


The first model estimates the probability of answering item n correctly as a logistic function of the overall proficiency, LMC. The additional parameter β 2n in the second model represents the main effect of group membership (LEP) on the probability of answering an item correctly, after controlling for LMC. This parameter is a test of “uniform DIF,” that is, DIF that is consistent (in the logits) across the LMC range. In this model, a nonzero value of β 2n indicates that the item was differentially difficult for students in one group when compared to students in the other group who were matched on LMC. The additional parameter β 3n in the third model represents the interaction between LMC and LEP. It is a test of “nonuniform DIF,” that is, differences in performance among matched students that vary across LMC levels. For example, a given type of item might favor only LEP students whose overall proficiency fell within a certain range. Meanwhile, we estimated the statistical significance of each of these parameter estimates by comparing the log-likelihood for the augmented model including that variable with the log likelihood for the more compact model that omits that variable (Camilli & Shepard, 1994).
We followed the widely used Educational Testing Service (ETS) convention and expressed the DIF statistic as a difference on the delta scale, which is commonly used at ETS to indicate item difficulty. Specifically, we transformed the parameters representing the log-odds ratios (β 2n from Model 2 and β 3n from Model 3) into differences between the focal and reference groups on the delta scale by substituting into the following (Camilli & Shepard, 1994):

A |D| value of 1.00 indicates that the item is 1 point harder for members of one group than for comparable members of the other group on the delta scale, which in turn indicates a difference of about 10 points in percentage correct if the item is of medium difficulty.
On the basis of the absolute values and the statistical significance of D, we classified the items into three DIF categories:
Category A (negligible DIF): |D| less than 1 or not statistically significant;
Category B (moderate DIF): |D| at least equal to 1 and statistically significant, but less than 1.5 or not statistically significantly greater than 1.0;
Category C (large DIF): |D| at least equal to 1.5 and statistically significantly greater than 1.0 (Zieky, 1993).
To determine whether any differential performance that the DIF analysis detects is consistent with possible changes in the curricular emphasis by programs for LEP students, we also conducted a DBF analysis, as a clearer and more powerful way to describe patterns of DIF for categories of items. DBF analysis is conceptually similar to DIF analysis, except that differential performance is evaluated for a bundle of items rather than individual items. DBF analysis is superior to DIF analysis if one has categories of items about which one is concerned and therefore can form DBF hypotheses a priori. In DBF analysis, the items are substantively clustered (i.e., based on some organizing principles such as assessing the same content area) and thus what the items share may have caused the differential performance (Douglas, Roussos, & Stout, 1996). The DBF approach also has greater statistical power than does the DIF approach, owing to possible DIF amplification: when the items in a bundle act in concert, “small amounts of DIF can add up to an unacceptable level of DIF at the bundle level—in other words, an unacceptable level of DBF” (Douglas et al., 1996, p. 468).
Given the focus on the LEP students’ relative strengths and weaknesses in language and reading skills, the natural organizing principle for bundling the items was the Massachusetts English Language Arts Curriculum Framework General Standards. We assessed the bundles thus formed for differential performance if they met one of the two criteria: (1) one or more items in a bundle exhibited moderate to large DIF; or (2) all or most items in a bundle showed DIF only in one direction.
We evaluated DBF using the SIBTEST (Simultaneous Item Bias Test) procedure (Stout & Roussos, 1999). SIBTEST estimates

where θ is the user-specified composite latent ability on which to match the focal and reference groups, and f is the probability density function of θ. T is the number-right true score given group membership and θ, that is, the number-right score predicted by the IRT model. For large samples,
We matched students only on items that were not suspected of DIF. Specifically, for each particular run of SIBTEST, we used as the matching items all the items on the test other than those that have been found to exhibit B- or C-level DIF individually and those in the suspect bundle being studied in that particular analysis.
Results
Effects of Question 2 on Reading Achievement
Table 2 displays the regression results. Columns (a) and (b) show the results obtained when we used only student records with valid test scores, not controlling or controlling for the covariates, respectively; and columns (c) to (f) show the results obtained by assuming gradually decreasing scores for the untested first-year LEP students, controlling for the covariates. All the covariates had statistically significant effects on the outcome in all models (p < .001). To save space and to highlight the POST_LEP estimates, we do not show the estimated coefficients for the covariates.
Regression Models Showing the Estimated Effects (Robust Standard Errors in Parentheses) of Effects of Question 2 on LEP Students’ Performance, First Excluding Untested First-Year LEP Students and Then Assuming Gradually Decreasing Scores for These Students
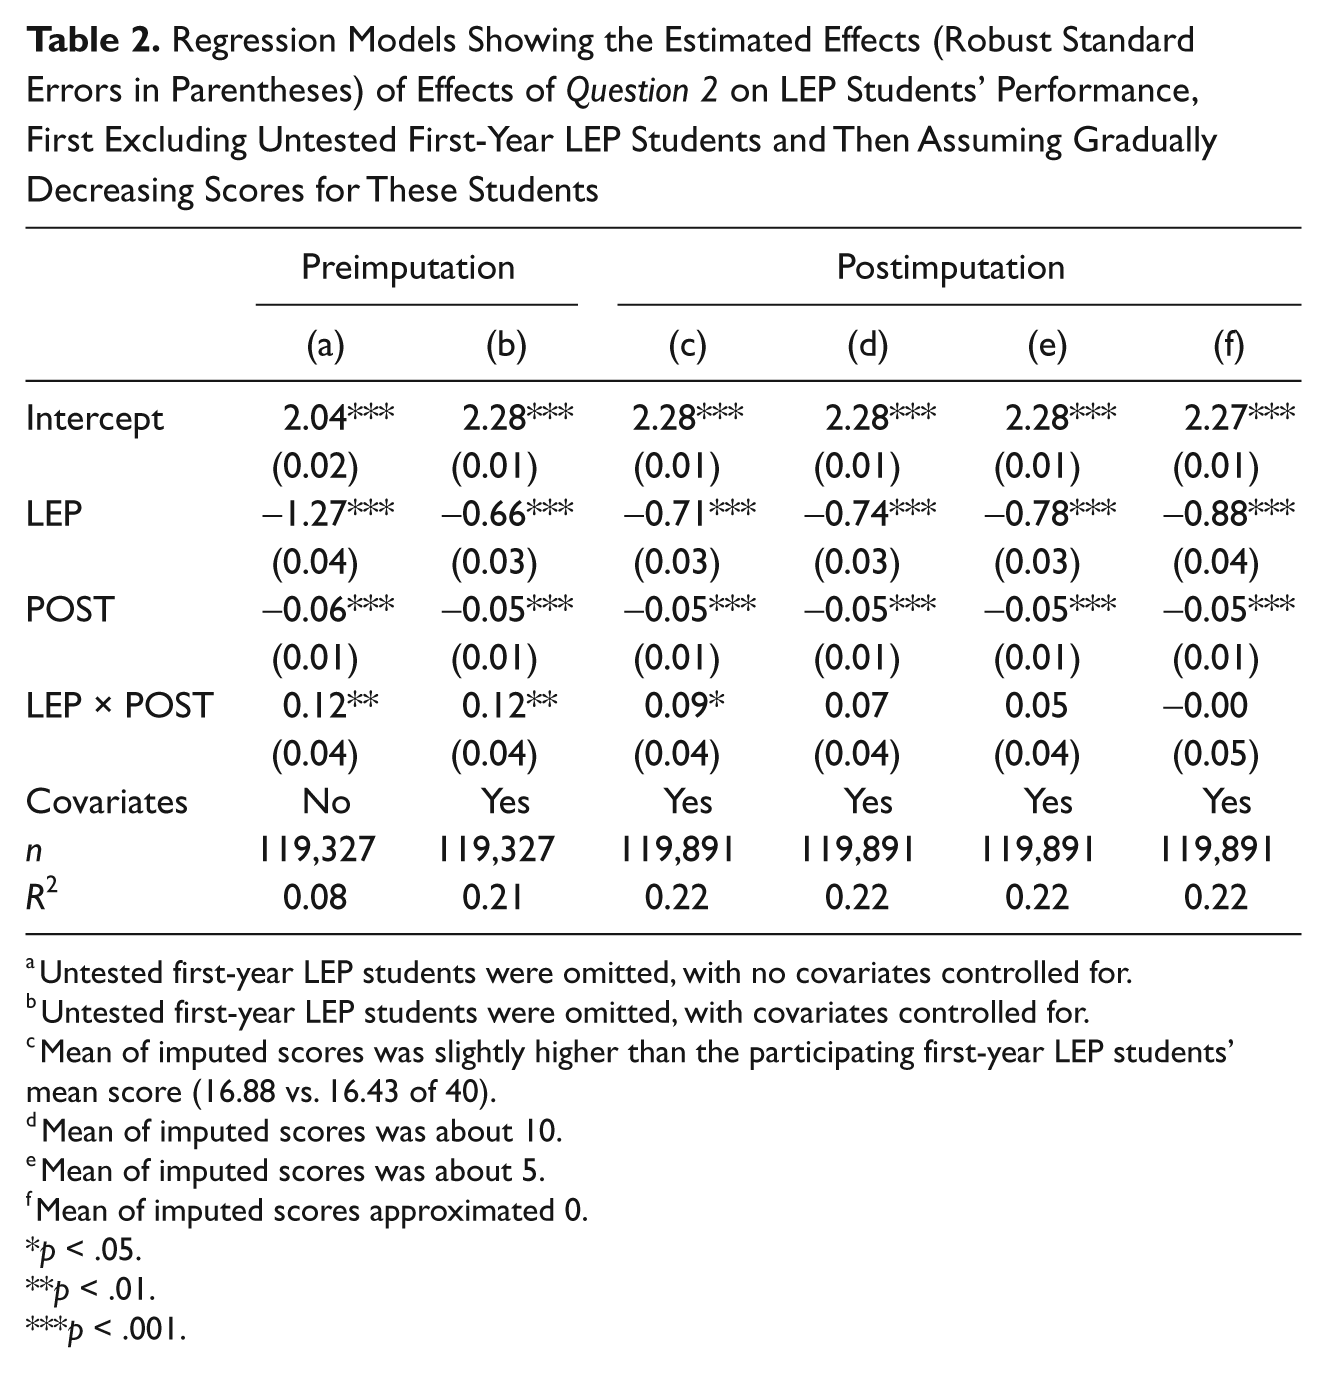
Untested first-year LEP students were omitted, with no covariates controlled for.
Untested first-year LEP students were omitted, with covariates controlled for.
Mean of imputed scores was slightly higher than the participating first-year LEP students’ mean score (16.88 vs. 16.43 of 40).
Mean of imputed scores was about 10.
Mean of imputed scores was about 5.
Mean of imputed scores approximated 0.
p < .05.
p < .01.
p < .001.
The parameter estimate for the interaction term LEP × POST in column (b) suggests that controlling for the students’ background characteristics and the secular trend, the policy change increased the LEP students’ performance by 0.12 logit. This is approximately 0.07 of a standard deviation (0.12/1.7), using the scaling factor of 1.7 commonly used in IRT models to bring the logistic ogive into approximate alignment with the normal ogive. This result, however, overestimated the impact of Question 2 on LEP students’ performance and provided an upper bound to the impact estimate, because more low-scoring, first-year LEP students did not take the test in 2006 than in 2003. Columns (c) to (f) show the impact of including the missing cases with different assumptions about their scores. The estimated impact is very small in all columns (in the range of 0 to 0.09 logit, or about 0 to 0.05 of a standard deviation) after the score imputation.
Furthermore, the estimate is highly sensitive to assumptions about the latent scores of the untested first-year LEP students. Specifically, the new policy increased the LEP students’ performance by about 0.05 of a standard deviation (=0.09/1.7) when the mean of the imputed scores is slightly higher than the mean score of the tested first-year LEP students, controlling for the students’ background characteristics and the secular trend (column [c]). The impact is statistically significant (p < .001). The impact estimate remains positive (about 0.04 of a standard deviation) but is not statistically significant when the mean of the imputed scores is 10 (out of 40), or 6 points lower than the participating first-year LEP students’ mean score (column [d]). In the unlikely case that the first-year LEP students without scores would have answered on average fewer than one of the 40 multiple choice items correctly, the impact would become essentially 0 (column [f]).
LEP students are a heterogeneous group, with different language backgrounds, varying levels of native-language literacy, and differential access to native-language instructors in the pre-Question 2 era. One might ask whether the results we obtained for the total LEP population represents the impact of Question 2 on the Hispanic population, which constitutes over 50% of the LEP population in Massachusetts, and whether the impact was different for other LEP students, who were spread across 100 language groups and many of whom would have had less access to native-language instruction before the referendum (Massachusetts Department of Education, 2002). This turns out not to be the case. Although the effects for Hispanic LEP students (0.08 of a standard deviation) were slightly larger than the effects for LEP students on the whole and the effects for non-Hispanic LEP students were somewhat smaller (0.02 of a standard deviation), there was no statistically significant difference between the effects for the two LEP subgroups.
Therefore, the safest conclusion is that the English immersion law had no statistically significant, negative effect on the MCAS reading performance of the LEP third graders. This conclusion is robust to transformation of the outcome measure and to assumptions about the performance of untested students.
Relative Strengths and Weaknesses in Language and Reading Skills
The DIF and DBF analysis of the 2003 test results indicates that the LEP students in the 2003 cohort had relative weaknesses in items assessing Vocabulary and Concept Development (General Standard 4) and Understanding a Text (General Standard 8) but relative strengths in items assessing Nonfiction (General Standard 13) and Dramatic Literature (General Standard 17), compared to their non-LEP peers matched on the test score.
We conducted a DBF analysis of four suspect bundles for the 2003 test form and found all four bundles showed DBF. We first identified the suspect bundles by examining Figure 2, which shows the estimated uniform D values for all 2003 items that exhibited statistically significant, uniform DIF, bundled by the standards assessed. (We ignored nonuniform DIF results because only one item exhibited nonnegligible, nonuniform DIF, and even this was not large.) The ovals in Figure 2 highlighted four suspect bundles: three bundles that each contained an item exhibiting moderate to large uniform DIF (indicated by the solid ovals) and one additional bundle with items showing DIF only in one direction (represented by the dotted oval). The DBF analysis results for the four bundles are displayed in Table 3: the items assessing Vocabulary and Concept Development and Understanding a Text showed differential performance favoring the non-LEP students while the Nonfiction and the Dramatic Literature items showed differential performance favoring the LEP students.
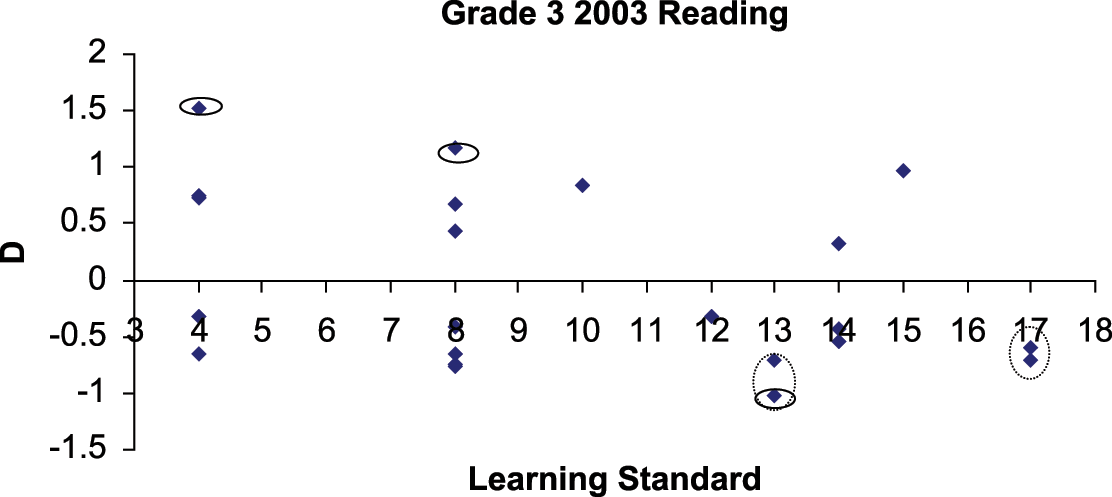
Estimated D values of items on the 2003 reading test
Estimated Differential Bundle Functioning Results for the Grade 3 2003 Reading Test
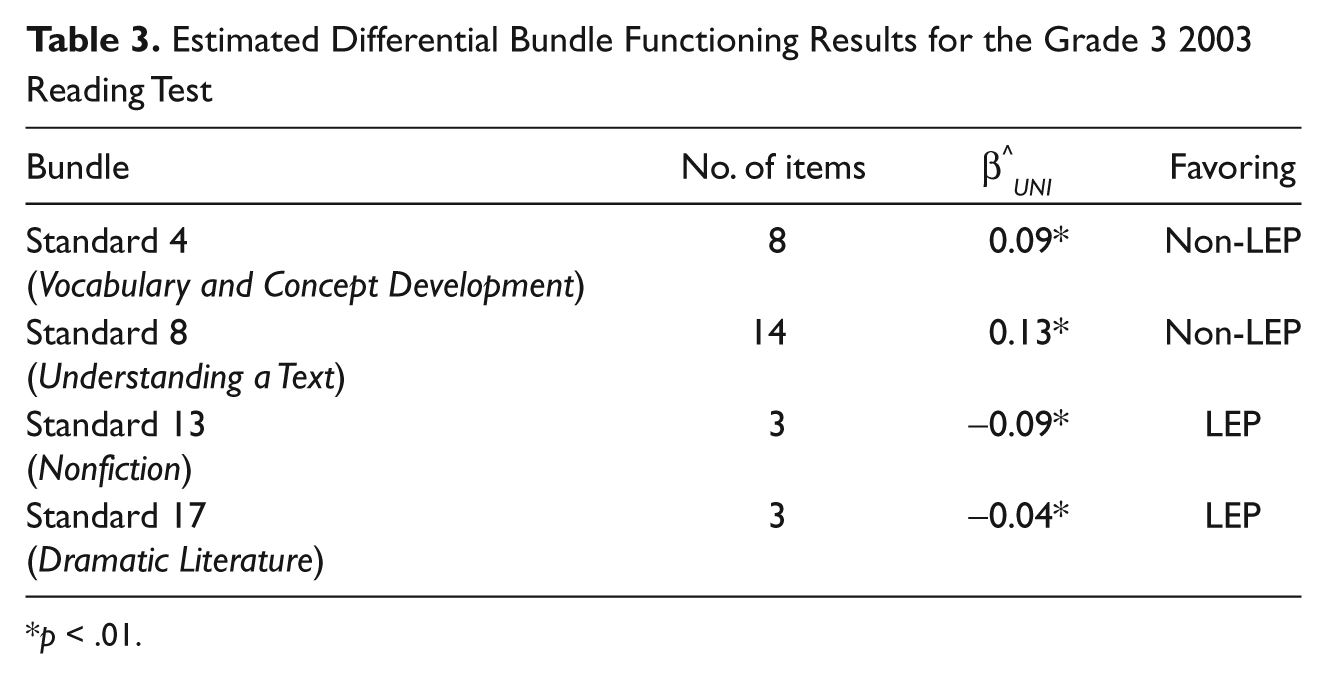
p < .01.
The DIF and DBF analysis for the 2006 test form suggested that the LEP students in the 2006 cohort had relative strengths in items assessing antonyms and synonyms (part of Vocabulary and Concept Development) and Nonfiction but relative weaknesses in items that assessed less common meanings of words with multiple meanings (part of Vocabulary and Concept Development) and Understanding a Text, compared to their non-LEP peers matched on the test score.
Following the same procedure as for the 2003 test form, we determined three suspect bundles for the 2006 test form and found they all exhibited DBF. The ovals in Figure 3 highlighted three suspect bundles: one bundle with an item exhibiting moderate uniform DIF and two bundles each with all or most items showing DIF only in one direction. The DBF analysis results for the three bundles are displayed in Table 4: of the Vocabulary and Concept Development items, those assessing synonyms and antonyms showed differential performance favoring the LEP students, while those assessing the less common meanings of polysemies (i.e., words with multiple meanings) favored the non-LEP students; the Understanding a Text items favored the LEP students whereas the Nonfiction items disfavored them. In addition, we conducted a DBF analysis of the Dramatic Literature bundle on the 2006 test, since this would provide a comparison for the differentially performing Dramatic Literature bundle on the 2003 test and since one item in this bundle displayed moderate nonuniform DIF. However, this bundle favored neither the LEP nor the non-LEP students.
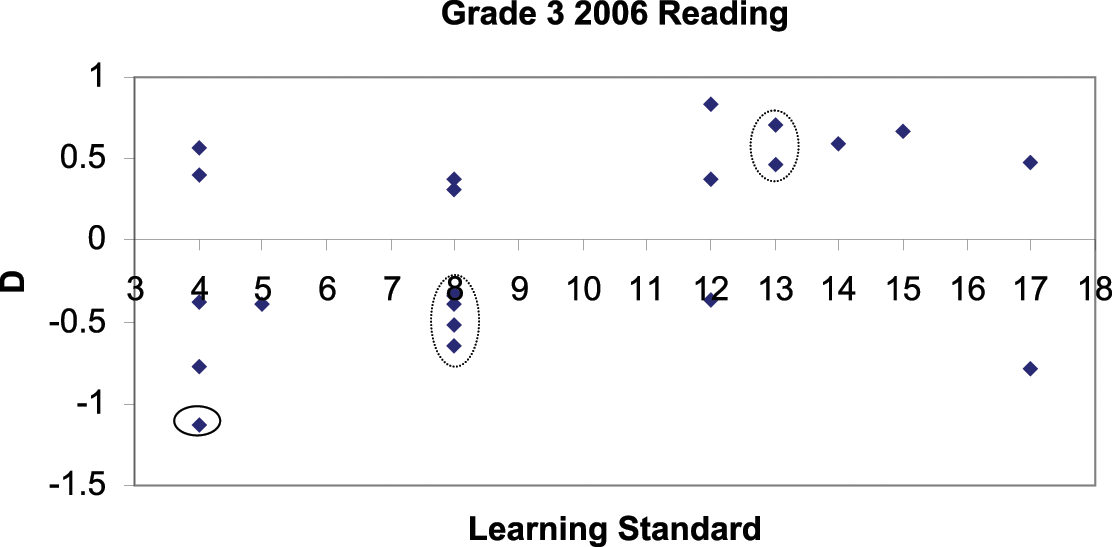
Estimated D values of items on the 2006 reading test
Estimated Differential Bundle Functioning Results for the 2006 Reading Test
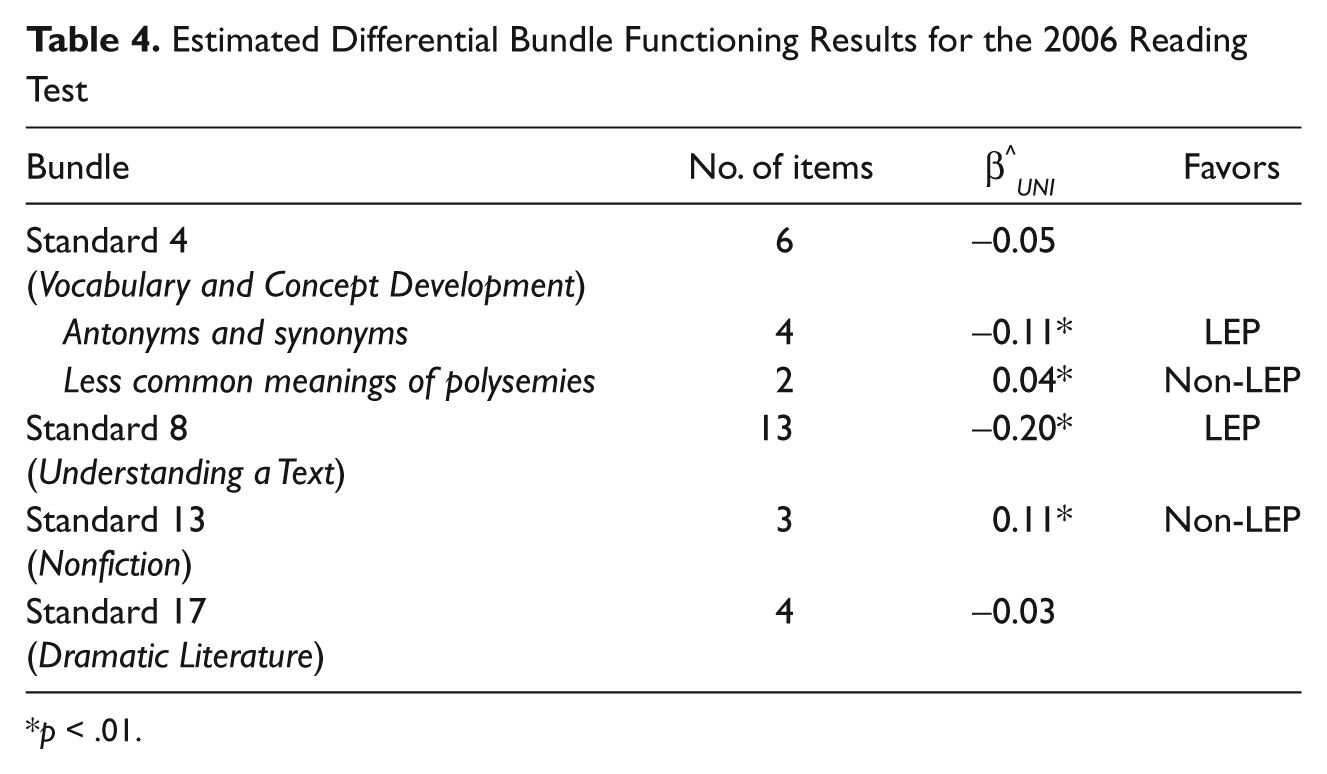
p < .01.
Changes in differential performance
We compared the DBF results for the 2003 and 2006 test forms and found that the LEP students improved in certain language and reading skills relative to others after the policy change. Note that the DIF and DBF results indicate the LEP students’ strengths and weaknesses in language and reading skills, compared to the non-LEP students matched on the reading proficiency, and that changes in differential performance suggest the LEP students’ improvement or deterioration on certain language and reading skills, compared to their overall reading proficiency (rather than raw performance change in those skills from 2003 to 2006). Interpretation of these changes in DBF is subject to two caveats. First, with very few items in each comparison, there is the possibility that other incidental characteristics that these particular items share may underlie the patterns discovered. Second, we cannot ascertain whether the policy change caused the change in DIF, since we did not base this part of the analysis on an experimental or a quasi-experimental design. Rather, we examined whether there was evidence consistent with the hypothesis of curricular change stemming from the policy change.
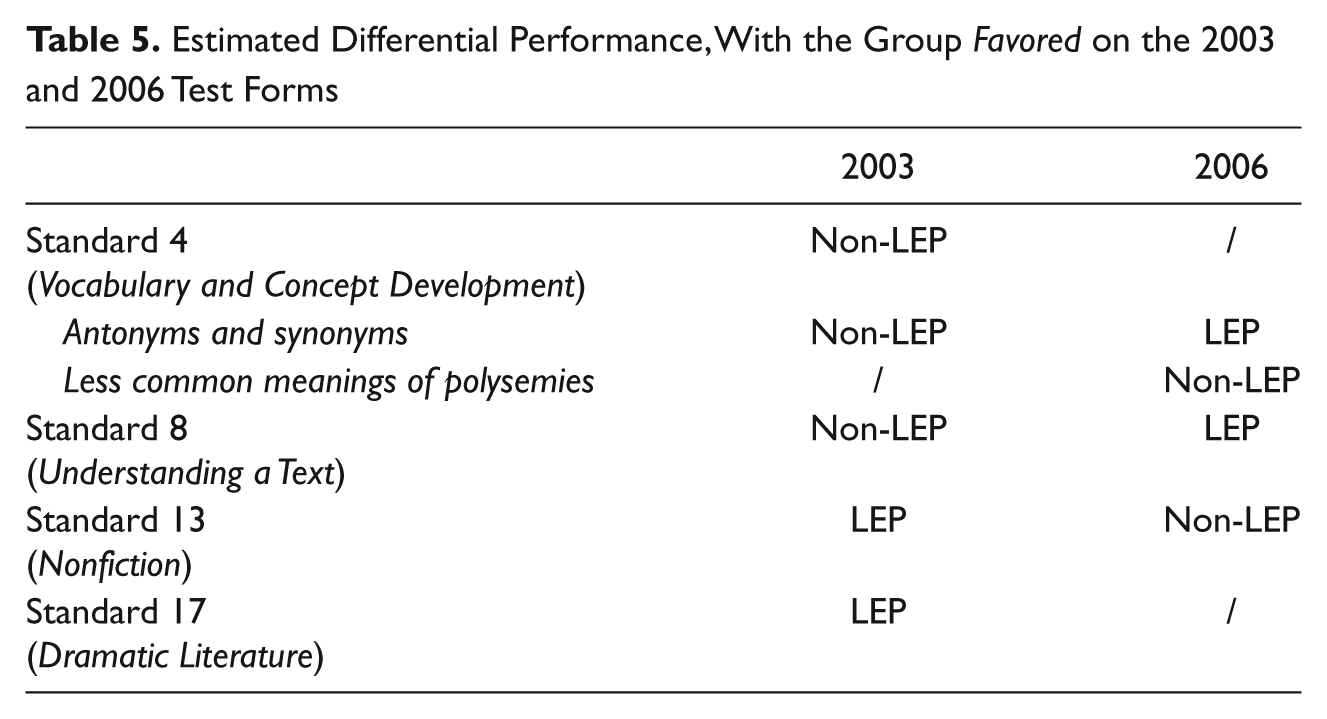
Table 5 lists which group each differentially functioning bundle favored in the 2003 and 2006 test forms. These changes suggest that the programs for LEP students before and after Question 2 might have had different curricular emphases, primarily involving four learning standards. Specifically, it seemed that, relative to their overall reading proficiency, the LEP students improved on the synonyms and antonyms part of Vocabulary and Concept Development and on Understanding a Text, but deteriorated on Nonfiction and Dramatic Literature, after the policy change.
Estimated Differential Performance, With the Group Favored on the 2003 and 2006 Test Forms
The pattern exhibited by the vocabulary items on the 2003 and 2006 test forms provides evidence in support of improved Vocabulary and Concept Development skills on the part of the LEP students, possibly as a result of greater curricular emphasis in this aspect after the policy change. The vocabulary items on the 2003 test on the whole disfavored the LEP students (the bilingual education program enrollees), with one item showing large DIF (|D| = 1.52). The vocabulary items on the 2006 test, in contrast, showed a more complex pattern. One vocabulary item exhibited moderate DIF in favor of the LEP students (|D| = 1.13). Moreover, compared to the matched, non-LEP students, the LEP students had relative strengths on synonyms and antonyms (e.g., “Which pair of words from the poem are antonyms?”) but relative weaknesses on interpreting sentences containing the less common meanings of polysemous words (e.g., “Maria is my prize student”). The SEI program enrollees’ relative strengths on items that assessed antonyms and synonyms are in line with the requirement for students to “identify and apply the meaning of the terms antonym, synonym, and homophone” (Massachusetts Department of Education, 2004, p. 6, italic in original), Thus, the study results suggest evidence consistent with the hypothesis that the post-Question 2 SEI programs’ curricular emphasis promoted some aspects of LEP students’ vocabulary development.
The patterns of the items that assessed Understanding a Text may also suggest a possible area in which the SEI programs’ curricular emphasis boosted the LEP students’ language and reading skills, compared to their overall proficiency. The Understanding items on the 2003 test on the whole disfavored the LEP students, with one item exhibiting moderate DIF (|D| = 1.17). In contrast, the Understanding items on the 2006 test on the whole showed differential performance favoring the LEP students.
The Nonfiction items showed a pattern exactly opposite to that of the Understanding items: the LEP students’ reading skills in this area deteriorated after the policy change, compared to their overall proficiency. On the 2003 test, one Nonfiction item exhibited moderate DIF favoring the LEP students (|D| = 1.02) and the LEP students had relative strengths on the Nonfiction items on the whole. In contrast, the Nonfiction items on the 2006 test on the whole showed differential performance disfavoring the LEP students. The difference in the LEP students’ Nonfiction item performance for the 2 years, however, could also stem from a change in the format of the items. On the 2003 test, two of the three Nonfiction items assessed ability to make use of information from complementing pictures, and both of these items favored the LEP students. This is consistent with Martiniello’s (2006) finding that (mathematics) items with symbolic representations such as graphs and equations tended to show DIF favoring LEP students. It is also in line with the need for students to be able to “identify and use knowledge of common graphic features (charts, maps, diagrams, illustrations)” (Massachusetts Department of Education, 2001, p. 50; 2004, p. 8, italic in original). Since no nonfiction item on the 2006 test assessed ability to apply information from “graphic features,” the program curricular emphasis in this respect before and after the policy change cannot be adequately compared.
LEP students’ performance on the Dramatic Literature items also deteriorated, compared to their overall proficiency, from 2003 to 2006. The Dramatic Literature items on the whole showed differential performance favoring the LEP students on the 2003 test but favored neither group on the 2006 test. Furthermore, one Dramatic Literature item on the 2006 test exhibited nonuniform DIF disfavoring the LEP students. However, this DIF could actually stem from the LEP students’ failure to understand the phrase spies on, which is the key to answering the item correctly. LEP students might know the meaning of “spy” as a noun but not as a verb, a common problem with LEP students’ vocabulary development. This would provide further support for the pattern revealed by the DBF analysis of the Vocabulary items, that is, compared to their non-LEP peers matched on the reading proficiency, the LEP students in the 2006 cohort had relative weaknesses on items that assessed less common meanings of polysemous words.
Discussion
Bilingual education advocates and English immersion advocates have dramatically different expectations for Question 2, which mandates sheltered English immersion instead of bilingual education as the primary means of instruction for LEP students in Massachusetts. Bilingual education advocates worried that the English immersion law would have a negative impact on LEP students’ achievement whereas English immersion advocates expected it to improve LEP students’ performance. The difference in opinions is partly due to the inconsistent research evidence available concerning the impact of bilingual education versus English-only instruction on LEP students’ academic achievement.
We examined the effects of Question 2 on LEP students’ academic performance and found that neither its supporters’ nor its opponents’ opinion was borne out in this study: the English immersion law had no sizeable effect on third-grade LEP students’ reading performance. Depending on the assumptions one makes about the performance of the untested first-year LEP students, the effect ranges from essentially 0 to slightly positive, at most 0.07 of a standard deviation.
Our finding that Question 2 had no sizeable effects on LEP students’ reading performance is similar to what Grissom (2004) and Parrish et al. (2006) found about the effects of Proposition 227 on LEP students’ academic achievement in California. The result, in some sense, is also similar to Tong, Lara-Alecio, Irby, Mathes, and Kwok’s (2008) findings from an experimental study. Their study showed that effective instruction was associated with highly comparable growth rates, in academic oral English development, between structured English immersion programs and transitional bilingual programs, even though the former spent more time in English instruction, and they concluded that “learning in L1 is not detrimental to the learning of L2” (p. 1036). In addition, we found differential changes in various language and reading skills after the policy change, suggesting differences in the curricular emphasis between the bilingual education programs and the structured English immersion programs. Compared to their overall reading proficiency, the LEP students’ language skills seemed to have improved in the understanding of simple antonyms and synonyms but not in the interpretation of sentences containing less common meanings of polysemous words, especially when the less common and more common meanings differ in the part of speech (e.g., verb vs. noun). The LEP students also seemed to have improved on their ability to “understand a text,” but their reading skills seemed to have deteriorated when it came to nonfiction. These differential changes in language and reading skills suggest changes in instructional focus stemming from the policy change.
The findings could have implications for instructors of LEP students, researchers of the LEP students’ education, and policy makers. First, on the instructional front, it is interesting to notice that, compared to their overall reading proficiency, the LEP students improved on vocabulary knowledge of antonyms and synonyms but not on knowledge of polysemous words. One of the language skills that distinguish nonnative speakers from native speakers is that nonnative speakers may know the common (high-frequency) meanings of some words as well as do native speakers but have considerably more difficulty mastering the less commonly used (low-frequency) meanings of the same words. To really foster LEP students’ vocabulary development and to help them develop native-like English proficiency, instructors would need to give more emphasis to the less common meanings of polysemies.
On the broader level, what we found highlights the need for more evaluation of the English-only mandates. We examined only one state, one grade level, and one test, and studied only short-term effects. The effects of these policies may vary across states, subjects, and grade levels. For example, though not based on strong designs for causal inference, previous research found results similar to those found in the present study for the fourth-grade MCAS English Language Arts and Mathematics performance in the Boston public schools but different results for the eighth-grade and tenth-grade test performance (Tung et al., 2009; Uriarte et al., 2009). Another study lacking a strong design found that structured English immersion programs and bilingual programs achieved comparable results up to the third grade but showed differences in achievement over the longer term (Thomas & Collier, 1997). In contrast, both Branum-Martin, Mehta, and Francis’s (2011) and Slavin, Madden, Calderón, Chamberlain, and Hennessy’s (2011) multiyear studies revealed that differences, between bilingual and English immersion program participants, in both English and Spanish reading measures diminished over time. Therefore, it is important that additional studies, also with strong designs for causal inference, be conducted in other grades and subjects and in other systems that differ in population characteristics, instructional programs, and testing programs.
In principle, the presence of missing data poses a threat to the validity of the findings, but the sensitivity analysis presented above suggest that the threat is not a major one in this instance. The missing data issue poses a problem since it leads to uncertainty about the overall effect of the policy change. However, even the upper bound of the estimated impact (0.05 of a standard deviation), which we obtained by ignoring the disparity in the exclusion rate of the first-year LEP students between 2003 and 2006, is very small. Therefore, the missing data should not threaten the general finding that there has been no substantial impact.
Similarly, factors such as differences in the initial level of English language proficiency or the difficulty level of the reading test for the two cohorts might affect the test performance of the two cohorts. However, the difference-in-differences analysis approach should address such issues and return unbiased estimates nonetheless, as long as the LEP students in one cohort were not differentially more or less proficient than those in the other cohort, relative to their respective non-LEP peers, and as long as the 2003 test was not differentially harder or easier for the LEP students than was the 2006 test.
A more major threat to the validity of the findings concerning the changes in differential performance is that ancillary features of test items could distort interpretation of the DBF analysis results. That is, ancillary features (e.g., all items in a bundle happening to require the ability to interpret pictures complementing a text) might be the real reason for statistically significant DBF results, rather than the standard assessed, which is the basis for bundling the items for the DBF analysis. The risk to interpretation posed by ancillary item characteristics is exacerbated by the small number of items in some DBF bundles, sometimes as few as two items (in one case) or three items (in three cases).
It should also be noted that we estimated the impact of implementing Question 2 in Massachusetts, but we could not directly test the relative effectiveness of bilingual education and English-only instruction. This is because we do not know what actually happened in the classrooms: English-only instruction might take place before the implementation of Question 2 or native language instruction might happen after its implementation. However, neither seemed very likely, since under the pre-2002 Chapter 71A legislation, school districts were required to offer transitional bilingual programs to their LEP students and after the implementation of Question 2, teachers may be personally sued for native-language instruction.
Ultimately, this study constitutes an important step, but only one step, toward understanding the effect of bilingual education versus structured English immersion on LEP students’ academic performance. It points to a potentially fruitful area where more studies based on strong designs for causal inferences should be conducted.
Footnotes
Acknowledgements
The authors would like to thank Ms. Carrie Conaway at the Massachusetts Department of Elementary and Secondary Education for providing the data for this study. We would also like to thank Professors Richard Murnane and John Willett at Harvard University and the two anonymous reviewers for their helpful comments and suggestions. The authors are solely responsible for any remaining errors.
Declaration of Conflicting Interests
The authors declared no potential conflicts of interest with respect to the research, authorship, and/or publication of this article.
Funding
The authors received no financial support for the research, authorship, and/or publication of this article.