
Abstract
Educational accountability policy rests heavily on the assessments used to influence teaching, learning, and school improvement. A long-debated aspect of assessment use, consequential validity, plays an important role in public interpretation of assessment use whether for individual students or for state policy. The purpose of this survey study was to explore stakeholders’ perceptions of the variety of tests used in classrooms and schools, especially how testing is used to improve teaching and learning. Results indicated that the majority of stakeholders do not value state assessments and do not see the assessments as useful in the teaching and learning process. However, a proportion of minority respondents were optimistic that state assessments have potential for school improvement.
How do stakeholders of education understand education policy and the use of testing to improve educational outcomes for all students? In essence, this question is about test validity. Although psychometric properties rightly consume assessment recommendations for policy implementation, the high-stakes nature of these tests demands awareness of their social consequences (McNeil & Coppola, 2006; Messick, 2003). Validity is a concept that is applied to inferences rather than instruments (Camara & Brown, 1995; Cizek, Rosenbert, & Koons, 2008; Messick, 1989). That is, the empirical evidence surrounding the reliability and validity of a test cannot outweigh the claims and decisions that arise from interpretation of test results. Cizek et al. (2008) argued that perhaps the most contested area of test validity is “consequential validity” or the consequences applied as a result of testing (p. 398). Others point out that the consequences of educational accountability testing might be partitioned over various education systemic levels and parsed by units of analysis from students through districts and states (Lane, Parke, & Stone, 1998; Linn, 1998). Do stakeholders of education policy believe that tests, particularly state-standardized tests, are a proper instrument to rate schools and to both reward and sanction school performance?
For a matter of decades, testing has been a large part of educational policy as public school systems responded to pressure to provide evidence that taxpayer investment in schooling offered not merely personal educational and social benefits, but also economic advantages to the community (Adams & Kirst, 1999; Black & Wiliam, 2005; Cuban, 2004; Hamilton, 2003; Wiliam, 2000). A working knowledge of the means by which testing became the primary instrument for accountability policy is key to understanding the ways in which consequential validity has emerged as important to educational policy (Haertel & Herman, 2005; Hursh, 2005; Koretz, 2008). The political contexts of educational accountability policy across each U.S. state also reveal the evolving nature of testing as a policy instrument (Carnoy & Loeb, 2002; Elazar, 1994; Goertz, 2005; Goertz & Duffy, 2003; McDermott, 2003, 2007; McDonnell, 1994, 2005). Within the political dimensions of state-level education accountability policies and the ensuing federal policy known as No Child Left Behind (NCLB), consequential validity has arisen as critical to publicly legitimizing both assessment and accountability (Hamilton, 2003; Joint Study Group on Adequate Yearly Progress, 2002; Koretz, 2008). For the purposes of this report, the specific political culture of the state where the study is located is explained from its historical place in multiple eras that shape its current educational system.
Testing as an Accountability Policy Tool
Stretching from the late 1980s, public school accountability policies offer mandates leveraging a variety of school improvement mechanisms ranging from increased curriculum standards to higher requirements for teacher credentialing to changes in professional decision making and participative governance structures (Goertz, 2005; McDermott, 2007; Wong & Nicotera, 2004, 2007). Despite the variety of tools included in educational policies, the accountability mandate depends heavily on achievement test scores (Cuban, 2004; Hamilton, 2003; Hursh, 2005; Lindle, 2009; Lindle & Cibulka, 2006; McDonnell, 1994).
The process of designing and implementing achievement tests is complex and requires a level of expertise beyond the common public discourse about whether students learn anything in schools (Koretz, 2008; Lindle, 2009). The primary misperception about the power of tests centers on the notion of precision in testing (Koretz, 2008; Linn, 2005; Linn, Baker, & Betebenner, 2002; Popham, 2010; Stobert, 2008). Typically, the public overestimates the degree of precision in testing, thus overestimating the power of assessment as a tool of educational accountability (Amrein & Berliner, 2002; Koretz, 2008; Nichols, Glass, & Berliner, 2012). Arguably, the complexity and expertise required for assessment design may create a public illusion that precision ensues from expert investment in test development (Black & Wiliam, 2005; Popham, 2010). Public confidence in schools represents the fundament rationale behind accountability policy, but as enacted throughout the United States, the political history of such policies is imbued with the political dimensions of multiple state-based education systems.
State-Based and Federal Efforts Over Educational Accountability
Until the federal law, known as NCLB, enacted in 2001, the educational accountability policy movement had progressed state-by-state. The progression began in the 1970s as a series of legal challenges to finance systems and then more broadly conceived state-court cases challenging the implementation of clauses in state constitutions (Odden & Picus, 2008; Truitt, 2009). By the time that NCLB reached the level of debate in Congress, at least 33 states had already mandated some form of accountability using curriculum standards with corresponding assessments in addition to other levers of school reform (Carnoy & Loeb, 2002; Cobb, 2002, 2004; Goertz & Duffy, 2003). However, the amalgamation of more than two thirds of the states’ unique accountability systems into a set of federal guidelines for test-driven accountability did not go smoothly (Borja, 2007; Cech, 2007; Davis, 2005; Davis & Archer, 2005; Dobbs, 2005; Education Commission of the States [ECS], 2002, 2004; Jennings, 2003; Sack, 2005).
Each state offered a unique set of political constraints on the nature of educational policy and its citizens’ interpretations of the policy’s effects on their children’s school experiences (ECS, 2004; Goertz, 2005). The variation in the states’ systems led to many protests and obstacles to state implementation of the NCLB requirements (ECS, 2002, 2004). Few of these obstacles were viewed as regional concerns at the time, but a concept known as policy transfer may have some implications for regional adoption of educational policy initiatives (McDermott, 2003).
The South as an Example of Regional Policy Transfer
Policy transfer focuses on the likelihood that a particular policy or some of its features may be adopted by another jurisdiction (Boehmke, 2011; Dolowitz & Marsh, 2012; Marsh & Sharman, 2009; McDermott, 2003). The presumption in the United States has been that such processes are likely among states and the geographic regions in which they are located (Mooney, 2001; Soule & Earl, 2001; Tucker, Stoutenborough, & Beverlin, 2012). In the case of educational accountability policy research, at least two studies point to the region of the U.S. South as an example of educational policy transfer.
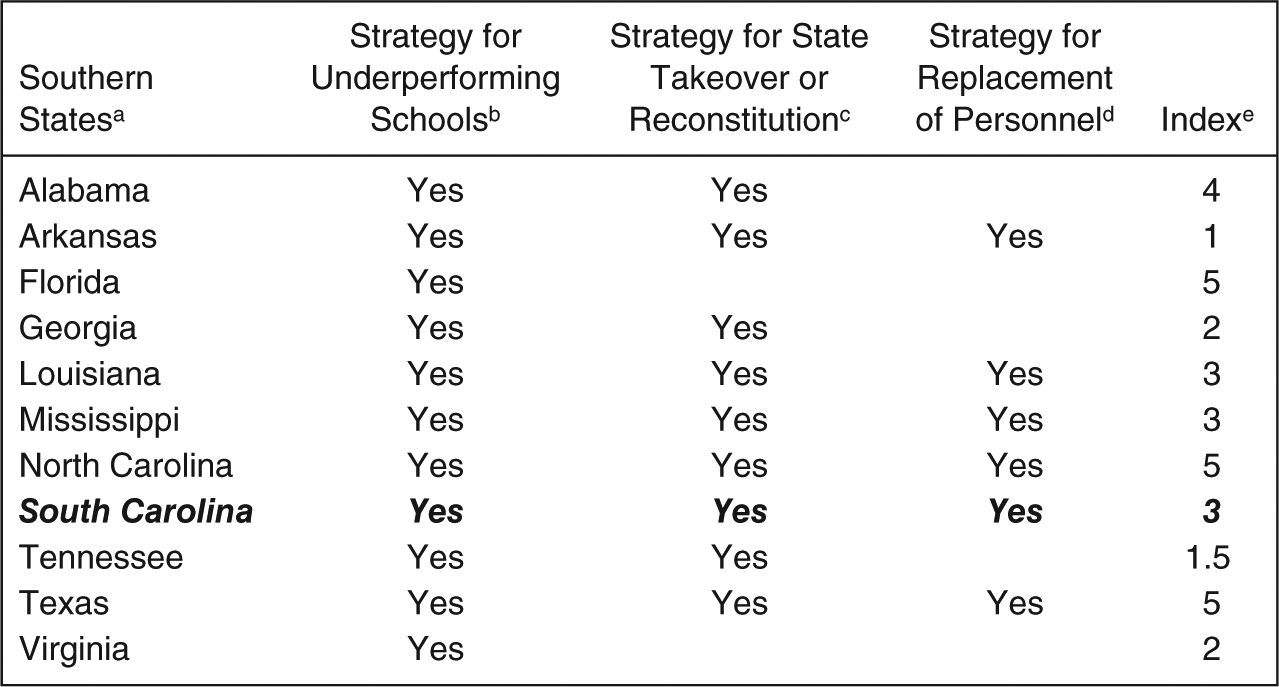
The term, the South, traditionally refers to 11 states in the Southeastern United States, known for their late-19th-century secession from the United States during the Civil War (Jenkins, 1999). A study by McDermott on pre-NCLB state policy features remarked on similar strategies for accountability requirements in this region. This study identified state-level consequences for underperforming schools, and looked at the variation in the higher stakes strategies among all states. McDermott (2003) noted that as an indicator of party affiliation and political culture the Southern states tended to be more similar in adopting high-stakes policy strategies for low-performing schools.
Another study looked at the strength of states’ pre-NCLB accountability policies and assigned each an index on a 5-point scale (Carnoy & Loeb, 2002). This research focused on whether the relative strength of accountability strategies in each state had an effect on that state’s student performance on the National Assessment of Educational Progress (NAEP). It should be noted that Carnoy and Loeb used six features of each state’s accountability policies in developing their index. They had only one feature noted as “strength of repercussion for schools 1999-2000” (p. 324) as opposed to the three measures described as high stakes by McDermott (2003). Also, Carnoy and Loeb’s study did not delve into regional differences in accountability policy potency, but their index is useful to explore possible regional features. On that index, the traditional South averaged an index of 3.1 (median = 3.0, range = 1-5) compared with an overall average index of 2.12 (median = 1.5, range = 0-5) among all states.
Table 1 illustrates how the specific strategies of the Southern region from McDermott study compare with the index assigned in the Carnoy and Loeb study.
Southern States’ Accountability Policies Strength.
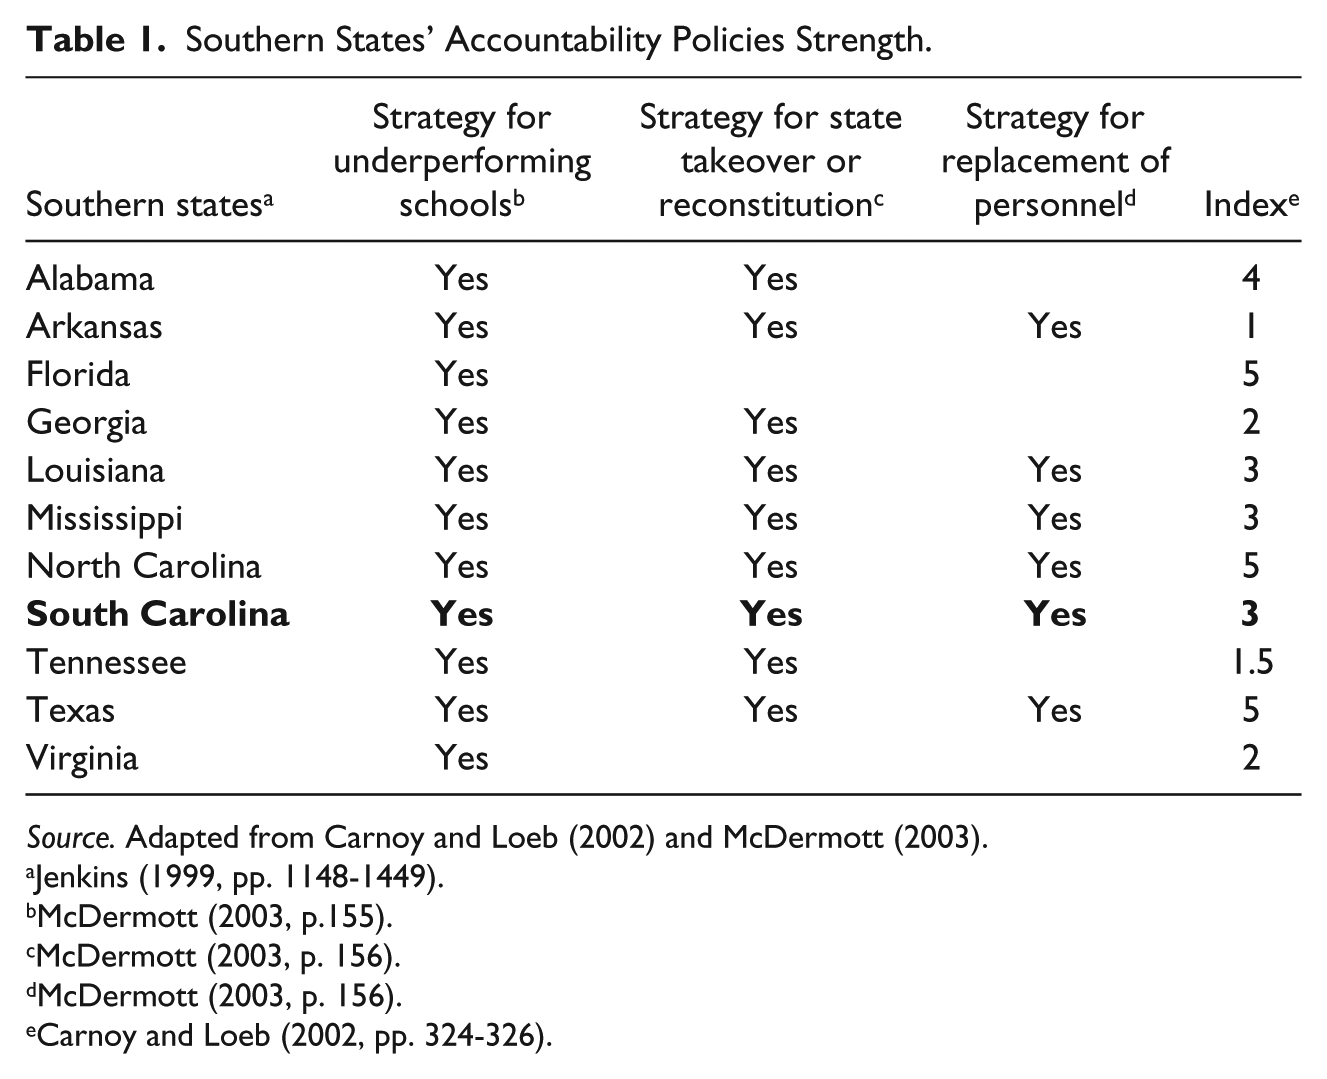
Source. Adapted from Carnoy and Loeb (2002) and McDermott (2003).
Jenkins (1999, pp. 1148-1449).
McDermott (2003, p.155).
McDermott (2003, p. 156).
McDermott (2003, p. 156).
Carnoy and Loeb (2002, pp. 324-326).
Some differences appeared in the analyses in each study. Using two of the states helps illustrate the contrasts in the figure. For example, one of the starkest contrasts involves the differences in McDermott’s analysis of Florida’s high-stakes provisions, indicating only one strong strategy; yet, Carnoy and Loeb assigned a 5, the highest in their scale and designated Florida’s repercussions for 1999-2000 as “strong” (p. 324). In contrast, South Carolina received a “moderate” designation for its repercussions provisions in the Carnoy and Loeb index, primarily because at the time, the sanctions extended to the district, not schools. McDermott’s indication of the three high-stakes strategies used by South Carolina did not differentiate between district-level sanctions or school-level sanctions. The differences in these approaches to examining consequences embedded in accountability strategies offers insight into the degree to which policy analysts may capture elements of state-by-state political culture and simultaneously, add to the complexity of understanding the similarities or differences. State-level political culture may be best captured in the individual histories of the individual state’s history of settlement, ethnic and racial interactions, and traditions (Elazar, 1994).
South Carolina’s Political Culture and Accountability Policy
Excluding two 17th-century colonial charters, South Carolina has had six constitutions. The post-reconstruction 1895 Constitution disenfranchised Black voters, centralized state control over local governments, gave (White) women property rights, created another county, and instituted a separate school system for each race (Edgar, 1998). The dominant attitude dating from colonial days, which plantation culture reinforced, was that public schooling existed primarily for the lower classes. This attitude stemmed from the assumption that private benefits from education go to the most deserving, thus the best education was reserved for those who could afford it (Cook, 2004; Fischel, 2006; Graham, 1996; Labaree, 1997; Tyack & James, 1986). Such a perspective about the minimal quality necessary for public schooling persists across nearly four centuries of South Carolina’s political and cultural history.
Although South Carolina was home to one of the initial cases that the National Association for the Advancement of Colored People (NAACP) strategically bundled with Brown, the state’s White political elite tried to stave off desegregation through a number of legislative maneuvers (Edgar, 1998; Grose, 2006; Williams, 2007). In 1952, the legislature removed the constitutional requirement for state provision of public schools (Edgar, 1998; Williams, 2007). Attempts to revive compulsory education in South Carolina were defeated through 1967 when a bill finally passed the legislature (Edgar, 1998). Compliance with court-ordered unitary education was achieved by the fall of 1970, which currently remains as a lesser achievement than integration (Cook, 2004).
South Carolina’s Constitution was amended in 1972 to include a modest 264 words for Article XI, Public Education. The four sections established a state board of education, provided for the election of the state superintendent of education, prohibited public monies for religious and private education, and offered the following statement about the legislature’s responsibilities regarding public schooling:
As with other states’ constitutional language during the last two decades of the 20th century, South Carolina’s was challenged in state courts due to questions of equity and adequacy of funding (Dishman & Redish, 2010; Truitt, 2009). The state successfully argued in one case, but then lost this point in another, that such constitutional language “contained no judicially ‘quantifiable’ component” (Dishman & Redish, 2010, p. 27). Eventually, the Court ruled, “We hold today that the South Carolina Constitution’s education clause requires the General Assembly to provide the opportunity for each child to receive a minimally adequate education” (Abbeville, 540). The phrase, minimally adequate, generated reactions among supporters of public education, who called for a constitutional amendment to remove the offending phrase, even though the language is not found in the South Carolina Constitution (Hawthorne, 2005).
South Carolina’s most recent efforts for educational improvement date to 1998, when the General Assembly passed the Educational Accountability Act (EAA; SC Code of Laws Title 59-Chapter 18). Unfortunately, the timing of implementation of the state assessment program coincided with the passage and implementation of the federal NCLB Act of 2001. The 1998 South Carolina EAA created a new legislative agency, the Education Oversight Committee (EOC), which is charged with designing the accountability requirements of the law (SC Code of Laws Title 59-Chapter 6-Part10, 2009). The South Carolina Department of Education was mandated by EAA to not only design state tests but also design, implement, and report all NCLB achievements. These federal and state requirements entangle two agencies from different state government branches in the interpretation of state and federal education policies to meet their missions.
During 2007 and 2008, other analyses of South Carolina’s assessment and accountability policies began to surface (Chudowsky & Chudowsky, 2008; Cronin, Dahlin, Adkins, & Kingsbury, 2007; United States Department of Education, 2007). All of these reports noted that South Carolina’s policies exacted high standards, which unlike other states matched the National Assessment for Educational Progress (NAEP) requisites. However, for the purposes of meeting the Adequate Yearly Progress (AYP) for NCLB and the looming 2014 deadline for proficiency, other states had set lower targets for their students (Chudowsky & Chudowsky, 2008; Cronin et al., 2007). These reports produced two political reactions in South Carolina. First, teachers and others increased their objections to the state assessments on the grounds that South Carolina’s standards were unfairly high as compared with other states’ standards, and they demanded changes to the state assessment program. Second, and much more slowly, recognition began to dawn that South Carolina had little to no implementation studies to indicate the degree to which its well-evaluated policies had been adopted and used in schools and school districts.
As a result of the political dissatisfaction with South Carolina’s assessment system in 2007, the winning candidate for state superintendent included scrapping the old tests as a significant plank in his platform (South Carolina Department of Education, 2007). This plank satisfied both teachers, who found the assessments uninterpretable for instruction, and parents, who found the combined federal and state school report cards confusing (Wenger, 2008).
Stakeholder Understanding of State Education Policy
For decades, policy scholars have acknowledged policy implementation as an interpretive act (Lipsky, 1979; Majone & Wildavsky, 1979). Researchers and practitioners commonly dispute the traditional idea of a linear policy development that moves from problem definition to policy formulation and implementation by recognizing the importance of the reinterpretation of the rules and regulations by administrators and clients (Ball, 1994; Cohen, Moffitt, & Goldin, 2007; Yanow, 1996). In the field of education, authors such as Fullan (2001, 2008) have addressed the importance of understanding and responding to teacher’s interpretations of education policy. An interpretive approach to the study of policy implementation posits that public policies can be treated “in the same manner as belief systems, that is, as sets of value priorities and causal assumptions about how to realize them” (Sabatier & Jenkins-Smith, 1993, p. 131).
The study of policy implementation from an interpretive perspective emphasizes context-specific meaning making. In recognition of this, Yanow (1996) argued for an approach to policy analysis that focuses on the “meaning of policies, on the values, feelings, and/or beliefs which they express, and on the processes by which those meanings are communicated to and ‘read’ by various audiences” (pp. 8-9). Each context is unique and may include artifacts, such as academic standards, student scores, and school uniforms. These artifacts are understood as potential carriers of meaning, open to unique readings by legislators, administrators, reformers, and concerned stakeholders. Policy interpretation is an iterative process wherein actors interpret policy and find meaning. Based on this meaning, policies are altered and new meanings are found. Often, these new meanings are then infused into ongoing policy discussions.
Approaching policy analysis in this way encourages us to recognize the multiple arenas in which people make meaning of policy. Ball (1994) argued that if we are going to understand policy, we must understand the politics of agenda setting and policy text production but also the contexts of practice and outcomes. In each of these contexts there are “number of areas of action—some private and some public. Each context involves struggles and compromise and ad hocery. They are loosely coupled and there is not one simple direction of flow of information between them” (Ball, 1994, p. 26). Each of these contexts can occur simultaneously or they can be separated by expanses of time. They can be disjointed and separated culturally and geographically and yet still be interpenetrated by common discourses and practices.
Recognition of this complexity asks us to reconsider the difficulties of achieving implementation fidelity. To reach the intended outcomes of a policy one cannot rely on the creation of less ambiguous policy language. Instead a policy analyst must also recognize that “not only is language inherently multi-vocal—capable of carrying multiple meanings—but clients’ and others’ interpretations cannot be predetermined or controlled” (Yanow, 1996, p. 26). As Hall and Hord (2011) noted in their work on school change, some teachers’ (individual or group) interpretations of change require analysis, but not necessarily, administrative responses. Like shared vision in schools, the dialogue about the use of testing to improve performance must be iterative and ongoing to give voice to all stakeholders.
This insight is especially important for standards-based accountability policy that purports to provide information from which the population can make decisions about the quality of the schools. Over the past 50 years, school accountability policy evolved from state-defined audit systems and minimum competency requirements to the standards-based policy in which states established uniform content and performance standards for all students (Goertz, 2001). Proponents argue that the standards movement would require more intellectually demanding content and pedagogy for all students and challenged deeply rooted beliefs about who can do intellectually demanding work (Spillane, 1999). Accountability systems in most states are based on the premise that “schools and school systems should be held accountable for their contribution to student learning” (Elmore & Fuhrman, 2001, p. 4). Integral to this process is the public display of a measurement of that contribution that can signal the quality of the schools’ work, which requires a steep investment in developing sophisticated, yet interpretable, measures of student learning (Lindle & Cibulka, 2006). In theory, these signals of school quality are supposed to be easily understood and encourage public engagement in school improvement (Pierson, 2000).
Critics of standards-based accountability systems abound. They contend that standards and state systems of accountability have created a situation wherein teachers teach to the test rather than challenge students to reach their potential. A growing body of research offers evidence that students from underrepresented populations are taught by less qualified teachers and attend deteriorating schools that are characterized by racial and socioeconomic isolation (Darling-Hammond, 1997). In such contexts, testing may actually work to the disadvantage of minority groups (Amrein & Berliner, 2002; Berliner, 2005; Nichols & Berliner, 2005; Nichols et al., 2012; Pearson & Garcia, 1994), rendering current accountability systems ineffective because the testing system is not strategically linked to content standards (Finn & Kanstoroom, 2001). Intergenerational poverty and the accompanying lack of social or political capital have led many to profess that the problems caused by these circumstances cannot be solved by schools alone (Berliner, 2005; Jordan & Cooper, 2003; Levin & Kelley, 1994). A growing body of literature suggests that schools fail to change and subsequently fail to achieve the goals of social justice espoused by standards-based reform. These dual failures by schools have disillusioned those populations for whom the policy was designed to help most (Fennimore, 2005; Howard, 2003). Nichols et al. (2012) state that although the literature base is growing with regard to the unintended consequences of high-stakes testing, existing research on the relationship between high-stakes testing and its intended impact is mixed and inconclusive.
Interspersed in this dialogue involving proponents and critics of the accountability systems are such questions of how to use data to drive school improvement as (a) what content should be taught, (b) by whom, (c) how, and finally (d) what are the appropriate consequences and to whom should they be applied (Elmore, Abelmann, & Fuhrman, 1996)? State legislatures and designated agencies face questions about policy approaches to three design elements: (a) Who is held accountable? (b) For what are they held accountable? and (c) What consequences are attached to the accountability system? (Goertz, 2001). Rogers (2004) argued that public participation in holding the schools accountable entails
(a) learning about the conditions students experience in school; (b) contributing information about these conditions based on observations or the experience of local children; and (c) encouraging the system to use this information to respond to presenting and potential problems. (p. 2171)
Thus, these accountability policy decision points generate competing interpretations and positions among the multiple stakeholders of public schooling.
If we are going to fully understand the implementation and outcomes of accountability policy we must attempt to understand the ways in which various publics/parents make meaning out of students’ experiences and the conditions of schooling. Specifically, we need to understand ways in which the consumers of public information on schools in their unique contexts read these public texts reporting students and school performance and in turn re-embody accountability policy with multiple meanings. In short, stakeholder inferences about tests affix to the consequential validity of both the tests and the policy.
Consequential Validity and Political Polls
Currently, all measures of learning remain proxies, not direct measures (McNeil & Coppola, 2006; Wiliam, 2000). Educational assessment experts have long recognized that different types of assessments offer differing estimates of student performance (Heck, 2006; Karantonis & Sireci, 2006; Thorndike, 1971). However, in public rhetoric, testing and accountability policy are linked in such a way to make the words assessment and accountability nearly synonymous (Lindle, 2009). Hence, given that assessment is so entangled with high-stakes educational policy, it is important to explore the concept consequential validity as it relates to the development of educational policy in the United States.
Consequential validity’s importance to test development remains a hotly debated, but little utilized concept in test construction (Cizek et al., 2008; Crocker, 2006; Lees-Haley, 1996). Historically, psychometricians judge test validity with regard to an assessment’s potential to consistently, fairly, and authentically sample behaviors as well as cognitive processes. (Camara & Brown, 1995; Koretz, 2008; Messick, 1989; Wiliam, 2000). Apart from convergent statistical evidence regarding validity, the interpretation and use of a test are also a form of validity: consequential validity. As Kane (2001) explained, “Consequences, or outcomes, are the bottom line in evaluating decision procedures, which are always designed to achieve some desired outcomes.” In other words, when tests are used in decision-making processes the validity of the test is tied to its use and the real consequences it has for people.
Messick (1989) defined two dimensions of consequential validity. The first dimension suggests test score labels should be accurate descriptions of the skills and knowledge assessed. For example, calling an instrument an Intelligence Quotient (IQ), despite widespread acknowledgment that intelligence is a multi-faceted, multi-modal phenomenon could lead to the consequence of a public inference that intelligence is one-dimensional.
The second component “of the consequential basis of validity [is] the appraisal of both potential and actual consequences of applying the test” (Reckase, 1998, p. 14). To address this dimension is to investigate how the public, institutions, and governments interpret and use the test results in their decision-making processes. If a test is being improperly used and if the test lacks precision in measuring the intended dimension, then it can have unintended, negative, or no consequence (Green, 1998). To return to our example, if an IQ test is used to sort and select students into differentiated opportunities a couple of consequences may occur. The first result may be the unintended and negative outcome of deselecting perfectly capable people. An additional consequence may be the actual devaluing of the validity of the IQ test as people realize of its imprecision in predicting individual capacity.
In the past two decades, the use and interpretation of educational assessments pose more and more high stakes over longer terms for students, teachers, schools, and communities (Lane et al., 1998; Linn, 2000). Students take teacher-made, or at least, teacher-administered textbook tests as much as weekly in most classrooms. As accountability stakes have risen, schools and districts also have implemented periodic testing at least once or more a semester or school year (Firestone & González, 2007). Typically, states take accountability measures of student achievement once a year. Thus, students face a battery of tests that are interpreted at different levels of the public system: classroom, school, district, and state. Consequences may be assigned at each of these levels as well (Linn, 1998).
Therefore, the assessments required by accountability policy have real consequences for students, schools, and families as defined by federal and state statutes. Arguably, especially under the influence of NCLB, state assessments undergo more stringent vetting for reliability and validity than other tests that students face in their classrooms, whether obtained from textbooks or teacher-made.
Political Polling
The purpose of this study was to ascertain public understanding of the consequential validity of the assessments used in a state’s accountability policy. When evaluating statewide accountability systems and their paired assessments, it is imperative to obtain information directly from persons who might provide a basis to create a representative sample of the general public’s understandings. Since the 1930s, political scientists and policy makers regularly use the survey or poll to gauge the public’s perceptions and opinions on multiple issues (Manheim, Rich, Willnat, & Brians, 2008).
The object of political polling is public opinion. Entman and Herbst (2001) described four ways people conceptualize public opinion: mass opinion, activated public opinion, latent public opinion, and perceived majorities. Mass opinion is the aggregation “of individual preferences as tabulated through opinion polls, referenda, or elections. It is simply the ‘will of all’” (p. 206). Mass opinion can be problematic because it is not necessarily “informed opinion” (p. 207). In contrast, activated public opinions are the opinions of “engaged, informed and organized citizens” especially with regard to specific policies and issues (p. 207). A third category of public opinion is latent public opinion. This can be defined as “the fundamental public preferences that underlie more fleeting and superficial opinions [or] the dynamics of public opinion beneath the discursive chaos” (p. 208). Perceived majorities is fourth and the most slippery of the categories of political opinion. Perceived majority is the belief held by “most observers, including journalists, politicians” about where the majority of people stand on an issue (p. 209). These perceptions often are repeated in the public discourse but do not necessarily reflect the results of mass opinion polls or elections.
Political actors tend to change their positions when polls show a lumping of opinions that may represent the general “mood” of a polity (Druckman & Jacobs, 2006, p. 455), however, when it comes to policy or governance details, they pay closest attention to activist public opinion (Entman & Herbst, 2001). When all four forms of public opinion seem to converge the result can be rapid policy change (Kingdon, 2003).
For the purposes of this study, stakeholders’ perceptions of the variety of tests students experience offered potential insights into those stakeholders’ expectations for accountability policy. The stakeholders’ perceptions offer a form of consequential validity for the state’s assessments and its educational policy. The questions were developed within public vernacular of tests in schools from the classroom to the state level and beyond to commercially available tests for college admissions.
Method
The study was a part of a project designed to fulfill statutory requirements for public engagement of stakeholder populations defined as, “but not limited to, parents, business and industry persons, community leaders, and educators” (South Carolina Code of Laws, Title 59-18-900 (B), Title 59-18-910). The larger project proceeded in three phases: (a) survey development, (b) survey administration, and (c) survey analysis and interpretation. Two kinds of surveys provided the data collection vehicles: phone interviews and web surveys. Focus groups served to validate the surveys at the development and analysis phases.
One of the most common polling subjects focuses on public opinions of schools and schooling (Bushaw & Gallup, 2008; Rose, 2006). Yet, methods for ensuring public engagement over critical policy topics go beyond large-scale surveys (Calabrese Barton, Drake, Gustavo Perez, St. Louis, & George, 2004; Rahn, Kroeger, & Kite, 1996; Rowe & Frewer, 2005). Focus groups, which developed from marketing strategies, also offer insights into political preferences as well as perspectives on social issues (Krueger & Casey, 2000). The purpose of focus groups is to generate lively discussions among participants, which has the main caveat of producing transcripts with difficult-to-interpret overlapping commentary (Kvale & Brinkman, 2009). Thus, the two methods used in this study were surveys and focus groups.
Survey Development
Under the provisions of Act 282 of 2008, the EOC formed a National Advisory Council (NAC) to address its multiple responsibilities. For the purposes of this project, the NAC was consulted concerning item development for the phone and web surveys. The NAC responded to an item pool developed from several national polls of public awareness and concerns regarding public schools. The NAC suggested wording for additional items and promoted strategies for engaging typically difficult to reach stakeholders, especially parents of color, in rural areas, and in poverty. NAC members were interested in gathering opinions of community leaders in religious and minority sectors also. The NAC also expressed concern about engaging South Carolina’s increasing retiree population due to their role as taxpayers, typically without school-aged students in schools.
Simultaneous testing of the item pool included pilot focus groups and pilot phone interviews. Four focus groups included stakeholders named in the relevant statutes and divided as groups of parents, educators, business leaders, and community leaders/retiree taxpayers. Focus groups were held in various public locations including a municipal building, a public library, a school, and a community education campus. Potential participants were randomly selected from phone and mailing lists provided by EOC, business listings on the web and some participation was obtained through nominations. A total of 34 educators, parents, community leaders/retiree taxpayers, and business leaders participated in the fall focus groups, and the results were used to reduce the item pool as well as validate pilot phone interview findings.
Data and Procedures
By far, the largest set of data generated in the larger study came from the web surveys which had more than 5,400 respondents. It is important to note that while the web-based surveys included more than 5,400 respondents; these results were highly influenced by the response rate of educators who accounted for approximately 3,900 of the completed surveys. As such, the data are presented in the aggregate and then disaggregated by role, educator or non-educator. Educator participation was not limited to classroom teachers. It also included teaching assistants, building-level administrators, and central district office administrators. These data were used to form the conclusions reported in this article. Responses were in the form of a 6-point Likert-type scale (critical, very important, important, not very important, not at all important, don’t know). Survey responses were analyzed with frequencies and cross-tabulations using IBM SPSS Statistics, 21.0. Data are reported by stakeholder group, educator, or non-educator, and by demographic classification of respondents: ethnicity, rural versus non-rural, and poverty rate of the community. Primarily, the study made use of demographic statistics to describe participant responses, but also made use of chi-square, a non-parametric technique to discern differences in group responses.
Because researchers were interested in stakeholder perception of consequential validity of testing, we focused on three sets of questions asked on the survey: (a) What are the indicators of a good school?; (b) How would you rate the schools in South Carolina? and (c) What are your thoughts on the role of testing in schools? These questions were consistent with those posed by Rogers (2004). With regard to testing, study participants were asked to respond to three types of testing: (a) ongoing subject-based classroom tests, (b) state criterion referenced tests, and (c) college admissions tests. Study participants were asked about the stress caused by each of these tests, the likelihood that these tests help students learn, the likelihood that these tests promote better student achievement, and if these tests help principals evaluate teaching.
Results
Results of the first two sets of questions (indicators and ratings of schools) appear in Table 2. Survey participants were asked to respond with the degree to which they agreed to statements on indicators of good schools. Table 2 details the percentage of survey respondents who rated the importance of the four measures of school success as either critical or very important. Overwhelmingly, all stakeholders to public education viewed high school graduation (80%) and the availability of rigorous coursework (72%) as indicators of good schools. When confronted with two measures of testing, survey respondents showed less enthusiasm. Fifty-seven percent of survey respondents rated college admissions tests as a measure of a good school. Less than one quarter of survey respondents rated state-standardized tests as a measure of a good school (21%). When disaggregated by stakeholder group, educator, or non-educator, a similar pattern of responses occurs with high school graduation rate being most important followed by the availability of rigorous coursework. However, non-educators show a stronger preference for testing as a measure of school success. Sixty-two percent of non-educators rated college admission tests as an important measure of a good school as compared with 56% of educators. More significantly, 28% of non-educators believed that standardized testing was an important measure of a good school as compared with 20% of educators who held the same view.
Indicators of a Good School and Public Rating of Public Schools in South Carolina.
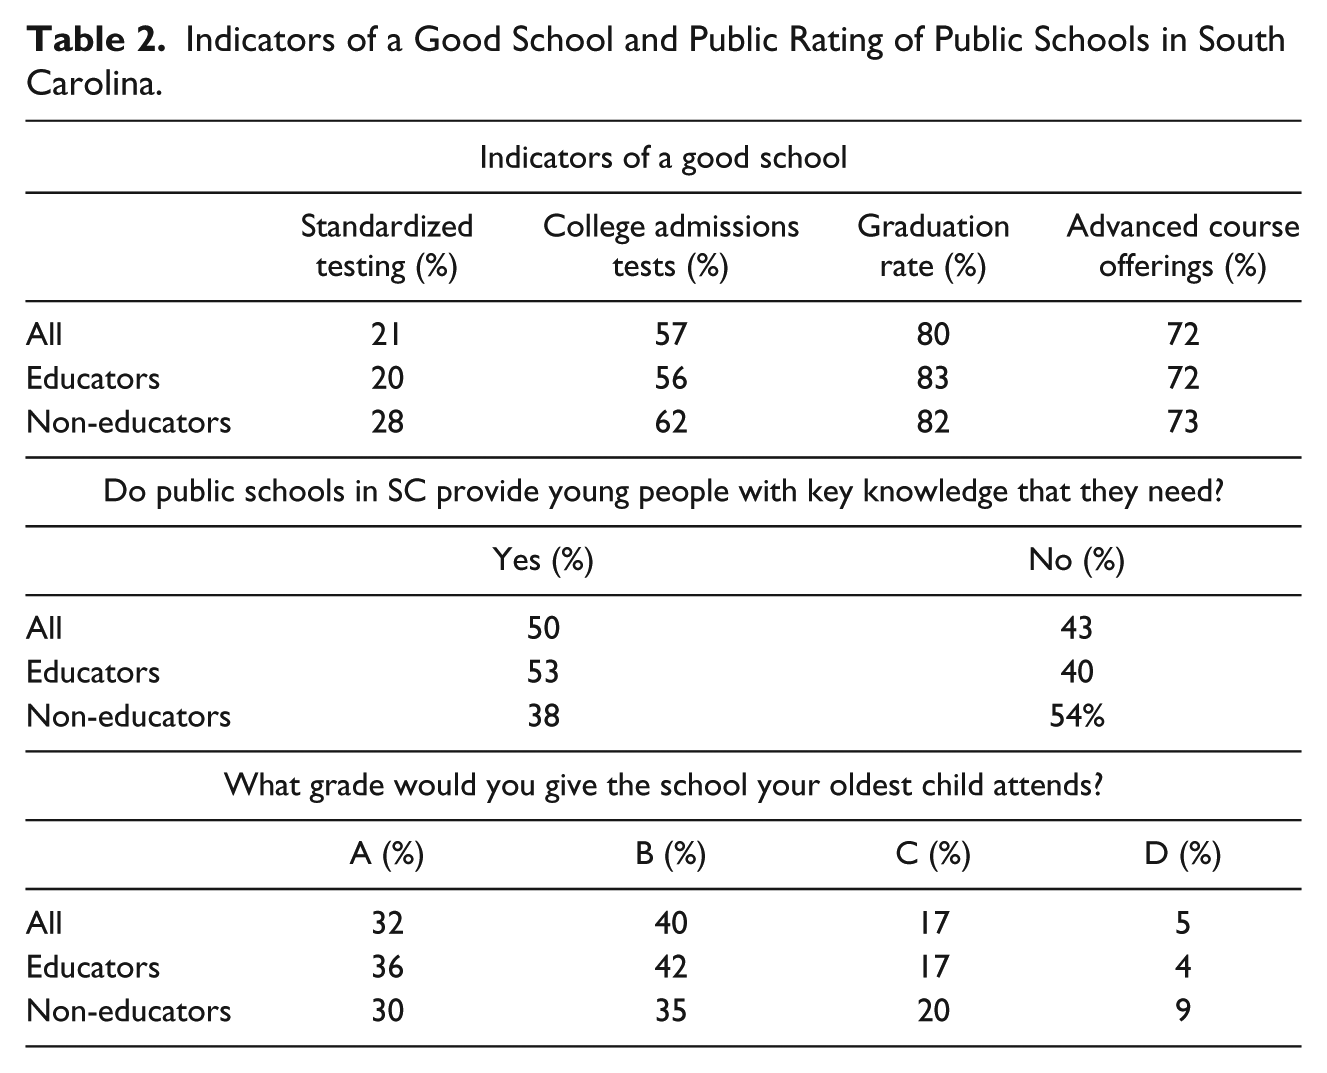
When questioned about the quality of the schools attended by the children of South Carolina, survey respondents indicated minimal levels of satisfaction. Merely 50% of survey respondents indicated that the public schools of South Carolina were providing young people with the necessary skills to succeed in life. South Carolina has a standardized curriculum which supposedly represents what children should know and be able to do. Again, when disaggregating these responses by stakeholder group, we found large differences in public perceptions of public education. While 53% of educators felt that the public schools of South Carolina were providing children with key knowledge, merely 38% of non-educators had the same opinion. In fact, 54% of non-educators believed that public schools in the state were not providing the key knowledge and skills that would be necessary to succeed.
An interesting phenomenon in this study was that like national surveys grading schools, respondents in this survey rated local schools with a higher grade. In grading the public schools, a majority of survey respondents stated that they would rate the schools that their oldest child attends with the grade of B. However, unlike national surveys, respondents in this study gave a lower grade to the state schools than to schools across the nation which calls in to question the tests used to rate schools in South Carolina as well as the means by which student progress is reported. Similar to previous questions, there is a similar pattern in the responses of educators and non-educators; both stakeholder groups gave local schools a higher grade. However, when the data are disaggregated, non-educators gave lower grades to local schools than did educators. Only 30% of non-educators rated their local schools with an A as compared with 36% of educators who rated their respective local schools with an A. The comparison is more striking when examining the assignment of grades at the bottom end of the spectrum. Nine percent of non-educators assigned a grade of D to their local schools as compared with 4% of educators who assigned a grade of D to their local schools.
For the questions about role of testing, the use of cross-tabulations allowed researchers to discern more detail in to how stakeholders viewed the components of a successful school and how stakeholders rated schools across the state. Data from the survey were categorized by demographics: ethnicity, gender, location, and community wealth. A chi-square was used to discern differences in group responses based on all four demographics. Table 4 illustrates significant differences between groups in responses. According to these data, significant differences were found to occur in participant responses on how one would indicate a successful school. Primarily, these differences were found to exist based on ethnicity (White or non-White). Non-White survey respondents rated both forms of testing (state-standardized tests and college admissions tests) much more favorably than White respondents. The percentage of non-White respondents who classified standardized tests as critical or very important (34.6%) was nearly double the rate at which White respondents classified the importance of standardized testing (19.5%). Non-White survey participants also view college admission tests differently from their White counterparts although the difference in their view of this test was not as pronounced as the difference in the view of the importance of standardized testing. In all, 64.4% of non-White respondents rated a college admissions test as a critically important or very important measure of a good school as opposed to 56.3% of White respondents who saw the test as a critically important or very important measure of a good school.
When examining whether schools are providing children with key knowledge or grading schools, significantly different responses were found to exist based on respondent location or wealth of the community. In response to the question, are the schools in South Carolina providing children with the knowledge that they need to succeed, a majority of survey respondents responded in the affirmative. There was great consistency in the response to this question with most groups registering more than 52%. However, two subgroups deviated from the pattern. Only 46.7% of respondents agreed with the statement in communities with between 6% and 10% of the population living below the poverty line. Strikingly, merely 40.4% of survey respondents living in communities where more than 25% of the population live below the poverty line agreed that schools in South Carolina were providing children with the skills that they would need to be successful in life.
The pattern of dissatisfaction with the public schools among individuals from underrepresented populations continues when grading schools. Significant differences in participant responses were found to exist based on location and poverty level. Survey respondents living in non-rural areas and in areas of relative wealth consistently rated their schools higher than respondents living in rural areas or in areas of less wealth. Merely 23.5% of respondents living in a rural area graded the school that their oldest child attends with an A as compared with 32.4% of respondents living in non-rural areas. Similarly, 44.6% of respondents living in areas where less than 5% of the populations are classified below the poverty level graded the schools that their oldest child attends with an A. No other subgroup approached that level of support with grades decreasing as the percentage of the population living in poverty increased. The downward trend ends with schools where more than 25% of the population is classified as living below the poverty line. It is interesting to note that members of underrepresented populations (ethnic minorities, individuals living in rural areas, and individuals living in poverty) have expressed greater support for the importance of testing as a measure to discern school success and those same groups have expressed concern that the schools in their communities are not properly preparing their children for success nor are they grading their schools as highly as White respondents and those living in relatively wealthier areas.
Respondent views on the use of different tests to drive school improvement are reported in Table 3. Responses to these questions were in the form of a 4-point Likert-type scale (strongly agree, agree, disagree, strongly disagree). Totals reported in Table 3 represent the percentage of respondents who answered strongly agree or agree. Because the response rate to the survey was so strongly influenced by educators, the data are reported in the aggregate and then disaggregated by stakeholder group, educator, or non-educator. In the aggregate, we found the highest level of support for ongoing classroom assessments. These tests were believed to cause the least amount of unnecessary stress (40%), to most help students learn (56%), to promote better school achievement (57%), and to be the most helpful in evaluating teachers (32%). In terms of consequential validity, ongoing classroom assessment was seen as the form of assessment to best judge the quality of both instruction and student performance. The least-valued form of assessment was state-standardized testing. Contrasting the views of ongoing classroom assessment, 70% of respondents stated that state testing was the cause of unnecessary stress. Furthermore, merely 19% of respondents believed that state testing helps students learn. Thirty percent of survey participants believed that state tests promote better school achievement, while 28% agreed that state tests are useful in evaluating teaching.
Survey Respondent Perception of Different Tests and Use of Tests to Improve Schools.
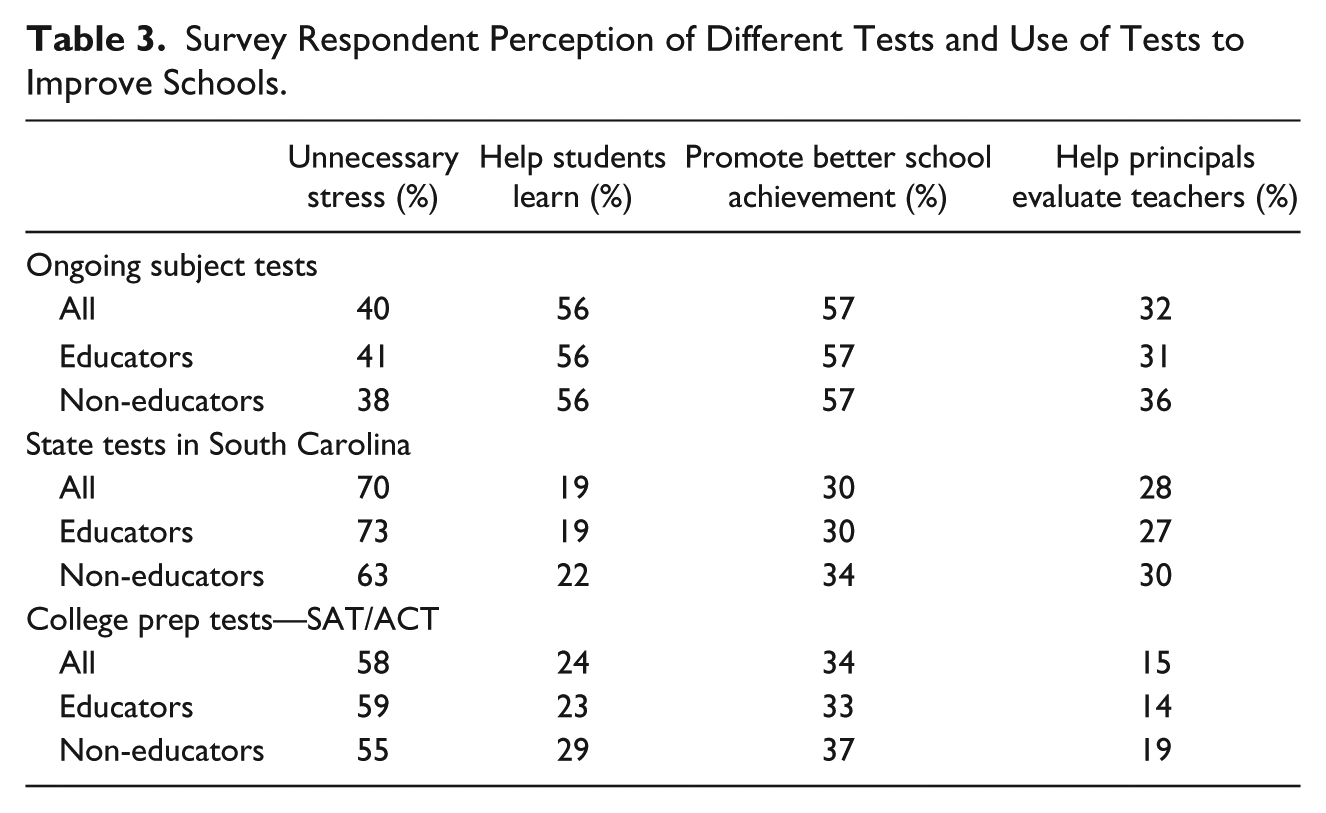
When the data are disaggregated by stakeholder groups, educator, or non-educator, we found a similar pattern. The highest level of support was found for ongoing subject tests; there was little difference between the responses of educators and non-educators in whether these tests assisted in helping all children learn or promoting achievement. We found small differences in the responses for other tests. Specifically, in the area of state tests, non-educators reported a much lower level of stress associated with state testing than did educators. Similarly, a slightly higher percentage of non-educators (22%) felt that state tests helped all students learn as compared with 19% of educators. Furthermore, 34% of non-educators believed that state testing promotes better student achievement as compared with 30% of educators. Non-educators appear to express greater support for testing and accountability systems at the state level than do educators.
Again, the details of the data are found in an examination of cross-tabulations in Table 4. Using a chi-square analysis, we examined differences in response rates among the different demographic groups represented in the survey. For the purposes of this analysis, we focused on the differences among responses of ethnic minorities and population wealth. Regardless of student testing types, significant differences were found to exist between White and non-White respondents on all four questions (the test creates unnecessary stress, the test helps students learn, the test promotes better school achievement, the test helps principals evaluate teachers). White respondents expressed the viewpoint that state-standardized tests create more unnecessary stress than their non-White counterparts. This result suggests that minorities see greater value in the use of standardized testing as an important component of the schooling process. That is, non-White survey respondents may see testing as an important tool in the school improvement process. They expressed a stronger belief that all forms of testing are important to help students learn, to promote better school achievement, and to evaluate teachers. Greater differences between White and non-White survey perceptions appeared in the item about the use of state-standardized tests as a tool to help students learn and to promote better school achievement. Nearly twice the number of non-White respondents (33.1%) expressed agreement in the importance of state-standardized tests as a tool to help students learn as compared with White respondents (17%). Furthermore, approximately 10% more non-White respondents saw the state tests as a tool to promote better school achievement when compared with White respondents.
Demographic Cross-Tabulations Highlighting Significant Differences in Survey Respondent Response Patterns.
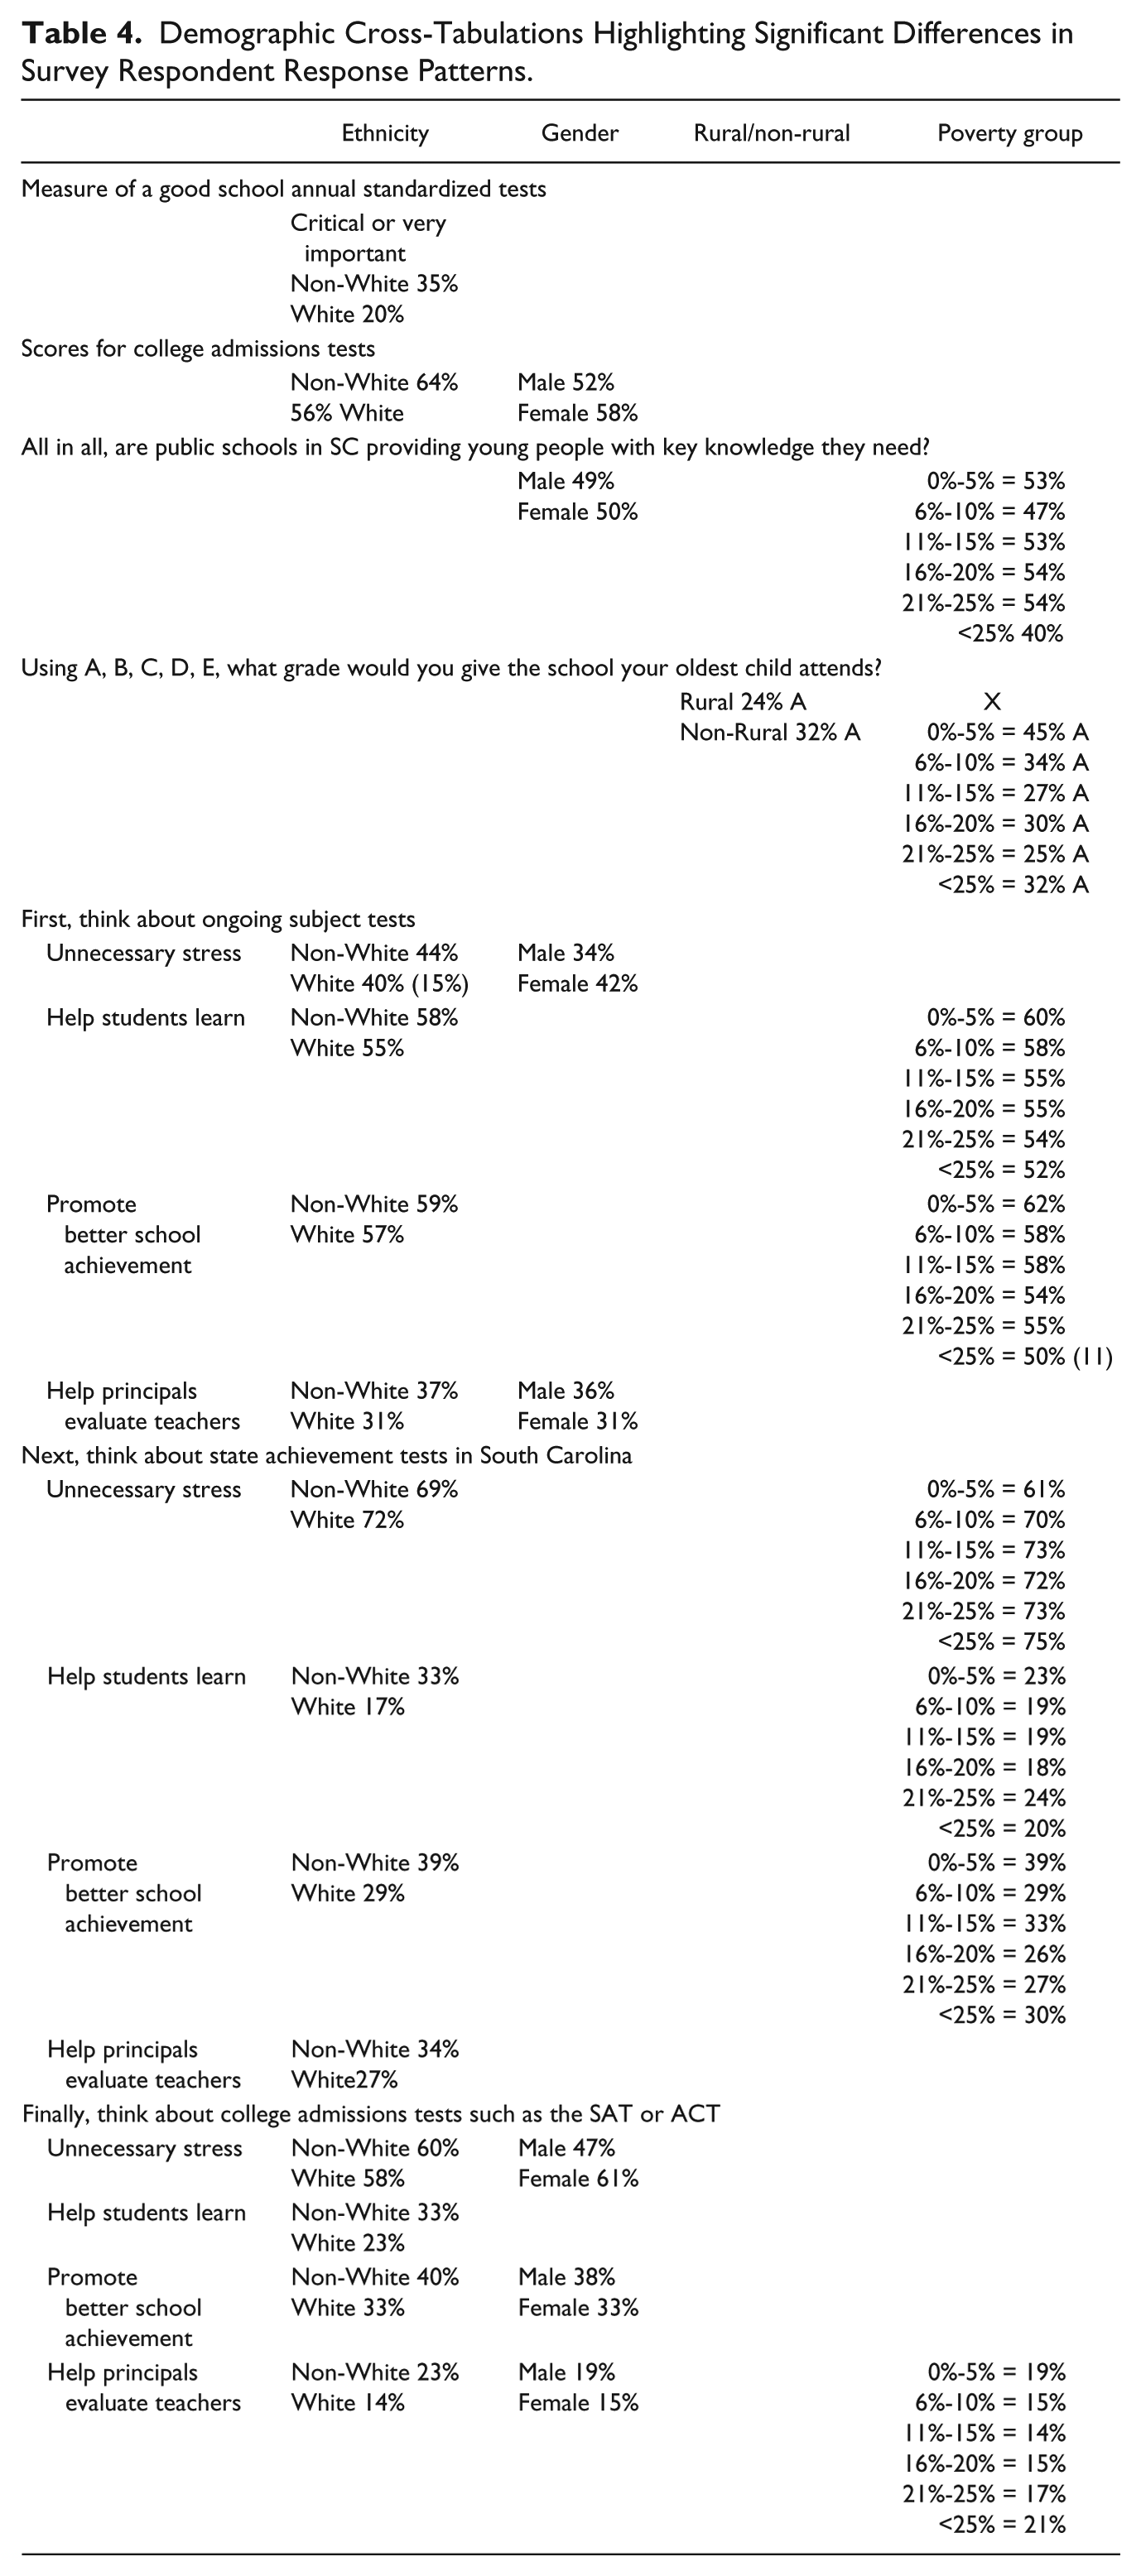
A more mixed pattern emerges when responses were disaggregated by population wealth. No significant differences in response patterns existed among any items across all forms of testing in terms of beliefs about the test or the usefulness of the test. However, respondents living in areas of greater poverty expressed a stronger belief that state-standardized testing causes unnecessary stress. This result may be attributable to how AYP is calculated in schools serving low-income populations, while in schools with relatively less poverty, AYP efforts may not be focused as intently on low-income students. Across all types of tests for populations living in poverty perceptions acknowledge the usefulness of tests to help children learn and to promote better school achievement. Support for ongoing classroom assessments is highest for respondents in wealthier regions. As one moves along the continuum of poverty, support for this form of assessment drops as the percentage of students living in poverty increases. Respondents living in the poorest areas do not see ongoing classroom assessment as a means by which to improve individual student learning or as a way to promote achievement schoolwide. Conversely, the highest level of agreement that state-standardized tests help students learn and that they promote better school achievement exists at either end of the population wealth spectrum. Respondents who live in areas of relative wealth see state tests as a means to improve achievement and so do respondents living in areas of extreme poverty.
Focus Group Results and Web Survey Comments
This study was undertaken in an attempt to understand how stakeholders to education use and make sense of assessment data to improve student performance. The data presented in this study represent the opinions of more than 5,400 stakeholders to public education in the state of South Carolina and these opinions are used to discern public beliefs about the validity of the testing system currently in place in the state. In essence, study participants were asked to consider the consequential validity of the assessment system. To enhance the responses from the surveys, focus groups including specific groups of stakeholders were held in regions of the state. Furthermore, survey participants were given the opportunity to provide answers to open-ended questions. Like the survey results, the focus groups and web survey responses yielded extensive data. As is typical with qualitative data reduction, the reiterative processes of data analyses require a focal point for starting thematic analyses. For the purposes of this article, both the focus group and web survey responses were sifted for their relevance to three tentative conclusions about consequential validity surmised from the quantitative results.
Southern states’ accountability policies strength. Adapted from Carnoy and Loeb (2002) and McDermott (2003).
First, stakeholders of South Carolina’s public education system do not see high-stakes state testing as a valid instrument for discerning school quality. In the aggregate, only 21% of respondents reported the belief that standardized testing was an indicator of a good school. Instead, data from the focus groups as well as survey comments expressed the opinions that high-stakes testing does not accurately reflect school quality. The following quotes exemplify unanimity in the expectation that while all children should be provided with basic skills, one test does not indicate school quality. Respondents favored a breadth of curriculum and opportunities for extracurricular activities as a better indicator of school quality than standardized testing.
My belief is that if we teach the basics every day, we can cull minds and assist them in growing into successful adults. (White taxpayer, 45-54 years old, no degree, survey comment) It does not matter how many kids are promoted or graduate or what there [sic] scores are on standardized tests are if they are not learning anything. You cannot promote or allow students to graduate if they cannot do the basic reading and math skills. Everybody is worried about numbers and not whether the kids are truly learning what they need to succeed in life. (White taxpayer, 35-44 years old, bachelor’s degree, survey comment) I think that if we start focusing on not so much the standardized test, but the skills. Because now teachers are teaching the test instead of teaching the skills. And that’s why our children aren’t really—they’re memorizing it, so they don’t have the skill. They may pass the test, but they don’t have the skill. (Young adult focus group, Midlands) We found that you were teaching to the test and not teaching for understanding of the skill. You followed a book. You taught to a test. They graduated and they go to work and they can’t write, they can’t read, they can’t do things but they passed the test. (Retiree taxpayer focus group, Coastal) I think we need to place more emphasis on Science. I’m surprised that Science is [listed] so low. I thought that Science is, at least from my standpoint, should be emphasized more . . . when you look at Science and Engineering and those types of things, that’s where this job [market]’s gonna be in the future, then we need to elevate that discussion around that. (Business focus group, Midlands) I think you need creative skills to be important and flexible in the workforce. I think that kind of ties in with workplace skills. I was kind of glad to see that’s pretty high, ’cause you need to be transferable, or able to move with the economy and the changing demographic groups that are coming up. (Urban Hispanic focus group, Upstate) And I also look at extracurricular activities to get the kids involved in things so they won’t become bored and have an interest to go to school every day. And I think sometimes with kids, even if it’s sports or band or chorus, if you can discipline yourself to do that, then you can discipline yourself in the workplace. And if you go to school every day, as far as attendance, then you go to work every day. (Urban African American focus group, Upstate) ’Cause I came from a school where our standardized tests [scores] were kind of low, and I feel like it was kind of like a failure on the teachers’ behalf, not ours. They tried to say it was the students, but . . . I can say it’s more—they focus more on control over student behavior than they do on academics. (Young adult focus group, Midlands)
Second, the consequential validity of the test is compromised by the lack of a belief that the test is a useful tool to help students learn. Data from the focus groups seem to clarify this finding. Participants expressed hopelessness that schools can overcome the barriers to learning that are found in areas with a large percentage of students in underrepresented populations.
I am a high school teacher and do think all of these are important, however, I feel that teachers and the educational system always gets blamed and students and parents are not held accountable for the child’s education. Sometimes teacher, administrators, and others involved in the educational process do everything they can to keep children in school and help them perform satisfactorily so they can graduate on time, but parent support, the attitude of the student, and other outside factors often work against the schools desires. There needs to be some way to acknowledge this and not hold schools totally responsible nor penalize them with lower scores because of this. (White educator, 45-54 years old, master’s degree, survey comment) If we are going to measure simply on a single test date to assess a child’s progress, we are not taking into account what teachers have to [do] each day. What about the student whose mother was murdered by his dad? What about the students who lost his grandfather [with] whom he was very close right before the test? What about the child whose mom gives him Tylenol because he has a fever but she can’t miss work so she sends him anyway? We are dehumanizing out children and our teachers. (White educator, 35-44 years old, master’s degree, survey comment) I truly believe this school report card rating system is deeply flawed and the rating of Excellent is unfairly tied to these performance objectives. Schools have no control over the quality of the product they are sent from the families in their neighborhood. They have to work with what they get and do the best they can with what comes in the door. Thus it is an injustice to compare them. (White educator, 55-64, master’s degree, survey comment)
Third, despite the negative feelings about the test, minority populations expressed the most optimism that assessment, particularly state-standardized tests, offered the best hope for school improvement. These stakeholders are representative of the individuals for whom the policy was supposed to aid. Despite the failure of schools to change to accommodate the learning needs of all, stakeholders still held on to the hope that accountability policies and specifically the use of testing is a means to achieve the social justice goals of education policy.
You gotta test to know how your school’s doin’. I like standardized tests. I just wish we’d use it to be able to evaluate educators and how successful they’re being in moving kids from one grade. That’s where it should be used. (Business focus group, Upstate)
Discussion and Conclusion
Educational accountability policies fit the U.S. democratic and economic social models. Purportedly, educational accountability policies offer a report to stakeholders concerning the extent to which students learn what their community stakeholders wish them to know or be able to do. For most of the U.S. states, the critical component of each accountability policy remains the validity of the measures of learning, that is, assessments. In this study, one state’s stakeholders responded to survey questions about the variety of learning measures students face.
Using demographics as a means of data reduction, sets of stakeholders’ responses revealed perceptions about the consequential validity of several types of tests. Researchers were interested in knowing if testing in fact drives instructional improvement and if the current assessment policies in place were a useful tool in aiding practitioners to reach the proficiency goals of state and federal education policy. Three conclusions are supported by the data in this study.
A large majority of South Carolina’s public education stakeholders do not see high-stakes state testing as a valid instrument for discerning school quality.
Overall, stakeholders failed to endorse high-stakes accountability testing as a useful tool for use in helping students learn.
In contrast to the overwhelming dismissal of state accountability testing, minority populations expressed the most optimism that assessment, particularly state-standardized tests, offered the best hope for school improvement.
First, stakeholders’ perceptions raise alarms related to the consequential validity of all forms of testing for students in South Carolina schools. These results suggest that for most stakeholders tests are wasting time and provide neither the necessary information for helping students learn nor for ensuring schools improve. Barely a fifth of the respondents responded that standardized testing indicated the quality of a school. At the classroom level, the assessments that should be the most sensitive to student progress received more support among stakeholders, except for the notion that such assessments might help principals evaluate teachers. State and college-prep standardized tests received little validation by these stakeholders. That is, stakeholders assigned weak consequential validity for standardized assessments in terms of their usefulness for decisions about student learning, school improvement, or principals’ evaluations of teachers.
Second, state assessments received least consequential validity from stakeholders’ responses. Although at the time of this survey, the state was in the process of establishing a new assessment for its accountability policy, these results offer a glimpse of stakeholder skepticism about state assessment validity for its policy consequences. Overall the stakeholders assigned the most stress for students to state assessments, likely due to the high-stakes nature of state testing. The least number of stakeholders indicated that state assessments might help students learn or schools improve achievement. This result may be the most serious indictment of the consequential validity of educational assessment and accountability policy.
Yet, optimism about testing stems from minority groups who believe that assessments are necessary as aids for teachers helping students learn as well as providing the necessary information for school improvement. These results offer some insight into aspects of the concept of consequential validity. Assessment experts’ debates over the legitimacy of consequential validity as part of their concern may be moot in this era of accountability policy (Cizek et al., 2008; Crocker, 2006; Shepard, 1997). That is, state assessments are high stakes. Inferences made from state assessments make a difference to students, families, teachers, principals, and communities (Crocker, 2002). At this writing, the potential of common U.S. content standards leading to a national assessment heightens the legitimacy of consequential validity for inferences about educational assessment policies. This study offers some descriptive results germane to examining educational policy in terms of consequential validity. That is, in this state, public perceptions revealed concerns about the application of test results for individual students, teachers, or schools. This result supports findings by Cizek et al. (2008) that among the various types of validity applied to test or instrument development, consequential validity is the most neglected. Certainly, more research is necessary to ascertain other aspects of consequential validity in testing students in classrooms as well as for school accountability.
Furthermore, the results of this study suggest implications for both accountability policy development and implementation. Testing remains the main instrument for accountability measures of educational quality. Nevertheless, even with a variety of measures to assess student and school performance, the public remains skeptical of the use of state assessments. In the development phases of accountability measures, the public requires clearer illustrations of what these tests measure as well as how the measures are used to make decisions. On implementation, the public requires constant explanation of what tests are used for what purposes as well as how the tests apply to individual students and/or their schools.
Footnotes
Acknowledgements
Professors James Witte, now of George Mason University, and Roy Pargas of Clemson University were instrumental in the development, implementation, and analysis of the survey instrument. The authors deeply appreciate the assistance of Clemson graduate student Monica A. Wills in recording focus groups notes for this study.
Declaration of Conflicting Interests
The authors declared no potential conflicts of interest with respect to the research, authorship, and/or publication of this article.
Funding
The authors disclosed receipt of the following financial support for the research, authorship, and/or publication of this article: This research was completed through a contract with the South Carolina General Assembly’s Education Oversight Committee.