
Abstract
Special education is an approach to schooling that draws significant critique. Scholars often identify special education as a system vulnerable to and complicit in racial, class, and disability segregation, particularly segregation enacted and rationalized through the structural organization of schools and programs. Employing data from the Toronto District School Board (TDSB), Canada’s largest public education system, this article highlights key policy decisions around special education. Controlling for achievement, results reveal significant disparities in access to secondary programming critical to postsecondary education.
Keywords
Across the province of Ontario, policy makers have developed and instituted strategies for supporting students identified as having a disability. 1 Through several policy statements released over the last decade, the Ontario Ministry of Education (MOE) promotes a broad notion of inclusion, though falls short in detailing the practical implications for students engaged in special education (Ontario MOE, 2009, 2017). Although school boards are required to adhere to the Education Act (Education Act, R.S.O 1990, c. E.2) in regard to special education policies, school boards do enjoy a certain degree of autonomy over how special education services, programs, and supports are organized in schools. Key variations in approaches exist, particularly around the extent to which boards refer students to formal identification, placement, and review committees through which an identification of exceptionality and specialized placement decisions can be determined. Overall, the proportions of students identified through special education and the categories in which they are identified are largely consistent across Ontario school boards (Brown, Parekh, & Marmureanu, 2016). However, how boards approach the learning conditions and placements of identified students across the province vary significantly (Brown et al., 2016). For example, some school boards have few, if any, students placed in separate, self-contained special education programs, whereas others offer myriad specialized classrooms and programs.
Evidence-based research continues to show the academic and social benefits of inclusive education (Mitchell, 2010, 2014); leaving stakeholders grappling with its implementation and in determining “who” should be “included” within an inclusive education framework. As policy writers struggle to institutionalize an ever-evolving concept, the research demonstrating the ineffectiveness of traditional special education practices (Mitchell, 2010), the disproportionate overrepresentation of racial and class minorities placed in special education (Connor, 2017; De Valenzuela, Copeland, Qi, & Park, 2006), and queries regarding the construction of disability itself (Reid & Knight, 2006; Samuels, 2014) continue to mount. Therefore, it is useful to examine specific processes involved in special education to identify ways in which policy reform could benefit students. For this purpose, the Toronto District School Board (TDSB) provides an ideal location for an analysis on the enactment of special education–related policy.
The TDSB is one of the North America’s largest public education systems. Current enrolment sits at approximately 246,000 day students, spread across close to 600 elementary, middle, and secondary schools (TDSB, 2018). Within the TDSB, the proportion of students engaged with special education is roughly 18%, resulting in a special education population of approximately 44,000 students (Brown et al., 2016). Although many students identified through special education are taught within regular classrooms, many are placed in either full-time or part-time self-contained special education programs (Brown et al., 2016). The TDSB is an ideal location for analysis on special education in that it offers multiple special education options, and it is one of the only boards in Ontario to collect student and parent demographic data that can be further connected to students’ program, achievement, and administrative information. Through the TDSB’s extensive collection of identity and program-based data, there is an opportunity to parse apart policy implications related to special education as well as the role special education plays in students’ access to future academic opportunities.
Using both demographic and program data from the TDSB, this study examines a hybrid model of special education delivery, largely serving students in Grades 4 to 8, where students spend up to 50% of their day within a special education class and the remainder of the day with their homeroom peers. This program, named as the home school program (HSP), was introduced to the TDSB in the early 2000s and continued to be an option for special education support. Juxtaposed against the province’s narrative on inclusion, our analysis critically explores the role of HSP in relationship to student achievement, secondary programming, postsecondary access, and student demographics.
One of the primary purposes of critical policy analysis (CPA) is to explore the ways in which the enactment of policies contributes to the distribution of power (Diem, Young, Welton, Mansfield, & Lee, 2014). This is a particularly ideal approach when investigating students’ access to academic programs that enable their opportunity to pursue studies in higher education. Controlling for achievement, this study examines students’ access to academic pathways in secondary school across various special education programming options. Secondary school pathways are often recommended based on students’ previous academic achievement. Therefore, our hypothesis was that the relationship between achievement and secondary program access would be consistent across all elementary education placements. However, results from this study did not support this expectation, raising significant implications as to how program and placement further construct disability as incapacity, and limit students’ future access to postsecondary education.
Theoretical and Practical Framing of the Study
The study of HSP presents a unique opportunity for CPA. Although CPA involves exploring the relationship between policy and power, one of its key aims is to uncover and challenge the role policy plays in creating and maintaining inequality (Winton & Tuters, 2015). As Diem et al. (2014) identify, critical approaches to policy analysis often address five areas of concern: the difference between rhetoric and reality; the history and development of a particular policy; how the policy leads to the stratification of power; the policy’s broader social impact on equity; and resistance from members of nondominant groups. Each of these aspects can be traced and explored through the institutionalization and current move to remodel, or phase out, TDSB’s HSP over 2017-2019 (TDSB, 2017a). Rata (2014) suggests that when pursuing a critical policy methodology, it is important interrogate policy through a historical materialist lens and to further examine empirical work that draws connections between educational outcomes and the theoretical context. As this study explores education-related policies and practices tied to notions of students’ ability and disability, this analysis employs CPA through a critical disability theoretical framework.
Approaches to critical disability studies often invoke historical materialism through which scholars consider how economic, social, and political factors contribute to the construction of disability and the exclusion of people identified as disabled (Barnes & Sheldon, 2010; Oliver, 1990). Newer scholarship within critical disability studies extends its traditional framework of exploring how environments interact with functionality and access to include ways in which similarly constructed identities, such as race, gender, and class, also shape notions of ability and disability (Annamma, Connor, & Ferri, 2013; Gorman, 2013; Voulgarides & Tefera, 2017). Scholars such as Connor (2017) and Erevelles, Kanga, and Middleton (2006) explore how the construction of racialization and poverty influence perceptions of ability. As an example, Reid and Knight (2006) point to educators’ disproportionately high level of referrals of racialized students and students living in poverty to special education programs in the United States. They surmise that removing students from mainstream education and placing them within special education is an act of exclusion that perpetuates racial and class hierarchies. Reid and Knight (2006) also note that academic exclusions based solely on racial identity or class would be illegal. However, when justifying students’ exclusion using notions of ability, the systematic discrimination of racialized students and students living in poverty is accepted, if not lauded as benevolent or as a public good. To further our understanding of these phenomena, this study takes up a CPA with explicit attention to how the enactment of policies related to special education exacerbate the disablement of students, particularly students who are male, racialized, and who experience economic disadvantage. There are many policies and practices involved in special education. As noted, this study specifically centralizes the HSP and the practice of segregating students through a part-time withdrawal approach to special education. Using Diem et al.’s (2014) overview of key components of CPA as an organizational guide, the following article will interweave CPA with a unique quantitative study exploring the outcomes for students involved in HSP.
Exploring the Rhetoric and Language Around Inclusion Within Provincial Policies
The province of Ontario has approached inclusion from a variety of positions. Frequently, provincial policy papers incorporate the terms “inclusion” and “equity,” situating both as key strategic goals for improving the academic experiences and outcomes for Ontario students. In 2009, the Ontario MOE (2009) released Ontario’s Equity and Inclusive Education Strategy. In this document, the Ministry opted to discuss equity and inclusion through the lens of acknowledging and appreciating diversity, focusing on pedagogical practice and attitudinal barriers. However, the document largely avoided discussion on structural issues related to programming and marginalization based on perceptions of ability. Later in 2017, the Ministry released Ontario’s Education Equity Action Plan (MOE, 2017). Although the term “inclusive” did not appear in the title, “inclusion” and “inclusive” are mentioned collectively over 50 times throughout the document. This time, the Ministry identified structural barriers that disproportionately affected students identified through special education.
Disability studies scholars approach inclusion from a variety of perspectives as well. Many conceive inclusive education as a “means to provide students with educational access and opportunities to participate in society” (Artiles, Kozleski, & Waitoller, 2011, p. 9), where the focus looks at ways to improve the conditions of students in schools through praxis, the advancement and enactment of rights, and the reform of educational structures. In addition, inclusion is often taken up through querying the ways in which disability, itself, is constructed to justify school exclusion (Brantlinger, 2006), interrogating systemic practices that limit opportunities for people perceived as disabled (Ben-Moshe, Chapman, & Carey, 2014), and the ways inclusion can function as a site for political resistance and radical change (Greenstein, 2016).
The study of inclusion encompasses each of these aspects and demands that, when reviewing educational policies and practices, educators and policy writers often consider “Who benefits?” (Brantlinger, 2006). When it comes to organizing students into programs, educators must reflect on who is benefiting from such organizational decisions and who further disadvantaged. In addition, when practices shift toward inclusion, it is critical to actively explore into what are we including students. Keeping in line with the aims of CPA, how do we ensure the environment, curriculum, and climate are the ones in which students can experience a sense of belonging, a sense of membership, and shared power (Parekh, 2014)? In examining the cultural, attitudinal, and structural composition of schools, inclusion calls for reform, demanding the cultural, material, and structural conditions of schools be assessed and addressed. Critical to our understanding of how the rhetoric and enactment of special and inclusive education policies coexist, it is important to review the history from which such policies emerged.
The History and Development of the HSP
Good Intentions Into Action
According to Ellis and Axelrod (2016), “the TDSB in the early 2000’s began to adopt a range of policies, with and beyond special education, to achieve greater inclusion of children with disabilities” (p. 27). An example of this range, in the early 2000s, the TDSB developed the community-based resource model (CBRM), partly to address complaints around the high numbers of TDSB students who were forced to leave their local school to attend special education schools, or magnet self-contained special education programs scattered across the Greater Toronto area. Through CBRM, students identified as having a disability, that were perceived as candidates for accommodation in the regular class, would access services through the resource program in the form of a push-in model of in-class support and/or other resource assistance.
However, in 2003, many schools opted to shift the CBRM’s push-in model of support and instead chose to withdraw students and place them in self-contained settings for up to 50% of their day. This new configuration of support was dubbed the HSP. The name itself drew attention to the main advantage of the program: unlike previous TDSB full-time congregated programs (now renamed as intensive support programs or ISP), students would now be able to attend their local, or home, school and still receive intensive support. The purported intervention would take place within a small class instructional approach for up to half the day, would be available in every elementary school, and would support students between Grades 4 and 8. As a timed tiered intervention, HSP was designed to prepare students for reintegration into the regular school program once they were deemed to have caught up in their academic work. Therefore, the program was meant to be a less intrusive, gradualist, and relatively short-term intervention, which supported the province’s renewed focus on inclusion (TDSB, 2003).
Contextual History of HSP: 2003-2014
Through historical files of TDSB elementary enrollment, we are able to sketch the development of the program. Figure 1 and Table 1 show the number of TDSB students in self-contained special education programming. In fall 2000, before the establishment of HSP, there were close to 7,400 students in ISP largely catering to students identified as having a learning disability, behavioral disorder, autism, developmental disability, mild intellectual disability, and a range of other Ministry-defined exceptionalities. In 2003, with the establishment of HSP, the number of students in ISPs declined to slightly over 6,000, and the decline continued until there were slightly over 4,000 students in ISPs by fall 2014: an overall decline of 44%. However, when HSP started in fall 2003, there were around 2,900 students enrolled—a number, which increased to over 6,000 by fall 2008, before declining to around 5,000 students in recent years (Figure 1 and Table 1 from Brown et al., 2016).
Composition of Elementary School Students With Special Needs in Congregated Classrooms.
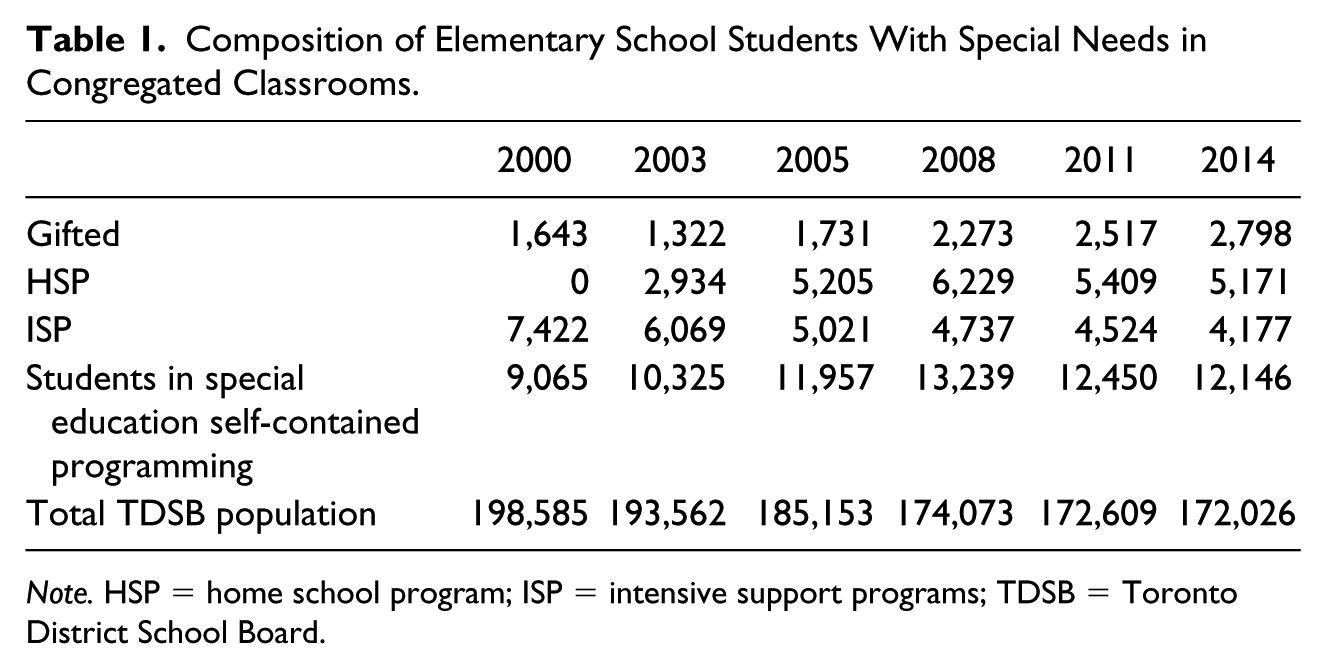
Note. HSP = home school program; ISP = intensive support programs; TDSB = Toronto District School Board.
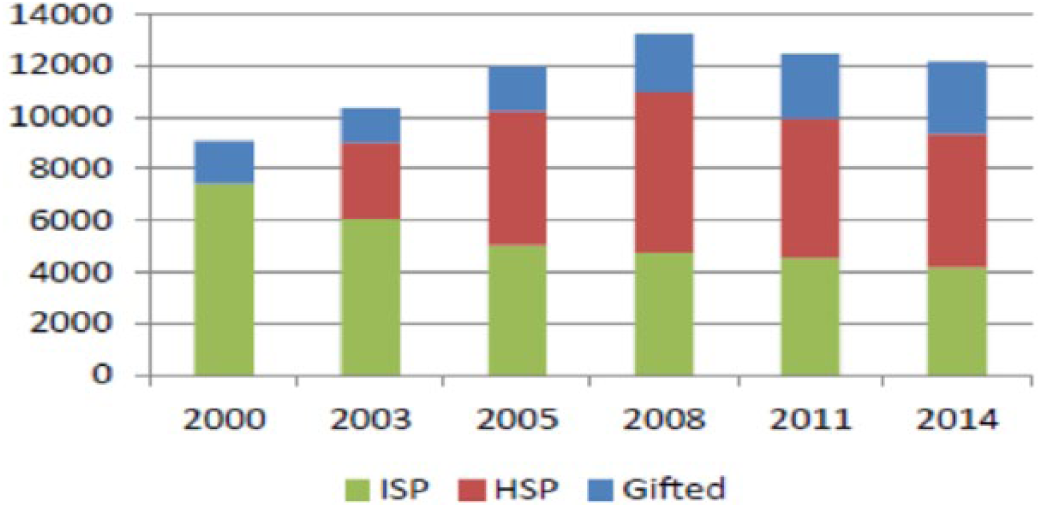
Composition of elementary school students in special education enrolled in congregated classrooms.
By fall 2014, the TDSB had 9,348 students in self-contained special education classes (ISP and HSP), an increase of 1,926 students of the baseline fall 2003 numbers. In other words, even though between 2000 and 2014, the TDSB elementary enrolment declined by over 26,000 students, students in self-contained special education classes increased by 26%—an unusual outcome considering the provincial and local narrative promoting inclusion. At this time, the TDSB had over twice the proportion of self-contained special education classes, compared with the rest of the province (Brown et al., 2016; see Figure 2).
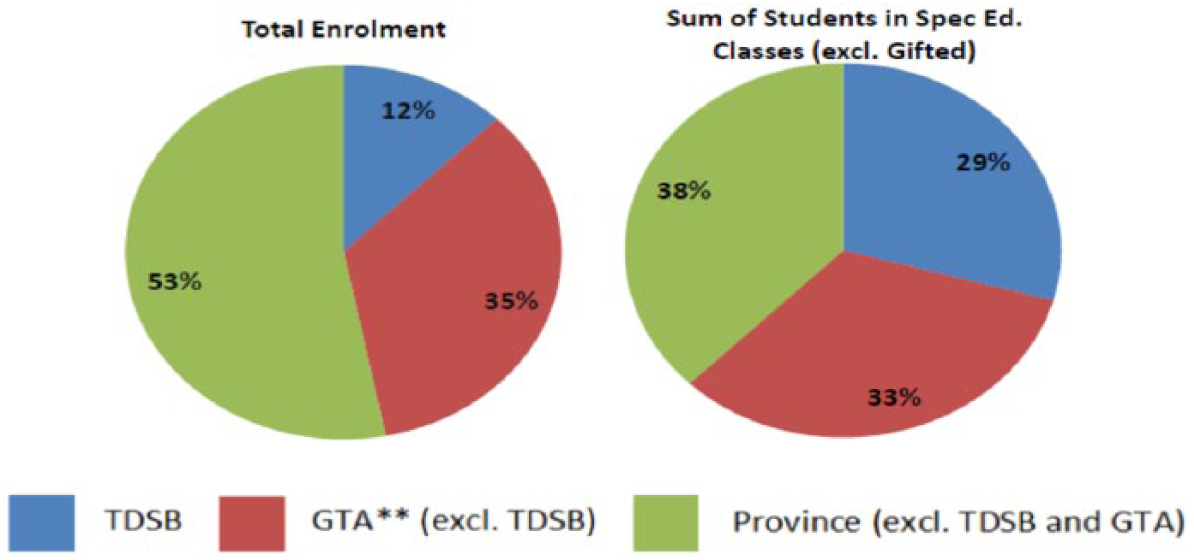
Students in special education (excluding gifted): Special education classes (n = 42,435).
Key Unique Policy Features Related to HSP
There are several unique policy enactment features associated with HSP. For example, students in HSP are only in special education classes for up to 50% of their day. In the language of Ontario special education bureaucracy, HSP classes are considered “partially integrated” rather than “fully self-contained.” This could, in theory, be considered something of a compromise between full-time special education and being full time in the regular classroom. However, an important point is that generally students are placed in HSP for core subjects, such as mathematics and language, which are heavily weighted in determining academic programs at the secondary level. The classes taken in the regular classroom setting are more likely to be in the social sciences or the arts, where achievement has lesser impact on students’ overall academic standing.
Another key policy consideration is that at around the same time as the HSP program was implemented, Ontario also established upper class size limits for elementary and secondary classes. However, the limits are not necessarily for all classes, but for average class sizes. This is important for the development of school staffing models. Historically, and despite the declining elementary enrollment experienced between 1998 and 2016, lower class sizes in special education classes (e.g., HSP or ISP) have allowed for increased staffing within schools. In addition to the implementation of a hybrid special education program that enables increased staffing, placement in HSP does not require a formal identification of exceptionality or placement decision for students to be enrolled in HSP. This means that decisions to place students into HSP can be made at the school level and require little formal process. Although this flexibility may be interpreted to potentially expedite access to support, it also reduces opportunities for external checks and balances as to who is being recommended for special education placement and ultimately removed from core regular programming.
Policy and Power: Who Ultimately Benefits From HSP?
A key element of CPA is the exploration of how policies lead to the distribution of power (Diem et al., 2014). In other words, as Brantlinger (2006) queries “Who Benefits?” from the systemic expansion of HSP across the TDSB. If students are being placed in HSP throughout their elementary years, what gains can be observed and what role might the program play in students’ future academic success? Based on the structure of secondary schools in Ontario, the level of courses taken in Grade 9 is often a strong predictor of access to postsecondary education. For instance, starting in Grades 9 to 10, most students generally take courses at the academic, applied, or locally developed level (or program of study 2 ). Similarly, in Grades 11 to 12, the majority of students pursue courses across the University, Mixed, College, Open or Workplace Program of Study. Historically, the Ontario Ministry of Education and the TDSB have suggested that students can straddle several programs of study and pursue many secondary pathways leading toward postsecondary opportunities (Figure 4: TDSB Choices 2017-2018 document D; TDSB, 2017b). However, both the MOE and the TDSB have recently acknowledged that students are unlikely to switch back and forth between secondary pathways (Canadian Broadcasting Corporation [CBC], 2017). Generally, program of study in Grade 9 determines postsecondary access. That is, almost all university-bound students (equivalent to an American 4-year college degree program) and most college-bound students (equivalent to an American 2-year associate degree) take academic courses in Grade 9. Most students taking applied and locally developed courses do not go on to postsecondary schooling (Brown, 2006; Brown, 2010; Brown & Tam, 2017; Quan, 2017).
Therefore, a relevant outcome measure of whether students placed in HSP were adequately supported through special education programming in the elementary level, as intended, was to examine their access to academic level programming in Grade 9. This study ran a comparative analysis and controlled for students’ academic achievement as reported through the Grade 6 provincial standardized assessment in mathematics.
Method
By employing a CPA framework, this study is designed to explore how policies related to HSP and special education programming may lead to both inequitable distributions of power within the education system with lasting implications for students’ futures beyond school. For this study, data on the TDSB’s Grade 6 cohort of 2011-2012 were examined (n = 13,272).
The data set consisted of the following:
Administrative and demographic data of Grade 6 students in the TDSB over the 2010-2011 school year (when the students were in Grade 6) and the 2011-2012 school year (when the students were in Grade 7), including grade, gender, and special education needs (SENs) status.
Results from the Ontario provincial test for mathematics, administered when the students were in Grade 6, and graded by the provincial testing authority (EQAO, the Education Quality and Accountability Office).
Program of study of courses taken by these students in their first year of secondary school (Grade 9). Students were categorized as taking a majority of courses in the academic program of study (shown to be associated with postsecondary pathways, for example, Quan, 2017), or other programs of study that are not strongly associated with postsecondary (applied, locally developed, no defined program of study).
Given that this was an exploratory analysis, three-way cross-tabulations and chi-square analyses were performed. The majority of students fell into one of the following four special education categories: (a) students who had not been identified as having a SEN (students without SEN), (b) students who had an individual education plan (IEP; no formal exceptionality) and were taught in the regular class (IEP only—regular), (c) students who had a formal exceptionality and were taught in the regular class (exceptionalities—regular), and (d) students placed in the HSP. To ensure that the three-way chi-square analysis could be conducted with five or more cases per cell, Grade 6 mathematics results focused on four important mathematics achievement ranges: Level 1 or below (very low achievement) Level 2 to 2.5 (lower achievement), Level 2.6 to 2.9 (the TDSB average), and Level 3.0 to 3.49 (above average achievement). Even with these limitations, the four special education categories and four mathematics categories accounted for 51.9% of the cohort (6,893 of 13,272). The majority of students not included were from the highest achieving categories of EQAO Grade 6 mathematics (Level 3.5 or above), who were greatly underrepresented among categories of SENs.
Results
Figure 3 is a graphical representation of the proportion of students, who scored a Level 1 or below on the Grade 6 EQAO math assessment, and who accessed Grade 9 academic programming across the range of programming and placement categories. For students who had not been identified as having a SEN in elementary school, 48% went on to access academic programming in high school. This proportion dropped dramatically for students who had an IEP (21.8%) or an exceptionality (29.7%) and were taught in the regular class. With an access rate of 5.7%, students in HSP experienced the greatest barrier to academic programming in Grade 9.
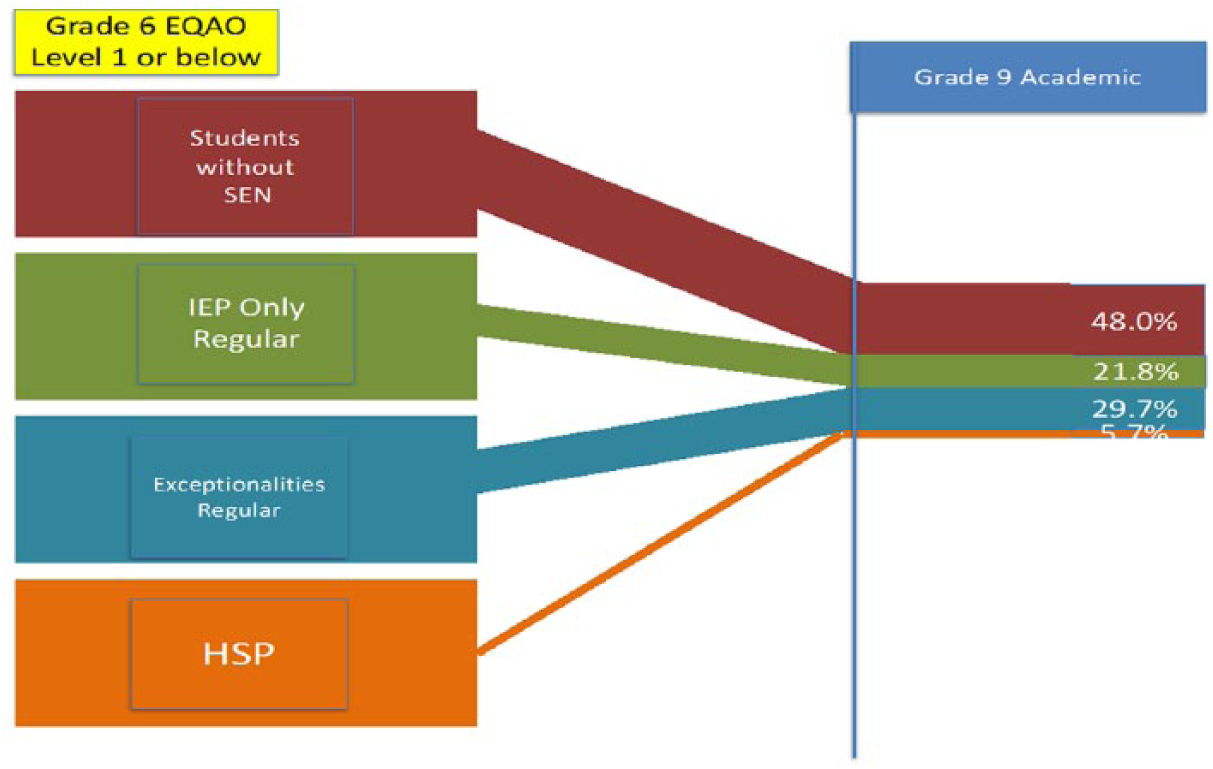
Proportion of students accessing Grade 9 academic courses (Grade 6 EQAO Level 1 or below).
Our assumption was that as students’ level of achievement rose, so would their access to Academic programming in Grade 9. At this stage of the analysis, our hypothesis was supported by an increase in access to academic programming for all groups whose EQAO scores were higher, between Level 2.0 and 2.5 (Figure 4). Of students who had not been identified with special educational needs in elementary, 65.9% were able to access academic programming in Grade 9, as compared with 34.8% of students who only had an IEP and 36.4% of students who had a formal exceptionality, but were taught in the regular class. For students in HSP, the boost in achievement also resulted in a significant boost in access, leaping from 5.7% for students scoring a Level 1 or below to 19.6% for students who scored between Level 2.0 and 2.5.
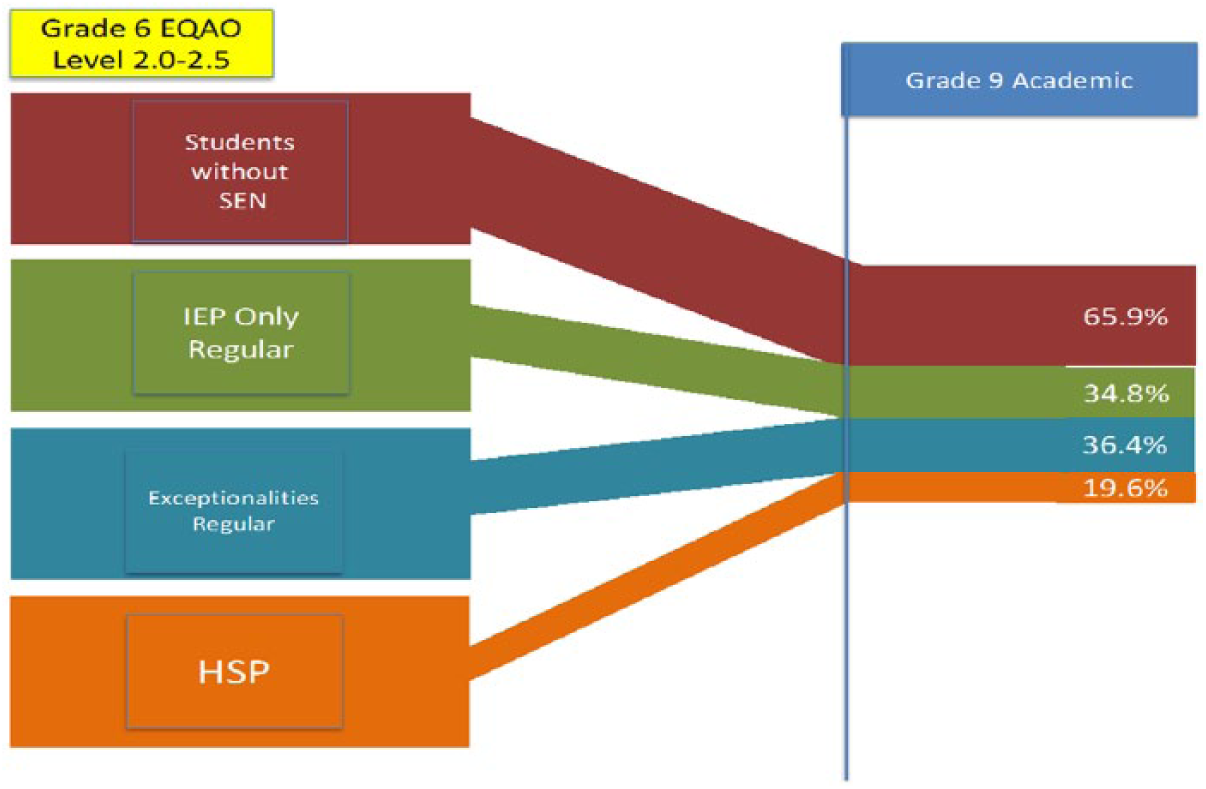
Proportion of students accessing Grade 9 academic courses (Grade 6 EQAO Level 2-2.5).
As achievement rose, access to academic programming in Grade 9 appeared to hold a consistently positive relationship across the first two achievement categories—that is, until we look at students who scored between Level 2.6 and 2.9 on the Grade 6 EQAO assessment (the TDSB average score). Interestingly, the positive trend between achievement and access rung true for all student categories with the exception of students in HSP. Of students who were not identified as having SENs, 81.7% were now accessing Academic programming in Grade 9. Students who had an IEP (54.6%) and students who had an exceptionality (64.4%), but were taught in the regular class, experienced an increase in access as their marks rose. Despite the consistent positive relationship between student achievement and access, students in HSP did not experience an increase in access despite similar levels of achievement. In fact, their access decreased somewhat further stratifying secondary outcomes across groups (Figure 5).
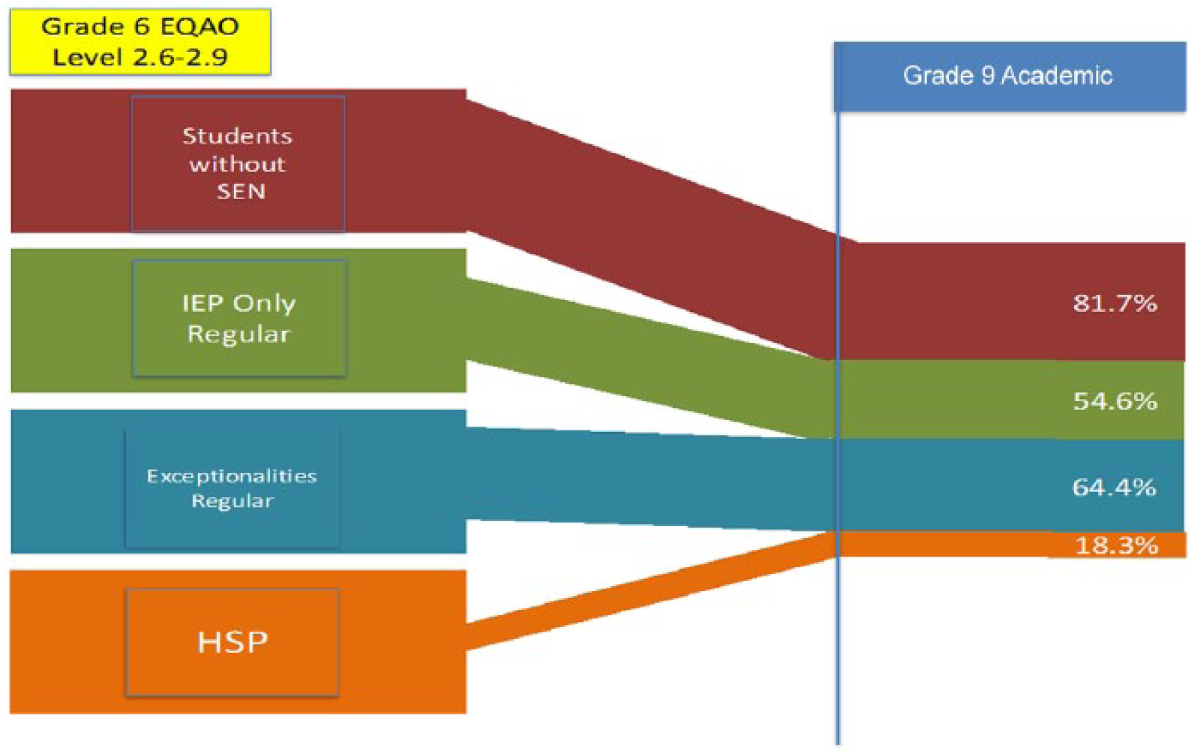
Proportion of students accessing Grade 9 academic courses (Grade 6 EQAO Level 2.6-2.9).
Finally, Figure 6 demonstrates the relationship between achievement, special education programming category, and access for students who scored above average on the Grade 6 EQAO assessment. As shown in the visualization below, students who had not been identified as having a SEN had an access rate of 89.7% to academic programming in Grade 9 as compared with only 56.8% for students who had an IEP and 84.3% for students who had been formally identified as having an exceptionality, both taught within the regular class. Most interesting is that students in HSP did not enjoy a similar increase in access, but had an access rate consistently below 20%, despite having above average achievement. As academic programming provides the main entry into postsecondary—the source of almost all new jobs in today’s workforce (Government of Canada, 2015)—placement into HSP seems highly related to significant barriers with potentially lifelong consequences.
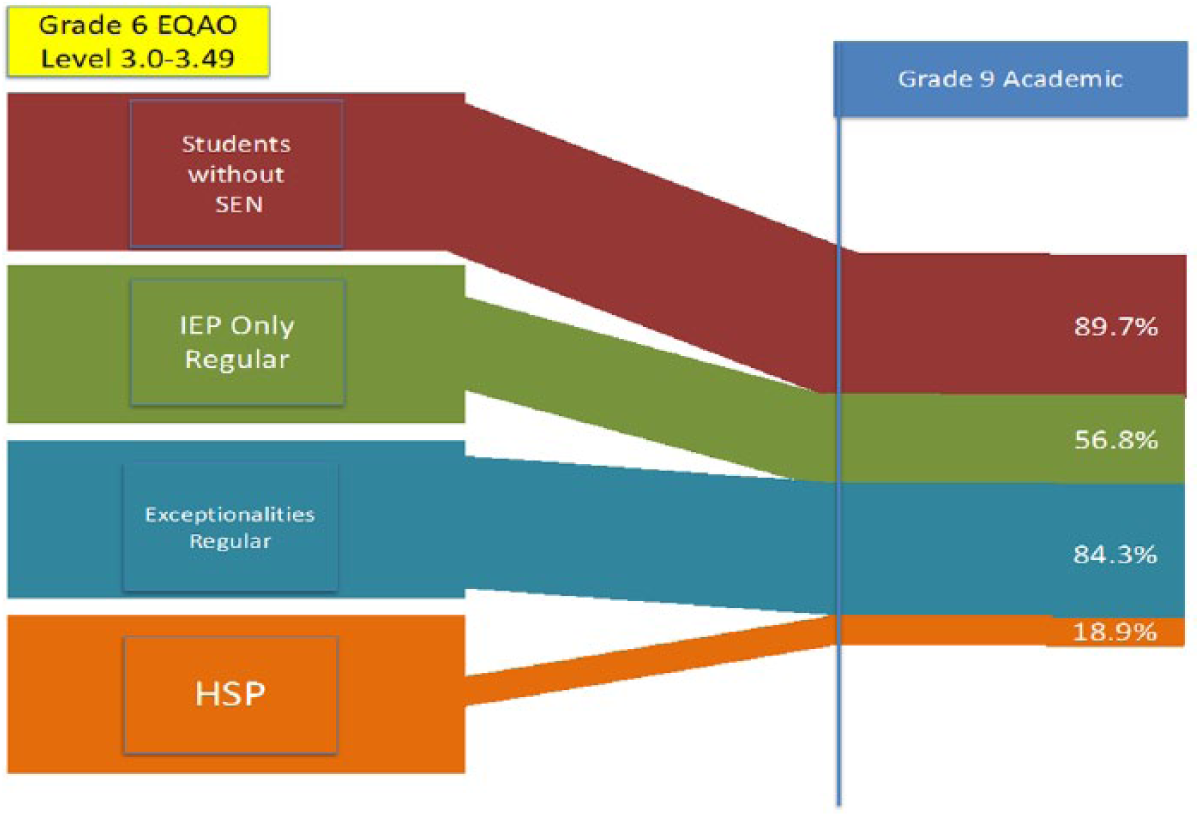
Proportion of students accessing Grade 9 academic courses (Grade 6 EQAO Level 13.0-3.49).
Chi-Square Analyses
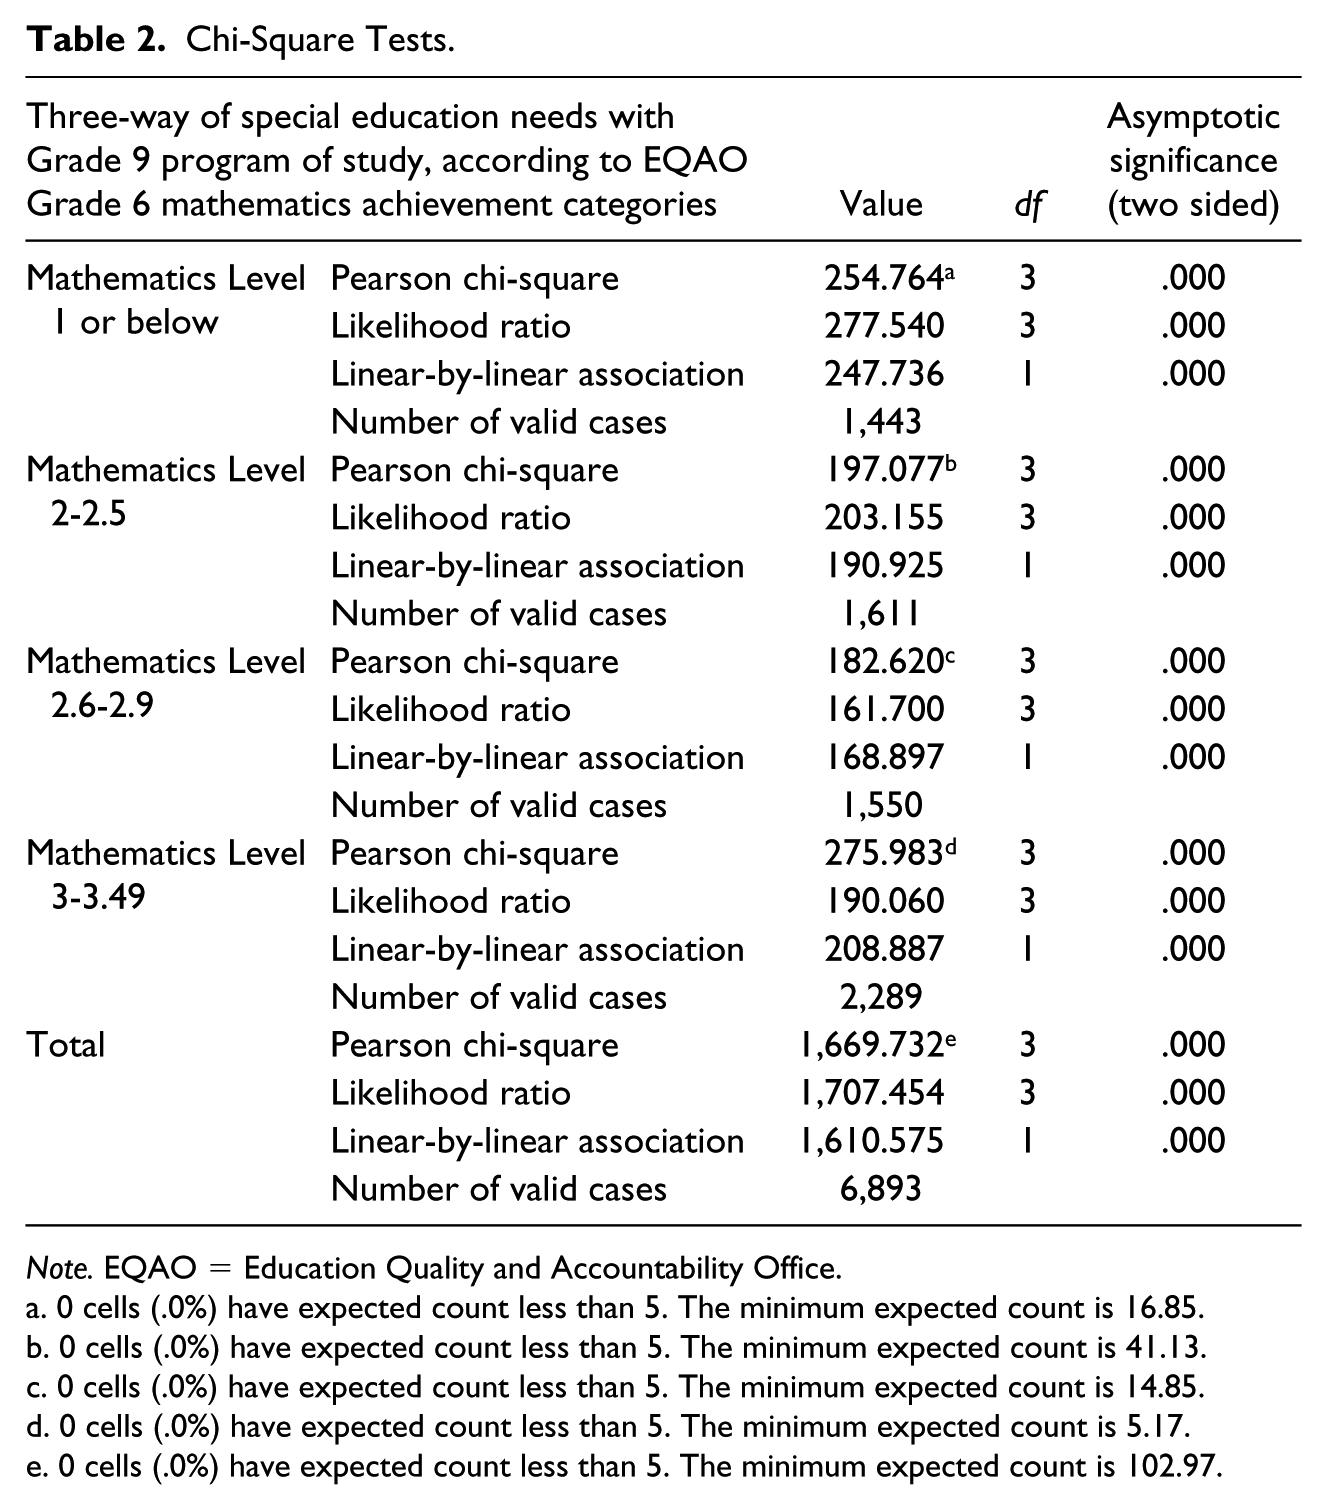
Each table within the three-way cross-tabulation was significant at <.001 using the chi-square test of significance. That is, within each of the four achievement categories (as well as the total of all four achievement categories) there was a significant difference between special education status in later elementary school, and whether students took academic courses in Grade 9 (thus enabling access to postsecondary education; see Table 2).
Chi-Square Tests.
Note. EQAO = Education Quality and Accountability Office.
0 cells (.0%) have expected count less than 5. The minimum expected count is 16.85.
0 cells (.0%) have expected count less than 5. The minimum expected count is 41.13.
0 cells (.0%) have expected count less than 5. The minimum expected count is 14.85.
0 cells (.0%) have expected count less than 5. The minimum expected count is 5.17.
0 cells (.0%) have expected count less than 5. The minimum expected count is 102.97.
Demographic Analyses
Education systems and policies are often structured and enacted on meritocratic principles (Brantlinger, 2006; Duncan-Andrade & Morrell, 2008). If education is built on concepts of meritocracy, where higher achievement leads to greater access to academic opportunities, then students placed in HSP are at a distinct disadvantage. For students in HSP, the achievement–access relationship appears to be determinately interrupted. This unique outcome urges researchers to, again, query, “who benefits?” from HSP. To more thoroughly understand who was being disadvantaged through HSP placement, a descriptive demographic analysis was conducted. The descriptive analysis drew on a slightly different data set, based on the elementary panel in 2011-2012, as this data set offered a richer demographic profile. This data set included responses from students or their parents who wrote the 2011-2012 Parent Census (for students in JK to Grade 6) and Student Census (for students in Grades 7 and 8.) 3
Mirroring much of the critical special education and disability studies literature emerging from the United States (Artiles, Kozleski, Trent, Osher, & Ortiz, 2010; De Valenzuela et al., 2006), students in 2011-2012 who were placed in HSP were more likely to be living in the lowest and middle-income tertiles and least likely to be living in the highest income tertile as compared with all other groups. Interestingly, students who were formally identified as having an exceptionality and taught in the regular class were much more likely to be from families within the highest income tertile and least likely to be from the lowest income tertile (Figure 7).
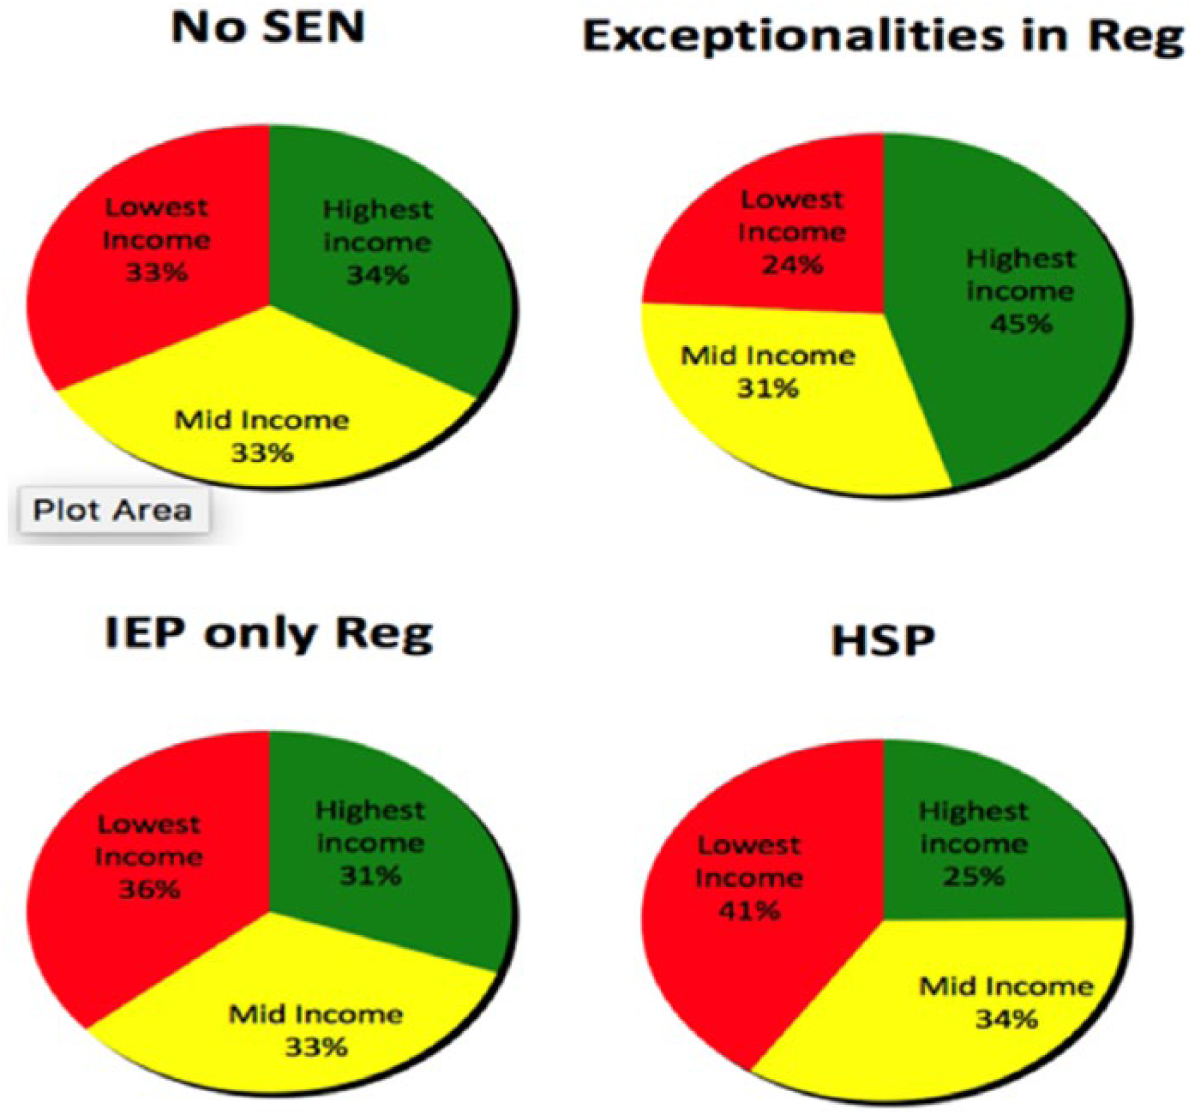
The relationship between income and program, 2011-2012.
Also, in line with the noted literature, racialized students were overrepresented within HSP. Of students who were taught in HSP, 22% self-identified as Black (comparative to 10% of students without special education identification). Conversely, students who self-identified as East Asian were half as like to be enrolled in HSP. Although students outside of special education, who also self-identified as White, made up 30% of the student population, they represented close to half (48%) of students who were formally identified as having an exceptionality and taught in the regular class (Figure 8).
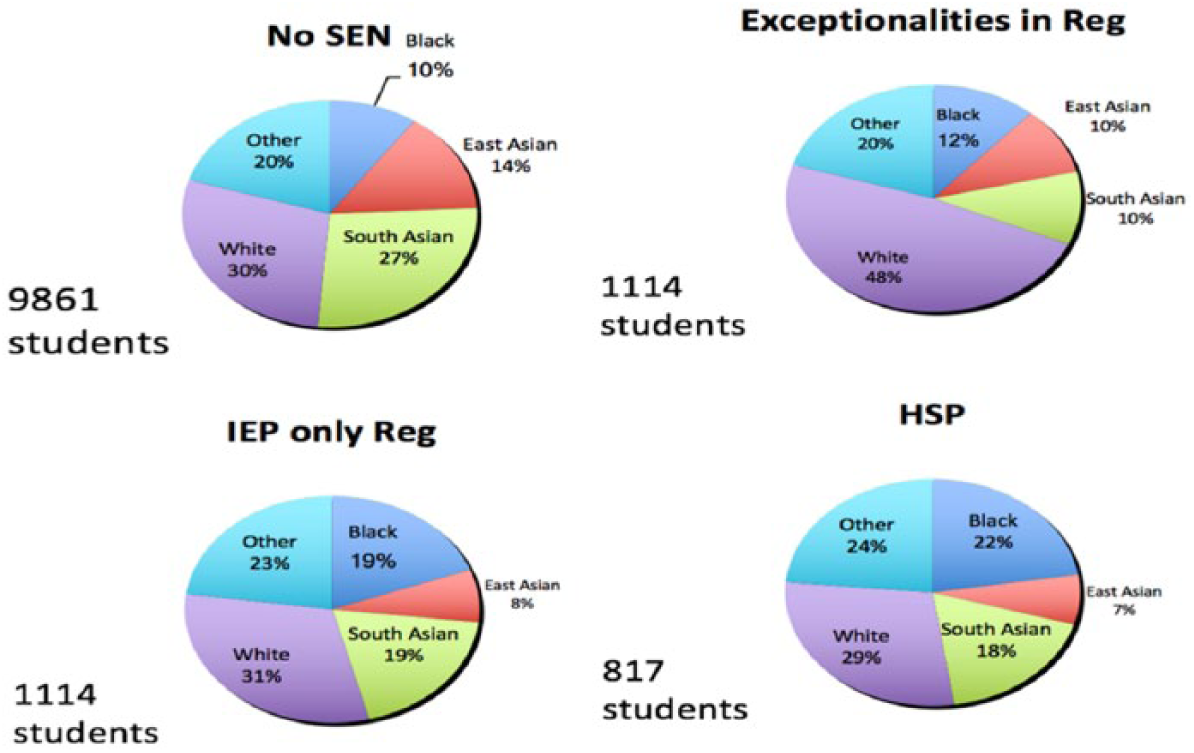
The relationship between self-identified racial identity and program, 2011-2012.
In terms of parental education, students placed in HSP were most likely to have parents who have not had the opportunity to attend university (73.5%)—a stark difference between the overall proportion (46%) and the gifted program (17.3%; see Figure 9).
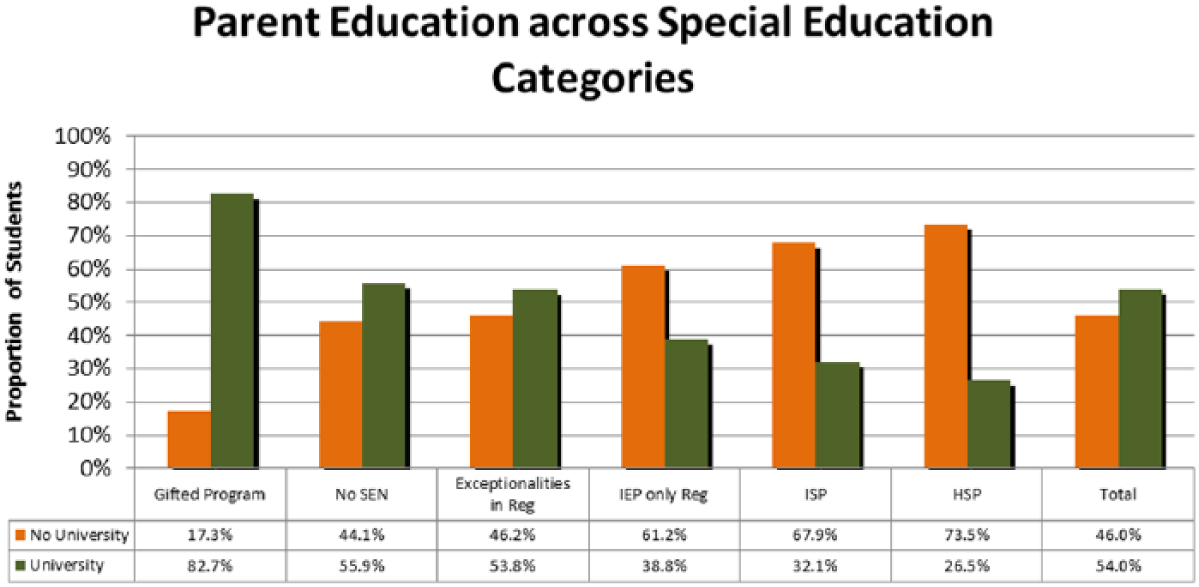
The relationship between parent education and program, 2011-2012.
In sum, the case of HSP closely mirrors the findings of many international studies that find students enrolled in special education programs are more likely to be racialized, poor, and have limited access to resources (Artiles et al., 2010; Connor, 2017; Ferri & Connor, 2014; O’Connor & Fernandez, 2006). In this study, students placed in HSP were more likely to self-identify as Black, more likely to come from families within the lowest income tertiles, and more likely to have parents who have not had the opportunity to access postsecondary education. Considering the role public education plays in replicating advantage and disadvantage (Bourdieu, 1973; Giroux, 2013) and coupled with disparate access to postsecondary education, these findings raises particular concerns about how students are being recommended and placed within HSP, and the consequences of segregated programming for students constructed as disabled.
Discussion
One of the most important aspects of CPA is its focus on structural inequity. The use of a CPA approach to this work enabled direct examination of the practice of congregating students into a part-time special education program designed for students perceived to require extensive support in school. The study of the HSP within the TDSB reveals critical policy areas in which inequity is enacted. The study into the outcomes for students placed in HSP reveal two key findings. First, the practice of segregating students into low-ability groups appears to be directly correlated with exclusion from academic programming in high school. Placement in an HSP appears to affect students’ future academic opportunities and ensures almost direct placement into nonacademic programming at the secondary level, regardless of student achievement. Second, when compared with students who are similarly identified and taught in the regular class, students placed in HSPs are more likely to be racialized, more likely to come from lower income families, and more likely to have parents who have not had access to postsecondary education.
For generations, scholars have illustrated the damaging effects of ability grouping through the enactment of special education policies. In 2010, Mitchell prepared an international review of empirical studies exploring both special and inclusive education. His conclusions reported that one of the key disadvantages of current special education models is the creation of lower ability groups into segregated programs. Within segregated special education programs, a number of unintuitive effects take place. Mitchell’s (2010) findings revealed that despite the lower teacher–student ratio in special education programs, students often access less curriculum and instruction than they do when placed in heterogeneous groupings and experience limited opportunities for broader social interactions. In addition, being placed in a “low ability” program can lower teachers’ expectations of students and placements in lower ability groupings are often permanent (Danforth, Taff, & Ferguson, 2006; Mitchell, 2010). These final points ring particularly true in light of the current study and the extension of academic exclusion students experience when transitioning from HSP to secondary school.
In Ontario, the overrepresentation of minority students within nonacademic and special education programs has been long documented, dating back to the early 1970s where data revealed that children of immigrants or working-class parents were disproportionately distributed across academic pathways and programs (Deosaran & Wright, 1976; Wright, 1970). Similar and more detailed trends around disproportionality and racial identity and income have been identified across the United States with scholars drawing attention to the overrepresentation of African American children being identified with high incidence and/or emotional disturbance disorders and placed in segregated special education programs (Artiles et al., 2010; De Valenzuela, Copeland, Huaqing Qi, & Park, 2006; O’Connor & Fernandez, 2006). Knowing that biological differences related to cognition do not exist between racial groups and recognizing the murky and racist history of intelligence testing, the continued disproportionality in special education or disability identification requires further examination.
Research has long shown how sociodemographic factors such as racial, class, and gender identity can influence the perception of ability (Artiles et al., 2010). When students are organized into groups based on the perception of ability, clear patterns of disproportionate representation of race, class, and gender emerge (De Valenzuela et al., 2006; Mitchell, 2010). In many North American studies, programs considered to be for lower performing students, such as special education programs, vocational and trade-based programs, often result in an overrepresentation of racialized youth, males, and youth living in poverty (O’Connor & Fernandez, 2006). In contrast, programs designed to support and challenge high-performing students, such as gifted programs, international baccalaureate programs, and French immersion programs, are often disproportionately overrepresented by White, wealthy students (Gaztambide-Fernández & Parekh, 2017; Parekh, 2013). As discussed above, the pervasiveness of these trends points to larger societal and structural forces that reify the hierarchical valuation of identity through constructing ability and disability, fiercely tied to notions of racial and class superiority.
The empirical evidence demonstrated through this study makes a strong case for how the congregation and segregation of students can shape how disability is, itself, constructed and how special education programs can further disable students’ access and participation. Through CPA, we can also identify the misleading provincial rhetoric around inclusion, the history through which HSP was birthed, and the ways in which the practice of HSP merges with intersectional constructions of disability, further stratifying students’ opportunities for secondary and postsecondary success.
Resistance and Next Steps for HSP
Our examination of HSP within the TDSB began in 2015 and was swiftly taken up by the education community (see To, Lloyd, Bacchus, & Gaymes San Vicente, 2017; TDSB, 2017c). Educators and administrators across close to 55 schools opted to volunteer to remodel their HSP classrooms with the goal of supporting greater inclusion in schools. Coupled with administrative and technical guidance on how to successfully remodel programs and include students into regular programming, volunteer educators also received training in culturally relevant and responsive pedagogy as well as in anti-bias/antidiscrimination approaches to education (To, et al., 2017). As of 2018, the TDSB’s special education department, SEAC (the Special Education Advisory Committee), and the TDSB inclusion committee have now strongly endorsed the importance of modifying both the size and direction of HSP. Due to its history, HSP is considered a long-term structure that has proved challenging to modify or reform. That being said, there seem grounds for optimism. The TDSB has made a collective move to phase out the program within its current form and place more students, with in-class support, into full-time regular programming. Placement criteria for students entering HSP is also being scrutinized, and with a focus on anti-bias training for educators, the goal for reducing racial and class disproportionality will hopefully be realized.
Conclusion
The story of the TDSB’s HSP has an element of poignancy as the founding goals conveyed hope for more equitable opportunities across the student population (TDSB, internal documents). However, when we respond to the query of “Who benefits?” from placement in HSP, we found that students were at a significant disadvantage, regardless of their achievement. Coupled with the disproportionate placement of racialized and poor students within HSP, the picture becomes more clear as to the structural issues associated with grouping students based on perceptions of ability. In this, the TDSB’s HSP is a particularly illustrative example of structural features that require urgent attention and reform, to bring the TDSB, and Ontario, in line with its own policies on inclusion. As the TDSB makes further strives toward greater inclusion, there is good reason for optimism. The TDSB has responded to research by addressing policy, structural and practical aspects of special education placement and programming for students in HSP. As we continue to monitor and measure the success of TDSB’s structural reform, we believe results will provide greater insight into the relationship between educational policy, schooling practices and disability justice.
Footnotes
Acknowledgements
Authors’ Note
Excerpts from this work were previously made available to Inclusive Education Canada and were previously submitted to the Social Science and Humanities Research Council for an Insight Development Grant, awarded in 2017.
Declaration of Conflicting Interests
The author(s) declared no potential conflicts of interest with respect to the research, authorship, and/or publication of this article.
Funding
The author(s) received no financial support for the research, authorship, and/or publication of this article.