
Abstract
State and national school accountability policies situate preventing chronic absenteeism on par with meeting state standardized test benchmarks. We question relying on school attendance as both a component of accountability policies and a means of enhancing equity in schools. Our research suggests out-of-school factors unrelated to missed instruction account for most of the associations between absences and test score achievement—with unexcused absences driving those associations. Excessive absences—and particularly unexcused absences—don’t harm students mainly through missed instruction. Instead, they reflect out-of-school harms students endure that have produced inequalities for years—and will continue to do so even if students show up or parents call in.
When children who are chronically absent from school struggle academically, it is natural to connect their struggles to in-school factors like missed instruction. In 2013, then-California Attorney General Kamala Harris highlighted California’s “attendance crisis, with dire consequences for our economy, our safety, and our children” (Harris, 2013, p. 1). In 2015, the US Secretary of Education, in a joint open letter with other prominent federal officials, urged communities across the country to “support every student, every day to attend and be successful in school. . .” (p. 2), arguing that “missing 10 percent of school days in a year for any reason, excused or unexcused—is a primary cause of low academic achievement. . . .” (p. v, emphasis added). Legislative responses, such as provisions in the 2015 Every Student Succeeds Act, followed from those widely-publicized warnings, prompting states, and school districts to adopt now-prominent school accountability policies tracking “chronic absenteeism”—or missing 10% or more of school days—among K-12 students (Hough, 2019; Jordan & Miller, 2017). Such policies imply that getting children to school and in class more often will go a long way toward achieving equity in our nation’s schools. Yet available evidence suggests otherwise, as is clear from recent well-designed experimental studies in schools reporting reductions in chronic absenteeism but not improvements in academic achievement (Heppen et al., 2020; Tran & Gershenson, 2021).
In this paper, we propose reframing the attendance crisis narrative that has shaped policies sweeping the nation’s public schools. We do so by highlighting how unexcused school absences powerfully signal out-of-school crises in children’s lives. Our study begins by discussing the well-documented attendance crisis, which has captivated education researchers (Gottfried & Hutt, 2019) and some of the nation’s most prominent politicians and bureaucrats (Harris, 2013; United States Departments of Education, Health and Human Services, Housing and Urban Development, and Justice, 2015). An attendance crisis is plausible because showing up to school should have clear benefits: children who are chronically absent do struggle more in school than their peers (Whitney & Liu, 2017). However, we suggest chronically absent children would not have outcomes equal to their peers if they attended school more regularly. Advocates risk mistaking out-of-school crises for a school attendance crisis, and may consequently overstate how much simply showing up to class can improve a child’s outcomes.
Drawing on administrative records from a racially and socioeconomically diverse urban school district, we explore the associations between different types of absence (i.e., excused and unexcused) and academic achievement (N = 11,001). These data include both fall and spring elementary school test scores, allowing us to measure academic growth at different levels of excused and unexcused absences over each academic year, and a variety of child-level demographic, family, and health characteristics.
We find that associations between children’s school absences and their test scores are strong, but largely spurious. Consistent with previous work (Gershenson et al., 2017; Gottfried, 2009), we find that unexcused absences have a stronger negative association with student achievement than do excused absences. Accounting for observed prior differences among students, excused absences have little bearing on improvement in test scores, and unexcused absences have only a modest negative association with test score growth over the school year. Although we focus in the text on the associations between type of absence and test scores in third grade, supplemental analyses show quite similar conditional associations when using different academic outcomes—like classroom grades and literacy test scores—among children in kindergarten through third grade.
Revisiting the well-documented attendance crisis narrative, we then argue that chronic absence (and unexcused absence in particular) is not itself the crisis, but instead a signal of the crisis, or perhaps the myriad crises children and families confront all too frequently. Accountability policies pressure educators to encourage student attendance at school. The strategy is understandable; those who work in and oversee schools may link low academic achievement to missing classroom instruction instead of other less-visible out-of-school obstacles negatively affecting children, regardless of whether they attend school. The attendance crisis narrative—voiced in peer-reviewed journals, policy briefs, and the media alike— suggests educational inequalities would diminish greatly if students showed up to school every day. Missing extreme amounts of instruction (e.g., half of all school days) should certainly have substantial adverse impacts on children, particularly those from disadvantaged backgrounds. However, our results suggest that if there has been an attendance crisis in past years, it has been far less alarming than a series of underlying out-of-school crises that are simply reflected in poor attendance.
Finally, we discuss the study’s limits. For one, our focus on the signals absences send means estimates may suffer from unobserved variable confounding that still overstates the relationship between unexcused absence and achievement. Even so, our estimates compare remarkably well to those from quasi-experimental studies making causal claims about the effect of school attendance on students’ academic achievement (e.g., Aucejo & Romano, 2016; Carlsson et al., 2015). Our results are also preliminary. Although our sample is large and racially and socioeconomically diverse, the generalizability of our findings is limited by the age of students (elementary school) and the fact that the results are from a single school district. On the other hand, we know of nothing about this district that would render the mechanisms driving relationships between type of absence and academic achievement moot in other districts across the country. We hope our study opens a conversation about whether and how to think of attendance as an accountability and equity-enhancing metric—which future district and national work can further clarify.
School Attendance
Students who regularly attend school are more academically successful than those who do not, prompting calls to increase attendance rates in the nation’s schools (Balfanz, 2016; Gottfried & Hutt, 2019). Although the attendance crisis narrative is fairly new, claims about the signaling power of absence from school are not. For example, in a formative article on the subject, Alexander, Entwisle, and Horsey (1997) find that missing 16 versus 10 school days in first grade relates to a 30% increase in the odds of high school noncompletion, net of contextual and individual student attributes. The authors conclude that absence from school is an important early warning signal of high school noncompletion, acknowledging that absences in early grades “probably reflect as much on conditions at home as on children’s academic engagement” (p. 103).
In contrast to Alexander and colleagues, more recent scholarship often directly or tacitly treats school attendance as causally related to educational outcomes vis-a-vis the instruction students miss. In these studies, the perspective evolves from attendance as “early warning signal” to attendance as a “crisis” that is more cause than signal of educational challenges resulting from missed instruction. For example, studies suggest: students missing school are “missing out on critical learning opportunities” (Balfanz et al., 2008, p. 1); “attendance matter[s] a great deal . . . . All students should be working for regular attendance . . .” (Allensworth & Easton, 2007, p. 41); “Students and families need to be shown that a clear path to graduation exists and that increased attendance . . . will be met with the necessary supports and educational experiences that all students need to succeed” (Neild & Balfanz, 2006, p. 37). Subsequent studies continue this narrative about missed instruction causing achievement deficits, focusing instead on how school absences adversely affect math and reading achievement (Balfanz & Byrnes, 2012; Connolly & Olson, 2012; Gershenson et al., 2017; Sanchez, 2012; Smerillo et al., 2018). This literature has culminated in a recent collection of empirical articles providing “a first critical, systematic look at our nation’s current absenteeism crisis” (Gottfried & Hutt, 2019, p. 4).
What if student absenteeism is not primarily a “crisis” of missed instruction, but rather a reflection of underlying conditions both constraining families from getting children to school and limiting children’s academic achievement? Answering this question requires untangling student-initiated truancy from other reasons for missing school. Absence in elementary schools is different from absence in middle and high schools, both in the root cause of the absence and in its potential impact on student educational trajectories (Gottfried, 2009). In middle and high school, skipping class is more prevalent and teachers are more influential for persuading students to attend (Liu & Loeb, 2021; Whitney & Liu, 2017). Elementary school students instead typically miss school due to circumstances beyond their control, including parents’ need to work, limited time to commit to afterschool enrichment, transportation constraints, family decisions, and child illness (Gottfried & Hutt, 2019).
Adult family members affect a child’s attendance and academic achievement in response to or independent of actions taken by the child’s school (Gee, 2019; Gottfried & Hutt, 2019). Additionally, parents may simply be unaware of the frequency with which their child misses school (Mac Iver & Sheldon, 2019; Rogers & Feller, 2018). Even if parents are aware and connected, they may still face other barriers, such as interfering work schedules and transportation challenges, which lead them to keep their children out of school (Gottfried, 2017; Hancock et al., 2018). Health-related conditions and illnesses also account for a significant proportion of missed school days (Akinbami et al., 2011; Gee, 2019) and the effects of illness may influence students’ academic outcomes whether they come to school or not.
The types of absences children receive may signal barriers to attendance, but the clearest difference between excused and unexcused absences comes down to whether a parent or guardian communicates with their child’s school. If a parent calls, the school will generally excuse the absence. Parents who face more constraints or feel disconnected from the school community might be less likely to call or respond to school staff who call them, resulting in an unexcused absence. Highly involved parents, or those with greater resources to do so, instead call about their child, sometimes well in advance, for an excused absence. While both excused and unexcused absences are associated with lower levels of academic achievement, the size of the relationship for unexcused absences is appreciably greater than for excused absences (Gershenson et al., 2017; Gottfried, 2009). However, it remains unclear why unexcused absences should mean so much more to academic achievement than excused ones.
Research Design
We draw on administrative data from Madison Metropolitan School District (MMSD), a midsize urban school district located in Madison, WI, to understand the extent to which: (1) associations between type of school absence and learning function through missing instructional time, and (2) variation in type of absence is associated with learning due to confounders. First, we examine the unconditional relationships between test score achievement and either excused or unexcused absences. Although contact with the school about an absence does not affect the amount of instructional time students miss, excused and unexcused absences reflect different in-school and out-of-school constellations of reasons for missing class. If absences matter only due to missed instruction, they should have equivalent associations with achievement. Under the missed instruction explanation:
Hypothesis 1: Excused and unexcused absences have the same unconditional association with achievement.
Second, we consider the functional form of the relationship between absenteeism and academic achievement. The missed instruction hypothesis implies uniform learning gaps for each additional absence, or wider gaps as the number of absences increases and students lack the prior knowledge necessary to make sense of new content. Past research suggests the association between absence and achievement is linear after accounting for confounders (Gershenson et al., 2017). However, we do not assume linearity of unconditional associations between absences and achievement:
Hypothesis 2: The unconditional association between each additional excused or unexcused absence and achievement is constant or increasing across absences.
Hypothesis 2a: Any change in the unconditional association between each additional absence and achievement is the same for unexcused absences as it is for excused absences.
Finally, MMSD data allow us to condition on many factors that could confound the observed associations between school attendance and academic achievement. We can estimate academic growth over time by observing changes in students’ test scores from fall to spring in the same academic year, narrowing in on the immediate impact of additional days of missed instruction. We can also condition our estimates on a range of health conditions and other student characteristics that may contribute to both attendance and learning. If absences operate on achievement primarily through missed instruction, then we should observe little change in the association between absence and instruction net of other potential confounders.
Hypothesis 3: Conditioning on observable health, socioeconomic and demographic differences among students will do little if anything to attenuate the relationship between school attendance and academic growth.
Hypothesis 3a: Any observed attenuation due to confounders will be the same for excused and unexcused absences.
Data and Analysis
Sample
Our data come from district administrative records in MMSD, an urban school district that serves a diverse population of 27,000 students across more than 50 schools. MMSD is diverse in terms of student race and ethnicity (i.e., a little less than half the students are White, non-Hispanic), economic resources (i.e., about half of the students receive free or reduced-price lunch), parental education, linguistic origins, and disability status. We focus our study on standardized test scores in the main text and thus restrict our sample to third grade students—the earliest grade in which the district administers standardized reading and math tests. In analyses reported in the Supplemental Material, we also examine how school absences relate to literacy test scores in kindergarten through second grade and math and English language arts classroom report card grades for children in kindergarten through third grade.
We further restrict the main sample to children enrolled in third grade between the 2012 and 2013 through 2017 and 2018 school years for 175 or more days of the school year (i.e., about 90% of children in those grades, or 11,743 observations). Our final analytic sample includes 11,001 children for whom we have complete information on reading and math test scores for the third-grade school year. See Tables A1 to A4 for sample characteristics and details about missing data.
Measures
Dependent variables: Test scores
We evaluate performance on the Measures of Academic Progress (MAP) reading and math tests in third grade, the lowest grade level in which the district administers the MAP. We consider spring assessments as outcomes and standardize students’ scores within each school year to a mean of zero and a standard deviation of one. Controls for prior fall assessments support analyses of change in student achievement over the academic year.
Absences
Our main independent variable of interest is district reports of each child’s excused and unexcused absences over their third-grade school year. Elementary school teachers in MMSD take attendance at the beginning of the day, reporting students as “present,” “absent,” or “tardy.” A staff member (usually a school secretary) calls the family of each absent student from whom the school has not heard; if the family gives a reason for missing school, the child is marked “excused” and if not, the child is marked “unexcused.” The district tallies absences for each period, weighted by the total number of minutes in the period and day, to produce total counts of days absent for each student. Being tardy for class does not count toward the official tally of absences. Over the school years under study, almost all third graders in the district (98%) have at least one excused absence (with a median of six) and almost half (47%) have at least one unexcused absence (with a median of two among those with any; see Table A1).
Health, family, and other student characteristics
We also consider a range of health-related, family, socioeconomic and demographic characteristics of children that may contribute to spurious associations between school attendance and academic outcomes. From MMSD data, we include school nurses’ reports of health conditions experienced by students for each year students appear in these data, which is an unusual measure to have available for attendance research. Health ailments we measure include asthma, allergies, autism spectrum, gastro-intestinal disorders, seizures, and so on. We adjust models for the 16 most common health conditions that affect students in the district (see Table A2). We consider several characteristics of students and their families that may be associated with rates of school attendance and academic outcomes, including participation in the free or reduced-price lunch program (used as a proxy for family income), highest education achieved by a parent, student’s race/ethnicity, and gender. We also consider students’ English language proficiency and special education status.
Analysis
We begin our empirical analyses by examining the associations between type of absence and achievement (Hypothesis 1). To test for potential differences in the relationships between test score outcomes and each type of absence (excused and unexcused), we include separate measures for each type of absence in our models. To test for variation in the relationships between each additional absence and student outcomes (Hypotheses 2 and 2a), we explore several functional forms for excused and unexcused absences separately. Bayesian information criteria suggest the best fitting model is one using a continuous measure of excused absences and linear splines to distinguish among potentially varying slopes across the distribution of unexcused absences from 0 to 1, 1 to 2, 2 to 3, and more than three unexcused absences (see Table A5 and Supplemental Figure S1). Next, we add prior fall term test scores to the model to measure change in test score achievement over the course of the school year. We then determine the contributions of other factors by adding to the model a vector of health conditions, socioeconomic indicators (free or reduced-price lunch participation and parental education), demographic characteristics (race/ethnicity and gender), English language proficiency, and special education status (Hypotheses 3 and 3a). Finally, we build on the results of fully saturated models addressing Hypothesis 3 to estimate the difference in expected outcomes between (1) the estimates we observe and (2) a counterfactual in which no student has any absences.
Results
Absences and Test Scores
Figure 1, Panel A shows estimates of reading test scores by numbers of excused absences (in black) or unexcused absences (in gray). These estimates are conditional only on attendance type and school year fixed effects, reflecting what administrators, teachers, and parents may perceive as the association between achievement and missed instruction. We find that excused absences have a small but positive association with reading test scores net of unexcused absences and school year fixed effects, increasing by an estimated hundredth of a standard deviation for each additional excused absence. However, that association is not statistically significant. By contrast, unexcused absences have a strong and statistically significant negative association with reading test scores, net of excused absences, and school year fixed effects. Based on our initial model, a third-grade student with one unexcused absence should score a half of a standard deviation lower on the reading test compared to a peer with no unexcused absences, net of controls. Those with 12 unexcused absences should score over a standard deviation lower and those with 18 unexcused absences should score 1.13 standard deviations lower than those with no unexcused absences.
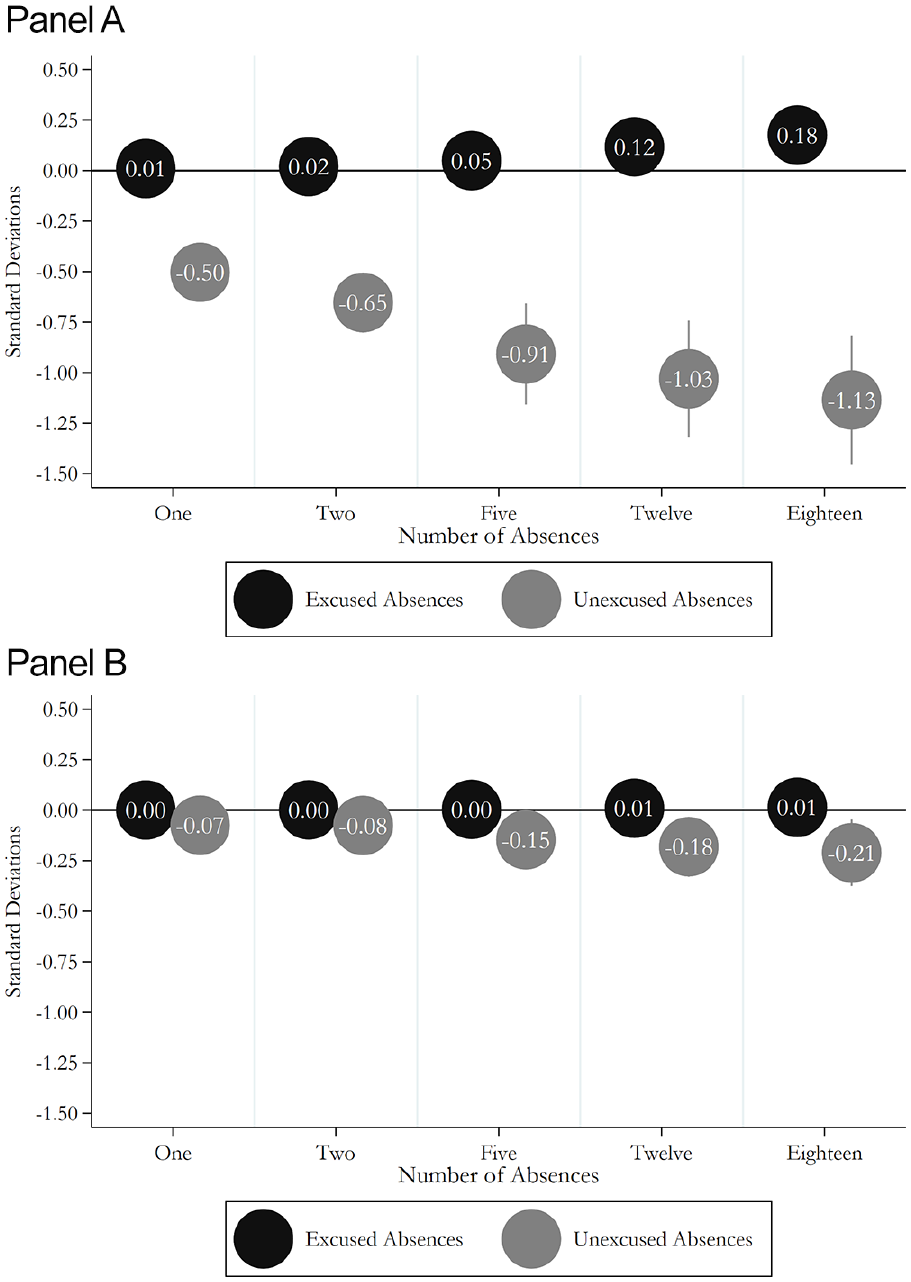
Annual reading test score achievement and growth, by number and type of absences: Panel A. Spring reading test score achievement and Panel B. Fall to spring reading test score growth.
Figure 1, Panel B shows trends in third grade annual reading growth across absences by conditioning on prior fall reading test scores. Results suggest excused absences have virtually no association with annual reading growth, conditional on unexcused absences, and school year fixed effects. Unexcused absences maintain a modest negative association with reading growth over the school year. A student with one unexcused absence can expect annual reading growth that is 7% of a standard deviation lower than a student with no unexcused absences, net of excused absences, and school year fixed effects. Those with five unexcused absences have reading growth 15% of a standard deviation lower and those with 18 unexcused absences a fifth of a standard deviation lower than those with no unexcused absences, net of controls.
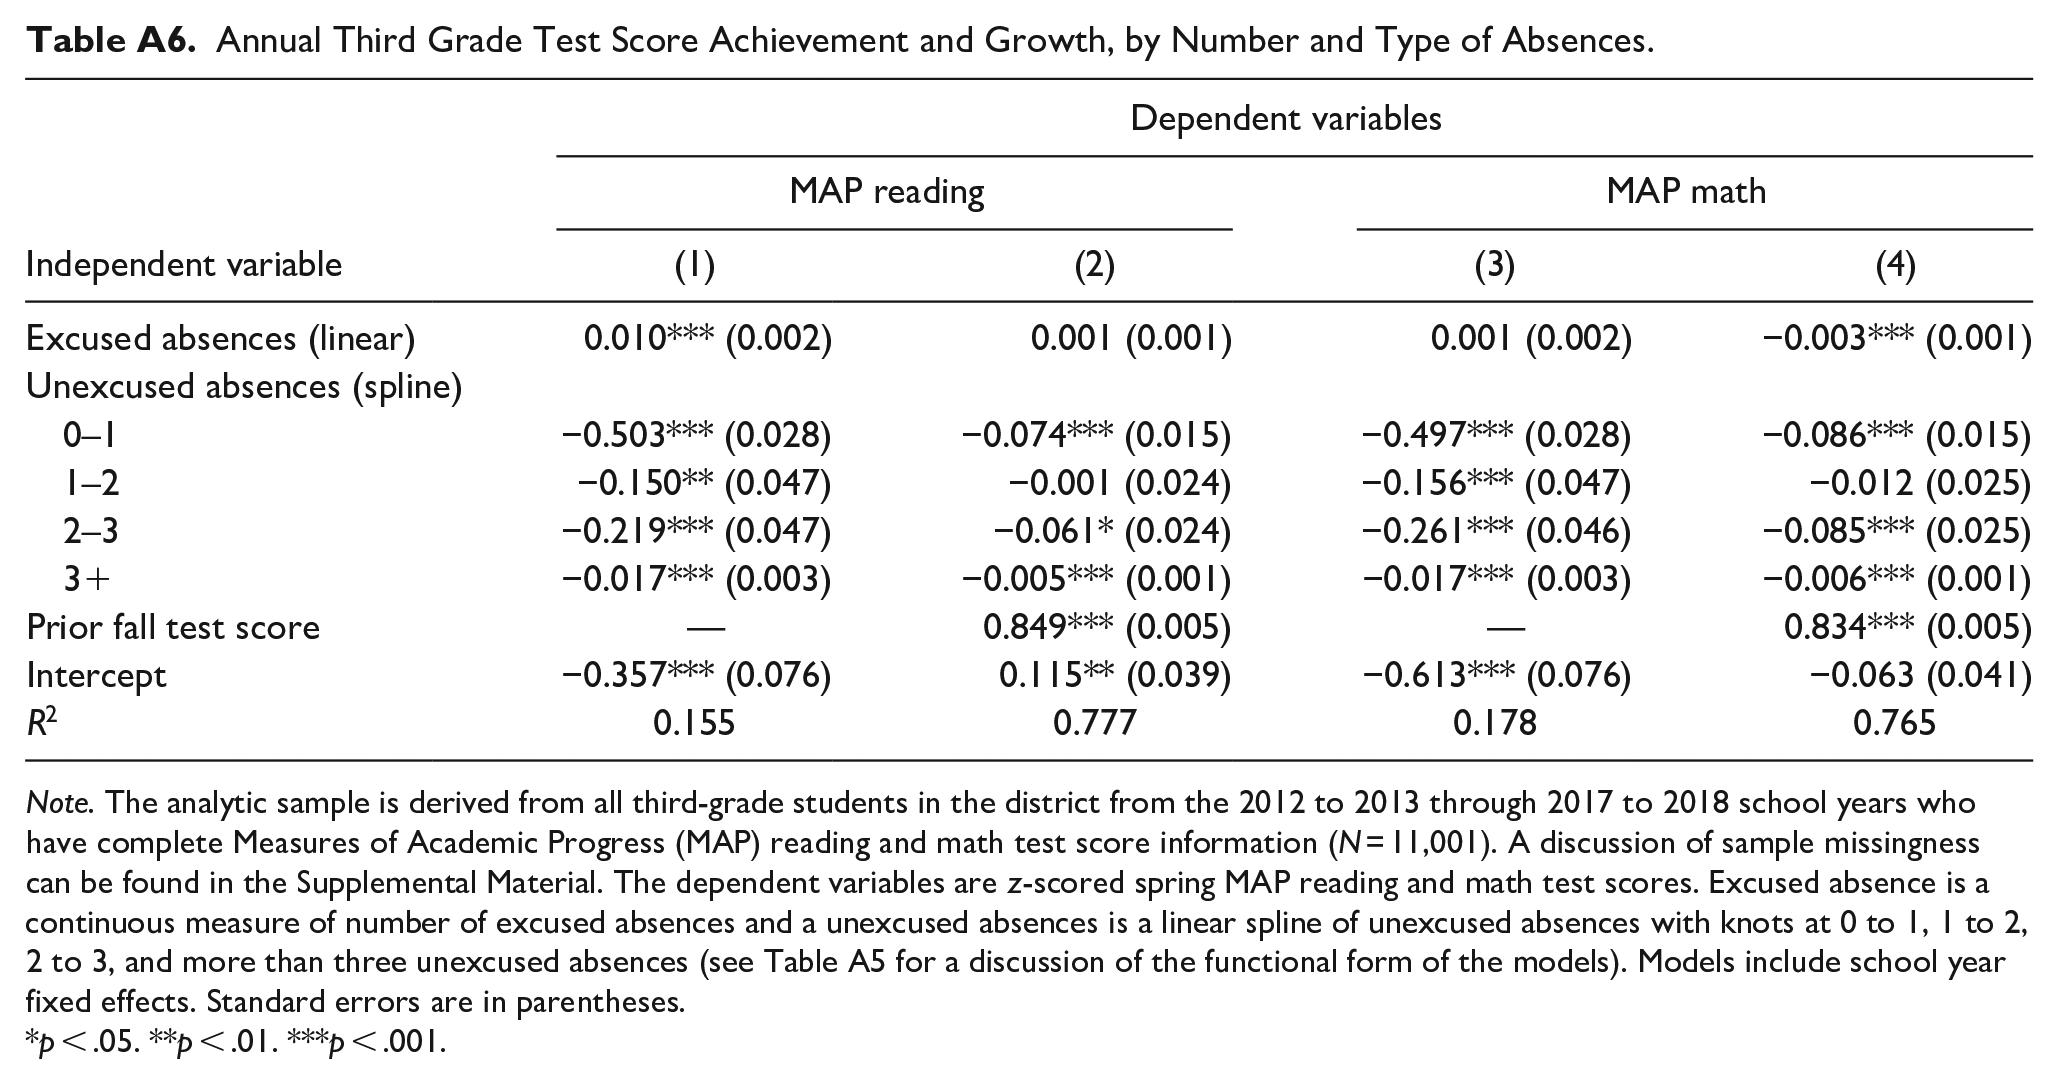
Figure 2 shows similar trends in math test score achievement (Panel A) and growth (Panel B), by number of excused and unexcused absences. Panel A suggests virtually no association between excused absences and math test score achievement, net of unexcused absences, and school year fixed effects. Conversely, the average student with one unexcused absence has a score that is a half of a standard deviation lower—and the average student with 18 unexcused absences one and a fifth lower—than a student with no unexcused absences after accounting for excused absences and third-grade school year. Accounting for prior fall math test scores (Panel B), excused absences are negligibly associated with lower growth in math test scores. Even a student with 18 excused absences has estimated annual math test score growth that is just 6% of a standard deviation lower than that of a student with no excused absences. Similar to reading test score growth, our model expects a typical student with 18 unexcused absences to score more than a quarter of a standard deviation lower than a student with no unexcused absences. Full results are displayed in Table A6.
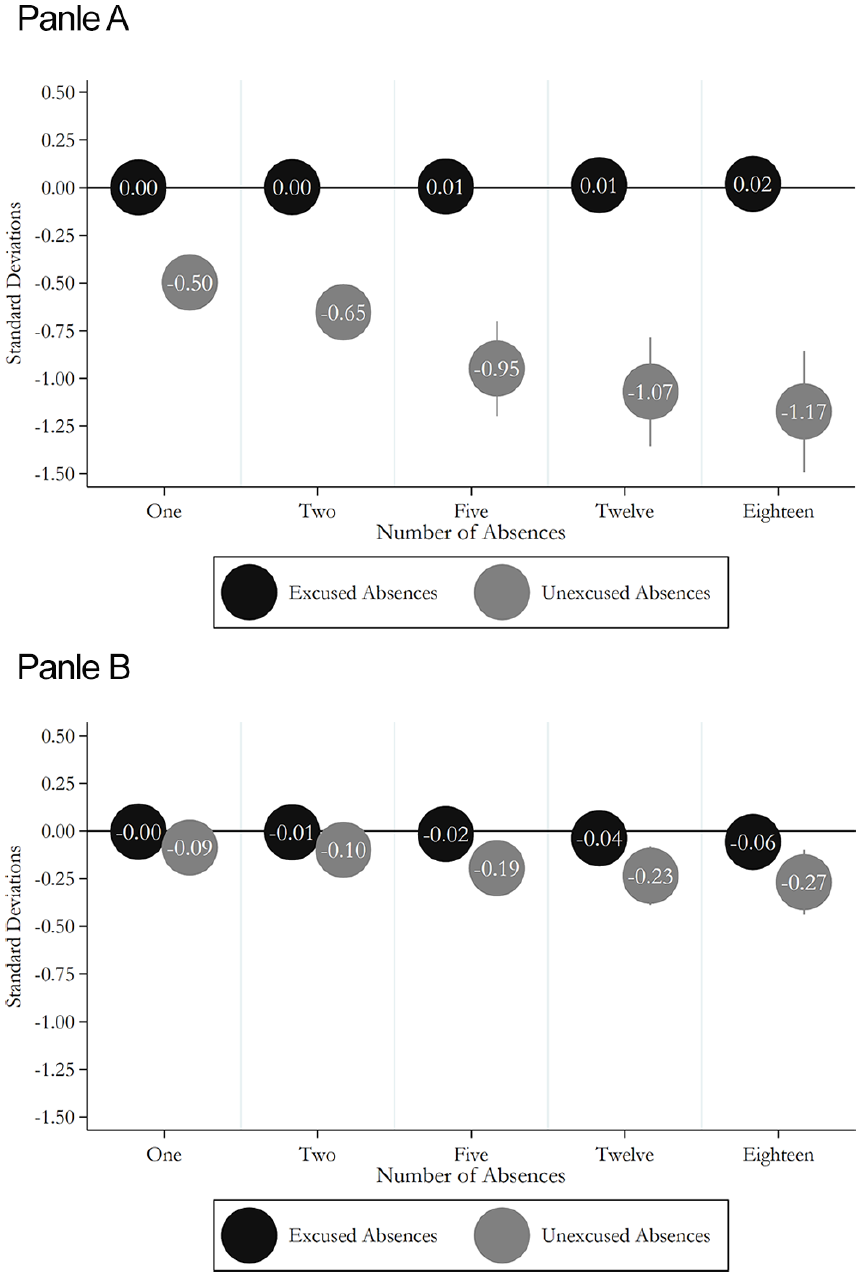
Annual math test score achievement and growth, by number and type of absences: Panel A. Spring math test score achievement and Panel B. Fall to spring math test score growth.
We next consider how health, socioeconomic and demographic covariates confound how type of absence and test score growth relate (Table 1). For both reading and math tests, covariates barely change the estimated associations between excused absences and achievement. Similarly, health characteristics of students do not change the estimated associations between unexcused absences and either reading or math test scores in any meaningful way. Socioeconomic indicators are a different story; subsidized lunch participation and parent’s highest education explain over half of the relationship between a student’s first unexcused absence and both their reading and math test score growth over the year, with more modest proportions explained as unexcused absences accumulate. Students’ race and ethnicity explain a small amount of test score growth after that. Gender, special education status, and English learner status explain negligible amounts. Accounting for these additional social and health factors implies that children with 18 unexcused absences can expect 0.15 standard deviation lower math test score growth and 0.09 lower reading test score growth than their peers with no unexcused absences over the academic year. When modeling total absences rather than excused and unexcused absences, third grade test score growth trends are similar to what we present above (Supplemental Figure S2).
Contributions of Additional Covariates to Annual Reading and Math Test Score Growth.
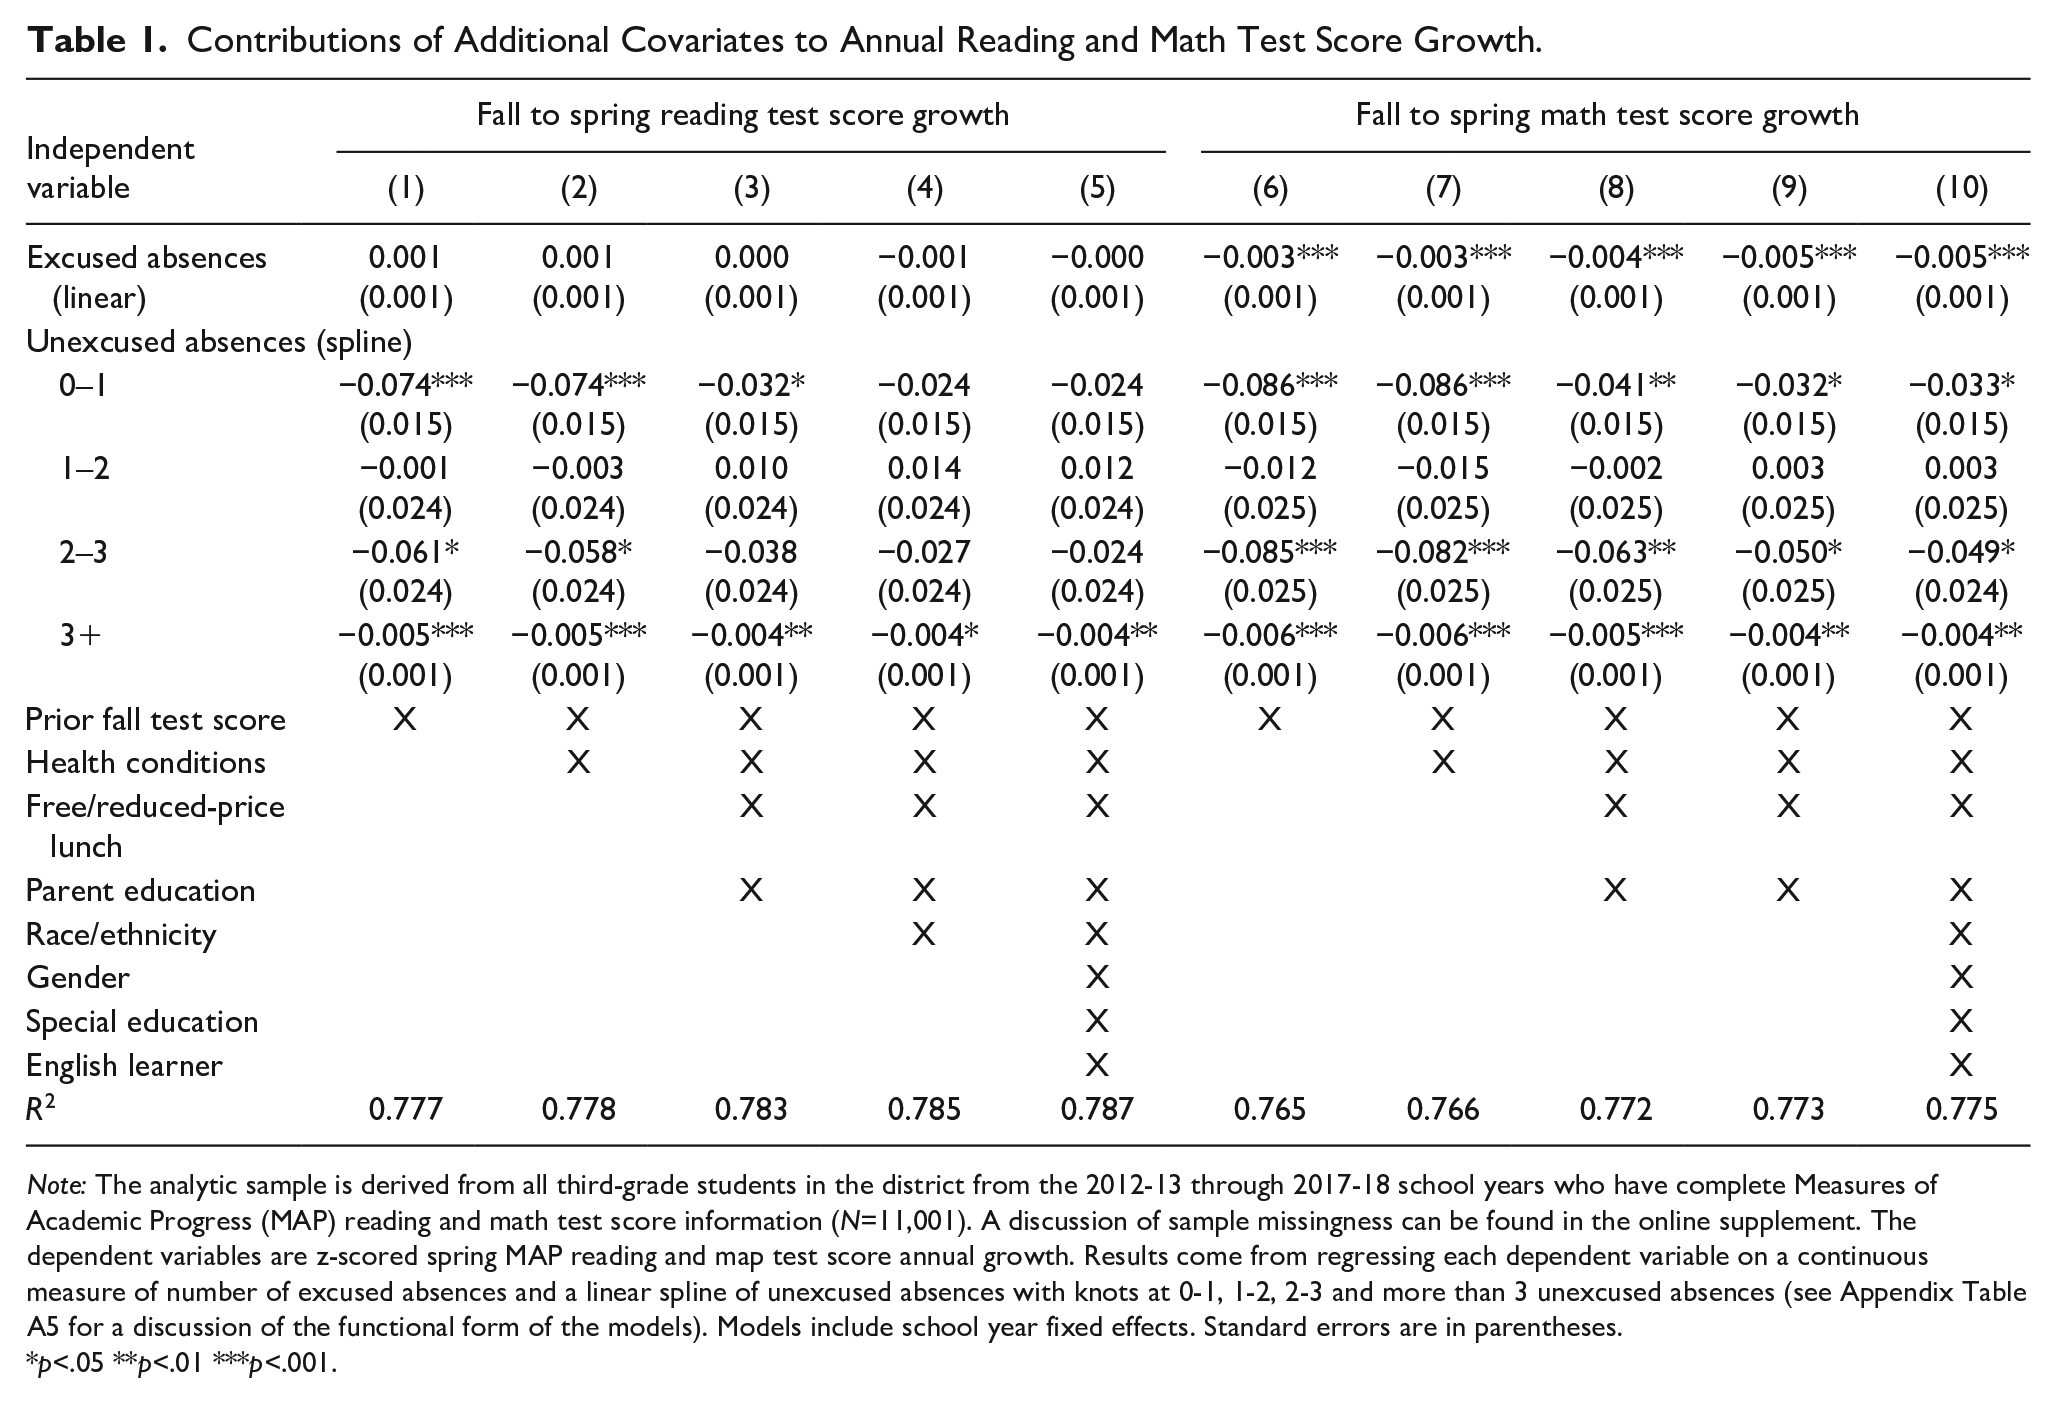
Note: The analytic sample is derived from all third-grade students in the district from the 2012-13 through 2017-18 school years who have complete Measures of Academic Progress (MAP) reading and math test score information (N=11,001). A discussion of sample missingness can be found in the online supplement. The dependent variables are z-scored spring MAP reading and map test score annual growth. Results come from regressing each dependent variable on a continuous measure of number of excused absences and a linear spline of unexcused absences with knots at 0-1, 1-2, 2-3 and more than 3 unexcused absences (see Appendix Table A5 for a discussion of the functional form of the models). Models include school year fixed effects. Standard errors are in parentheses.
p<.05 **p<.01 ***p<.001.
In robustness checks available in the Supplemental Material, we apply the same models to different academic outcomes and among students in lower grade levels. First, one might worry that absences are correlated over time and thus relationships between third grade attendance and academic growth proxy cumulative effects of attendance differences from kindergarten forward. However, we find that different types of absences relate to kindergarten literacy achievement in strikingly similar ways that they do to third grade MAP test achievement discussed above (see Supplemental Figure S3). This implies third grade fall test scores are likely not sensitive to cumulative effects of attendance in grades K-2. Results based on first and second grade literacy test scores (Supplemental Figure S4), first through third grade language arts classroom report card grades (Supplemental Figure S5), and first through third grade math classroom report card grades (Supplemental Figure S6) are also consistent with results based on third grade MAP tests we report in the main text. Finally, subgroup analyses reveal that relationships between excused or unexcused absences and third grade reading or math test scores are by-and-large consistent across racial and ethnic groups (Supplemental Tables S5 and S6) and free or reduced-priced lunch participation (Supplemental Tables S7 and S8).
The Attendance Crisis Revisited: Every Student, Every Day?
Returning to the third-grade test score models, we estimate the effect of extreme improvements in students’ attendance on levels of reading and math test score growth. Figure 3 presents expected differences between: (1) the predicted distribution of test score growth assuming observed rates of attendance and (2) the distribution under a scenario in which no student has an excused or unexcused absence for the school year. These distributions are based on predicted outcomes from models 5 and 10 reported in Table 1, which account for excused and unexcused absences, prior fall test scores, and a vector of student-related covariates. The distribution plotted with a solid line is simply predicted scores from those models. The distribution plotted with a dashed line is predicted scores when we set every student’s number of excused and unexcused absences to zero but leave other covariates unchanged. Results reported in Figure 3 suggest that the third-grade reading test score distribution would change very little if all students attended school every day they were enrolled, and the third grade math test score distribution would only improve marginally under district-wide perfect attendance. If disappointing levels of academic growth is the problem, increasing rates of attendance does not appear to be the solution.
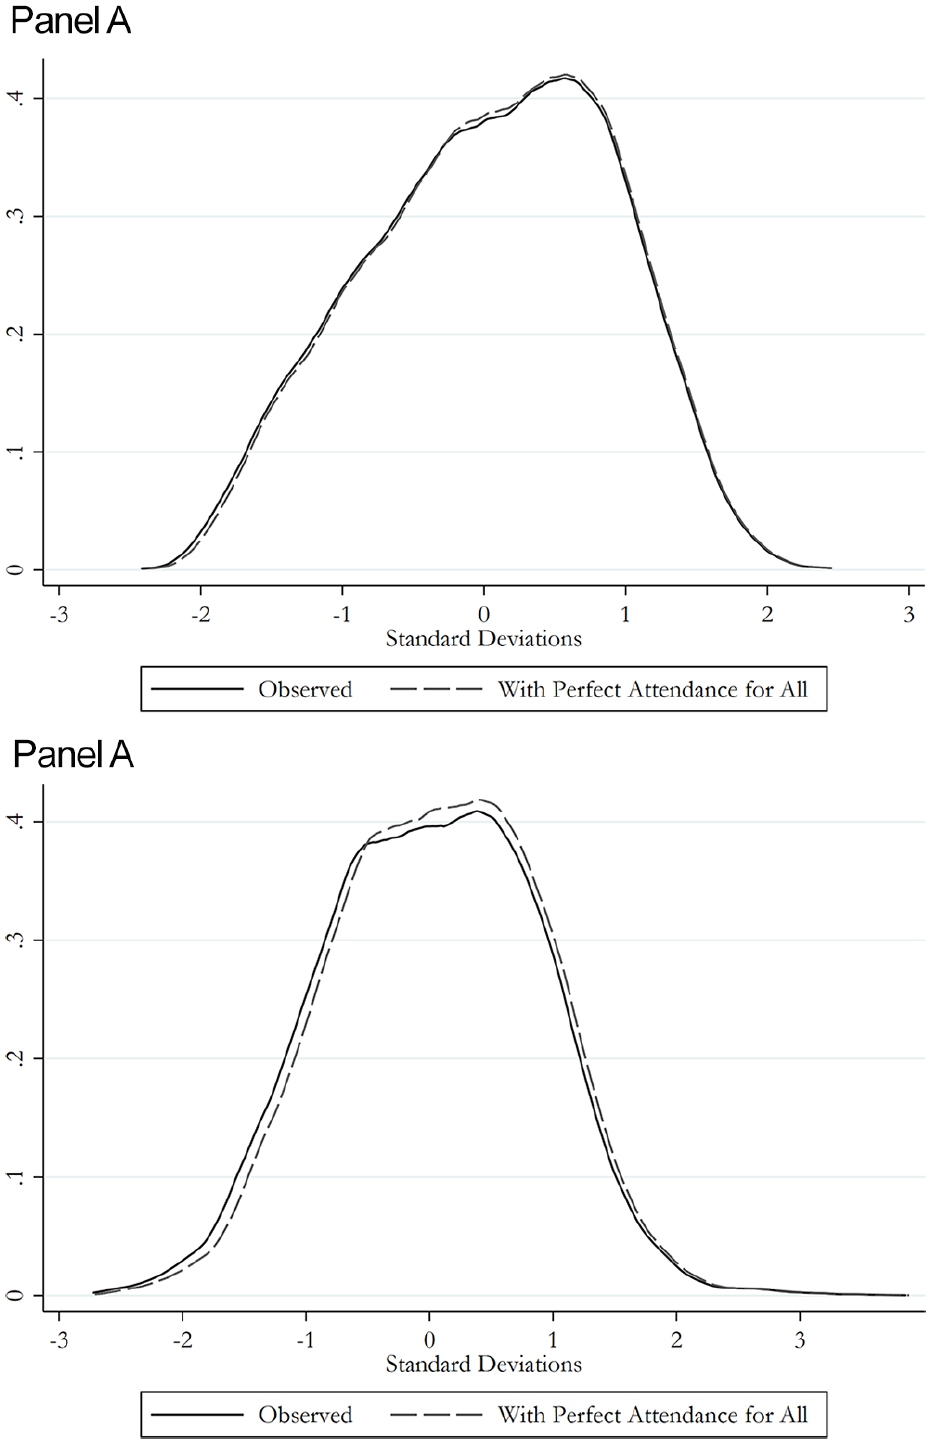
Change in annual test score growth distributions under perfect attendance: Panel A. Fall to spring reading test score growth distributions and Panel B. Fall to spring math test score growth distributions.
Discussion
Chronically absent children do much worse academically than their peers with fewer absences. A popular narrative, advanced by policymakers and reinforced in scholarly literature, is that missed instruction drives the large and negative associations between chronic absenteeism and academic outcomes. Focusing on missed instruction seems straightforward and compelling; students need to be in school to learn. If students miss 3 to 4 weeks of school, teachers; and staff cannot do their jobs. Improving attendance among chronically absent students should thus increase achievement and reduce inequalities—to the extent that less advantaged students are more likely to be chronically absent.
The process by which we evaluate connections between missed instruction and academic achievement helps reframe this narrative. If student attendance primarily impacts achievement simply through increased exposure to instruction, we would expect that:
The association between attendance and achievement would be independent of the type of absence students incur (excused or unexcused);
The association of each additional absence with attendance would be uniform or increasing across absences; and
Conditioning on other characteristics of students and their families would do little to attenuate the association between attendance and achievement.
Our analyses do not support any of these claims. Based on our findings, we argue that unexcused absence from elementary school is a very strong signal of other challenges children and their families experience; absences themselves have only a weak impact on academic achievement.
We conclude that the signaling power of unexcused absences is appreciably stronger than the signal of total or excused absences. For example, our estimates of math test score achievement in Figure 2 suggest that, accounting only for excused absences and school year fixed effects, an average student missing 18 days of school without an excuse scores a shocking 1.17 standard deviations lower on the math test than an average peer with no unexcused absences. Conditioning on past achievement and factors outside of the control of the school (like family socioeconomic status), 18 unexcused absences is associated with at most a 0.15 SD drop in math achievement (calculated from estimates reported in Table 1). While the association is substantively meaningful, factors we observe explain 88% of the association between 18 unexcused absences and math achievement.
Our calculations of the variance in learning explained by unexcused absences are lower bound estimates, since additional noninstructional factors may explain even more of the association. We can imagine many plausible unobserved confounds remaining in the associations between unexcused absences and academic achievement, some of which happen away from school and others more complexly intertwined with schools. For example, parents who reach out to school staff and excuse an absence may also be in close contact with their child’s teacher, ensuring homework, and in-class assignments get sent home either in advance or promptly following the child’s return to class. When parents do not keep in touch with the school or teacher, children might never complete assignments they missed during their absence. Unresponsive parents might also lead their children to be weary of educators (intentionally or not), affecting how students function in class when they do attend. Another plausible unobserved confound is that teachers may hold negative views of families with children who miss school without an excuse, which could affect a child’s learning through degrading relationships when they return to class. While all these examples relate to a child’s school experience, they still represent pathways to learning differences apart from missed instruction.
That implies annual missed instruction, represented by the remaining estimate of −0.15 standard deviations, accounts for at most 12% of the total association between 18 unexcused absences and math test score achievement. Trying to change such a modest (or even smaller) missed instruction effect would only impact the 10% of children in the district who have 18 or more absences of any kind each year. And note that about 40% of that 10th of children also includes those with no unexcused absences but many excused ones (see Table A1)—a group who, all else equal, has comparable test scores to their peers with no absences.
In fact, our unconditional estimates suggest one unexcused absence has far greater power to signal poor reading and math test scores over the school year than do 18 excused absences. These findings imply a strong signaling power of unexcused absences to detect educational inequalities functioning through pathways other than missed instruction, but they also suggest a limited reach of accountability policies encouraging children to show up at school in the hopes of curbing even modest achievement growth decrements.
Our point estimates are well aligned with those reported across other attendance-achievement studies (Figure 4). This raises an important question: do associations of these magnitudes warrant the widespread attention attendance has received as a crucial policy lever to increase student achievement in school? Among quasi-experimental studies reported in Figure 4, the weighted average of regaining 20 days of missed instruction suggests a 0.12 to 0.20 standard deviation increase in learning. The upper end of that range is smaller than the reported effect size (ES = 0.26 SD) for socioemotional learning interventions targeted for entire schools (Belfield et al., 2015), not just the 3% of children nationally who miss 20 or more days of school each year. Furthermore, the estimate assumes chronically absent children are essentially the same as observationally similar peers who are not—something we think is rather unlikely.
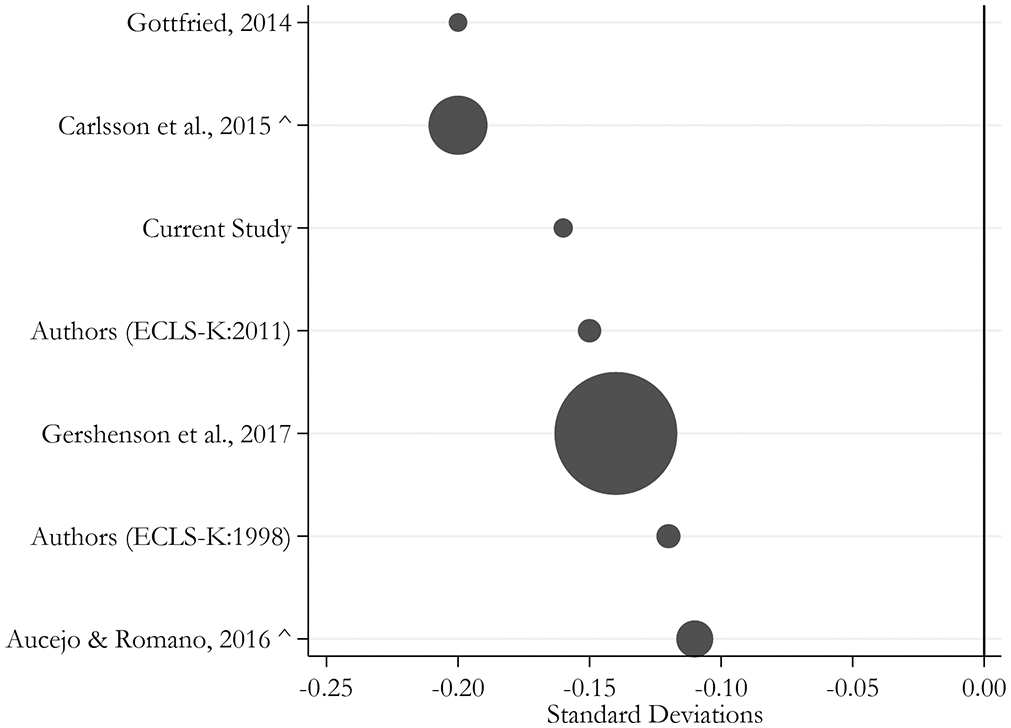
Associations between chronic absenteeism and math test scores across multiple studies.
We conclude that school absences, and particularly unexcused absences, mostly reflect noninstructional aspects of children’s educational and home lives. Even under the unlikely scenario of district-wide perfect attendance, our models suggest that test score growth distributions would change little, if at all. Considering these are correlational models not accounting for other unmeasured confounders that could further attenuate the association between absences and achievement, we view our models as generous estimates of change under perfect attendance. If our interpretation is correct, the familiar and troubling relationship educators observe between chronic absence and academic achievement has little to do with an attendance crisis of missed instruction and is much more a result of crises going on in children’s and their families’ lives that cause them to miss school.
Our reframing of the US attendance crisis is reinforced by evidence from experimental studies evaluating interventions to improve student attendance and achievement. For example, sending parents text messages about their child’s attendance leads to increased attendance but has no effect on academic achievement (Heppen et al., 2020). Experimental evidence for a popular truancy prevention program, Check and Connect, shows mixed results. For example, one study shows appreciable benefits to attendance, mixed effects on test scores, no effect on grades, and a slight reduction in course failures (Guryan et al., 2016). Finally, a recent paper on teacher-student race matching—capitalizing on the Tennessee class size RCT—finds Black students matched to Black teachers have lower rates of absence but do not experience a concurrent benefit in academic achievement (Tran & Gershenson, 2021). The lack of experimental evidence showing a relationship between increased attendance and more positive academic outcomes reinforces our view that addressing the attendance crisis, short of addressing the underlying causes of the crisis, will not result in improvements in academic outcomes—let alone appreciable reductions in educational inequality.
Whether and how we choose to think about school attendance as a “crisis” matters for educational policy. Thirty-six states and many more school districts have added students’ school attendance to their accountability metrics (Jordan & Miller, 2017). Recent evidence from California suggests schools flagged as “low-performing” based on chronic absenteeism and academic achievement differ dramatically from the ones flagged based on academic achievement alone (Hough, 2019). Our findings suggest tying accountability to attendance in elementary school may be less productive than policymakers expect. Attendance in our sample only weakly relates to academic outcomes, conditional on student attributes, and earlier academic achievement. However, research in the Madison Metropolitan School District (Pyne et al., 2018) and elsewhere (Ehrlich et al., 2013; Gee, 2019; Grigg et al., 2015; Ready, 2010) shows that attendance is strongly related to student background attributes like family income, race or ethnicity, and parental education. We worry that incorporating attendance into accountability frameworks punishes schools serving less advantaged and underserved communities—and may direct valuable time and resources to improving attendance, with little effect on student learning.
Readers should be cautious in applying the lessons learned for elementary school students in this single school district to other grades and contexts. The district is racially and socioeconomically diverse, implements rigorous standardized testing schedules (in fall and spring each year), and offers detailed accounts of students’ attendance, health conditions, and more. Even so, every district has its idiosyncrasies; with only one district, we cannot average across them. Nonetheless, no obvious features of the district suggest mechanisms producing the signals unexcused absences send about children in this sample are fundamentally different than elsewhere. The ways family financial constraints, work schedules, and school communication strategies impact children’s learning are probably similar in most places. However, we cannot test that claim with the data at our disposal. More clarity on the power of those signals will come from replications in other school districts, and across the country as a whole.
Conclusion
By suggesting school absences are mostly a signal of challenges children and families face outside of missed instruction, we hope to change the conversation about the attendance crisis in our nation’s schools. Based on our findings—and supporting evidence from other similar attendance studies—we are both skeptical of the academic and equity returns to markedly improving school attendance and struck by the potential importance of considering school absences (particularly those that go unexcused) as signals of the challenges children and families confront apart from missed instruction.
Perhaps “everyone knows” school absences are important beyond just classroom learning. If so, we are puzzled by the overwhelming focus on the causal effects of missed instruction and the neglect of important signaling aspects of absences. In our view, the causal estimates are too modest—and occurrences of sufficiently high numbers of absences meriting intervention too sparse—to justify the policy response those estimates have incurred. Studies focusing exclusively on the effect of school absence on achievement—and those calling to improve student outcomes by addressing attendance—miss important opportunities to highlight the root causes of students’ educational challenges associated with school absences.
We do not suggest ignoring absence from school. For instance, our estimates imply missing an extreme amount of instruction—like half of all school days—is detrimental for children—especially those from disadvantaged and historically underserved backgrounds. Such extreme instances of school absences are quite rare in normal times, but have become much more common during the SARS-COV-2 pandemic. Conversations about attendance policies normally do not focus on such large quantities of absences, but rather on the impacts among students missing 10% or more of school days in a year.
We suggest policymakers and researchers orient attendance work toward the interpretation of Alexander et al. (1997)—who recognize that absence from school signals many challenges beyond missing classroom instruction. Orienting to the “warning signal” approach—for example, attending to the powerful signal of a single unexcused absence—may motivate researchers and policymakers to pursue work tackling the challenges children face underlying attendance and academic achievement. A parent’s decision to call and report an absence, or respond to the school’s reminder to do so, is unlikely to have much of a direct effect on student learning. It is, however, a signal worth heeding.
Supplemental Material
sj-pdf-1-epx-10.1177_08959048211049428 – Supplemental material for The Signaling Power of Unexcused Absence from School
Supplemental material, sj-pdf-1-epx-10.1177_08959048211049428 for The Signaling Power of Unexcused Absence from School by Jaymes Pyne, Eric Grodsky, Elizabeth Vaade, Bo McCready, Eric Camburn and Dominique Bradley in Educational Policy
Footnotes
Appendix A
Annual Third Grade Test Score Achievement and Growth, by Number and Type of Absences.
| Independent variable | Dependent variables | |||
|---|---|---|---|---|
| MAP reading | MAP math | |||
| (1) | (2) | (3) | (4) | |
| Excused absences (linear) | 0.010*** (0.002) | 0.001 (0.001) | 0.001 (0.002) | −0.003*** (0.001) |
| Unexcused absences (spline) | ||||
| 0–1 | −0.503*** (0.028) | −0.074*** (0.015) | −0.497*** (0.028) | −0.086*** (0.015) |
| 1–2 | −0.150** (0.047) | −0.001 (0.024) | −0.156*** (0.047) | −0.012 (0.025) |
| 2–3 | −0.219*** (0.047) | −0.061* (0.024) | −0.261*** (0.046) | −0.085*** (0.025) |
| 3+ | −0.017*** (0.003) | −0.005*** (0.001) | −0.017*** (0.003) | −0.006*** (0.001) |
| Prior fall test score | — | 0.849*** (0.005) | — | 0.834*** (0.005) |
| Intercept | −0.357*** (0.076) | 0.115** (0.039) | −0.613*** (0.076) | −0.063 (0.041) |
| R 2 | 0.155 | 0.777 | 0.178 | 0.765 |
Note. The analytic sample is derived from all third-grade students in the district from the 2012 to 2013 through 2017 to 2018 school years who have complete Measures of Academic Progress (MAP) reading and math test score information (N = 11,001). A discussion of sample missingness can be found in the Supplemental Material. The dependent variables are z-scored spring MAP reading and math test scores. Excused absence is a continuous measure of number of excused absences and a unexcused absences is a linear spline of unexcused absences with knots at 0 to 1, 1 to 2, 2 to 3, and more than three unexcused absences (see Table A5 for a discussion of the functional form of the models). Models include school year fixed effects. Standard errors are in parentheses.
p < .05. **p < .01. ***p < .001.
Acknowledgements
We thank Jennifer Cheatham, John Diamond, Bonnie Doren, Stacy Lee, Kelly Ruppel, Marcy Sorensen, and Andrew Statz for comments on earlier versions of the manuscript. This study also benefited from critiques and questions from participants in the Interdisciplinary Training Program in Education Sciences seminar at University of Wisconsin–Madison, the Center for Research on Educational Opportunity seminar at the University of Notre Dame, and a session of the Sociology of Education Special Interest Group at the American Educational Research Association 2019 Annual Conference. Conclusions in this paper do not necessarily reflect the views of the Madison Metropolitan School District, the Wisconsin Center for Education Research, or the Institutes of Education Sciences.
Declaration of Conflicting Interests
The author(s) declared no potential conflicts of interest with respect to the research, authorship, and/or publication of this article.
Funding
The author(s) disclosed receipt of the following financial support for the research, authorship, and/or publication of this article: This research was supported by the Wisconsin Center for Education Research and the Madison Metropolitan School District under the Madison Education Partnership; the first author also received support from the Institute of Education Sciences, U.S. Department of Education, through Award No. R305B090009 to the University of Wisconsin-Madison.
Supplemental Material
Supplemental material for this article is available online.
Author Biographies
References
Supplementary Material
Please find the following supplemental material available below.
For Open Access articles published under a Creative Commons License, all supplemental material carries the same license as the article it is associated with.
For non-Open Access articles published, all supplemental material carries a non-exclusive license, and permission requests for re-use of supplemental material or any part of supplemental material shall be sent directly to the copyright owner as specified in the copyright notice associated with the article.