
Abstract
Student removal became an increasingly utilized form of discipline since the implementation of zero-tolerance policies during the early 1990s. Evaluative studies have consistently found negative relationships between student removal and academic success. Majority of cases regarding student removal are for minor and non-violent offenses and literature in this field suggests that teachers’ biases and cultural misreadings widen racial disparities in school discipline and academic performance. Our study estimates the effects of suspensions, school-related arrests, and expulsions under zero-tolerance by exploiting within-school variation in school mean proficiency rates of Asian, Hispanic, Black, and White racial subgroups over a 3-year period. Our findings reaffirm consistent evidence that exclusionary policies have negative effects on academic outcomes. We also find evidence of differential effects by racial subgroup. The paper concludes with a discussion and policy implications.
Keywords
Introduction
Studies examining punitive punishments’ impact on student academic success have consistently found negative outcomes (Insley, 2001; MacAllister, 2016; Skiba et al., 2014). Punitive discipline practices involve using punishment to address student misbehavior. Commonly practiced public-school punitive methods include corporal (physical) punishments, restraint, arrest, and exclusionary punishments where students are removed from classrooms or school buildings (MacAllister, 2016). States individually make discussions about which disciplinary practices are acceptable for its schools. For example, most states in the U.S. have removed the use of corporal punishment as an acceptable form of discipline.
Historically, U.S. public school educators and administrators have implemented punitive discipline practices to address student misbehavior (Insley, 2001; Kafka, 2011). Exclusionary punishments, in particular, were utilized more frequently after the adoption and implementation of the “Guns Free School” Act of 1994 (Skiba et al., 2014). This Act addressed disciplinary infractions with a zero tolerance or tough-on-crime approach. Public schools were then mandated to implement those zero tolerance policies for gun, drug, and violent-offenses or risk losing federal funding (Skiba et al., 2014). Administrators were obligated to permanently remove (or remove for a year) students who committed gun and drug-related infractions (Levesque, 2011).
Evaluative studies found that severe offenses had less racial disparities because of the standardized implementation protocol (Insley, 2001; Skiba et al., 2014). Unfortunately, zero tolerance expanded beyond severe infractions and soon encompassed moderate and discretionary offenses (Rudd, 2014). “In 1997, zero tolerance approaches to discipline contributed to the suspensions of over 3.1 million students, mostly for non-violent behavior, and to the expulsions of over 87,000 students nationwide in 1998” (Insley, 2001, p. 1054). Contemporary studies also confirmed that of the total cases of exclusionary punishments in public schools, the majority of offenses were minor, such as disobedience and disrespect, and determined at the discretion of educators and administrators (Morris, 2015; Skiba et al., 2014). As opposed to the standardized gun and drug-related offenses, these minor discretionary offenses had significant racial and gender disproportionalities due to educators’ and administrators’ implicit biases and cultural misreadings (Insley, 2001; Morris, 2015; Skiba et al., 2014).
Growing cases of exclusionary punishments became a cause for concern not only due to racial inequalities, but also for their deleterious effects on student outcomes. Exclusionary punishments, particularly under zero tolerance, negatively impacted student performance and had detrimental short- and long- term effects on students. Exclusionary punishments are associated with “lower academic achievement at both the school level and the individual [student] level, as well as increased risk of negative behavior over time” (Skiba et al., 2014, p. 641).
Contemporary literature on school discipline demonstrates that exclusionary punishments, both within and outside of zero tolerance policies, have negative effects on students’ academic outcomes and general wellbeing. The objective of this study is to investigate the effects of exclusionary punishments on mean school proficiency rates. We investigate how exclusionary punishments might disproportionately affect average school proficiency rates of four racial subgroups (Asian, Hispanic, Black, and White) in mathematics and reading. Specifically, we estimate the effect of single out-of-school suspensions (single OSS), multiple out-of-school suspensions (multiple OSS), school-related arrests, and expulsions under zero tolerance on Ohio’s public school proficiency rates disaggregated by race. School proficiency rates indicate an average percentage of students at each school who achieved a score of proficient or above. We hope this study will help administrators, policy actors, and educators in deciding appropriate interventions for various racial subgroups.
Literature Review
Studies on exclusionary punishment became more prevalent after the passage of the Guns Free Schools Act of 1994. Exclusionary punishments continue to be used in schools, and so scholars, policy actors, and research organizations continue to investigate its effectiveness. Some of the most consistent trends in school discipline data are racial and gender disparities and student and school-level academic outcomes (McFadden et al. 1992; Skiba et al., 2014). Those studies typically focused on the indicators, or predictors, for students who are most likely to receive exclusionary punishment, as well as analyses as to why certain groups were overrepresented in the data.
Bryan et al.’s (2012) study investigated predictors of exclusionary discipline via rates of referrals and its relationship to academic subjects (math and English). This study found that gender and race were statistically significant indicators for referrals. For English and math classes, gender was an indicator for referrals and race was only a predictor for English classes. Ultimately, Bryan et al. held that students who disproportionately receive referrals were also likely to be referred to the counselor. Based on the study Bryan et al. held that schools with counselors are typically in contact with students who disproportionately receive referrals and are faced with exclusionary punishments. More specifically, boys and Black students are overrepresented and are more likely to come into contact with the school counselor. Therefore, counselors could play an indispensable role by creating programs and seeking advocacy efforts to help school personnel “overcome behavior patterns, subject context concerns, and attitudes or systemic barriers that interfere with academic success and persistence in school (p. 185).”
The disproportionality in school discipline by race and gender has existed before the implementation of zero-tolerance school discipline policies. For example, McFadden et al.’s (1992) study analyzed how race and gender predicted disparities in school discipline. This study found that Black students in that particular school district were significantly overrepresented for referral rates. They also found that, compared to Black pupils, White pupils were more frequently referred for acts such as defiance of school authority, fighting, and bothering others, yet received fewer rates of corporal punishment. The authors acknowledge that though it is possible that Black pupils engaged in more severe episodes of these behaviors than White students, school discipline records (as well as district staff) did not provide any evidence to prove this claim—therefore “some form of bias does appear to have existed” (p. 144).
Zero tolerance approaches to discipline did not create the discipline gap, but they certainly exacerbated prevailing disparities. As this issue persisted, scholars began investigating possible explanations which led to scholarship on implicit bias. The Ohio State’s Kirwan Institute produced several impactful studies investigating implicit biases and their manifestations in various fields, including education. Their 2016 report confirmed that teacher bias is still prevalent within schools and negatively impacts students’ lives. The report refers to multi-dimensional implicit bias model, biases + situational decisions (McIntosh et al., 2014). In other words, implicit bias coupled with situational decisions contributes to teachers’ unequal administration of school discipline. The report recommended that teachers participate in professional development. Although this cannot eradicate implicit bias in its entirety, it will “create an institutional environment in which it is clear that understanding bias and its effects is critically important. The long-term return on investment is inestimable” (p. 34). The prevalence of implicit bias and school discipline may cause a degree of concern because the very people entrusted to protect students are contributing to an alarming problem. Nance (2015) holds that teachers generally do have the best interests of their students at heart, and so implicit biases can be a reasonable explanation for this paradox: Implicit biases function automatically and often in ways that a person would not explicitly endorse if the person was consciously aware of the biases. . .But as we unconsciously rely on racial stereotypes and attitudes to help us make quick decisions, those stereotypes and attitudes bias our perceptions, judgments, and ultimately our decisions without our awareness or intent (p. 1073).
The prevalence of exclusionary punishment coupled with its inherent racial and gender disparities is concerning because of the impacts on students. Scholarship about the effects of exclusionary discipline overwhelmingly finds it ineffective. Some scholars have followed the students impacted by exclusionary punishment since the 1990s. For example, Insley (2001) wrote about students experiencing exclusionary punishment throughout that time, and in his 2001 article explained that, “policymakers, educators and parents should be very concerned with the long-term implications of denying educational opportunities to millions of children particularly when the effectiveness of these policies in ensuring school safety is highly suspect” (1064). Skiba et al.’s (2014) study corroborated this sentiment made years before. “Suspensions and expulsions are associated with lower academic achievement at both the school level (Davis & Jordan, 1994; Rausch, et al., 2005) and the individual level (Arcia, 2006; Mendez et al., 2002; Rocque, 2010), as well as increased risk of negative behavior over time (Tobin et al., 1996)” (Skiba et al., 2014, p. 641).
It is important to explore the literature on the disparate impact of disciplinary exclusion from school. Existing research has revealed a connection between exclusionary discipline like suspensions and expulsions, and student outcomes such as achievement, retention, absenteeism, and dropping out of high school (Balfanz et al., 2015; Lacoe & Steinberg, 2019; Losen & Gillespie, 2012; Noltemeyer et al., 2015; Rumberger, 2011; Rumberger & Lim, 2008; Rumberger & Losen, 2016). Employing both student fixed effects and instrumental variable (IV) methods, Lacoe and Steinberg (2019) show that being suspended decreases student’s academic achievement on both math and ELA standardized tests. In a review of 25 years of research on high school dropouts, Rumberger and Lim (2008) examined 49 analyses of the relationship between misbehavior and dropping out, most of them at the high school level. Among the 31 analyses conducted at the high school level, 14 found misbehavior was significantly associated with higher dropout and lower graduation rates. Of the 17 analyses at the middle school level, 14 found misbehavior in middle school was significantly associated with higher dropout and lower graduation rates in high school.
Rumberger and Losen (2016) analyzed suspensions and expulsions using data from the Education Longitudinal Study of 2002 (ELS: 2002) and found that students who reported either an in-school or out-of-school suspension in the first semester of 10th grade were much less likely to graduate from high school than students with no suspensions. Only 71% of 10th graders who received a suspension graduated from high school, compared to 94% of 10th graders who did not receive a suspension. Being suspended is associated with a 23 percentage-point decrease in the likelihood of a student graduating. Furthermore, Noltemeyer et al. (2015) conducted a meta-analysis of 12 studies examining the relationship between suspensions (nine only examined out-of-school suspension) and dropout. The estimated effect size across the 12 studies was a statistically significant .28, approximately an 11 percentage-point increase in the probability of dropping out. Similarly, Balfanz et al. (2015) showed that improving achievement in core academic areas and reducing chronic absenteeism increased high school graduation rates. Balfanz et al. (2015) pointed to the benefits gained from tackling issues of absenteeism and also highlighted how being suspended even once in grade nine correlates with a doubled risk for dropping out.
Students who are suspended may be less likely to graduate from high school for other reasons besides being suspended (Rumberger & Losen, 2016). For example, students who are suspended may have poorer attendance and lower grades and be more likely to be retained than students who are not suspended—all factors associated with failure to graduate from high school (Rumberger, 2011). However, even after they controlled for a series of variables associated with both being suspended and dropping out, Rumberger and Losen (2016) estimated that, in the U.S., the graduation rate among suspended students if they had not received a suspension was 80%, while the estimated graduation rate for suspended students was 68%, which is still 12 percentage points below the estimated graduation rate if they had not been suspended. In other words, this suggests that suspension increases the risk of not graduating from high school in the U.S. by 12 percentage points. All of these studies provide some evidence that mandated discipline may be harming students and/or exacerbating racial achievement gaps. We hope to add to the literature by not only analyzing the impact of suspensions on achievement but also the impact of other mandated exclusionary punishments.
Justification of CRT Framework
Our study addresses a problem where both policy and race interact and so, we will utilize Critical Race Theory (CRT) to analyze our study’s results. CRT is commonly used to “examine and challenge ways that race and racism implicitly and explicitly impact social structures, practices, and discourses” (Yosso, 2005, p. 70). In this case, teachers’ unjust implementation of school discipline policies creates a phenomenon where vulnerable students are systematically removed from learning. For example, Skiba et al. (2002) found that White students were more likely to be sent to the office for more objective offenses like drug use, vandalism, leaving school without permission etc., while “African American students were referred more often for disrespect, excessive noise, threat, and loitering, which are behaviors with more subjective connotations” (p. 641). Race matters in how frequently educators and administrators punish their students and students who are severely punished are expected to have negative short and long-term negative outcomes. This disparity by race was one of our motivations to investigate the impact of exclusionary punishments by racial subgroups.
Zero tolerance policies were marketed as a color-blind tool and a one-size-fits-all solution. During the policy implementation phase, however, literature shows that educators’ implicit racial biases determine who is punished and the severity of punishment. Black students are continuously over-represented in school discipline records and that disparity has increased after the Guns Free School Act of 1994 passed. Race “continues to be a significant factor in determining inequity in the U.S,” and scholarship has shown that teachers’ implicit racial biases are partially responsible for school discipline disparities. Therefore, CRT is the most appropriate framework for our study (Ladson-Billings & Tate, 1995, p. 50).
This model is also beneficial because of its bend toward activist research, which is important for scholars dedicated to promoting equity within the law. Tate (1997) explained, “a central part of the critical race critique is to examine ever-changing conceptions of justice. Thus, scholars interested in educational equity should benefit from the CRT literature” (p. 235). CRT provides the space for researchers to challenge school policies and practices as well as the overt and covert implications of policy (DeCuir & Dixson, 2004, p. 30). As a result, CRT will guide our study in questioning the continued use of exclusionary punishment as a primary form of discipline in public schools. Furthermore, seeing how school discipline may impact the academic performance of students of color, it is critical that we weigh its pros and cons on educational quality and equity. “Policymakers, educators and parents should be very concerned with the long-term implications of denying educational opportunities to millions of children particularly when the effectiveness of these policies in ensuring school safety is highly suspect” (Insley, 2001, p. 1064).
As mentioned earlier, the objective of this study is to examine the effects of the four aforementioned exclusionary punishments on school mean proficiency rates of four racial subgroups. To investigate, we ask the following research questions:
Research Question
What are the effects of exclusionary discipline (single and multiple out-of-school suspensions (OSS), expulsions, and/or school-related arrests) on school mean proficiency rates in reading and math by four racial subgroups? [main effects]
Over time, what are the effects of these exclusionary punishments on school mean proficiency rates in reading and math by four racial subgroups? [interaction effects]
Data Sources
This study uses panel data (2011–2012, 2013–2014, 2015–2016) from three sources—the US Department of Education Office for Civil Rights (OCR), the National Center for Education Statistics’ Common Core Data (CCD), and the Ohio Department of Education (ODE) school report cards. These data were then merged using a common key to create one large dataset. OCR and CCD data have a common school identification key that was readily available. Data from ODE contained Building and District identification numbers that were concatenated to create a school ID that was identical to the one in the other two datasets.
In this study, we estimate the impact on school mean proficiency rates of four school-level indicators— the proportion of single out-of-school suspensions (single OSS), the proportion of multiple out-of-school suspensions (multiple OSS), the proportion of school-related arrests, and the proportion of students expelled under zero tolerance policies. We obtain these variables from the Office for Civil Rights which conducts a biennial survey to collect data on leading civil rights factors related to access and barriers to educational opportunity from all public local educational agencies (LEA) and schools.
NCES’s CCD data contains information on school-level factors such as students receiving free and reduced-price lunch (FRPL) and school locale (urban, suburban, rural, or town). We collect school-level proficiency rates in mathematics and reading from ODE school report cards. These data provide information on the percentage of students at each school who achieved a level of proficient or above on the statewide standardized tests disaggregated by race and grade level. Each individual school has information on the percentage of Asian (when available), Hispanic, Black, and White students performing at the proficient level or higher for grades 3 through 8. We examine all publicly available reading and math proficiency rates for third, fourth, fifth, sixth, seventh, and eighth graders. We analyze only these grades because Ohio law mandates standardized testing for students in grades 3 through 8 in reading and math.
Methods
We employ a fixed effects methodology to estimate the impact of single and multiple out-of-school suspensions, school-related arrests, and expulsions on school mean proficiency rates. This methodology allows us to incorporate school and yearly fixed effects to account for non-independence among schools. School and yearly fixed effects will account for any unobservable time-invariant characteristics, such as learning environment, propensity to suspend students, or school-wide shocks during a given year. By controlling for these individual school characteristics, we mitigate (though, not entirely) concern that nonrandom selection into suspensions, arrests, or expulsion biases our estimates of the effects. For ease of interpretation, we standardize our dependent variables (M = 0, SD = 1) by grade and year. Bearing in mind that the severity of and tendency to discipline students also vary by school type (i.e., elementary and middle), we also standardize our disciplinary independent variables by school type and year.
Empirical Strategy
The empirical strategy compares changes in mean proficiency rates in schools that experience higher rates of exclusionary punishments to those that experience lower rates of exclusionary punishments. To estimate these effects, we conduct statistical analyses separately for each racial subgroup, leading to two separate analyses (reading and math) per subgroup. Thus, we are comparing within-school changes for each racial subgroup rather than changes between racial subgroups. Our fixed effect model is implicitly a value-added model that aims to assess the impact of attending, say, a school that experienced higher single out-of-school suspensions to a school that experienced lower single out-of-school suspensions. We, therefore, aim to estimate the following Ordinary Least Squares (OLS) model,
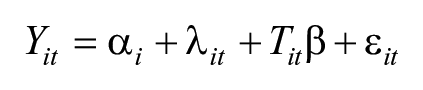
where
Descriptive Graphs
Before we get into the regression results, we first provide the following descriptive results.
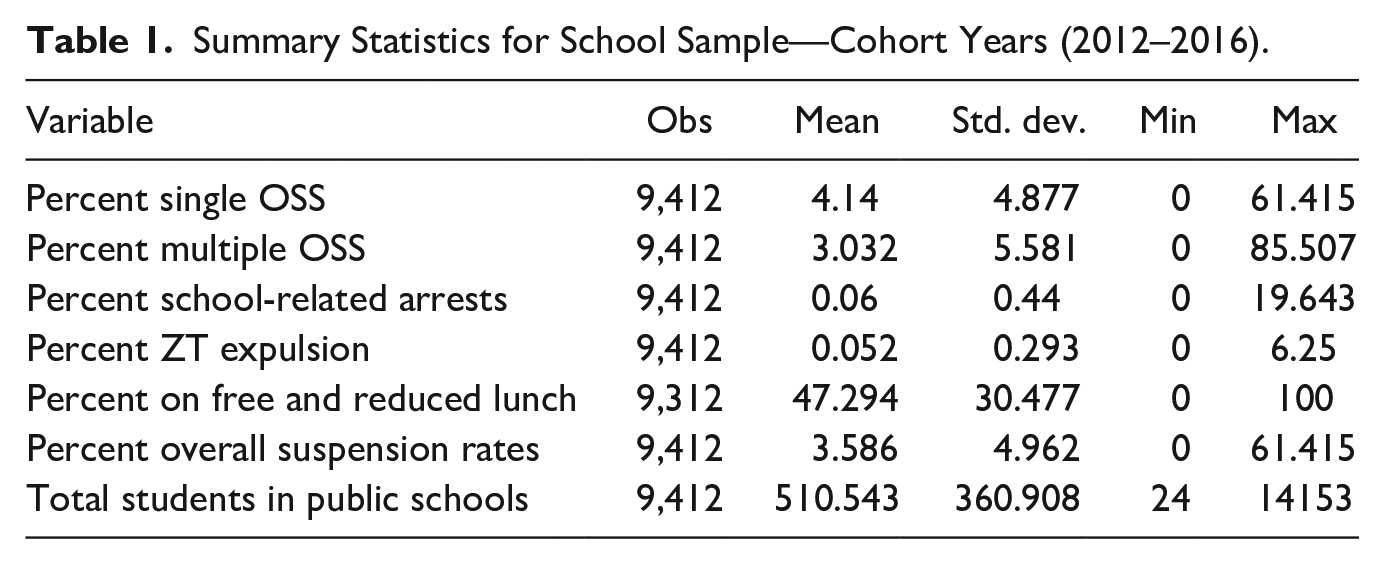
Table 1 provides descriptive statistics for key variables relating to suspension rates, school-related arrests, expulsions under zero-tolerance policies, and other school characteristics. We see that among the schools in our sample, the average single and multiple out-of-school suspensions were 4.14% and 3.03%, respectively, with an overall suspension of 3.6%. Average school-related arrests and ZT expulsions were less than 0.1%.
Summary Statistics for School Sample—Cohort Years (2012–2016).
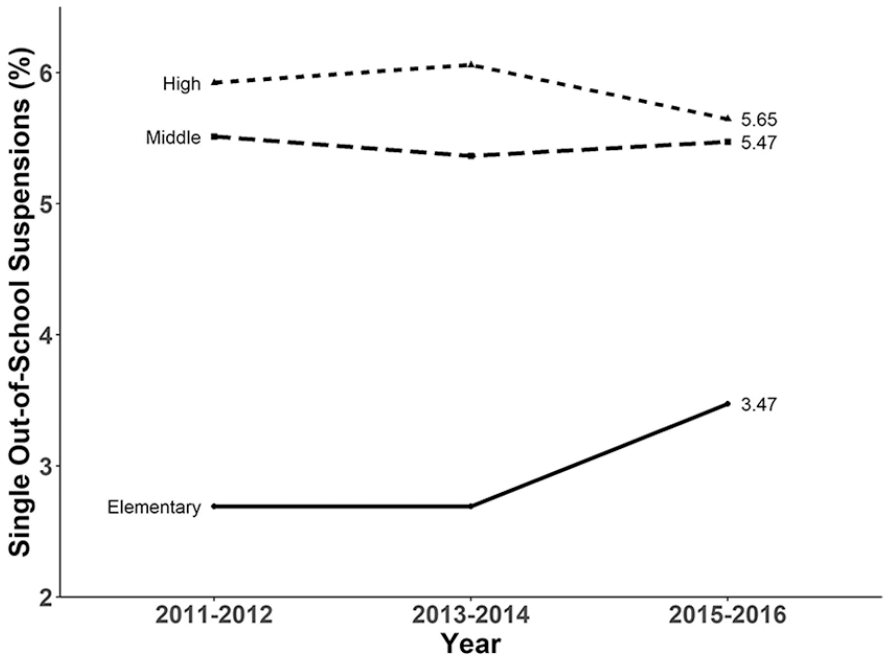
The following descriptive results (Figures 1–4) show the trajectory of single out-of-school suspensions, multiple out-of-school suspensions, school-related arrests, and expulsions under zero tolerance by school type. Here we include all school types (elementary, middle, and high schools) even though we do not include high schools in our regression analysis. These graphs show trends of disciplinary actions from 2011–2012 through 2015–2016 academic years. Figure 1 below begins with single OSS.
Single out-of-school suspensions by school type over time.
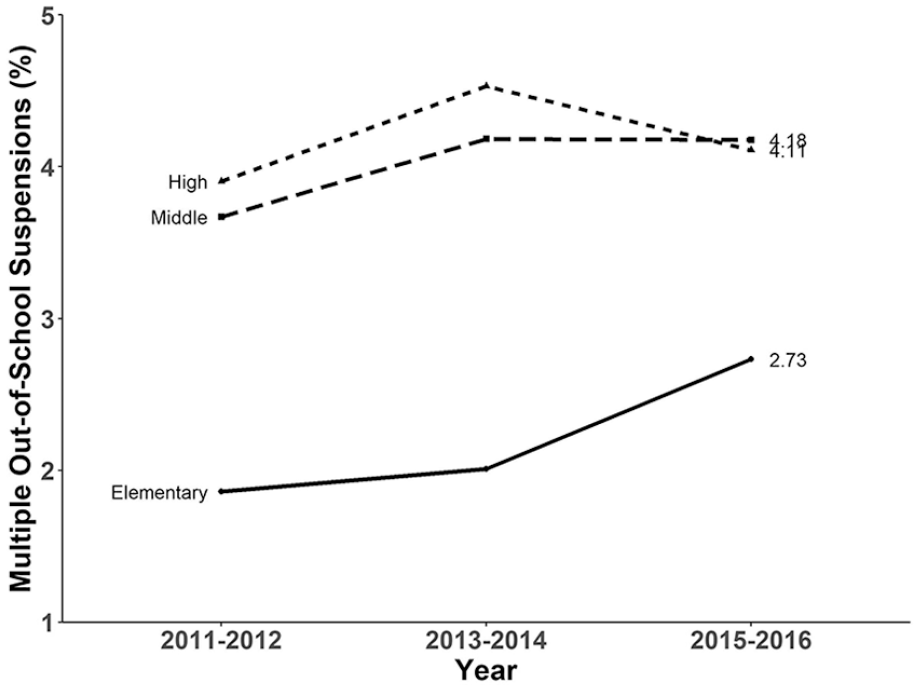
Multiple out-of-school suspensions by school type over time.
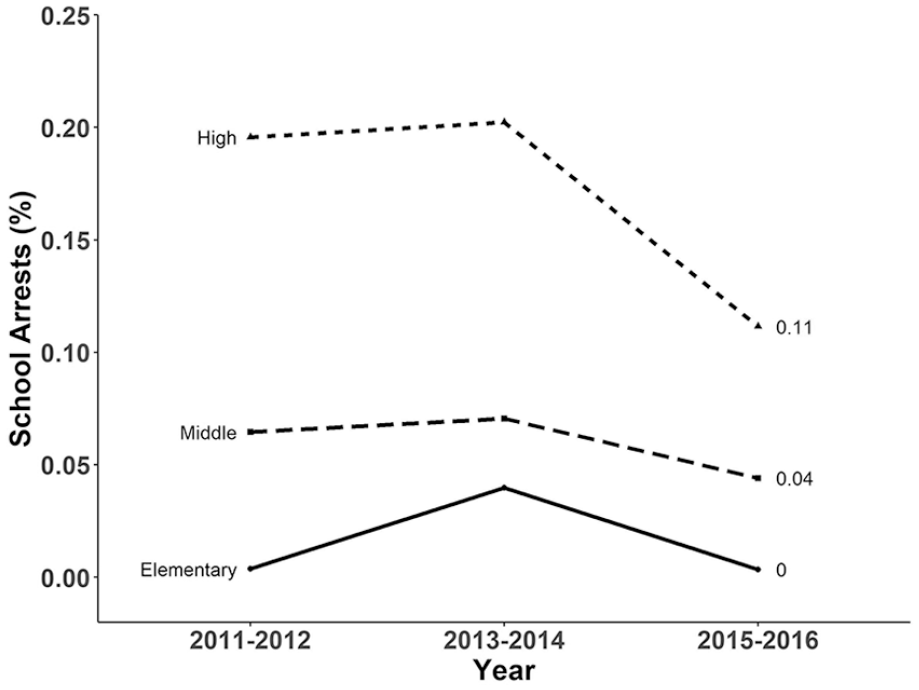
School-related arrests by school type over time.
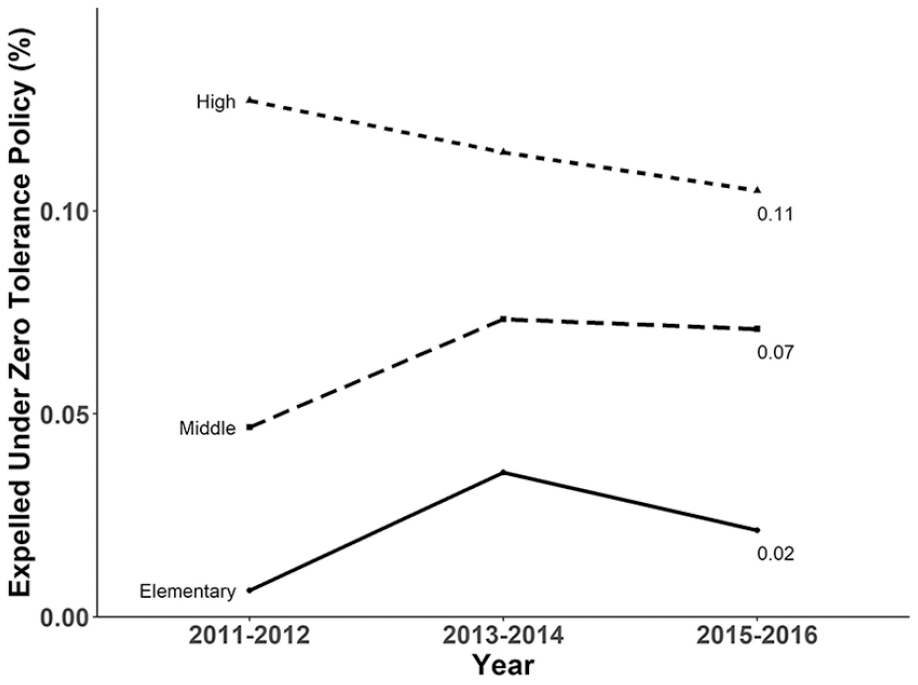
Expulsions under zero-tolerance by school type over time.
From Figure 1, it is evident that elementary schools have lower single out-of-school suspension rates than middle and high schools. This is somewhat intuitive considering the age range of children in elementary schools. After 2013–2014 academic year, we see that elementary schools’ single OSS rates increased sharply whereas high schools’ single OSS rates declined. From 2013–2014 to 2015–2016, middle schools experienced a small increase in single out-of-school suspensions.
Similarly, in Figure 2 we observe that elementary schools have lower multiple out-of-school suspension rates than both middle and high schools. However, during the study period, there is an increase in multiple OSS rates in elementary schools than in middle and high schools. After 2013–2014 academic year, high schools experienced a decline in multiple OSS rates whereas middle school multiple OSS rates held constant. Elementary schools saw a sharp increase in multiple out-of-school suspensions. It is clear that elementary schools have lower overall suspension rates compared to middle and high schools but are experiencing a higher jump after school year 2013–2014 than both middle and high schools.
In Figure 3, we find that all three school types experience declines in school-related arrests after the 2013–2014 academic year. High schools have the highest overall school-related arrests and also experience the sharpest decline after 2013–2014.
Figure 4 shows that after the 2013–2014 school year, elementary schools experience a sharp decline in expulsions under zero tolerance policies whereas middle schools experience a weak, minimal, decline in expulsions under zero tolerance. In general, high schools indicate a somewhat constant decline in expulsions under zero tolerance over the analyzed period.
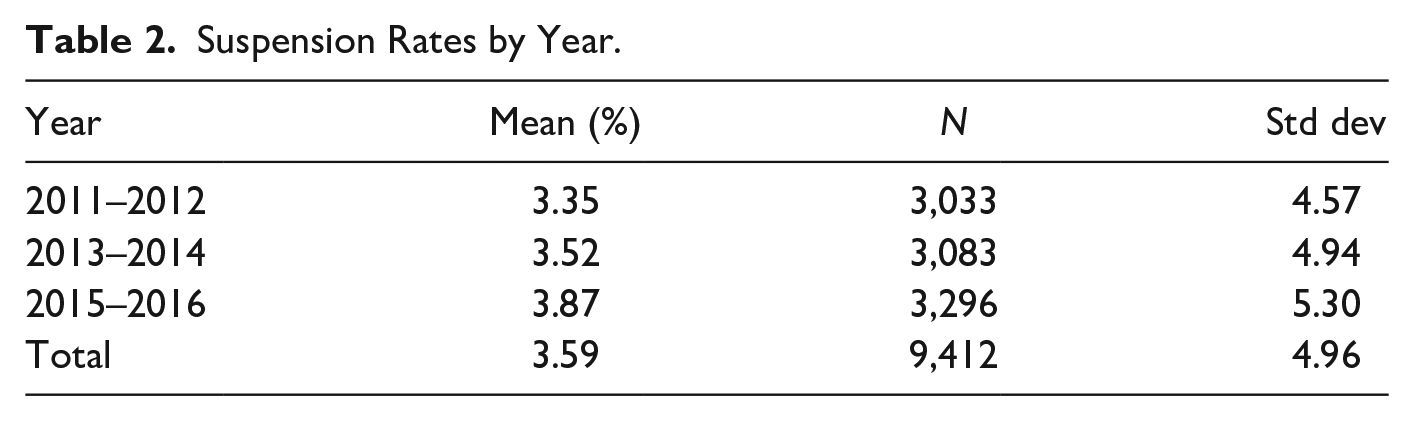
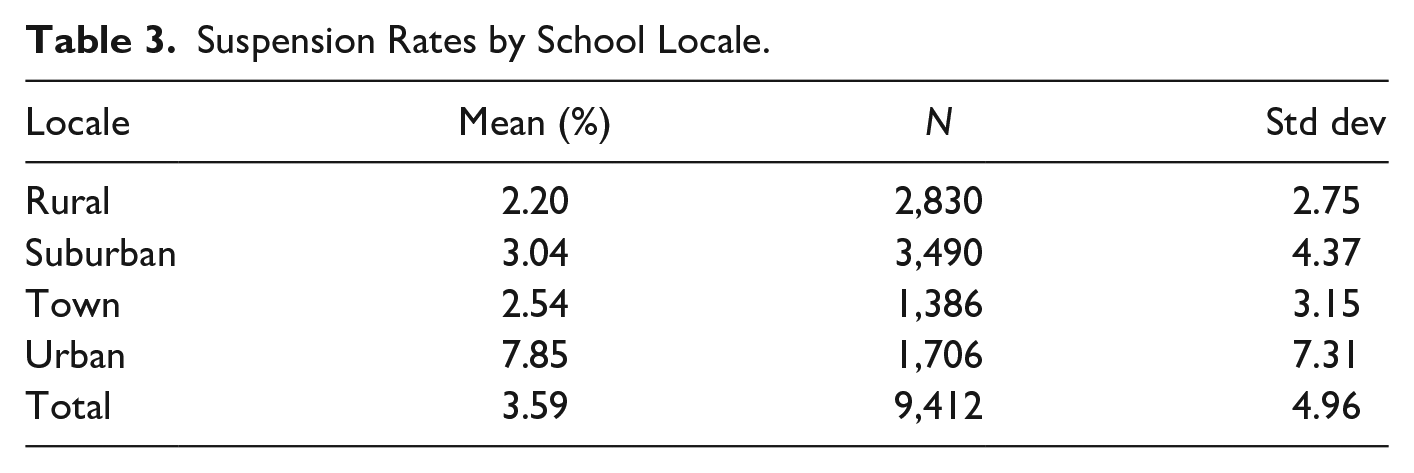
Although we generally observe declines in suspension rates (both single and multiple OSS) by school type, particularly in high schools, it is important to note that overall mean suspension rates actually went up from the 2011–2012 school year to 2015–2016 school year. Table 2 below illustrates this increase. During the study period we see an increase in suspension rates of approximately 16%. Table 3 shows that suspension rates are highest in schools located in urban areas and lowest in schools located in rural areas. The data on suspension rates from the Office for Civil Rights is not disaggregated by race, so we are unable to descriptively analyze disparate suspension trends by race.
Suspension Rates by Year.
Suspension Rates by School Locale.
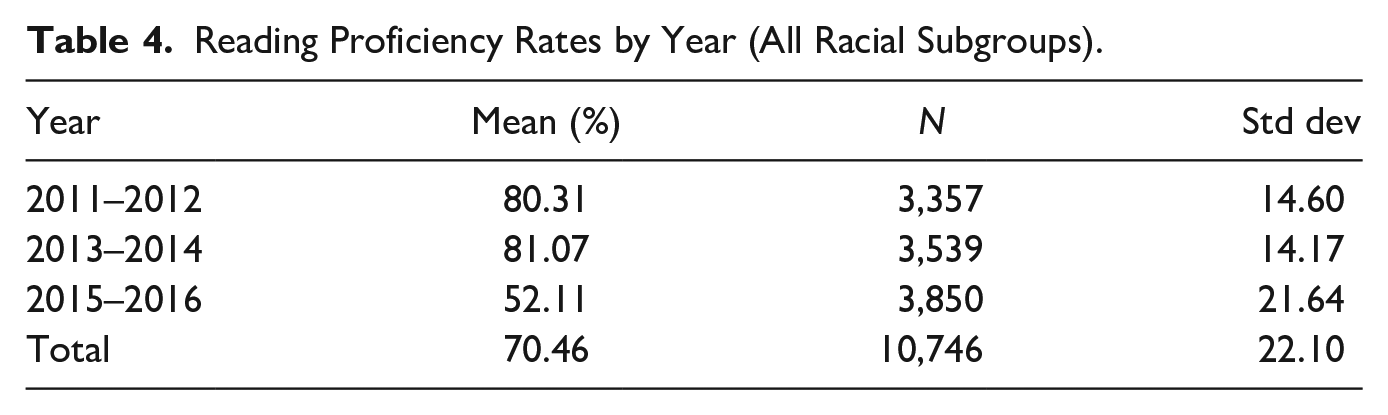
As for proficiency rate performance, we observe a dramatic decline in both reading and math proficiency rates between the 2011–2012 school year and 2015–2016 school year as indicated by Tables 4 and 5, respectively. Specifically, the percentage of students performing at the proficient or above level decreased by 35.1% in reading and 22.9% in math. These large drops in school average proficiency rates are potentially due to a statewide change in measurement which led to changes in the “proficiency” benchmark.
Reading Proficiency Rates by Year (All Racial Subgroups).
Mathematics Proficiency Rates by Year (All Racial Subgroups).
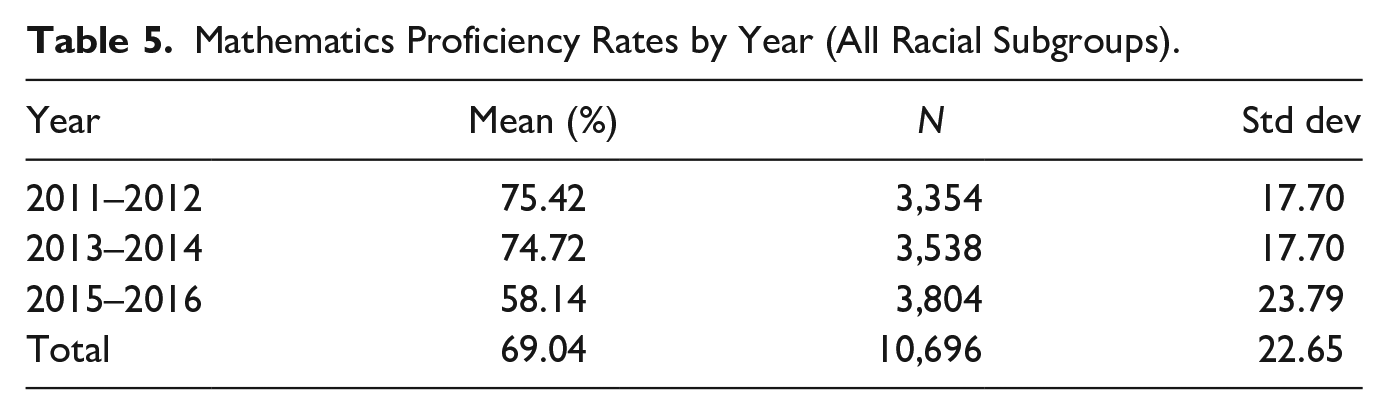
According to the Ohio Department of Education (2017), new Ohio’s State Tests in English language arts, mathematics, science, and social studies were administered for the first time during the 2014–2015 academic year. This change in measurement should not impact our regression estimates as it affects all schools equally and our models account for time specific shocks (such as state-wide policy changes) that affect all schools. Additionally, we are estimating changes (growth or decline) in proficiency rates over time rather than absolute value rates.
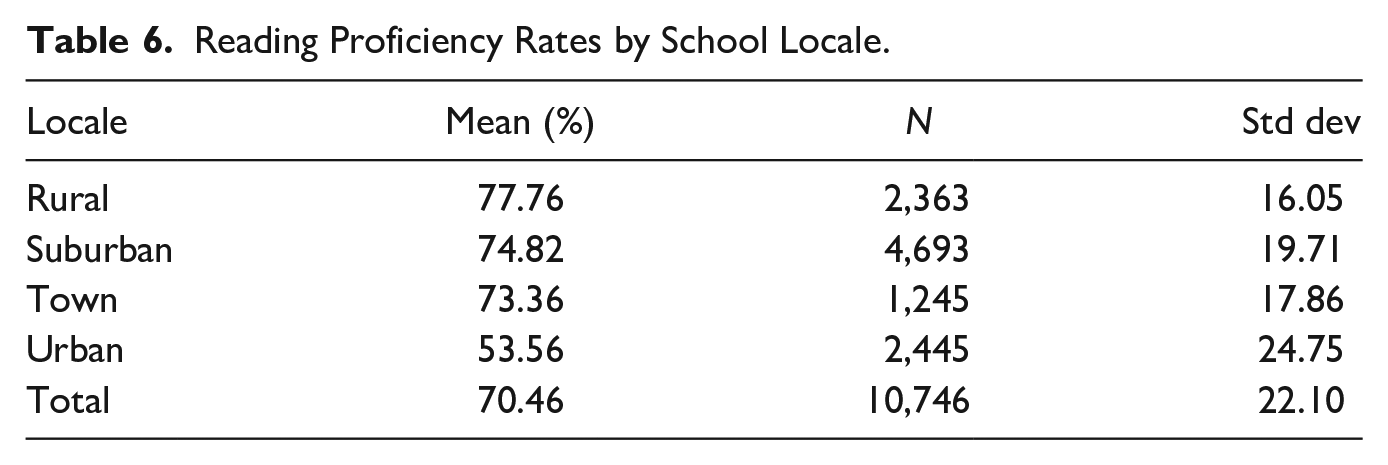
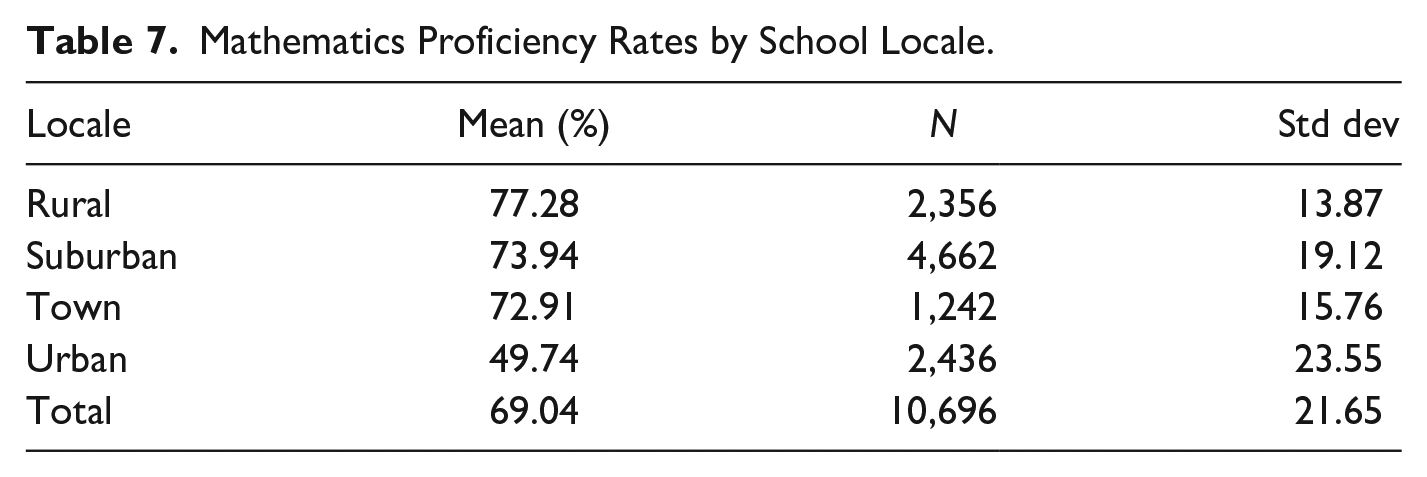
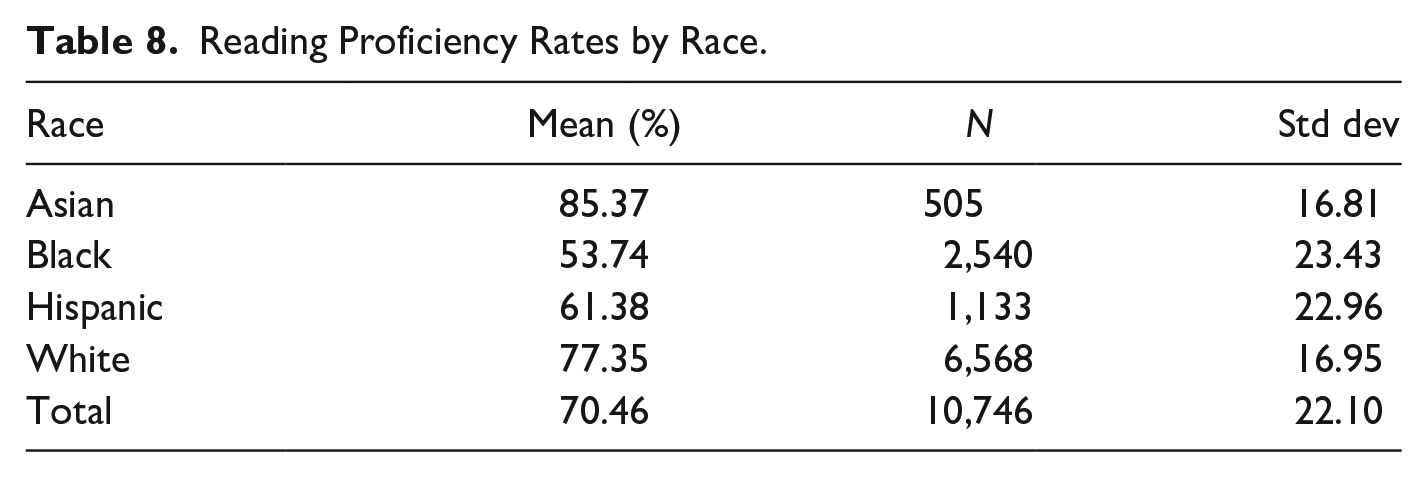
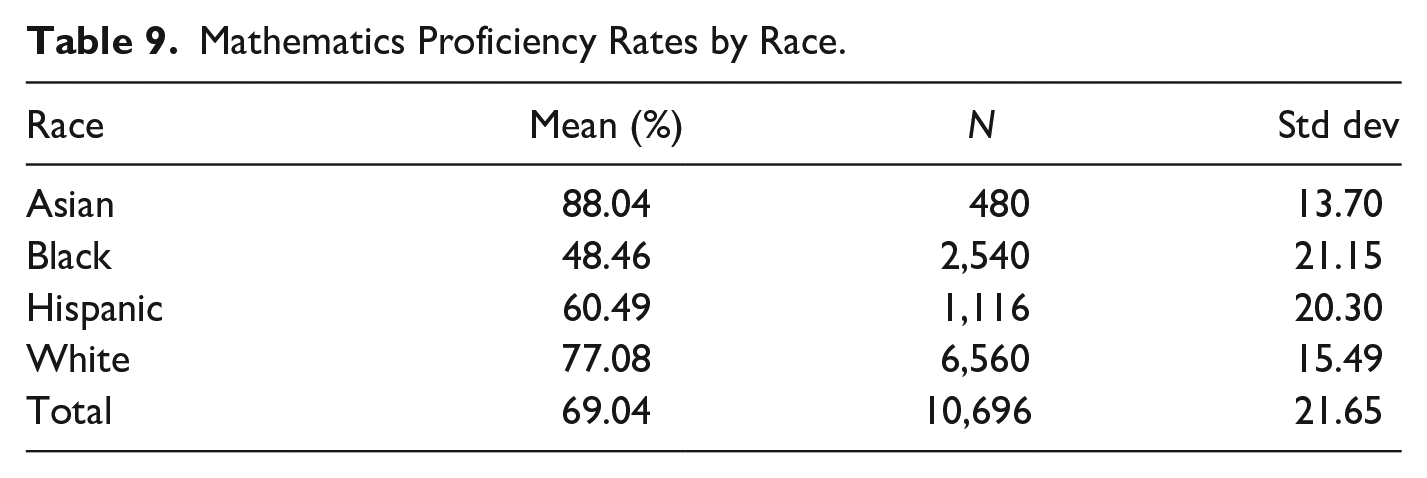
In Tables 6 and 7, we see that reading and math proficiency rates are highest in schools located in rural areas and lowest in schools located in urban areas. A direct opposite of what we observe with suspension rates. Finally, in Tables 8 and 9, we see that school mean proficiency rates for both reading and math are highest for Asian students followed by White students.
Reading Proficiency Rates by School Locale.
Mathematics Proficiency Rates by School Locale.
Reading Proficiency Rates by Race.
Mathematics Proficiency Rates by Race.
Discipline Policy in Ohio
The overall declines we observe by school type (especially in high schools) in suspensions, arrests, and expulsions after 2013–2014 could be due to a number of reasons. For example, elementary and middle schools may be enforcing disciplinary actions differentially compared to high schools. However, we generally hypothesize that these declines may be largely attributed to the State’s implementation of Positive Behavioral Interventions and Supports (PBIS) framework in 2013. The Ohio Department of Education defines PBIS as a “framework that guides school teams in the selection, integration and implementation of evidence-based practices for improving academic, social and behavior outcomes for all students” (ODE, 2019). According to the state board policy document, PBIS applies to all school districts in the State of Ohio and became effective beginning of 2013/2014 school year (ODE, 2013). Below we provide an excerpt from this policy document, Restraint or seclusion shall not occur, except when there is an immediate risk of physical harm to the student or others, and shall occur only in a manner that protects the safety of all children and adults at school. Every use of restraint or seclusion shall be documented and reported in accordance with the requirements set forth below (ODE, 2013).
We believe the implementation of PBIS is the main reason why exclusionary punishments largely declined by school type after 2013. The framework explicitly restricts seclusion punishments to incidents where there is perceived risk of physical harm to students and others. Non-violent behaviors and minor offenses such as noncompliance cannot lead to seclusion. PBIS and other non-seclusion policies are a step in the right direction but we still do not have enough research evidence on the impact these policies may have on achievement.
Another potential explanation of the declines we see post 2013–2014 school year is President Obama’s 2014 “Dear Colleague Letter.” President Obama’s directive advocated for positive discipline policies to foster safer learning environments without relying heavily on suspensions and expulsions. The letter advised school superintendents nationwide that racial disparities in suspension and expulsion rates would be grounds for finding school districts in violation of federal anti-discrimination law, and subsequently at risk of losing federal funding. (US. Department of Education, 2014). The Obama administration guidance encouraged school leaders to seek alternatives to suspensions and other exclusionary punishments.
Results
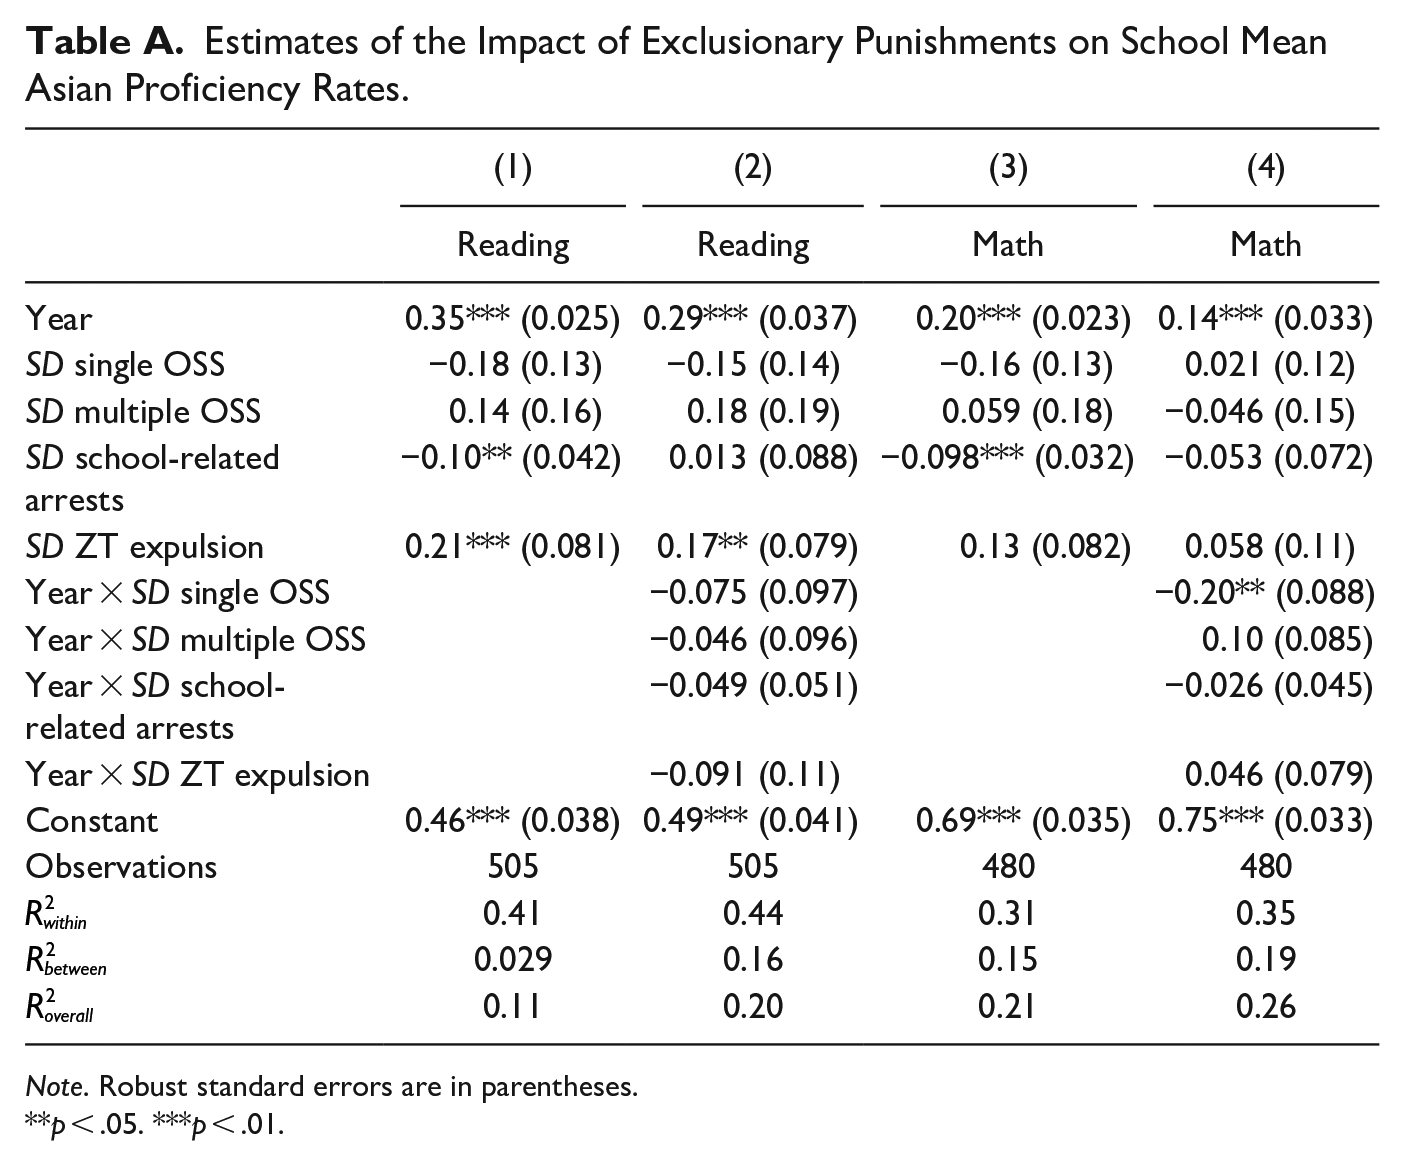
In this section, we are only going to focus our attention on the year main effects and the year interaction effects from models 2 and 4. The year main effects measure the growth or decline in proficiency rates that occurs over time. The year interaction effects indicate the effect of single OSS, multiple OSS, school-related arrests, and zero-tolerance expulsions on school mean reading and math proficiency rates over the study period. Models 2 and 4 are the models with year interaction effects whereas models 1 and 3 provide results for the main effects. We believe models 2 and 4 provide the most reliable estimates.
Effects of Exclusionary Punishments on Asian Proficiency Rates
Our first results (Table A) indicate that school mean proficiency rates for Asians saw an increase of 0.29 SD in reading and 0.14 SD in math, over the study period. We find evidence that single out-of-school suspensions have a negative effect on school mean math proficiency rates for Asians over time. Specifically, single out-of-school suspensions have a negative effect of 0.20 SD on school mean math proficiency for the Asian subgroup. We do not find any statistically significant time interaction effects on reading, but they are all negative.
Estimates of the Impact of Exclusionary Punishments on School Mean Asian Proficiency Rates.
Note. Robust standard errors are in parentheses.
p < .05. ***p < .01.
Effects of Exclusionary Punishments on Hispanic Proficiency Rates
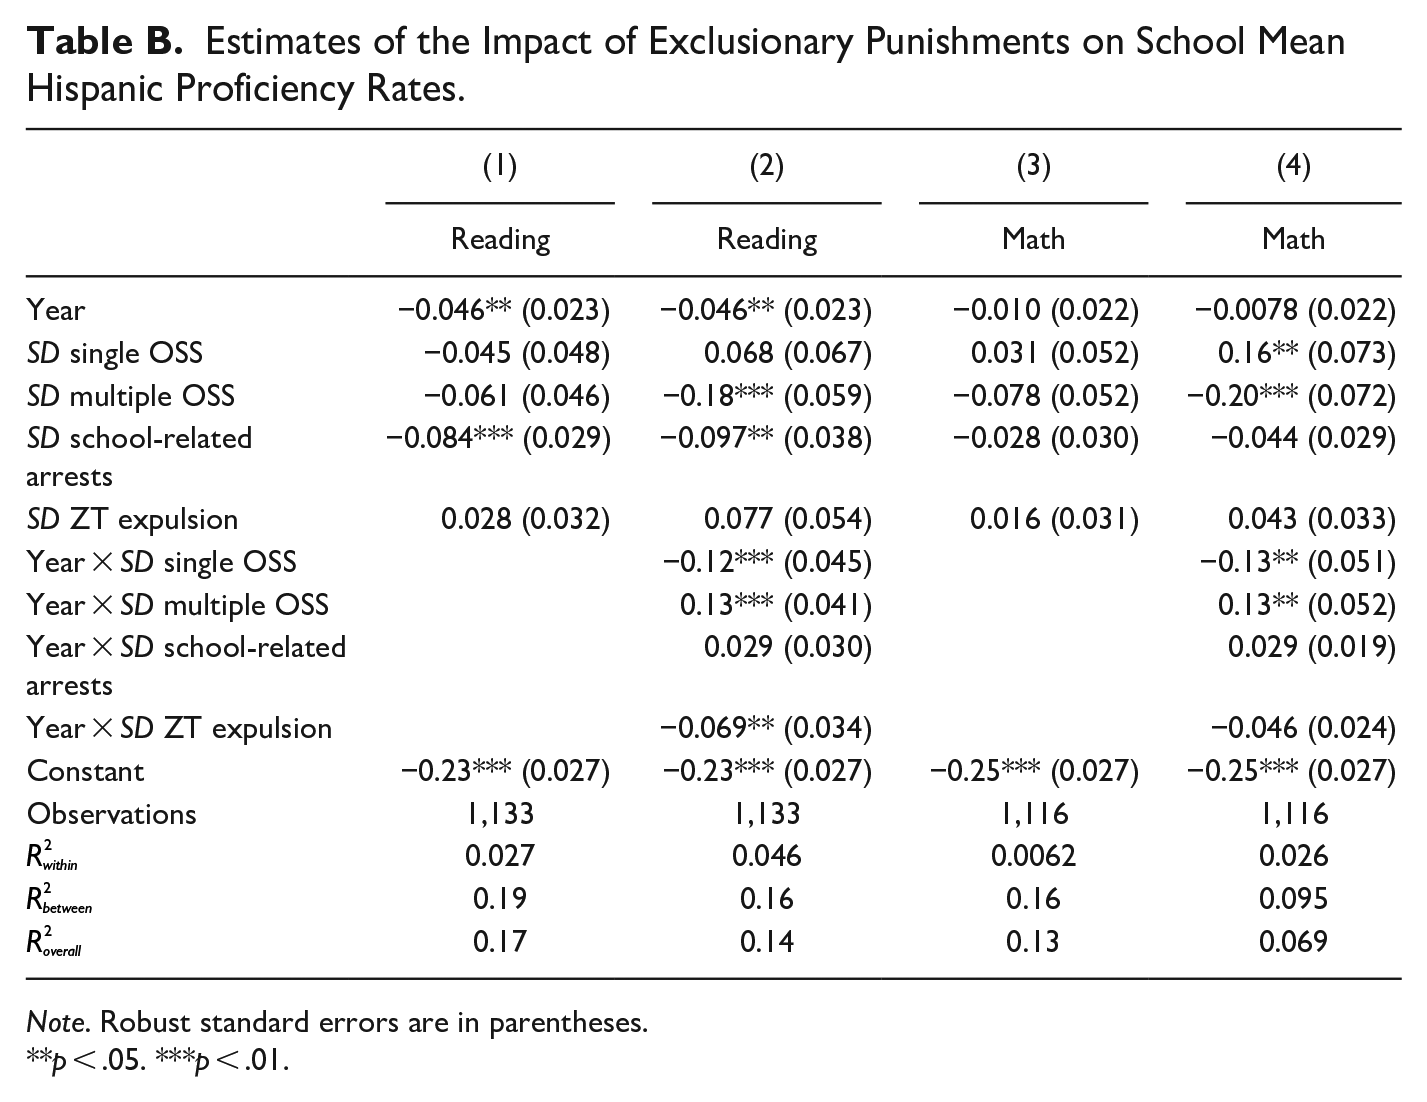
For Hispanic proficiency rates, we find that school mean proficiency rates decrease slightly by 0.046 SD in reading over the study period (Table B). The effect of time on math is not statistically significant but it is negative. We find that single out-of-school suspensions have a negative effect on both reading (−0.12 SD) and math (−0.13 SD). This implies that for every standard deviation increase in single out-of-school suspensions, school mean Hispanic proficiency rates in both reading and math decrease by approximately 0.12 SD over time. Interestingly we find that, over the study period, multiple out-of-school suspensions have a positive effect of 0.13 SD on both school mean reading and math Hispanic proficiency rates—indicating a benefit to Hispanic students. On the other hand, an increase in zero-tolerance expulsions over time decreases their school mean reading proficiency by 0.069 SD.
Estimates of the Impact of Exclusionary Punishments on School Mean Hispanic Proficiency Rates.
Note. Robust standard errors are in parentheses.
p < .05. ***p < .01.
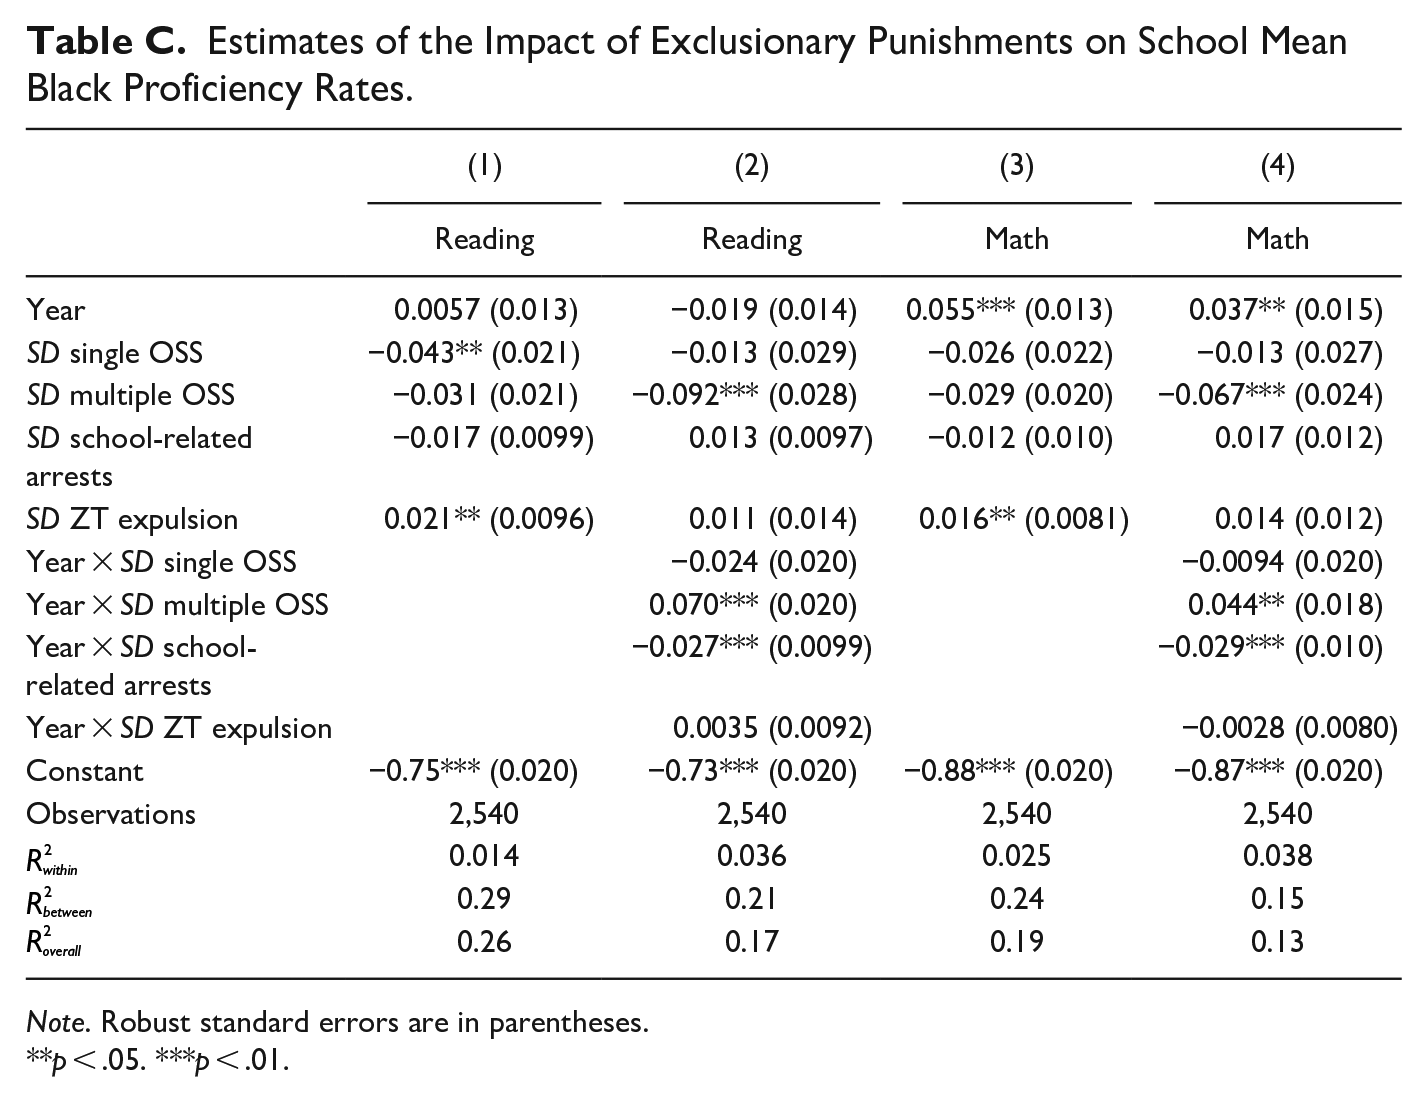
Effects of Exclusionary Punishments on Black Proficiency Rates
For Black proficiency rates we find that school mean proficiency rates also increase slightly by 0.037 SD in math (but not in reading) over the study period (Table C). Like the Hispanic subgroup, we find that multiple out-of-school suspensions also benefit Black students over time, albeit by smaller gains. Specifically, we see that for a unit increase in multiple out-of-school suspensions, both reading and math proficiency rates increase by 0.07 SD and 0.044 SD, respectively. Therefore, Black and Hispanic students appear to benefit from an increase in school-level multiple out-of-school suspensions. Check our discussion for potential reasons for this. On the other hand, we find that school-related arrests have a highly statistically significant negative effect on both reading (0.027 SD) and math (0.029 SD) proficiency for Black students.
Estimates of the Impact of Exclusionary Punishments on School Mean Black Proficiency Rates.
Note. Robust standard errors are in parentheses.
p < .05. ***p < .01.
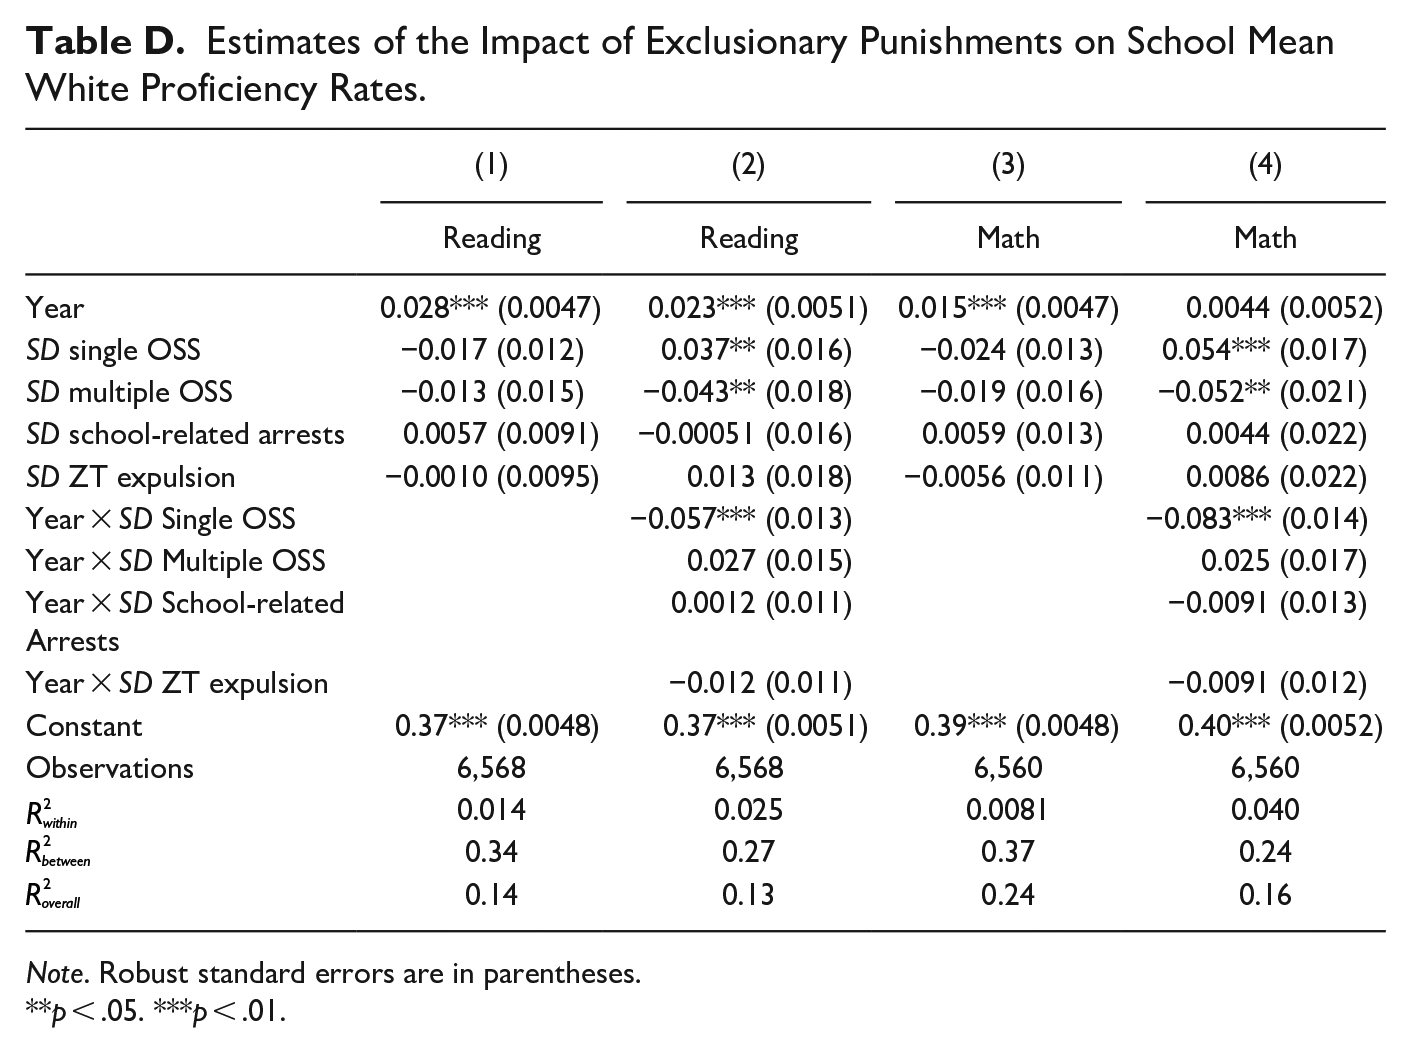
Effects of Exclusionary Punishments on White Proficiency Rates
Our final estimates (Table D) show that school mean proficiency rates for White students also increase slightly by 0.023 SD in reading over the study period. Single out-of-school suspension rates have a highly statistically significant negative effect on both reading (0.057 SD) and math (0.083 SD) for White students. Consistent with the results for Asian students, we do not find evidence that multiple out-of-school suspensions benefit White students. We also do not find any statistically significant effects on the other year interactions.
Estimates of the Impact of Exclusionary Punishments on School Mean White Proficiency Rates.
Note. Robust standard errors are in parentheses.
p < .05. ***p < .01.
Limitations
A possible limitation to our study is a lack of random assignment to treatment. It is impractical and unethical to randomly assign schools into various discipline treatments. In fact, other researchers that have conducted similar studies (i.e., Steinberg & Lacoe, 2017) indicate that nearly all school discipline studies contend with the “selection problem” and the “omitted variable bias” problem. The former implies that the decision to suspend students is not random while the latter signifies the challenges involved in accounting for all factors that might increase or decrease the likelihood of exclusionary discipline or academic success. We deal with the selection problem by only comparing schools to themselves over time. The use of panel data and school fixed effects also enable us to deal with omitted variable bias by accounting for any unobservable time-invariant characteristics like individual school’s propensity to suspend students. We acknowledge that these efforts only lessen the above concerns and do not completely eliminate them. Nevertheless, we are confident that our estimated effects do not suffer from omitted variable bias. We re-ran models that included potential time-varying controls such as school-level socioeconomic status and the magnitudes of our estimates do not vary much (if at all). Finally, the proficiency or above measure we use is not as reliable as value-added measures. Additionally, the civil rights data is not without its flaws and errors. If there are any systematic measurement errors in our variables, then our estimates could be biased. In this study we use school level proficiency scores because we could not obtain readily available school level value-added scores by race. Future research could replicate this study using value-added scores.
Discussion and Conclusion
Across all four racial subgroups, we generally find that single out-of-school suspensions have a negative effect on either reading or math (or both) proficiency over time, though not statistically significant for school mean Black proficiency. Interestingly, for Hispanic and Black racial subgroups, we find consistent evidence that multiple out-of-school suspensions have a positive effect on both reading and math, over time. However, these effects are larger for Hispanic students. A one standard deviation increase in multiple OSS improves Hispanic school proficiency rates in both reading and math by 0.13 SD. On the other hand, Black school proficiency rates in reading and math only improve by 0.07 SD and 0.04 SD, respectively. This implies that when comparing to themselves, over the study period, Hispanic and Black racial subgroups are benefitting from an increase in multiple out-of-school suspensions. There are a few possible explanations for this finding. A naïve possible explanation is that students who commit multiple offenses are simply bad apples and disrupt the learning environment more than those who commit single offenses. This can only be proven or disputed with detailed student-level disciplinary data which we do not have for this study.
Another possible explanation is that Hispanic and Black students experience multiple out-of-school suspensions disproportionately and for longer days than their Asian and White peers. Anderson and Ritter (2020) found that Black students receive more severe (longer) punishments than their White peers for the same types of infractions. Suspending Hispanic and Black students for longer periods of time could imply non-participation in proficiency tests. If we assume that the suspended students are also likely to be struggling academically, then their non-participation in proficiency tests could give a false impression that multiple suspension improves school mean proficiency. In fact, the magnitude of this effect may grow as more Hispanic and Black students are suspended. Having student-level data could help tease out the specific effects.
A third potential explanation deals with differential peer effects. The suspension of peers may have varying effects on the remaining students depending on academic ability or race. According to Burke and Sass (2013), “Hoxby and Weingarth (2006), Lavy et al., (2008), and Cooley (2010) all find that peer effects may differ across students depending on their ability levels” (p. 52). Additionally, they note that other scholars (i.e., Hoxby, 2000; Angrist and Lang, 2004; Hanushek et al., 2009; Fryer & Paul, 2010) also find that peer effects may differ by race, ethnicity, and/or gender. Specifically, in our study, removal of certain peers may impact Hispanic and Black subgroups differently than White and Asian subgroups. Hispanic and Black students, who may already have a gap in ability, have more room to improve than their higher ability counterparts who may be experiencing ceiling effect. For instance, a school with over 90% of its Asian students attaining proficient or above levels has very little room for improvement than a school with only 60% of its Black students attaining proficient or above. Due to the reasons outlined here, we caution careless interpretation of this multiple OSS positive effect on Hispanic and Black proficiency rates. Further research should be conducted to explore this phenomenon using student-level administrative data.
Interestingly, we find no evidence that zero-tolerance expulsions impact school mean proficiency rates for Asian, Black, and White racial subgroups over time. Only Hispanic reading proficiency is negatively impacted by zero-tolerance expulsions. As specified earlier in the paper, we speculate that this is because offenses punishable by expulsion under zero tolerance are objective offenses (gun-, violence-, or drug-related) and less susceptible to racial and/or gender biases. Unlike zero-tolerance punishments that are somewhat objective, arrests are heavily enforced in schools or contexts with a higher proportion of Black students (Mosher, 2001; Welch & Payne, 2010). We find that school-related arrests have a negative effect in both reading and math proficiency for Black students. Only Black proficiency performance is negatively impacted by school-related arrests, suggesting disproportionate use of arrests on Black students or in schools with a higher proportion of Black students.
Findings illustrated in this paper are not exactly surprising and they remind us of not only the deleterious effects of exclusionary punishments on academic performance of all students but also of some of the reasons why the achievement gap among White/Asian and Black/Hispanic subgroups continues to persist. Even though it may appear that Black and Hispanic proficiency improve with an increase in multiple OSS, there are many reasons to believe this is not exactly the case. It is difficult to tease out the true effects with school-level data. Additionally, Black and Hispanic students who already achieve on average at lower levels than their White and Asian peers, are experiencing about the same (or worse) negative consequences as White and Asian students. Removing students who may already be struggling academically only exacerbates the racial academic achievement gap.
In all, this paper reaffirms consistent findings from other studies that traditional exclusionary policies have negative effects on academic outcomes. It is therefore critical that school administrators and policymakers at the local level implement school discipline policies that may not be as harmful to overall student performance. For example, in response to the effects of exclusionary punishments, some schools and districts have begun utilizing alternative modes of discipline, namely restorative justice models (Gregory & Clawson, 2016; Gregory et al., 2014). Over the past 5 years or so, scholarship has grown and shown optimism on the effectiveness of restorative justice. Research shows that some restorative justice models can be effective, especially for students who are disproportionately impacted under exclusionary discipline models (Augustine et al., 2018). Schools and districts that successfully implement restorative justice practices show lower cases of student removal. Furthermore, there is some evidence that policies that restrict out-of-school suspensions improve educational outcomes, particularly for disadvantaged students (Anderson, 2020).
The foundational goal of this study is to help practitioners, policy actors, educators, and administrators, consider appropriate interventions for various racial subgroups. Our findings indicate varying effects of exclusionary discipline on the academic outcomes of different racial subgroups. The practical implication here is that interventions must target the needs of specific subgroups. For example, interventions aimed at reducing the impact of school-related arrests should target Black students or schools with a larger proportion of Black students. Whereas interventions aimed at reducing the impact of single out-of-school suspensions could target White, Asian, and Hispanic students as they are more likely to be negatively impacted by single out-of-school suspensions than Black students. Nevertheless, all students could benefit from student-centered interventions that put their academic wellbeing and success at the forefront of discipline reform.
Footnotes
Declaration of Conflicting Interests
The author(s) declared no potential conflicts of interest with respect to the research, authorship, and/or publication of this article.
Funding
The author(s) received no financial support for the research, authorship, and/or publication of this article.