
Abstract
Existing analytic frameworks used to analyze and report on English learner (EL) students have important limitations that complicate the efforts of policymakers, practitioners, and researchers to fully understand this group’s experiences and outcomes and respond accordingly. To address this issue, we argue that education agencies should report and analyze outcomes for four categories of students: current ELs, former ELs, ever ELs (the combined group of current and former ELs), and never ELs. We present empirical data from six applications of our proposed four-category framework, illustrating the insights it provides.
Five million students in K-12 public schools, representing over 10% of the student population, are classified as English learners 1 (ELs) and are in the process of developing English proficiency (U.S. Department of Education [USED], National Center for Education Statistics, 2020). However, because ELs are exited from EL status when they attain English proficiency, the composition and characteristics of the EL student group change across grades and years (Saunders & Marcelletti, 2013; Umansky et al., 2017). This complicates efforts of policymakers, practitioners, and researchers to understand this group’s needs and respond accordingly.
We argue that current practices for analyzing and reporting about EL students fail to provide sufficient information for education systems to effectively understand and respond to EL educational needs. This is because current reporting practices, as prescribed by federal law (Every Student Succeeds Act [ESSA], 2015), report outcomes among only currently-classified (i.e., “current”) ELs or among a group made up of current ELs plus a subset of formerly-classified (i.e., “former”) ELs. As will be described, these practices prevent meaningful comparisons of student outcomes over time and across grades. We argue for an expanded analytic framework to examine EL education, one that includes analyzing and reporting outcomes for four groups: current ELs, former ELs, ever ELs (the combination of current and former ELs), and never ELs (students who were never classified as ELs).
Our proposed expanded framework allows education systems to understand the experiences and outcomes of a stable group comprised of all students who were ever classified as ELs during their time in U.S. K-12 schools (the ever EL group), making comparisons to a stable group of students who were never classified as ELs (the never EL group). At the same time, because our framework also involves disaggregating the ever EL category into both current and former EL groups, the unique challenges and needs of these two groups are not obscured. Thus, our proposed analytic framework allows for a much more accurate and complete understanding of EL student outcomes over time. As we will demonstrate, the proposed framework also provides actionable information to practitioners and policymakers related to system performance, opportunity to learn, mechanisms underlying patterns of performance, and school-level accountability. Importantly, the framework and analyses for this study emerged from a state-level research-practice partnership in which the state implemented the proposed framework. As such, our analyses provide real-world examples of its application.
We first present the rationale for our proposed framework. We then describe current federal provisions for EL reporting and accountability, discussing the EL frameworks implicit in these provisions. Next, we review prior research about EL frameworks, including alternative frameworks that others have proposed. We then present data from six applications for our proposed framework, demonstrating insights it generates. We conclude by discussing the policy implications of this framework, while also noting limitations and directions for future research.
The Underlying EL Typology and Frameworks for Analyzing EL Education
Figure 1 presents what we argue is the underlying typology of EL students under federal law (ESSA, 2015), along with analytic frameworks for understanding EL students and EL education that are derived from this underlying typology. The underlying EL typology is depicted in Figure 1 by the central 2 × 2 matrix. By typology, we mean a matrix of “mutually exclusive and exhaustive” categories (Bailey, 2000, p. 3180), which “explicate the meaning of a concept by mapping out its dimensions” (Collier et al., 2012, p. 219). This differs from our definition of framework, by which we mean an analytic tool derived from a typology, which may combine categories and/or include categories that are not mutually exclusive. The underlying 2 × 2 EL typology has two dimensions: current proficiency and identification. The current proficiency dimension categorizes students based on whether their school system considers them to be currently proficient in English or not. The identification dimension categorizes students based on whether they were ever identified as an EL during their time in K-12 schools. At any given point in time, a student can fall into one of three possible cells in the 2 × 2 matrix:
A student who is not currently proficient in English and has been identified as an EL would be placed into the current EL cell.
A student who is currently proficient in English but was identified as an EL in the past would be placed into the former EL cell.
A student who is currently proficient in English and has not been identified as an EL in the past would be placed into the never EL cell.
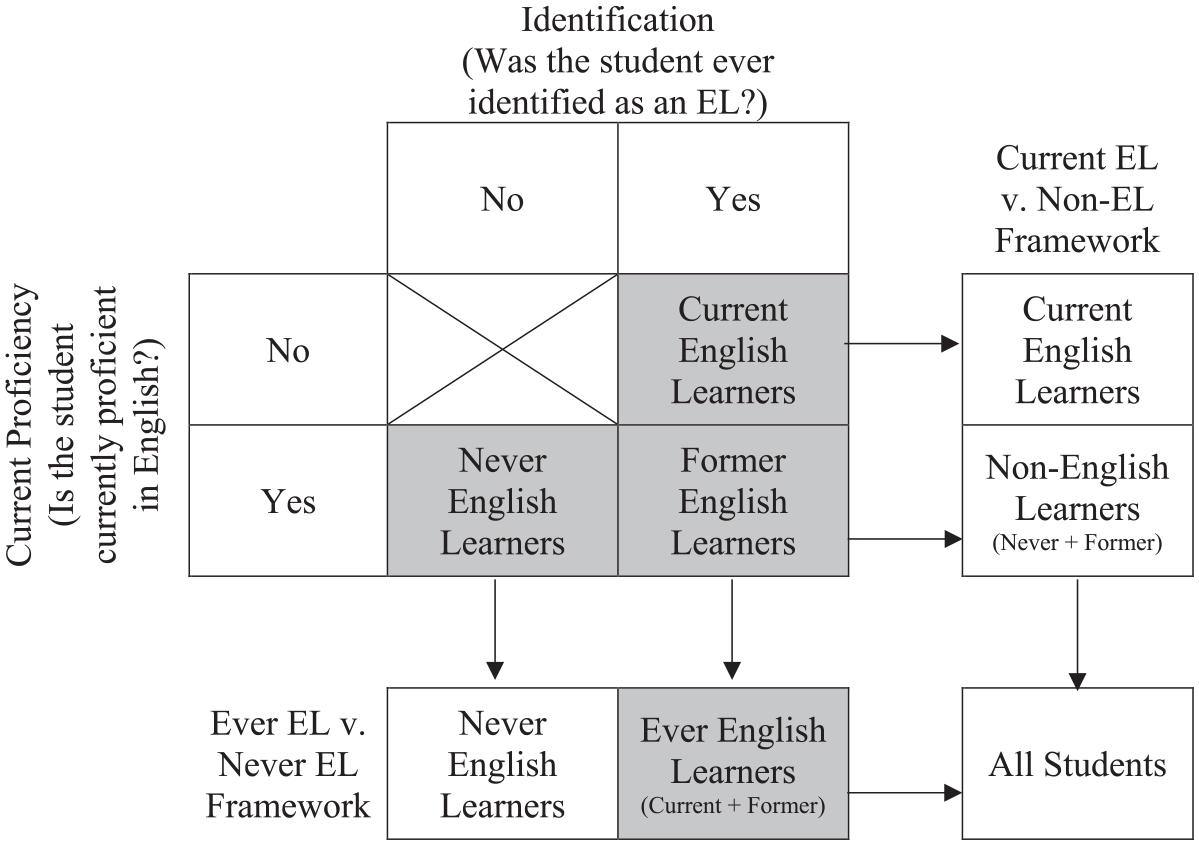
Underlying English learner typology and analytic frameworks that derive from this typology.
The fourth cell, for a student who is not currently proficient in English and has not been identified as an EL, is prohibited by federal law (apart from the 30-day window that federal law allows for education agencies to identify ELs) because students who are not English proficient should be classified as ELs (ESSA, 2015). That cell is therefore crossed out. However, it is important to note that rules governing students’ placement in these cells are not always followed in practice. For example, misidentification can occur, and some non-English-proficient students may never be classified as ELs. Similarly, under federal law, states are allowed to include additional criteria besides English proficiency, such as academic achievement measures, to determine when students exit EL status (ESSA, 2015). Thus, some students who have attained English proficiency remain classified as ELs if they have not met these additional criteria (e.g., Umansky & Reardon, 2014). Additionally, some students who have met all criteria to exit EL status are sometimes not exited because policies are not implemented as intended (Estrada & Wang, 2018). Nonetheless, the three categories described in the underlying typology—current, former, and never ELs—are intended under federal law and regulation to be “mutually exclusive and exhaustive” (Bailey, 2000, p. 3180).
Current EL Versus Non-EL Framework
Frequently, when using typologies for social science research, contiguous types or cells are combined for practical, theoretical, or empirical purposes (Lazarsfeld, 1937). Frameworks typically used to analyze EL education are the result of this reduction. The most common framework used to analyze EL education is to compare outcomes for current ELs to outcomes for non-ELs. As shown in the righthand side of Figure 1, the current EL versus non-EL framework is the result of eliminating the identification dimension of the underlying EL typology, with the former and never EL cells combining to form the non-EL category. Put another way, with the current EL versus non-EL framework, only the dimension of current proficiency is used to sort students into groups. This framework thus contrasts current ELs with all other students, regardless of whether the other students were previously identified as English learners.
Under the Every Student Succeeds Act (2015), all school quality and student success measures used in state accountability systems, such as absenteeism and on-track indicators, use the current versus non-EL framework. Much research relies on this framework as well. A prime example is studies that compare outcomes for current ELs to outcomes for non-ELs on the National Assessment of Educational Progress (NAEP) in fourth and eighth grades (e.g., Carnoy & García, 2017; Polat et al., 2016; USED, 2018). A key issue with the current versus non-EL analytic framework is that many ELs attain English proficiency and are reclassified between fourth and eighth grades (e.g., Kieffer & Parker, 2016; Umansky & Reardon, 2014). Thus, the group of students that form the basis for fourth grade EL outcomes is markedly different in size, composition, and characteristics from the group of students that form the basis for eighth grade EL outcomes. As such, assertions that differences between fourth and eighth grade assessment results reflect changes in EL students’ performance over time are erroneous.
Moreover, when relying on the current versus non-EL framework, variation in states’ reclassification criteria (Education Commission of the States, 2018) can complicate cross-state comparisons of EL outcomes. In states where reclassification criteria are difficult to meet due to high thresholds and/or multiple criteria (Estrada & Wang, 2018), such as California (California Department of Education, n.d.), higher-performing students are likely to remain classified as ELs for longer periods of time. On the other hand, in states with fewer or lower reclassification criteria, such as Arizona (Arizona Department of Education, n.d.), higher-performing students are likely to be reclassified more quickly. Because of these differences, California’s current EL group may appear higher performing than Arizona’s. Thus, differences in states’ reclassification practices prevent meaningful cross-state analyses when using the current versus non-EL framework.
Ever EL Versus Never EL Framework
Another framework that has gained increasing traction in EL education is the ever versus never EL framework (de la Torre et al., 2019; Saunders & Marcelletti, 2013; Umansky et al., 2017). As illustrated in the bottom section of Figure 1, the ever versus never EL framework is the result of reducing the current proficiency dimension of the underlying EL typology, with the current and former EL cells combining to form the ever EL category. With this framework, only the identification dimension is used to sort students into groups. Therefore, this framework contrasts never ELs with all students ever identified as ELs, regardless of whether students in the comparison group are currently classified as ELs or previously had this classification.
This analytic framework has been used in select states for unique purposes (e.g., California Department of Education, 2018), but its use remains nascent. In addition, under ESSA (2015), ever EL outcomes cannot be used to identify schools under state accountability systems. This framework has the benefit of group stability, given that students remain in a single group for the duration of their time in school. This allows for more accurate comparisons across grades, between groups, and across states. However, the use of the ever EL group has been criticized because aggregating results for current and former ELs can mask large differences in these two groups’ outcomes and trajectories. Further, this masking can prevent schools and students from receiving needed attention and resources (Lavadenz et al., 2018).
Our Proposed Framework
We argue that both existing frameworks produced by concept reduction—in other words, both the current EL versus non-EL framework and the ever versus never EL framework—are inadequate for fully understanding opportunities and outcomes for EL students. Instead, we argue that education agencies and researchers should analyze and report outcomes using a framework that includes all three categories in the underlying EL typology: current, former, and never ELs. Additionally, we argue that EL reporting must include stable comparison groups that do not change over time; thus, we contend that outcomes for the combined ever EL group (consisting of current and former ELs) must be reported, as well.
A key difference between our proposed framework and the two frameworks now in use is how each handles the former EL group. Under the current versus non-EL framework, former ELs are included within the non-EL category, and no disaggregated information about former ELs is available. Without disaggregated information about former ELs, it is impossible to understand their outcomes and respond to any unique needs. Under the current versus non-EL framework, it is also impossible to understand how well systems are serving the full group of students who are classified as ELs at some point during their educational career, obscuring longitudinal outcomes and change over time. On the other hand, under the ever versus never EL framework, former ELs are grouped with current ELs to create the ever EL category. While this allows for accurate longitudinal analyses of students who enter school as English learners, this grouping masks what are frequently large outcome differences between current and former ELs (e.g., de la Torre et al., 2019), and can prevent systems from identifying and attending to needs of either group.
Thus, in our framework, we call for analyzing and reporting data for current and former ELs separately, as well as in the combined ever EL group. In addition, we argue for the use of the never EL category as the most appropriate, stable comparison group. Before providing examples of the insights provided by using this four-category framework, we first describe how current federal law requires states to use a confusing mixture of EL frameworks for reporting and accountability purposes and then describe prior research proposing alternative frameworks.
EL Reporting and Accountability Requirements Under Federal Law
Under ESSA (2015), states must report outcomes for ELs and they must include ELs in accountability systems, but the parameters for defining the students actually included in the EL category varies by purpose, outcome, and state (Sugarman, 2020; USED, 2017; Villegas & Pompa, 2020). We discuss the EL frameworks invoked by key provisions of ESSA: academic achievement measures; school quality and student success measures; graduation rates; and calculating n-size and assigning ratings for school accountability systems.
Academic Achievement Measures
Building on requirements from the No Child Left Behind Act (NCLB; 2001), ESSA (2015) requires states to report academic achievement outcomes for ELs and use information about ELs’ academic achievement in state accountability systems. For reporting purposes, states must use the current EL versus non-EL framework (USED, 2017). For example, when reporting the percentage of students who met grade-level achievement standards in English language arts, states must provide information for current ELs and for non-ELs.
In contrast, for the purposes of calculating academic achievement measures for use in state accountability systems, states have the option of using a modified version of the ever versus never EL framework, combining information for current ELs and recently reclassified ELs. NCLB-era regulations allowed states to include former ELs in the current EL student group for up to 2 years following reclassification (USED, 2006). Under ESSA (2015), states could extend this timeframe to 4 years. However, the inclusion of reclassified students in the current EL group for accountability purposes has been optional under both NCLB and ESSA, as is the number of years (up to a maximum of four) recently reclassified students can be included.
Prior research indicates that most ELs enter US schools at the early elementary grades and exit EL services during late elementary school or early middle school (e.g., Kieffer & Parker, 2016; Umansky & Reardon, 2014). Therefore, in states that have chosen to incorporate recently reclassified ELs into the EL student group for academic achievement accountability indicators, former ELs are typically included in academic achievement calculations at the elementary and middle school years (when most former ELs are still within 4 years of reclassification). However, at the high school level, most former ELs were reclassified more than 4 years earlier and so are not included in the current EL group. As such, the degree to which the augmented current EL category includes reclassified students varies across grade spans.
Additionally, analysis of ESSA plans has found wide variation in states’ implementation of this option, with 17 states including former ELs in the EL student group for 4 years after reclassification, 5 states including former ELs for 2 years, 10 states not including former ELs in the EL student group, and 17 states indicating they include former ELs but not specifying the number of years (Villegas & Pompa, 2020). Thus, some states are using the current EL versus non-EL framework when making academic achievement calculations for accountability purposes, while others are using a modified version of the ever versus never EL framework. This variation in frameworks complicates comparisons of EL outcomes across states. In addition, these federal provisions may cause confusion within states since states may use a different EL group for reporting purposes than they do for accountability purposes (Sugarman, 2020).
School Quality and Student Success Measures 2
ESSA (2015) requires states to include at least one school quality and student success measure in their accountability systems. States have implemented this provision in a variety of ways, constructing measures of school climate, exclusionary discipline (i.e., suspensions and expulsions), absenteeism, and high school on-track indicators (Achieve, 2018; Kostyo et al., 2018). Analysts have referred to these metrics as “equity indicators” (Kostyo et al., 2018). States must report these outcomes for the EL group, but in contrast to the rules governing the parameters for the academic achievement measures discussed above, states may not include former ELs in the current EL group when calculating the equity indicators. In other words, all states must use the current EL versus non-EL framework when calculating these indicators, for both reporting and accountability purposes. Thus, in many states, the group of students included in the EL category for academic achievement indicators differs from the group of students included in the EL category for these other indicators, complicating comparisons across metrics.
Graduation Rates
ESSA (2015) also requires that states report high schools’ 4-year cohort graduation rates and include these rates in their state accountability system. However, again there is variation in which students are included in the EL group (Sugarman, 2019). Federal regulations allow states to define the EL group in multiple ways when calculating graduation rates, including: (1) all students who were classified as ELs in ninth grade (regardless of whether they reclassified during high school); (2) students classified as ELs during the previous 1 to 3 years prior to graduation; or (3) only students classified as ELs at the time of graduation (USED, 2008). A recent analysis of EL graduation calculations across states found that most state reporting systems did not specify how the EL group was defined (Sugarman, 2019). As with academic achievement measures, some states are using the current EL versus non-EL framework for their graduation rate calculations, while others are using a modified version of the ever EL versus never EL framework, including some former ELs along with current ELs. This variation in reporting practices seriously compromises meaningful comparisons of EL graduation rates across states. Furthermore, even within states, stakeholders typically do not have full information about graduation rates for current, former, ever, and never ELs and therefore cannot identify successes and areas in which supports may be needed.
Calculating n-Size and Assigning Ratings for State Accountability Systems
As with NCLB (2001), a key focus of ESSA is identifying schools in need of support and intervention. Under ESSA (2015), school identification is determined by a variety of indicators for students overall and for particular student groups. These indicators include the academic achievement measures, school quality and student success measures, and graduation rates discussed above. In addition, states must design an indicator that provides information about ELs’ progress to attaining English language proficiency (ESSA, 2015). While all states must include these elements in their rating systems, states have considerable flexibility over several key dimensions, including determining what school quality and student success indicators they will use, determining how their ELP progress indicator will be calculated, and determining how ratings will be used to identify schools in need of support and intervention (ESSA, 2015; Kostyo et al., 2018; Villegas & Pompa, 2020). In addition, states have flexibility to define rules about the minimum number of students within a specific student group that must be enrolled in a school for information about that student group to be reported and used to identify schools in need of support and intervention (ESSA, 2015). This minimum number is referred to as the state’s n-size. For each indicator, schools receive ratings for students overall, as well as for each student group that meets the state’s minimum n-size. States must report data and provide ratings for a variety of student groups, including ELs, economically disadvantaged students, and students “from each major racial and ethnic group” (ESSA, 2015).
A key rationale behind having a specific n-size is that indicators based on very small numbers of students are unstable and unreliable. Several education advocacy groups have documented the variation in rules adopted by states under ESSA, with n-sizes ranging from 10 to 30 (Gordon, 2017; Villegas & Pompa, 2020). Additionally, states can set their n-size rules to pool data across multiple years or across specific grade spans (Gordon, 2017; Linn & Haug, 2002). Finally, states can adopt different n-sizes for reporting versus accountability purposes (Villegas & Pompa, 2020). N-size rules are consequential because they directly impact the number of schools whose data are considered under states’ accountability systems. For example, if a state’s minimum n-size is set at 20 but only 15 students at a given school fit the definition of the EL group used for a particular metric in that state, that school will not be given an accountability rating on this metric for the EL group and will not be targeted for improvement based on its EL outcomes. States that select larger n-sizes likely have more stable and reliable metrics by school, but more schools in those states—and more of those states’ EL students—are excluded from accountability systems.
In summary, while federal law requires that information about EL outcomes be reported and incorporated into state accountability systems, the particular students included in the EL category vary depending on the purpose, metric, and state. In some instances, reporting follows the current EL versus non-EL framework. However, in other cases, reporting follows a modified version of the ever EL versus never EL framework, with current ELs and recently reclassified ELs being compared to other students. This variation in the definition of the EL group limits educators’, policymakers’, and the public’s ability to make comparisons across metrics and across states, limiting the utility of data to guide policies or reforms. To address these limitations, we propose a four-category EL framework, under which states would report information about current, former, ever, and never ELs for all purposes and metrics. Before providing examples of how this four-category framework can be applied, we first review prior research about EL analytic frameworks, including other alternative frameworks that have been proposed.
Prior Research About EL Analytic Frameworks
Researchers have increasingly recognized limitations of existing EL frameworks and explored insights that can be generated from using alternative frameworks. Saunders and Marcelletti (2013) used publicly available statewide content assessment data from California to demonstrate that excluding former ELs substantially overestimated achievement gaps between students who entered school classified as ELs (e.g., the ever EL group) and other students (e.g., never ELs), diminishing education agencies’ ability to detect progress among the ever EL group.
Similarly, Kieffer and Thompson (2018) used publicly available NAEP data to analyze changes over time in achievement gaps at both fourth and eighth grades between multilingual students (including both current and former ELs, along with a small group of students who spoke a language other than English at home but were never classified as ELs) and other students. They compared the patterns that emerged from this analysis to changes in achievement gaps between current ELs and other students during the same time period. Findings indicated that multilingual students showed two to three times more growth in NAEP scores than monolingual students over the past decade, a finding that was completely obscured in analyses that focused only on outcomes for current EL students across grades.
Practitioner-oriented publications are also beginning to use and compare different EL frameworks. A recent report by the Chicago Consortium for School Research compared the ever versus never EL framework to the current EL versus non-EL framework, coming to similar conclusions about how the current EL versus non-EL framework exaggerates achievement gaps and obfuscates the educational gains of students who enter school as ELs (de la Torre et al., 2019). For example, de la Torre et al. (2019) found that 1% of current ELs met or exceeded expectations on the eighth grade English language arts assessment, compared to 28% of non-ELs. However, more than a quarter of students in the non-EL group were actually former ELs. To understand outcomes for the full group of students who were ever classified as ELs, de la Torre et al. (2019) combined outcomes for the current and former EL groups and found that this combined ever EL group had only a slightly lower rate of meeting/exceeding standards on the eighth grade ELA assessment than never ELs (23% for ever ELs compared to 26% for never ELs).
Studies have also adapted EL frameworks by further differentiating the ever EL category, comparing various groups of students depending on whether and when they were reclassified. For example, a recent study in Washington State compared advanced course-taking for current ELs, recently reclassified ELs (within 2 years of reclassification), former ELs reclassified more than 2 years ago, and never ELs (Hanson et al., 2016). While never ELs were most likely to enroll in advanced courses, there were differences in advanced course-taking among the other three groups. For example, the proportion of high school students who enrolled in at least one advanced course in a given school year was 26% for current ELs, 36% for recently reclassified ELs, 41% for students reclassified more than 2 years ago, and 48% for students never classified as ELs (Hanson et al., 2016). Finally, scholars have also called for frameworks that involve greater differentiation of the current EL category, noting that EL student outcomes differ greatly by students’ English proficiency level and grade of entry into U.S. schools (Thompson et al., 2020), for example, and that characteristics of current EL students can impact school accountability ratings in unintended ways when current ELs are considered as one group, without differentiation by ELP level (Strong & Escamilla, 2020).
As this prior research makes clear, different insights and information emerge depending on the categories of students examined and the framework for comparisons used. Drawing on our experiences in an EL-focused research-practice partnership, we attempt to shed light on this dilemma. Specifically, we argue that education agencies would benefit from reporting outcomes using our proposed four-category EL framework, which includes the current, former, ever, and never EL groups. In what follows, we describe six different but interrelated, uses for this four-category framework: (1) understanding how students’ outcomes change across grade levels; (2) understanding educational system performance; (3) shedding light on possible causes of student performance patterns; (4) understanding opportunity to learn; (5) including schools in accountability systems; and (6) identifying schools for improvement under accountability systems. For each of these uses, we offer an example from our own partnership work about the insights that reporting outcomes for current, former, ever, and never EL students has provided.
Data and Methods
For the past 9 years, we have collaborated in a research-practice partnership with the Oregon Department of Education. For context, 18% Oregon’s public K-12 population are either current (9%) or former (9%) ELs (Oregon Department of Education, 2020). Paralleling trends nationally, roughly 80% of the state’s current EL population speaks Spanish, with far lower percentages of more than 160 other languages. Approximately 85% of current EL students in the state receive content instruction through sheltered instructional approaches, while the remaining 15% participate in a bilingual program (primarily at the elementary grades). For English language development (ELD) instruction, about 60% participate in an ELD class period or receive pull-out ELD services, while about 40% receive push-in ELD services (again, primarily at the elementary grades).
In part through the cooperative efforts of this research-practice partnership, the state began, in the 2012-2013 academic year, to record and report outcomes for four EL groups: current ELs, former ELs, ever ELs, and never ELs. Specifically, alongside the state’s existing flag for current EL students, the state also had information about students’ initial EL exit dates, a required part of federal EL data collection. Using this variable, the state created a flag for former ELs. Once this flag was created, the state then created a flag for the ever EL group, which, as described above, simply includes all current and former ELs. Benefiting from this change in data collection and reporting, we used statewide, student-level data from the 2016-2017 school year to tabulate several outcomes for the current, former, ever, and never EL groups.
For each of our four analytic groups—current, former, ever, and never ELs—we calculated English language arts (ELA) achievement, graduation rates, exclusionary discipline rates, ninth grade on-track rates, and the proportion of students participating in special education. We present these tabulations in tables, histograms, and bar charts to demonstrate the insights that reporting this information for all four groups can provide. Where applicable, we also include the results of t-tests to determine the statistical significance of differences in outcomes among the current, former, ever, and never EL groups. While simple, our analyses demonstrate key insights afforded by the four-group framework and can be easily replicated by other education agencies, including those with limited data and research teams.
Then, turning from the use of our four-category EL framework for reporting purposes, we shifted our attention to how use of the four-category EL framework could impact accountability systems. Specifically, we conducted exploratory analyses to investigate how information about current, former, ever, and never ELs could impact the inclusion and identification of schools under Oregon’s accountability system. In these hypothetical analyses, we used statewide, student-level data from 2015-2016 through 2017-2018. As noted above, under ESSA (2015), each state has established a minimum number of students necessary for the school to be given a rating for accountability metrics; Oregon’s established n-size is 20. Using graduation rates as an example, we tabulated the number of schools that would be given accountability ratings for the current, former, ever, and never EL groups (if use of these four groups were permitted) and contrasted this with the number of schools currently given accountability ratings for this metric. Then, again using graduation rates as an example, we calculated the accountability ratings that each school would be given for each of the four groups that met the state’s minimum n-size (again, if use of these four groups were permitted) and explored patterns in the ratings, identifying insights that calculating accountability ratings for these four groups provided.
Findings
Understanding How Student Outcomes Change Across Grade Levels
One key use for the four-category EL framework is to understand how EL student outcomes change across grade levels. The current EL versus non-EL framework obscures these changes given the substantial shift in the size and composition of the current EL population across grade levels. Prior research demonstrating problems with relying on the current EL versus non-EL framework for this type of analysis has relied on publicly available data about proportions of students scoring at different proficiency levels (Saunders & Marcelletti, 2013) or mean scale scores (Kieffer & Thompson, 2018). We extend this prior research by analyzing student-level ELA scale scores for current, former, ever, and never ELs. Figure 2a presents stacked histograms of 2016-2017 ELA scale scores for current, former, and never ELs at grades 3, 5, 8, and 11. 3 The vertical line in each histogram represents the cut score for proficiency on the ELA assessment at that grade level. The y-axis shows the number of students with scores in each histogram bar and thus provides information about the relative size of each group. Figure 2b shows the same information for ever ELs and never ELs.
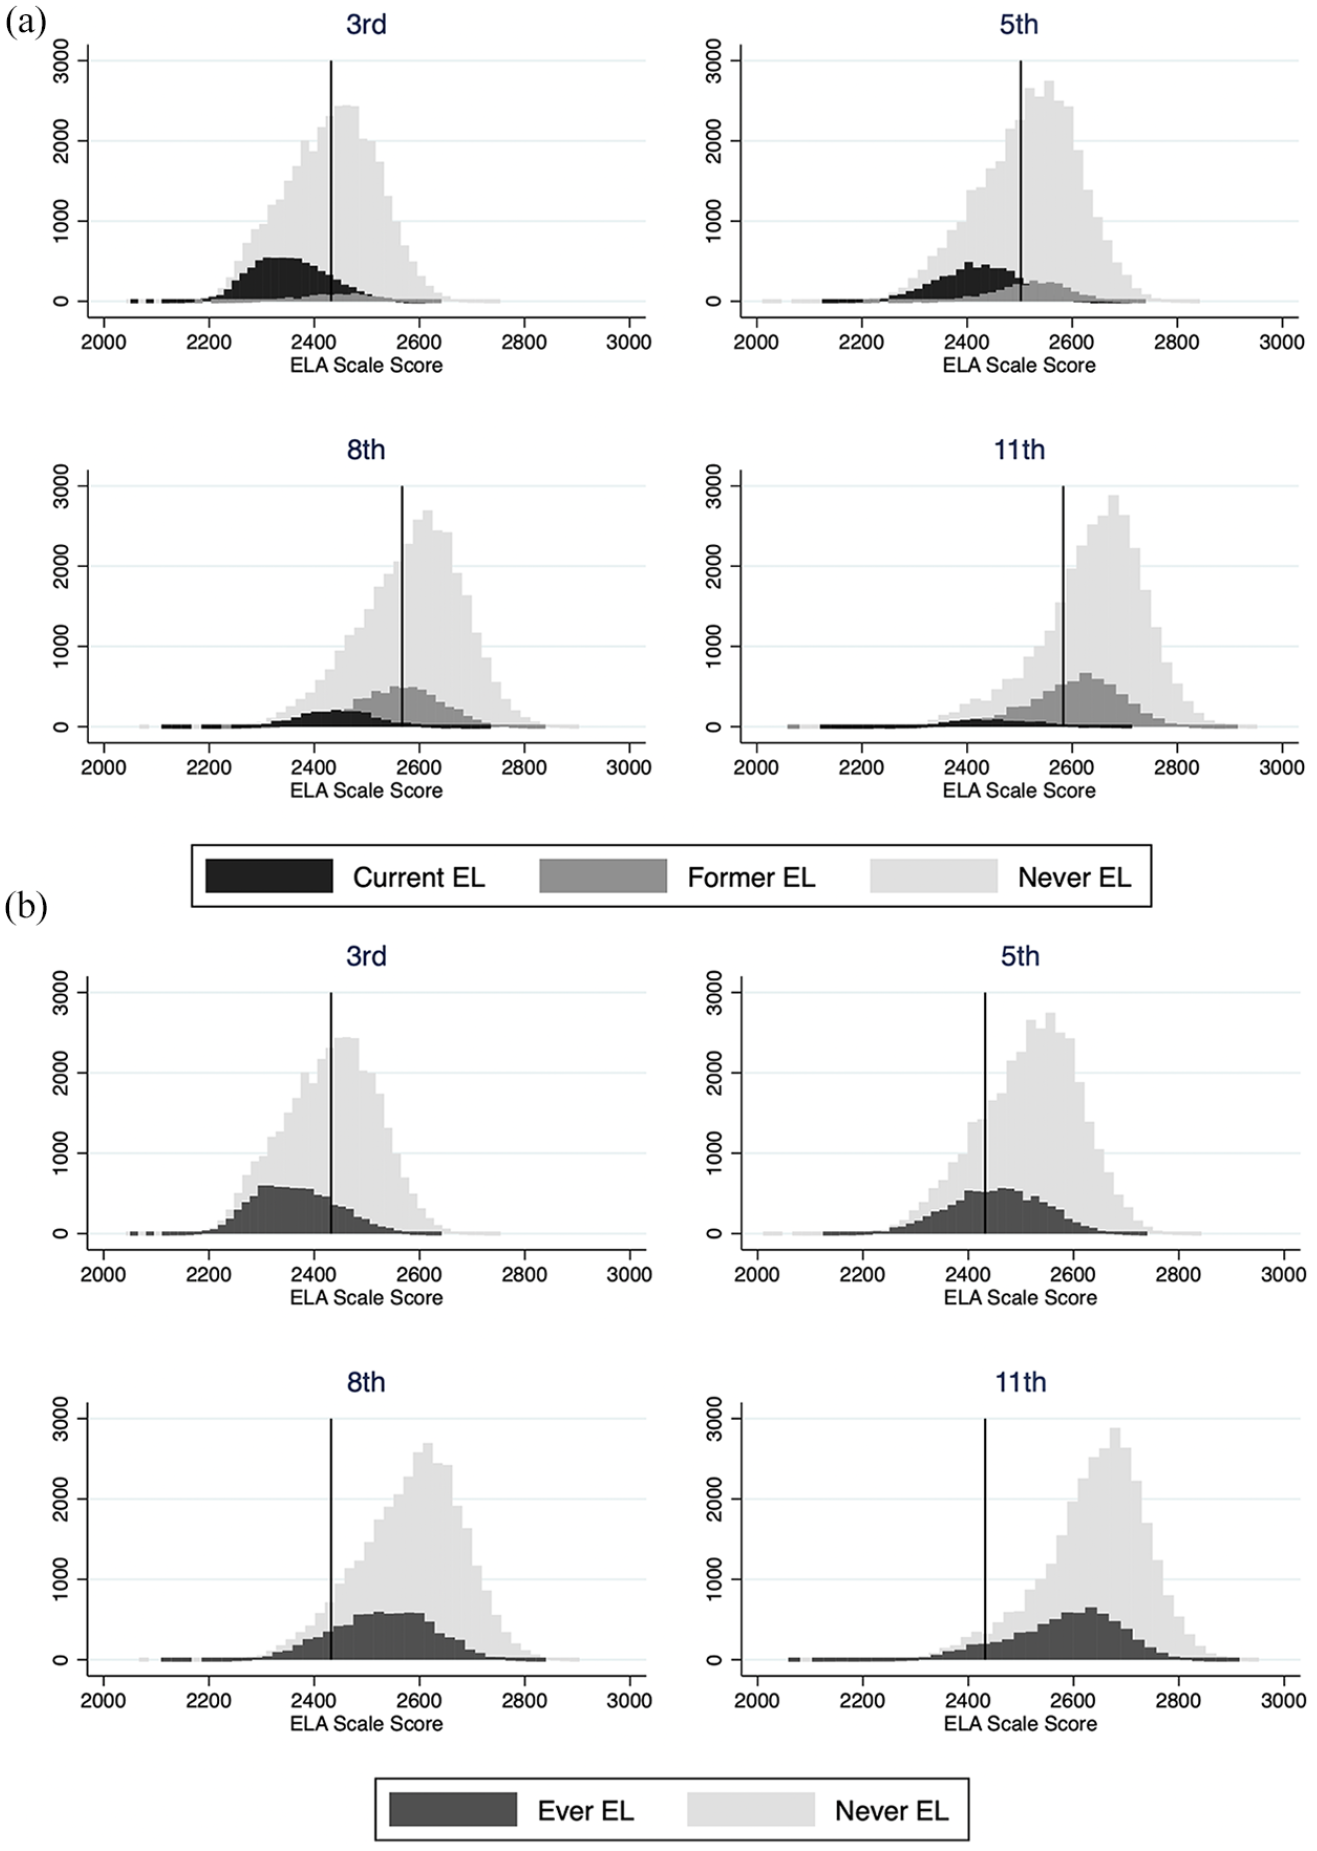
(a) Distribution of ELA scale scores by grade for current, former, and never ELs, 2016-2017 and (b) distribution of ELA scale scores by grade for ever, and never ELs, 2016-2017.
Several features of these figures are notable. First, regarding student group size, Figure 2a demonstrates that, as expected, current ELs substantially outnumber former ELs at lower grade levels, but the former EL population increases at later grade levels, eventually substantially outnumbering current ELs. Second, regarding outcomes, while the majority of current ELs score below the proficient cut point on the ELA assessment, former ELs’ scale scores are much higher, with a distribution that closely resembles that of the never EL group; these findings are also as expected, given prior research (e.g., Saunders & Marcelletti, 2013). Third, and perhaps most importantly, regarding relative performance of groups across grades, if we only compared current and never EL performance, we would likely conclude that the achievement gap between the two groups remains large and even increases at later grades. For example, the gap in mean scores for the two groups is 0.84 standard deviations in third grade and is approximately double in size, at 1.75 standard deviations, in 11th grade. While this conclusion accurately describes achievement gaps between current and never ELs at different grades, it ignores the substantial growth in size and the much higher achievement of the former EL group at later grades.
In contrast, by comparing never EL outcomes to ever EL outcomes, Figure 2b stabilizes the populations of students being compared and clearly illustrates the closing of the achievement gap across grade levels. Specifically, the gap between ever and never ELs in mean ELA scores is 0.73 standard deviations in third grade and closes to 0.54 standard deviations in 11th grade. Put another way, at 11th grade, the ELA achievement gap between current and never ELs is more than three times larger than the gap between ever and never ELs. Our framework, which includes the current, former, and combined ever EL groups, and compares all three to never ELs, is powerful in being able to capture academic achievement for a stable group of students (ever ELs) while avoiding the problem of masking the performance of current EL students.
Understanding Educational System Performance
A second use for the four-category EL framework is improving understanding of system performance. System performance is a key focus of education accountability, as illustrated by ESSA’s emphasis on understanding how well education agencies are serving students overall and by student group. However, under current practices, which typically focus on comparing outcomes for current ELs to outcomes for non-ELs, important information about system performance is lost. We demonstrate this with the example of graduation rates.
Graduation rates are perhaps the most widely used metric of education system performance. Unlike test scores, high school graduation has direct relevance to individuals’ employment prospects and future earnings (Murnane, 2013). Under ESSA (2015), high school graduation is a key metric of education system success, with the law stipulating that all schools with graduation rates of less than 67% be identified for comprehensive support and intervention.
Table 1 presents the statewide 4-year cohort graduation rate and number of students for the current, former, ever, and never EL groups. Note that in Oregon, students are included in the current EL group for graduation rate calculations if they were classified as ELs at any point in high school. The graduation rate for the 1,884 students in the current EL group was 54.9%, far below that of students never classified as ELs (77.2%). This suggests an urgent need for more attention to supporting current ELs’ graduation. At the same time, reporting outcomes for only current ELs obscures the important information that the graduation rate for the state’s 5,868 former ELs was 80.0%, which is significantly higher than the graduation rate for students never classified as ELs (p < .05). The graduation rate for the combined ever EL group, therefore, was slightly (and significantly) below, but relatively close to, the graduation rate for never ELs since former ELs outnumber current ELs more than three to one.
Four-year Adjusted Cohort Graduation Rates, by Language Proficiency Group, 2016-2017.
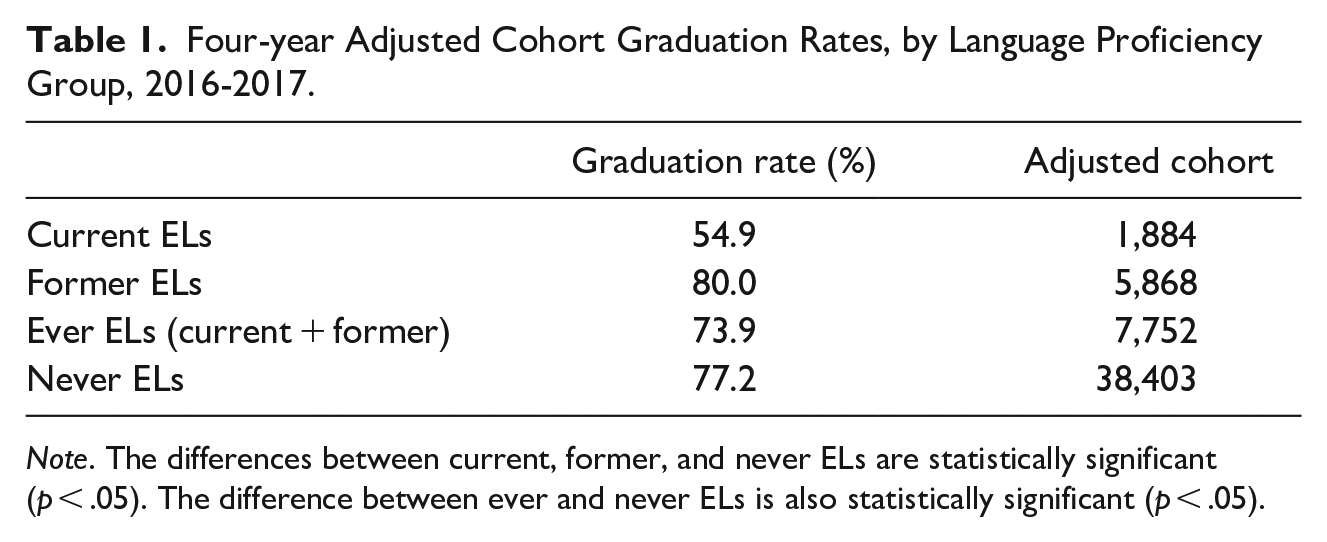
Note. The differences between current, former, and never ELs are statistically significant (p < .05). The difference between ever and never ELs is also statistically significant (p < .05).
This data demonstrates the importance of calculating outcomes for all four groups in order to understand system performance. The ever EL group is most useful for understanding how well education agencies are serving the full group of students who enter school classified as ELs. However, having disaggregated information for current and former ELs is also informative and begins to provide information about where additional interventions may be needed.
Understanding Patterns in Opportunity to Learn
Typically, debates about EL analytic frameworks have focused on achievement outcomes (Hopkins et al., 2013; Kieffer & Thompson, 2018; Saunders & Marcelletti, 2013). However, ESSA’s provision that states must include at least one indicator of school quality and student success in their accountability systems, has generated increased focus on equity indicators (Kostyo et al., 2018). These equity indicators often provide information about students’ opportunity to learn (Oakes, 2005). By understanding patterns in students’ opportunity to learn, we can potentially understand areas in which system-level intervention is needed to improve these opportunities and thereby potentially improve outcomes downstream. For each of our four groups—current, former, ever, and never ELs—we tabulated information about two equity indicators in Oregon: a measure of exclusionary discipline and a ninth grade on-track measure. Currently, Oregon uses the ninth grade on-track measure as an equity indicator in its accountability system and is exploring the use of exclusionary discipline data as an equity indicator in the future. We discuss data for each of these measures.
Nine states currently include an indicator related to discipline in their ESSA school accountability system (Kostyo et al., 2018). As Oregon considers the possible use of exclusionary discipline data in its accountability system, one option is to report the percentage of students in grades 6 to 8 who have been suspended (in- and out-of-school) or expelled during the past year. Table 2 presents this information for current, former, ever, and never ELs, along with the number of students in each group. Once again, we see markedly different outcomes for current and former ELs. Among sixth to eighth grade current ELs, 12.9% were suspended or expelled in 2016-2017 compared to 9.1% of former ELs. The suspension/expulsion rate for former ELs was slightly (though not significantly; p = .644) below the rate for never ELs (9.2%). Given that fewer students have been reclassified at the middle school level than at the high school level, the current EL group is proportionally larger here than in Table 1, which displayed graduation rates. Therefore, the suspension/expulsion rate for the aggregated ever EL group (10.6%) is less similar to the never EL rate than it was for graduation data. In this case, calculating outcomes for the disaggregated current and former EL groups reveals that current ELs experience exclusionary discipline at a significantly higher rate than do former ELs (p < .05), constraining their opportunity to learn. Thus, intervention may be needed to address this disparity.
Percentage of Sixth to Eighth Graders With at Least One Suspension or Expulsion, by Language Proficiency Group, 2016-2017.
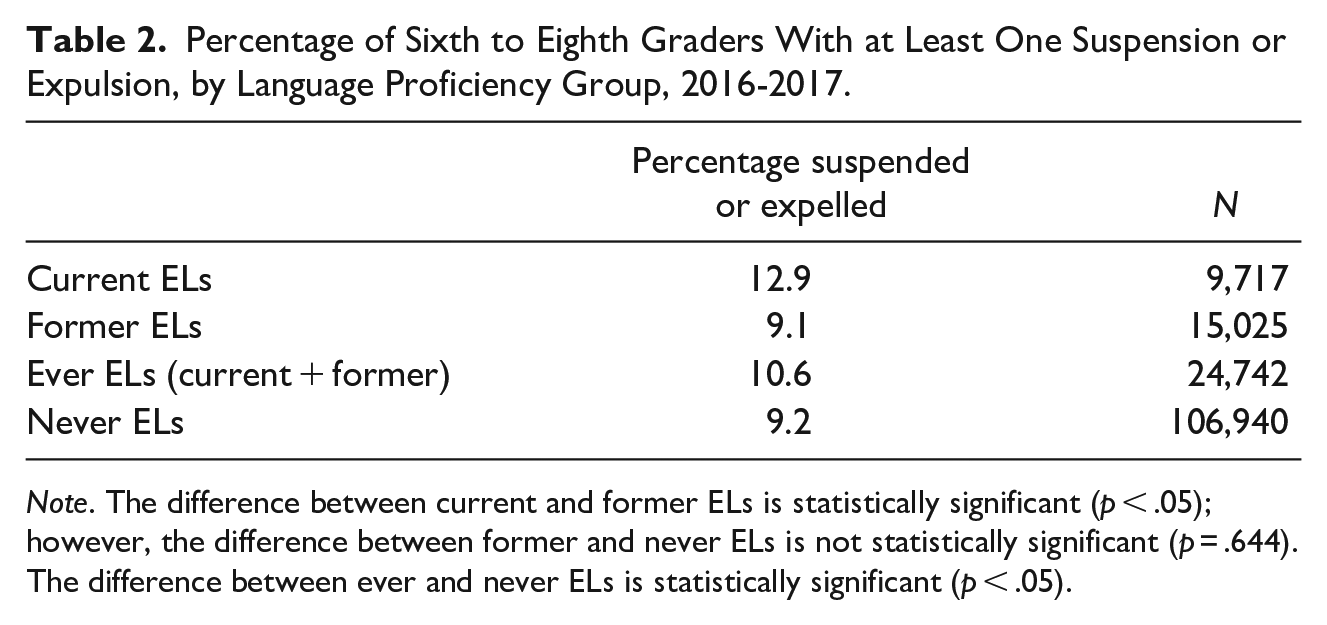
Note. The difference between current and former ELs is statistically significant (p < .05); however, the difference between former and never ELs is not statistically significant (p = .644). The difference between ever and never ELs is statistically significant (p < .05).
Another equity indicator that 15 states, including Oregon, have incorporated into their school accountability systems is a measure of ninth graders’ progress toward on-time graduation, often referred to as a ninth grade on-track measure (Achieve, 2018). While states calculate ninth grade on-track measures differently, all include information about the number of credits that students have accumulated by the end of ninth grade (Achieve, 2018). In Oregon, the measure indicates whether a student has completed one-fourth of the total credits their district requires for graduation. Oregon’s measure does not consider the content areas in which students have completed credits, only whether one-fourth of the total credits have been completed. Table 3 displays the ninth grade on-track rate for current, former, ever, and never ELs.
Percentage of Ninth Graders On-Track, by Language Proficiency Group, 2016-2017.
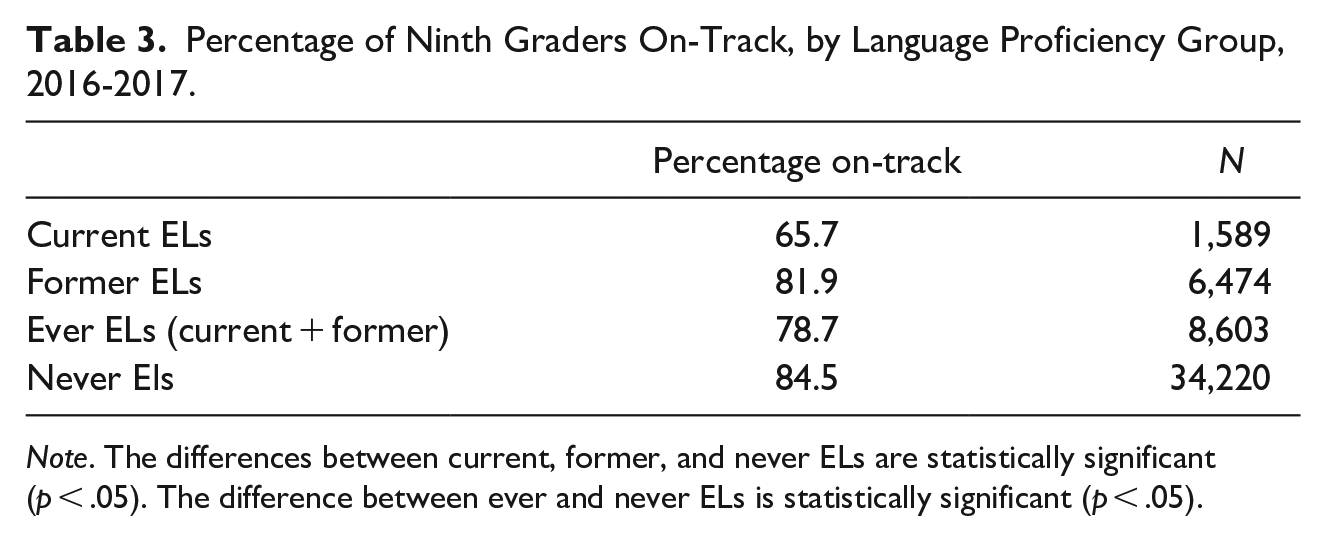
Note. The differences between current, former, and never ELs are statistically significant (p < .05). The difference between ever and never ELs is statistically significant (p < .05).
In this case, we again see that current ELs had concerning outcomes compared to other groups, with only 65.7% of students on-track to graduate after their ninth grade year. However, unlike with discipline or graduation data, we see that former ELs were also less likely than never ELs to be on-track at the end of ninth grade, with former ELs’ ninth grade on-track rate at 81.9% compared to never ELs’ rate of 84.5%. The difference is small but statistically significant (p < .05), and suggests that, in this domain, educators may need to examine factors impeding both current and former ELs’ opportunity to learn during ninth grade. For former ELs, this may include considering ways in which students’ experiences prior to reclassification may be impeding their progress. In addition, this finding suggests a potential need for more robust monitoring processes to determine whether former ELs may need additional support.
Shedding Light on Possible Causes of Student Performance Patterns
Another use for the four-category EL framework is illuminating potential causes of observed student performance patterns. Descriptive statistics, including reporting outcomes by student group, cannot identify and prove causal mechanisms, but they can, at times, shed light on these mechanisms, and direct leaders’ attention toward areas of concern. We illustrate this benefit of the four-category EL framework with an example regarding ELs with disabilities.
In recent decades, there has been considerable concern stemming from observably high proportions of EL students with disabilities, especially in the middle and high school grades. These observations have led to questions about possible over-identification of ELs with disabilities and proposed changes to procedures for evaluating ELs for special education services (Artiles et al., 2002; Layton & Lock, 2002). While appropriate identification procedures are critical, our four-category EL framework provides suggestive evidence (which has been more rigorously supported elsewhere) that the main mechanism behind the observed disproportionality of ELs in special education might be barriers to reclassification rather than over-identification (Umansky et al., 2017; Murphy & Johnson, 2020).
Figure 3 presents information about special education rates among current, former, ever, and never ELs, by grade. As the top left-hand panel shows, in 6th to12th grades, at least one-fourth of current ELs received special education services, with rates rising to a peak of 35% in eighth grade. However, much lower proportions of former ELs received special education services, with rates ranging between 5% and 10% at most grade levels. Meanwhile, comparing rates of special education participation for ever and never ELs, as illustrated in the bottom panels of Figure 2, shows strong similarities between the two groups, with rates ranging from 11% to 17% across grade levels.
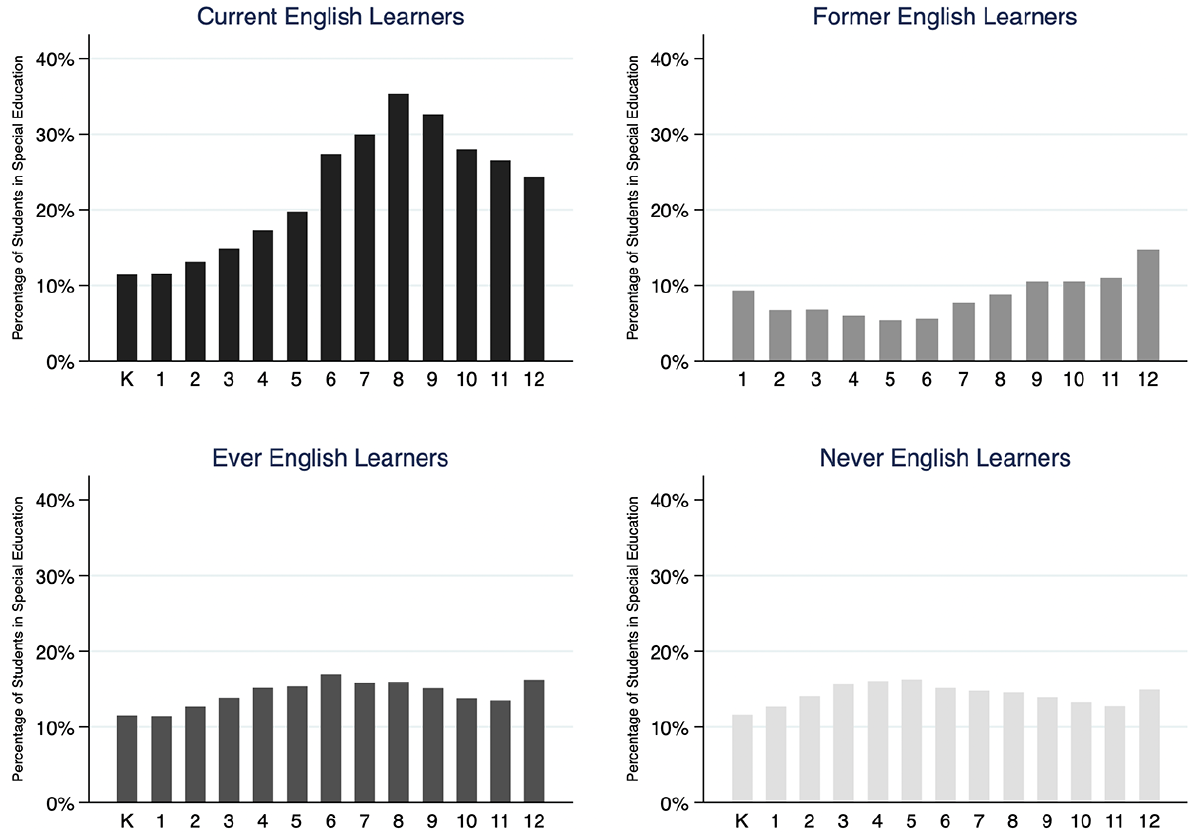
Percentage of students in special eduation by language classification and grade, 2016-2017.
This analysis confirms prior work that the high proportion of current ELs who receive special education services may not be driven primarily by rampant over-identification of ELs with disabilities. Instead, the growing proportions of current ELs with disabilities by grade level suggests that ELs with disabilities may be disproportionately less likely to attain English proficiency and exit EL services than are ELs without disabilities (Umansky et al., 2017; Kieffer & Parker, 2016). Analyzing special education rates for each of the four EL groups enables this insight to emerge, allowing educators and policymakers to direct less attention to preventing over-identification of ELs with disabilities (though of course that could still be a concern in particular contexts and for particular disability categories) and direct more attention to considering appropriate reclassification policies and procedures for ELs with disabilities.
Including Schools in Accountability Systems
We now shift from describing uses of the four-category EL framework for reporting purposes to presenting uses of the four-category EL framework for accountability purposes. A focus of accountability systems is identifying schools in need of improvement. The indicators discussed above—academic achievement, equity, and graduation rates—are all required components used to identify schools. Outcomes for students overall and for particular student groups both play important roles in the identification process. Under ESSA (2015), states must establish the minimum number of students required for outcomes to be reported and used for accountability purposes. As discussed above, these n-size rules have significant implications because they determine which schools receive ratings for particular indicators, which in turn determines which schools may be identified as in need of support and intervention based on these indicators. In Oregon, there are multiple tiers of support and interventions depending on the number of schools identified within a single district. The process includes needs assessment, planning, identification of evidence-based interventions, and implementation. Supports and interventions from the state agency may include technical assistance (e.g., leadership coaching, participation in professional learning communities), logistical assistance (e.g., support to engage community partners, coherence across federal and state initiatives), and financial assistance (e.g., direct allocations, support for braiding, and blending financial resources).
To explore how the use of a four-category EL framework would impact the number of schools receiving ratings for key metrics in Oregon’s accountability system, we used graduation rates as an example. As noted above, graduation rates are a key metric in ESSA (2015) because the law stipulates that all schools with graduation rates below 67% be identified for support and intervention. However, because the current EL population is substantially smaller in higher grades (USED, 2020), high schools are less likely than elementary or middle schools to meet n-size requirements for the EL group. As a result, high schools are less likely to receive accountability ratings for EL metrics. As we show, using a four-category EL framework could help address this issue.
For this analysis, we calculated the number of schools that would receive graduation ratings if ratings were given for the former, ever, and never EL groups (in addition to the current EL group). Presently, if high schools do not meet a state’s minimum n-size for the EL group, they will not receive a rating for their EL graduation rate and therefore will not be identified as in need of support and intervention on the basis of this indicator.
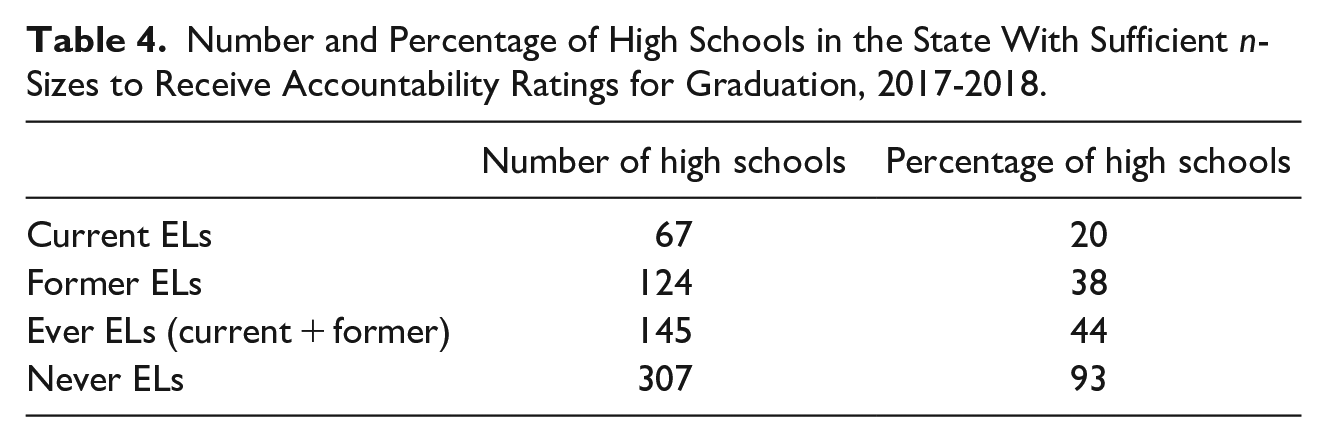
Using graduation data from 2015-2016 through 2017-2018, Table 4 provides information about the number of schools within Oregon that had sufficient students (n-size = 20) for each group (current, former, ever, and never ELs) to receive an accountability rating for that group (if rating each of these four groups was allowable). Following recommendations from research (Linn & Haug, 2002), we pooled data across 3 years when calculating the n-size. 4 Therefore, schools were given a rating if they had a total of at least 20 students in the student group over 3 years, the maximum timeframe allowed under ESSA. As Table 4 illustrates, only 67 high schools in the state—or approximately one-fifth of state high schools— had a sufficient number of current ELs to receive an accountability rating for this group’s graduation rate. In contrast, because most students who enter school as ELs have been reclassified by high school, nearly twice as many schools (124) had a sufficient number of former ELs to (hypothetically) receive an accountability rating for their former EL graduation rate. Because the ever EL category includes both current and former ELs, the number of schools with sufficient ever ELs to (hypothetically) receive an accountability rating for their ever EL graduation rate was even higher (145) and included close to half of the state’s high schools.
Number and Percentage of High Schools in the State With Sufficient n-Sizes to Receive Accountability Ratings for Graduation, 2017-2018.
As described earlier, prior reports have raised concerns about masking the performance of current ELs if accountability systems focus on analyzing outcomes for the aggregated ever EL group (Lavadenz et al., 2018). This concern is valid. However, existing practices also obscure current EL performance. At present, many ELs are not included in states’ accountability systems, particularly for indicators other than academic achievement, because they attend schools that enroll fewer ELs than the state’s n-size. Specifically, in Oregon, 263 high schools, which enroll 17% of the current EL group used for graduation ratings, are not given an accountability rating for EL graduation because they do not meet the n-size of 20 EL students.
Rather than providing ratings only when the current EL group meets the minimum n-size, states could instead provide separate ratings for each of the four categories—current, former, ever, and never ELs—that do meet the minimum n-size. Some schools would have ratings for all four categories, while others would have ratings for only some categories. Importantly, this expanded rating system could potentially increase the proportion of schools that are eligible to receive support and intervention for EL outcomes while also not obscuring information about current EL performance. Schools would still receive ratings for the current EL group if they met the minimum n-size for current ELs. But in addition, they would receive ratings for their former, ever, and never EL outcomes when meeting the minimum n-size for those groups. Under this proposed system, schools serving smaller numbers of current ELs (below the minimum n-size) could potentially still be eligible for support and intervention for their EL outcomes (on the basis of their former and/or ever EL graduation ratings). This is important because prior work has shown that these low-incidence schools face unique challenges in serving ELs (Consentino de Cohen et al., 2005) and may have concerning EL outcomes (Callahan et al., 2009). 5
Identifying Schools Under Accountability Systems
Having discussed the use of current, former, ever, and never EL categories for inclusion of schools under state accountability systems, we now turn to a discussion of the identification of schools for support and intervention under these systems. As noted above, states have substantial leeway in designing their school rating and identification systems, and analysis of state ESSA plans has documented wide variation in these systems (Villegas & Pompa, 2020). Of course, states are currently bound by ESSA regulations, which, as noted above, do not allow former ELs to be included in indicators other than academic achievement (USED, 2017). Thus, states are not calculating or reporting accountability ratings for any language proficiency group other than current ELs (or, in the case of academic achievement indicators in some states, current ELs plus former ELs who were recently reclassified). However, for exploratory purposes, we calculated hypothetical ratings for current, former, ever, and never EL graduation rates, in order to explore what additional insights might be gained.
In Oregon, for each indicator included in the state’s accountability system schools receive ratings on a scale from 1 to 5, for students overall and for each student group that meets the state’s minimum n-size. For each indicator, Level 1 is below the 10th percentile. Level 2 is from the 10th percentile to below the state average. Level 3 is from the state average to less than the midpoint between the state average and the long-term state goal for 2024-2025. Level 4 is from the midpoint between the state average and long-term state goal up to, but not including, the long-term goal. Level 5 is equal to or greater than the long-term state goal. The long-term goal for graduation rates is that at least 90% of students will graduate in 4 years. 6
A profile of school ratings is then used to identify schools in need of support and intervention. Again, ESSA (2015) requires that any high school with a graduation rate of 67% or less be identified for support and intervention. In Oregon, this means that all high schools with a rating of 1 for graduation overall are identified for comprehensive support and intervention. 7 High schools with a rating of 1 for any particular student group(s) may be identified for targeted support and intervention if at least 50% of the accountability indicators for that group receive a rating of 1 (Oregon Department of Education, 2018).
Figure 4 provides histograms of hypothetical school-level accountability ratings for each group’s graduation rates. The y-axis shows the proportion of high schools with each (hypothetical) accountability rating. Several findings are apparent. First, high schools tended to have higher ratings (e.g., higher graduation rates) for the former EL group than the never EL group (which aligns with the findings presented earlier in Table 1). Sixty-one percent of high schools had accountability ratings of 4 or 5 for their former EL graduation rate while only 45% of high schools had accountability ratings of 4 or 5 for their never EL graduation rates. Another trend is the comparatively low outcomes of current ELs. The majority of the state’s high schools fell into accountability categories 1 and 2 for their current EL graduation rates. However, we also saw substantial variation across high schools in some areas. For example, while most high schools received relatively high ratings for their former EL graduation rates, 15% of high schools had a rating of level 1 for this group. Meanwhile, accountability ratings for ever EL graduation rates were relatively evenly distributed across the five possible categories. Thus, we see that opportunities and outcomes for current, former, ever, and never ELs vary across the state’s high schools, and some schools may need additional support and intervention to improve these opportunities and outcomes for groups that are not currently part of accountability systems.
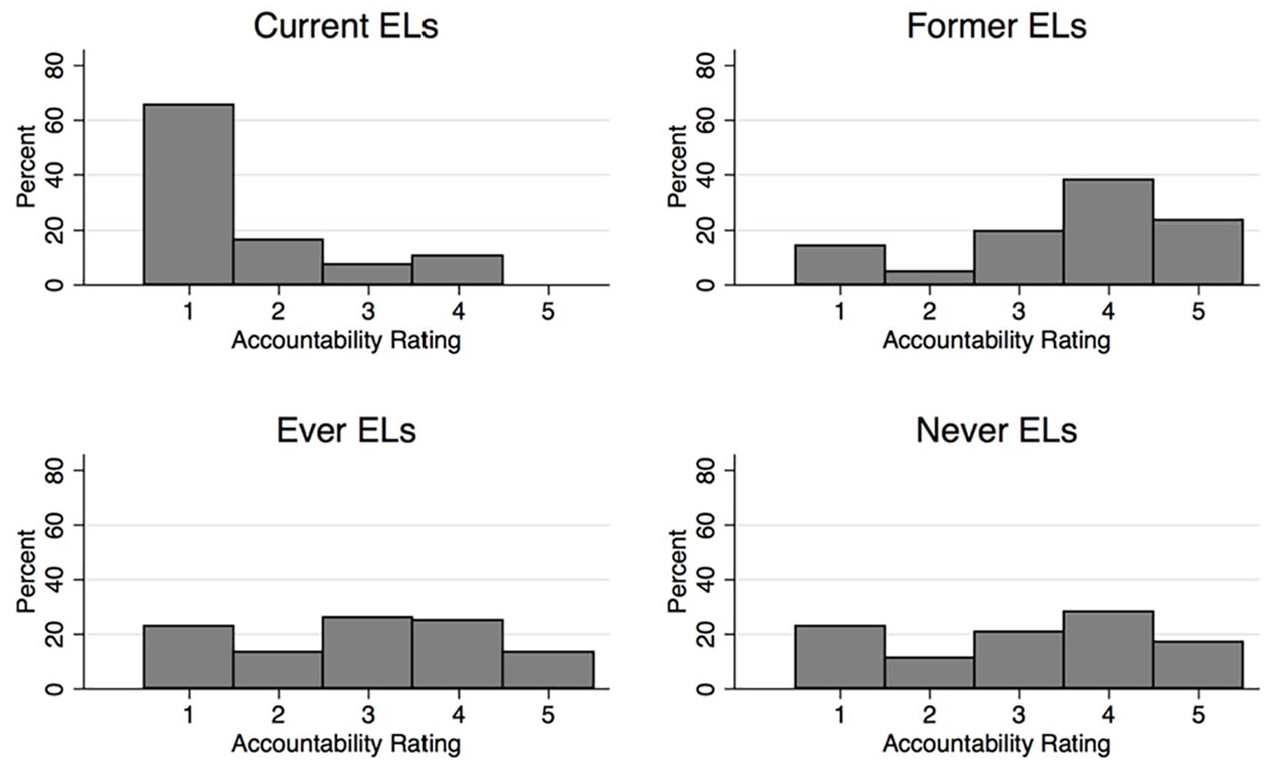
Percentage of high schools with each graduation accountability rating by language proficiency subgroup.
Looking at individual schools further illustrates the potential of the four-category EL framework to identify areas in which schools might benefit from support and intervention. Table 5 shows four distinct patterns of graduation rates across groups. Each school listed is a real high school in the state, with columns listing the accountability rating that group would receive for its graduation outcomes according to the state’s rating scale. The penultimate column lists the number of other state high schools that showed that pattern (among the 65 high schools with sufficient students to have accountability ratings for each of the four groups), and the last column describes the pattern observed. All four schools had accountability ratings of 1 for the current EL group. However, accountability ratings for the other groups varied, suggesting possible differences in appropriate supports and interventions. School C had low accountability ratings for all four EL groups, where low is defined as ratings of 1 or 2 (which in this state corresponds to graduation rates of 73% or below). In total, seven high schools in the state exhibited this pattern. In contrast, school B had high accountability ratings for all groups except current ELs, where high is defined as accountability ratings of 4 or 5. This pattern appeared in eight state high schools. Meanwhile, school A also had a low accountability rating for current ELs while accountability ratings for the other three groups varied. This pattern was the most prevalent, found in 14 of the state’s high schools. Finally, school D showed low accountability ratings for the current, former, and ever EL groups but a high rating for the never EL group. This pattern was only found in this one high school.
Patterns of Graduation Rates for English Learner Groups and Number of State High Schools Exhibiting the Pattern.
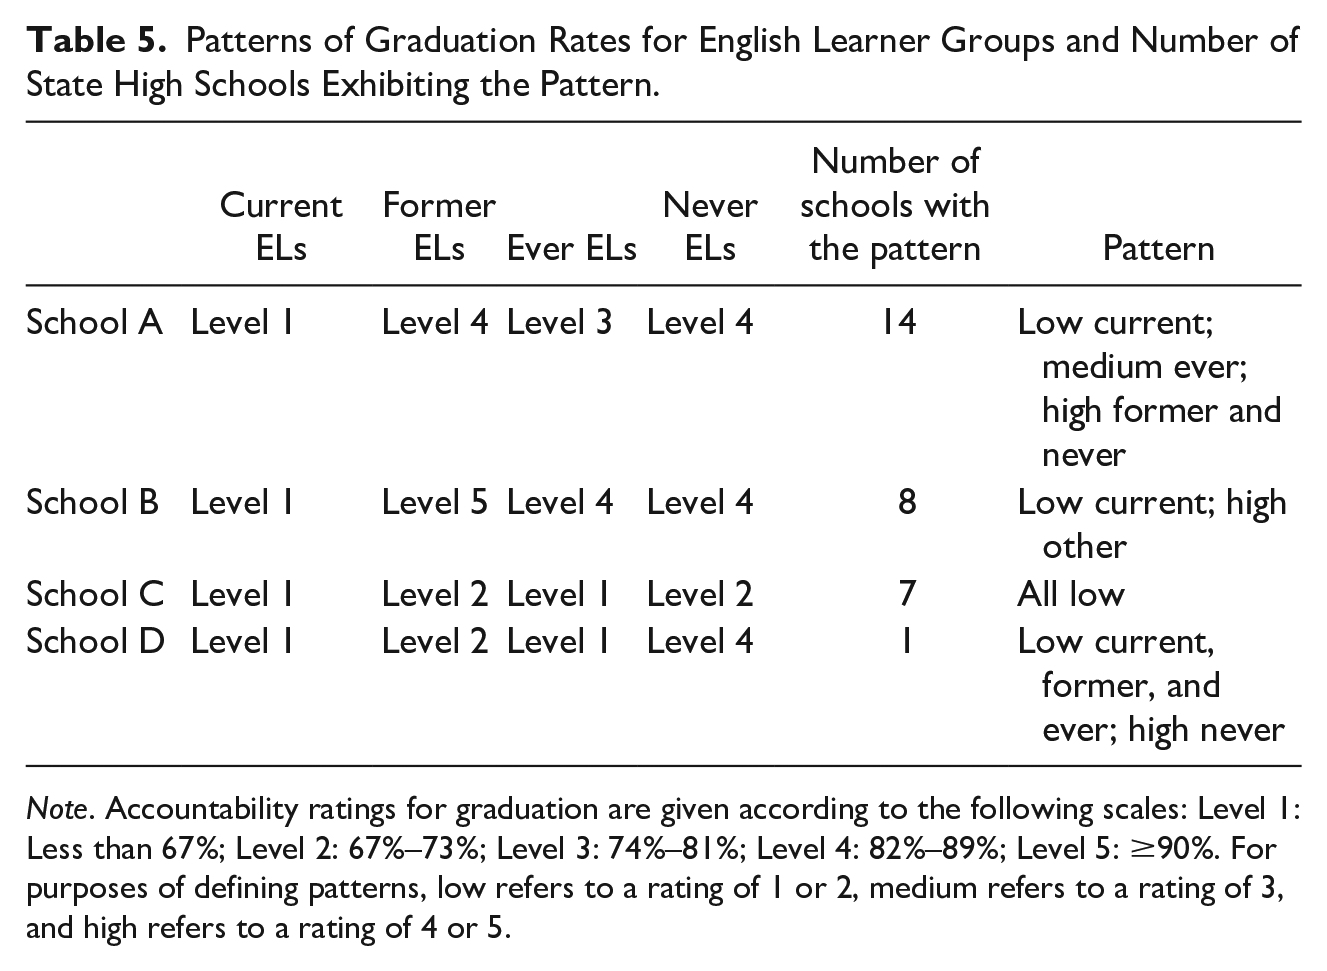
Note. Accountability ratings for graduation are given according to the following scales: Level 1: Less than 67%; Level 2: 67%–73%; Level 3: 74%–81%; Level 4: 82%–89%; Level 5: ≥90%. For purposes of defining patterns, low refers to a rating of 1 or 2, medium refers to a rating of 3, and high refers to a rating of 4 or 5.
Presently, as described above, the state’s high schools only receive accountability ratings for one of these groups, current ELs. However, the variety of patterns that exist across the four groups suggests a need for nuance in identification and intervention. For example, schools such as school C, which had low graduation rates for all four groups, may need different supports and interventions than schools such as school B, which had a low graduation rate for current ELs but much higher graduation rates for former, ever, and never ELs. Without reporting graduation rates for each of these four groups, salient differences between schools are masked.
Discussion
Policy Implications
This study has examined the utility of expanding the analytic framework for understanding English learner outcomes to include information about current, former, ever, and never ELs. Existing frameworks, including the current EL versus non-EL framework, and the ever EL versus never EL framework, both have important weaknesses that limit their ability to provide comprehensive and actionable information for improving EL education. Our proposed four-category framework connects more directly to the underlying typology of EL student groups, differentiating students based on whether they are currently proficient in English and whether they were ever identified as English learners (see Figure 1).
Using statewide data, we have highlighted six areas in which expanding the current framework to include all four groups of students would facilitate better understanding of students’ outcomes over time, better understanding of education system performance, more nuanced information about opportunity to learn, more accurate identification of possible causes behind patterns that emerge in EL outcomes, and improved inclusion and identification of schools under accountability systems. Importantly, we argue not for the dissolution of the current EL category, a category that offers critical information about the experiences and outcomes of students with the EL classification. Rather, we argue for an expanded analytic framework. We close with a brief discussion of the implications of this more expansive framework.
A first implication is that the ever EL category should not serve as a replacement for the current EL category—and researchers, educators, and advocates should not treat it as such. Instead, the ever EL category should be added to analysis and reports of EL outcomes in order to provide a fuller picture of student opportunities and needs, system performance, and next steps. Second, providing information about current and ever ELs is also not enough. The former EL category and the never EL category are also important when assessing EL education. Specifically, former ELs may face specific equity barriers—our analysis points to credit accumulation as one possible barrier—that are lost when former ELs are clustered with never ELs. In addition, the never EL group is a more appropriate, stable comparison category than the non-EL group. Third, we hope that this analysis, paired with prior work (Kieffer & Thompson, 2018; Saunders & Marcelletti, 2013), convinces important stakeholders, including the U.S. Department of Education, to refrain from comparing outcomes of current ELs across grade levels. It is concerning that this practice continues despite clear and convincing evidence that the practice is misleading.
Importantly, implementing our proposed four-category framework may not pose a significant workload increase for states. State data systems already identify current ELs and track students over time. As such, simple data organization decisions can facilitate the development of a single data element that identifies each student, by year, as a current, former, or never EL. This single change will allow for reporting about all four categories of students. Oregon along with other states, has implemented these changes and now can easily run reports for any and all of the four student categories. In Oregon, the shifts needed to identify and report outcomes for these four categories required strategic leadership, plus collaboration and communication across offices within the agency, including staff from information technology, federal programs (e.g., Title III), and accountability and reporting. However, the shifts were not technically difficult or costly because the calculation of the former, ever, and never EL flags relied on existing data fields (e.g., EL exit date) and did not require additional data collection.
ESSA does not prohibit states from reporting additional student groups beyond those that are federally required. Therefore, we strongly encourage state education leaders to report outcomes for current, former, ever, and never ELs now. While outcomes for former, ever, and never ELs cannot currently be used to identify schools under state accountability systems, information about these groups (along with the existing current EL group) could provide important insights, as we have described. In addition, if states begin reporting outcomes for all four student groups, this could potentially catalyze changes in federal law and policy toward requiring such reporting. In addition, we believe that the next reauthorization of the Elementary and Secondary Education Act should include a mandate to use these four categories for accountability purposes (contingent on n-size). This would increase school inclusion in state accountability systems and could lead to more nuanced interventions and supports.
Limitations and Directions for Future Research
This study was a first step toward using a four-category EL framework. It was limited to data from one state and limited to a few important outcomes. Future work should examine additional outcomes across diverse contexts and states. In addition, more research is needed regarding the former EL category. As we show, former ELs have outcomes that exceed those of never ELs in some areas but troublingly low outcomes in other areas. Former ELs should not be forgotten but instead be the focus of future study, including documenting and analyzing education agencies’ federally required monitoring practices.
Finally, while we contend that reporting information about current, former, ever, and never EL groups would be a valuable step in the right direction, we urge researchers, practitioners, and policymakers to continue and deepen efforts to further explore variation among multilingual students’ experiences and outcomes. There is much more we can learn about newcomers, ELs from a variety of linguistic backgrounds, ELs with limited or interrupted formal education, refugee students, ELs with diverse gender identities and sexual orientations, immigrant versus second generation students, and other manifestations of difference.
In closing, recognizing and intervening to improve the opportunities, experiences, and outcomes of students acquiring English depends on clear, well-grounded knowledge and understanding. In this paper we argue that a current-former-ever-never EL analytic framework helps accomplish this goal. It sheds light on how current ELs are doing, while contextualizing this within an understanding of the outcomes of a stable student population (ever ELs). Further, it demands attention for a previously ignored group of students, former ELs, and establishes an appropriate, and stable comparison group, never ELs. We hope that this framework, which may require little to no additional work on the part of educators and administrators, will be of great utility and widely used to improve knowledge and understanding that will benefit EL students.
Footnotes
Acknowledgements
We thank our collaborators from the Oregon Department of Education for their feedback on this work.
Declaration of Conflicting Interests
The author(s) declared no potential conflicts of interest with respect to the research, authorship, and/or publication of this article.
Funding
The author(s) disclosed receipt of the following financial support for the research, authorship, and/or publication of this article: This research was supported by grants from the Institute of Education Sciences (Grant R305H140072) and the Spencer Foundation (Grant 201600112). The views expressed are those of the authors and do not necessarily reflect the views of the funders.