
Abstract
Broadband is not equally accessible among students despite its increasing importance to education. We investigate the relationship between broadband and housing policy by joining two measures of broadband access with Depression-era redlining maps that classified neighborhoods based in part on racist and classist beliefs. We find that despite internet service provider self-reports of similar technological availability, broadband access generally decreases in tandem with historic neighborhood classification, with further heterogeneity by race/ethnicity and income. Our findings demonstrate how past federally-developed housing policies connect to the digital divide and should be considered in educational policies that require broadband for success.
Introduction
The sudden shift to online schooling during the COVID-19 pandemic quickly demarcated and, in some cases, exacerbated existing race- and income-aligned disparities in broadband access (Ong, 2020). While limited access to the internet can make it difficult to engage in modern society along many dimensions (Dharma et al., 2010), students with poor broadband connectivity can face particular barriers to their educational progress. Prior to the pandemic, approximately 30% of all public K-12 students lacked the ability to connect to the internet in their homes (Chandra et al., 2020), and approximately 17% of teenage students reported being unable to finish homework due to poor internet connectivity (Anderson & Perrin, 2018). After shifting to remote instruction in spring 2020, many districts responded to broadband access disparities by offering students internet-connected devices and in-home hot spots as well as by repurposing school buses to serve as mobile WiFi connection points (Levin, 2020). Despite these and other mitigation efforts, concerns about the disparate impact of technological access on learning loss remain (Kuhfeld et al., 2020).
At the higher education level, access to high-speed broadband is associated with more robust college application behaviors (Dettling et al., 2018) and increased distance education course enrollment (Goodman et al., 2019; Skinner, 2019). Enrollments in online courses have increased over the past decade (Xu & Xu, 2020), with 37.2% of all college students taking at least some of their courses online and 17.6% enrolling exclusively in distance education courses just prior to the pandemic (U.S. Department of Education, National Center for Education Statistics, 2021). For students living in education deserts, online coursework may represent the only way to access higher education (Hillman, 2016; Klasik et al., 2018). Studies conducted during the COVID-19 pandemic, when nearly all higher education shifted online (Marsicano et al., 2020), found that the reliability of internet connectivity was positively correlated with students’ ability to complete online college course work (Armstrong-Mensah et al., 2020) and with the educational value of the online college experience (Zalat et al., 2021). Because it is likely that both K-12 and higher education in the post-pandemic era will include ever-increasing reliance on online interactions (Darling-Hammond et al., 2020; Lockee, 2021), it is important to understand and mitigate disparities in broadband access as a matter of educational equity.
Much of the prior research on the digital divide has focused on differences between urban/suburban and rural areas (Copps, 2009; LaRose et al., 2007; West & Karsten, 2016). This concern is warranted as last-mile digital connections can be costly and difficult to maintain (Scheibe et al., 2006). Nonetheless, there is also evidence of broadband access disparities within denser urban and suburban areas that are explained by neighborhood and demographic segmentation rather than geographic barriers (Alliance, 2017; Irving et al., 1999). This digital redlining, defined as “the creation and maintenance of technology practices that further entrench discriminatory practices against already marginalized groups” (Gilliard, 2019), can prevent full participation in a technology-dependent society. In this study, we conceptualize access to high-speed broadband internet as part of a student’s geography of opportunity (de Souza Briggs, 2005; Green et al., 2017; Tate, 2008), which is shaped by three tenets: first, that the “intersection of race and property creates an analytical tool through which we can understand social (and consequently school) inequity,” (Ladson-Billings & Tate, 1995, p. 48); second, that the racial and socioeconomic segregation of neighborhoods is related to the segregation of educational resources and opportunities (Green et al., 2017); and third, that differences in geographies of opportunity are not the inevitable result of natural social processes (de Souza Briggs, 2005). We follow a QuantCrit approach (Castillo & Gillborn, 2022; Garcia et al., 2018; Gillborn et al., 2018; Sablan, 2019) to connect various quantitative data sources on historical redlining practices and current broadband access to students’ geographies of opportunity.
Focusing on the historical links between race- and income-based neighborhood segregation and access to other educational resources (Orfield, 1995; Pearman, 2019), we explore the connection between broadband access and the actions of a number of federal agencies created to provide relief to banks and homeowners during the Great Depression. These agencies, which included the Home Owners’ Loan Corporation (HOLC) and the Federal Housing Administration (FHA), helped standardize real estate appraisal methods that entrenched residential segregation and, in the process, produced a number of residential security or redlining maps that classified and ranked neighborhoods in cities across the country based in part on racist beliefs (Jackson, 1987; Michney & Winling, 2020; Rothstein, 2017; Stuart, 2003; Winling & Michney, 2021; Woods, 2012). Demonstrating urban theorist Edward Soja’s (2010) notion that “once spatial injustice is inscribed into the built environment, it is difficult to erase,” (p. 41), scholars in multiple disciplines have shown the continued relevance of these neighborhood classifications and other segregationist policies to a range of social (Aaronson et al., 2020; Mitchell & Franco, 2016; Zhang & Debarchana, 2016), health (Beck et al., 2020; A. Nardone et al., 2020; A. L. Nardone et al., 2020), and educational (Dylan & Cleveland, 2021; Goldring & Swain, 2014; Orfield, 2013; Pearman, 2019; Pearman & Swain, 2017; Reardon, 2016; Vigdor & Ludwig, 2007) inequities more than a half century after their unconstitutionality was legally recognized.
Based on the twin histories of redlining housing practices and differential access to telecommunications technologies required for full participation in our modern educational systems, we ask with this study: are there observable differences in broadband access related to historical redlined neighborhood boundaries and, if so, is there further heterogeneity in access by a person’s race/ethnicity or income? We investigate these questions with complementary data from the Federal Communications Commission (FCC) and the American Community Survey (ACS). Whereas FCC data show whether internet service providers (ISPs) report offering various broadband technologies (e.g., cable modem, optical/fiber) to at least one household in an area, ACS data report the number of persons who have in-home broadband access. Using georeferenced redlining maps from the Mapping Inequality project (Nelson et al., 2020), we assign both sets of broadband measures to HOLC-defined neighborhoods across the country and fit multilevel Bayesian regressions to estimate differences in access across neighborhood grade classifications.
We do not find strong evidence that ISPs provide service at different rates across neighborhood grade classifications as measured by their self-reported data. Using ACS measures, however, we find across-grade differences in in-home broadband access, with communities living in historically lower-graded neighborhoods reporting less in-home broadband access than those living in higher-graded neighborhoods. Our results suggest that remaining neighborhood-based differences in in-home broadband access correlate with past racist and classist housing practices.
Two implications for education policy as they pertain to students’ geography of opportunity follow from our results. First, framings of the digital divide that fall along the rural/urban dimension (Pereira, 2016; West & Karsten, 2016), though important, leave out within-urban and suburban area differences that can affect students living within the same school zone or local college area. Second, an ISP offer of broadband service does not equate to universal access and may instead exacerbate current inequities among students attending the same school (Pearman, 2019). While broadband policy affects nearly all individuals, it is particularly important for students who rely on the internet for homework, research, and online coursework. We argue that understanding the connection between past housing policy and current infrastructural inequities provides clarity about the state’s affirmative responsibility in ameliorating the digital divide among all students.
Background
Disparities in educational opportunity have long been linked to racial segregation in both schools (Reardon, 2016; Reardon et al., 2019) and housing (Dylan & Cleveland, 2021; Goldring & Swain, 2014; Orfield, 2013; Vigdor & Ludwig, 2007). Despite the Supreme Court’s rejection of the doctrine of “separate but equal” for schools in Brown v. Board of Education and subsequent directions that schools should be desegregated with “all deliberate speed” (Brown v. Board of Education of Topeka, 349 U.S. 294, 1955; Brown v. Board of Education of Topeka, 347 U.S. 483, 1954), later rulings in cases like Milliken v. Bradley (Milliken v. Bradley, 418 U.S. 717, 1974), which effectively halted inter-urban school district desegregation plans, were based on arguments that residential segregation was due to private preference, with the implication that insofar as school segregation resulted from de facto situations there was little room for government intervention (Orfield, 1995). Many dispute that residential segregation is completely a matter of private choice, however, and point to a history of de jure government housing policies that effectively segregated White persons in neighborhoods and school districts away from immigrants and persons of color (Orfield, 1995, 2013; Rothstein, 2012, 2017). In this paper, we focus specifically on federal housing programs of the New Deal era, tracing the exclusionary property ownership and residential segregation technologies developed by administrators of HOLC and the FHA (Michney & Winling, 2020; Rothstein, 2012, 2017; Satter, 2009; Winling & Michney, 2021) to current differences in students’ geographies of opportunity as they relate to broadband access (de Souza Briggs, 2005; Green et al., 2017; Tate, 2008).
New Deal-Era Housing Policy and the Codification of Residential Segregation
Attempting to mitigate the effects of the Great Depression, President Hoover signed the Federal Home Loan Bank Act of 1932 (Federal Home Finance Agency, 2011), which created the Federal Home Loan Bank (FHLB) system and its governing board. The FHLB’s board (FHLBB) chartered a number of federally-owned banks that offered membership with low interest loans to private and state-owned banks experiencing liquidity freezes due to instability in the housing market. This legislation paved the way for the flurry of New Deal acts under the Roosevelt administration that created HOLC and the FHA (Federal Home Finance Agency, 2011; Jackson, 1987; Rothstein, 2017). As part of its mission to support home ownership, the federal government used these agencies to institute two key influences on home finance: (1) increased use of affordable long-term amortized mortgages, which replaced home loans that typically had been short-term interest-only home loans; and (2) national use of standardized appraisal methods for real-estate valuation and credit-risk indexing (Fahey et al., 1938; Rothstein, 2017; Stuart, 2003; Woods, 2012).
With oversight from the FHLBB, HOLC was tasked with refinancing at-risk urban and suburban home loans for the “relief of debt-burdened home owners” facing foreclosure (Home Owner’s Loan Act, H.R. 5240, 73rd Congress, 1933; Jackson, 1987; McMichael, 1951, p. 331). 1 As part of their work, HOLC’s appraisal department developed a “nation-wide scientific appraisal procedure and standard appraisal formula” (Fahey et al., 1938, p. 72) for mortgage-risk assessment and property valuation. Established a year after HOLC, the FHA expanded the federal government’s role in housing policy by underwriting insurance for mortgages, largely held by FHLB member institutions, for new construction and new home-loan purchases (Jackson, 1987; Stuart, 2003). Quickly, HOLC’s appraisal methods were centralized among these related federal agencies (Fahey, Webb, Catlett, & Husband, 1937; Fahey, Webb, Stevenson, et al., 1937; Light, 2011; McDonald, 1937; Woods, 2012).
Under the aegis of the FHLBB and FHA, the new scientific real estate standards grew from a cross-pollination of ideas between federal housing agencies (FHLBB, FHA), academic research institutions (Institutes for Research in Land Economics and Public Utilities (IRLEPU)), University of Chicago Social Science Research Committee (UCSSRC), and private real estate organizations (National Association of Real Estate Boards (NAREB) and American Institute of Real Estate Appraisers (AIREA)). Members of these groups included a cohort of Midwestern real estate economists, who were long-time collaborators and authors of some of the earliest real estate textbooks (Weiss, 1989). Together they stitched the strategic government-university-industry partnerships that propelled their regional appraisal practices into nation-wide use (Light, 2011; Weiss, 1989; Winling & Michney, 2021). Two notable examples include NAREB member Frederick Babcock, the FHA’s first director of underwriting and author of the textbook The Appraisal of Real Estate (1924) and the FHA’s Underwriting Manual (1936); and Homer Hoyt, an economist for the FHA’s Division of Economics and Statistics and the FHLBB’s Division of Research and Statistics. Both Hoyt’s dissertation and a subsequent study greatly influenced methods for assigning property value based on neighborhood characteristics (Harriss, 1951; Hoyt, 1933, 1939; Winling & Michney, 2021).
Ostensibly scientific in their desire to professionalize the real estate industry, these texts explicitly revealed the racist and classist assumptions that their authors built into their appraisal methodologies. This includes the FHA Underwriting Manual, in which Babcock ranked the races of property owners and neighborhood inhabitants, and Hoyt’s work, which provided a hierarchical index of race/ethnicity, with a Chicago map coded for race/ethnicity of neighborhood inhabitants to consider when assigning land values. One manifestation of racist beliefs into appraisal practices was that racially segregated neighborhoods became a norm that signaled stability whereas integrated neighborhoods largely signaled neighborhood decline (Babcock, 1924, 1936; Hoyt, 1933, 1939). For the early federal housing leaders, a lack of uniformity in a neighborhood—whether due to variation in housing quality or the demographic make-up of residents—was a measure of instability and to be avoided lest it negatively affect long-term investments (Stuart, 2003; Winling & Michney, 2021). As noted by Fishback et al. (2021), though such beliefs “did not begin with the FHA or HOLC” (p. 7), their application in federal housing policy was new. Furthermore, the same individuals who developed these ideas in the academies and private sector adapted them into federal practices and work products.
The residential security or redlining maps, produced in collaboration between HOLC’s appraisal department and the FHLBB’s Division of Research and Statistics, in which neighborhoods across a number of metropolitan areas were color coded to reflect mortgage credit-lending risk represent one such product (Jackson, 1987). Using Hoyt’s guidelines and the knowledge of local appraisers, neighborhoods were assigned credit risk ratings based on a variety of factors, including the present market value of its properties, estimated cost to improve or replace them, average rental values, and the demographic make-up of its residents (Stuart, 2003). 2 Once collated, these factors were use to place neighborhoods into one of four categories or grades: A (green) “best,” B (blue) “still desirable,” C (yellow) “definitely declining,” and D (red) “hazardous.” Despite a sheen of objectivity, the federal housing agencies’ methods resulted in assigning higher risk and reduced values for properties situated in neighborhoods with non-White and immigrant residents and the highest values and lowest risk to properties in neighborhoods with non-Jewish, American-born White residents (Hoyt, 1933; Jackson, 1987; Nelson et al., 2020; Rothstein, 2017).
Recent research has shown the lingering effects of these federal policies on wealth accumulation and access to opportunity for families and communities across the United States. Redlining supported the partition of communities such that White Americans were more likely to own equity-accruing single-family homes while recent immigrants and Black Americans were more likely to reside in multi-family and rental housing (Hillier, 2005; Nelson et al., 2020; Rothstein, 2017). These demarcations persist today, with neighborhoods that were given the lowest HOLC grade more likely to be classified as low-to-moderate income and majority-minority neighborhoods today (Mitchell & Franco, 2016). Aaronson et al. (2020) show that the “[HOLC] maps account for between 15% and 30% of the overall gap in [the] share African American and home ownership over the 1950 to 1980 period and 40% of the gap in house values” (p. 31). Health researchers have found that gestational age, and perinatal mortality measured over a 10-year period from 2006 to 2015 in California are higher in neighborhoods with lower grades (A. L. Nardone et al., 2020) and that emergency room visits due to asthma are also higher in redlined census tracts (A. Nardone et al., 2020). Dylan and Cleveland (2021) find that schools and districts in “D” graded neighborhoods receive less money per pupil, have less diverse student populations, and have lower average test scores compared to their counterparts in “A,”“B,” and “C” neighborhoods. We add to this growing literature of the downstream effects of Depression-era federal housing policy by investigating the relationship between HOLC-grade neighborhood demarcations, disparities in broadband access, and differential educational opportunities for students partitioned across the digital divide.
Broadband Access and Its Connection to Place and Education
Despite its increasing importance across our society (Dharma et al., 2010), high speed broadband internet remains an “inherently local phenomenon” (Mack, 2020), not openly accessible but rather offered as a limited commodified product. Broadband access remains significantly stratified due to geographical, political, social, and infrastructural barriers (Farlie, 2005).
Research that explores the urban/rural digital divide generally traces geographical constraints of broadband, whereby less-populated areas are offered fewer quality internet service options than urban and suburban areas (Copps, 2009; LaRose et al., 2007; Prieger, 2013; Townsend et al., 2013; West & Karsten, 2016; Wood, 2008). Though shrinking, this disparity endures in part due to provider size and focus, with larger companies serving large and more densely populated—and thus more profitable—metropolitan areas while smaller companies serving smaller communities are unable to meet costs of new and higher-quality infrastructure (LaRose et al., 2007; Wood, 2008). This divide is compounded by consumer-level economic barriers, with companies wanting adoption projections to sufficiently outweigh costs before making infrastructural investments (Hollifield & Donnermeyer, 2003). In addition to issues pertaining to geography and affordability, low technological skills can impede broadband adoption in communities where expanded access is not accompanied by opportunities for training or other assistance (Powell et al., 2012).
Disparities persist not only among rural/urban divides but also within and across urban and suburban areas where disparate economic conditions influence provider investment and readiness of technological support. A National Telecommunications and Information Administration (NTIA) report from the late 1990s revealed differences in telephone, internet (via dial-up modem), and computer access between urban and “central city” areas as well as across racial/ethnic demographic groups and income levels within those areas (Irving et al., 1999). A more recent investigative report using FCC Form 477 data demonstrated how an ISP in Cuyahoga County, Ohio, was much more likely to offer its newest and fastest broadband technologies in suburban middle- and high-income census blocks than in high-poverty census blocks within Cleveland’s city limits (Alliance, 2017).
Such disparities in access matter as students now describe broadband access as a direct educational need (Powell et al., 2012). In addition to take-home assignments and school/parent communication that necessitate home connection (Powell et al., 2012), broadband connectivity within K-12 schools often determines the types and quality of materials teachers and students will be able to use (Fox et al., 2012; Kormos, 2018). One example of this is a students’ ability to access Advanced Placement, dual enrollment, and foreign language courses that, for some schools, are only available through distance learning (Fox et al., 2012; Hudson, 2011; Lee et al., 2022). Related, those in online credit recovery programs may face additional challenges if they lack stable internet connections (Heinrich et al., 2019). Each has downstream implications for students in terms of academic achievement, college readiness and access, and labor market preparedness.
The need for quality broadband becomes more pronounced in the transition from high school to college, when internet resources often play an integral role in how students acquire information when making application decisions (Burdett, 2013). From the initial search stage to matriculation to later success while enrolled, students require fast and consistent internet connections to submit admissions and financial aid applications, complete course assignments, and conduct research (Dettling et al., 2018; Perna, 2010). Many also need broadband to attend class as colleges expand their online offerings (Palvia et al., 2018; Skinner, 2019). Studies have shown that in the short term, students often do not perform as well in online courses as they do in face-to-face courses (see Xu & Xu, 2020 for a recent review of the literature); in addition, outcomes in online courses may differ across student subpopulations (Xu & Jaggars, 2014). Though course design and a student’s self-directed learning readiness may play a role in the difference (Xu & Xu, 2020), it is also possible that some of these differences of outcome between student populations can be attributed to differences in broadband access. In a study comparing dial-up and broadband, Wu and Turner (2006) found evidence that students who relied on slower dial-up connections were less likely to engage with other students in courses that required learner-to-learner interactions. While average broadband speeds have increased since the time of this study, commensurate increases in the sophistication and bandwidth requirements of online courses may mean that students with poorer broadband access continue to face additional challenges.
Housing Policy, Broadband, and the Geography of Opportunity
The historical record is clear that the policies and procedures of HOLC and the FHA supported racial segregation in communities across the United States. Whether cementing existing conditions or encouraging segregation in new housing developments, one outcome was the same: poorer non-White persons had less access to quality housing and the public infrastructure built around it. As lower property values, lower tax bases, and less access to credit compounded over time, neighborhoods deemed “hazardous” by HOLC appraisers in the 1930s remained underdeveloped and under supported into the twenty-first century (Aaronson et al., 2020).
In light of this enduring history of neighborhood disinvestment and the growing importance of the internet, we explore the relationship between historically redlined neighborhoods and current access to broadband as a function of a student’s geography of opportunity (de Souza Briggs, 2005; Green et al., 2017; Tate, 2008). Because broadband access is required for participation in education at all levels—not only during the COVID-19 pandemic, but before and after—we investigate this connection as a potential mechanism for differences seen in student access to and outcomes in online courses as well as traditional classroom settings that rely on internet access for out-of-class work. Better understanding the connection between racist federal housing policies and access to an increasingly necessary educational resource is important not only for gaining a clearer understanding of the history of education in the United States but also for considering targets of and responsibility for remedies.
We use QuantCrit, which is a multidisciplinary approach that fuses insights from Critical Race Theory with statistical research methods (Castillo & Gillborn, 2022; Gillborn et al., 2018; Stage, 2007), as a framework for our analyses. QuantCrit takes seriously the question of whether and/or how “quantitative methods, long critiqued for their inability to capture the nuance of everyday experience, [may] support and further a critical race agenda in educational research,” (Garcia et al., 2018, p. 149). While QuantCrit remains an area of active development in social and health sciences (Baker, 2019; Gillborn et al., 2018; López & Hogan, 2021; Zambrana & Dill, 2006), a number of tenets have coalesced (Castillo & Gillborn, 2022). Most important for our study are the following three:
Racism, sexism and forms of oppression are central to how society is structured and disparities distributed. Disaggregating data by race, sex, socioeconomic and immigration status, and geography as a form of Critical Quantitative Intersectionality can reveal how subcategorized populations experience disparities differently (Covarrubias et al., 2018; Crenshaw, 1991).
Data “do not speak for themselves” but rather require “voice” to be disseminated and translated into meaningful change (Castillo & Gillborn, 2022). The impact of a quantitative study is dependent on the language and perspectives used when framing the data (Covarrubias et al., 2018).
Numbers, data categories, and quantitative methods are not inherently objective, neutral, natural, or scientific. Statistical analysts infuse assumptions and biases in their work, and make subjective decisions in their methods and use of the data they acquire and generate (Castillo & Gillborn, 2022; Gillborn et al., 2018).
In our study we enlist QuantCrit to guide our modeling choices, how we discuss our findings, and how we understand the limitations of our analyses that seek to quantify the relationship between access to broadband and racialized geographies partitioned by historical de jure redlining practices.
Data
We estimate broadband access across HOLC-graded neighborhoods using data from two sources: the Federal Communications Commission (FCC) and the American Community Survey (ACS). 3 Whereas the FCC measures potential access based on reports of service offerings from ISPs, ACS uses real counts of persons in households who have both a computer and in-home broadband access. Each of these measures can be linked to TIGER/Line shapefiles from the United States Census Bureau and then spatially joined with shapefiles of HOLC-graded neighborhood maps provided by the Mapping Inequality project (Nelson et al., 2020). We discuss both broadband access data sources and shapefiles in more detail below.
Federal Communications Commission
The FCC asks whether an ISP offers service within a census block group. ISP-reported data on broadband availability by technology type is collected using the FCC Form 477 and released to the public twice a year (Federal Communications Commission, 2020). ISPs also provide information about which internet technologies they offer and various metrics of those technologies such as maximum advertised upload and download speeds.
We use data on the 10 six-month periods from December 2014 to June 2019 in our analyses. We investigate access to the three most common fixed broadband technologies in this period: copper wire-based cable modem (DOCSIS 3.0 and DOCSIS 3.1), telephone line-based digital subscriber line (Asymmetric DSL, ADSL2/ADSL2+, and VDSL), and optical wire-based fiber to the home. We aggregate block data to the block group level so that we can merge it with TIGER/Line shapefiles. We consider a block group served by one of these technologies if an ISP offering that technology is listed in the FCC Form 477 data for that block group. Service in a block group, however, does not guarantee service to all households in the entire block group. The FCC Form 477 requires that ISPs need only serve one household to count as providing service in the geographic area. Other metrics of broadband access such as download speed could also be useful, but we do not include them in our analyses since Form 477 data only include maximum advertised speeds, which do not reflect actual speeds experienced by households nor show a great deal of variation within technology type. Due to these limitations of FCC data, we also consider another measure of broadband access in our analyses.
American Community Survey
Our second measure of broadband access comes from the ACS 2015–2019 5-year summary files (U.S. Census Bureau, 2019). Whereas FCC-derived broadband access measures represent service availability, ACS offers the number of persons reporting various computing and broadband technologies in their homes. For our study, we investigate the number of persons with in-home access to broadband, both overall and disaggregated by racial/ethnic group and income levels. We rely on the 5-year summary files rather than single year files because they provide household information at the census tract level, the lowest geographic level available for these data.
TIGER/Line Shapefiles
Data elements in both FCC and ACS files are given a unique identifier that can be associated with specific geographic areas. We link data elements from each data source to US Census Bureau TIGER/Line shapefiles (United States Census Bureau, 2021), which provide boundaries for geospatial areas from the national level down to the census block level. We associate FCC and ACS broadband access measures to TIGER/Line shapefiles at the block group and tract levels, respectively, using the 2019 boundary files.
Mapping Inequality Project
HOLC neighborhood boundary shapefiles come from the Mapping Inequality project (Nelson et al., 2020), a collaborative effort of researchers across four universities that created georeferenced digital scans of HOLC-era residential security zoning maps. Each observation in the publicly available shapefile data represents one HOLC neighborhood and includes, in addition to its spatial boundaries, its HOLC designation (e.g., A, B, C, or D) and HOLC’s descriptions of the area. Overall, 8,868 neighborhoods in 196 metropolitan areas across 38 states are represented in the data (see Figure 1). While represented communities are spread throughout the contiguous United States, most are located in the South, Great Lakes Midwest, and New England.
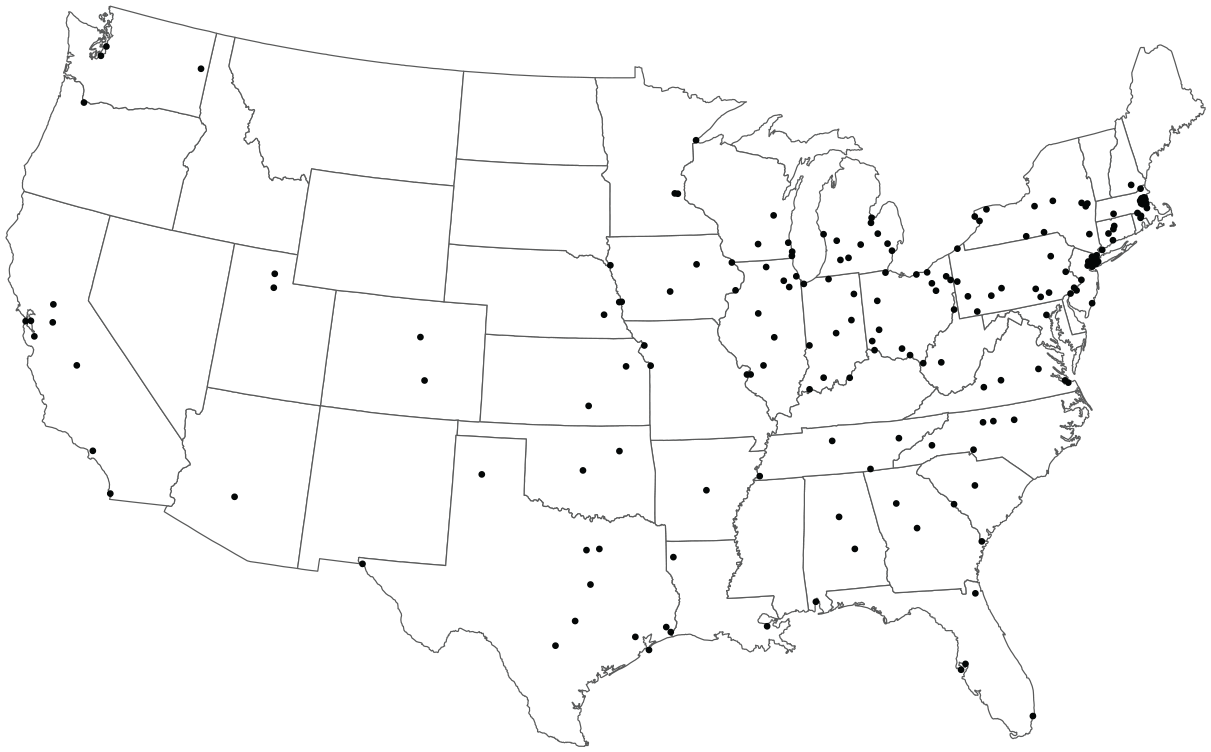
Location of residential security maps in the sample.
Methodology
Assigning Broadband Measures to HOLC Neighborhoods
The first step in our analysis requires assigning both measures of broadband access—ISP-reported service availability and ACS household responses—to each HOLC neighborhood. Because modern census boundaries do not perfectly align with HOLC neighborhoods, we approximate current access by (1) spatially joining census shapefiles to HOLC shapefiles, (2) computing weights based on proportions of overlapping areas, and (3) assigning broadband measures to HOLC neighborhoods using these weights to adjust within-neighborhood averages. Though the relative procedures to assign FCC and ACS broadband measures are similar, we describe the process for creating each analysis data set in turn below.
Assigning FCC Broadband Measures
After linking FCC broadband measures to their corresponding block group boundaries, we perform a spatial join between the block group and HOLC shapefiles, each of which have been projected using an area-preserving projection so that we are able to accurately measure the area of each HOLC neighborhood covered by each census block group. From these area overlaps, we compute weights,
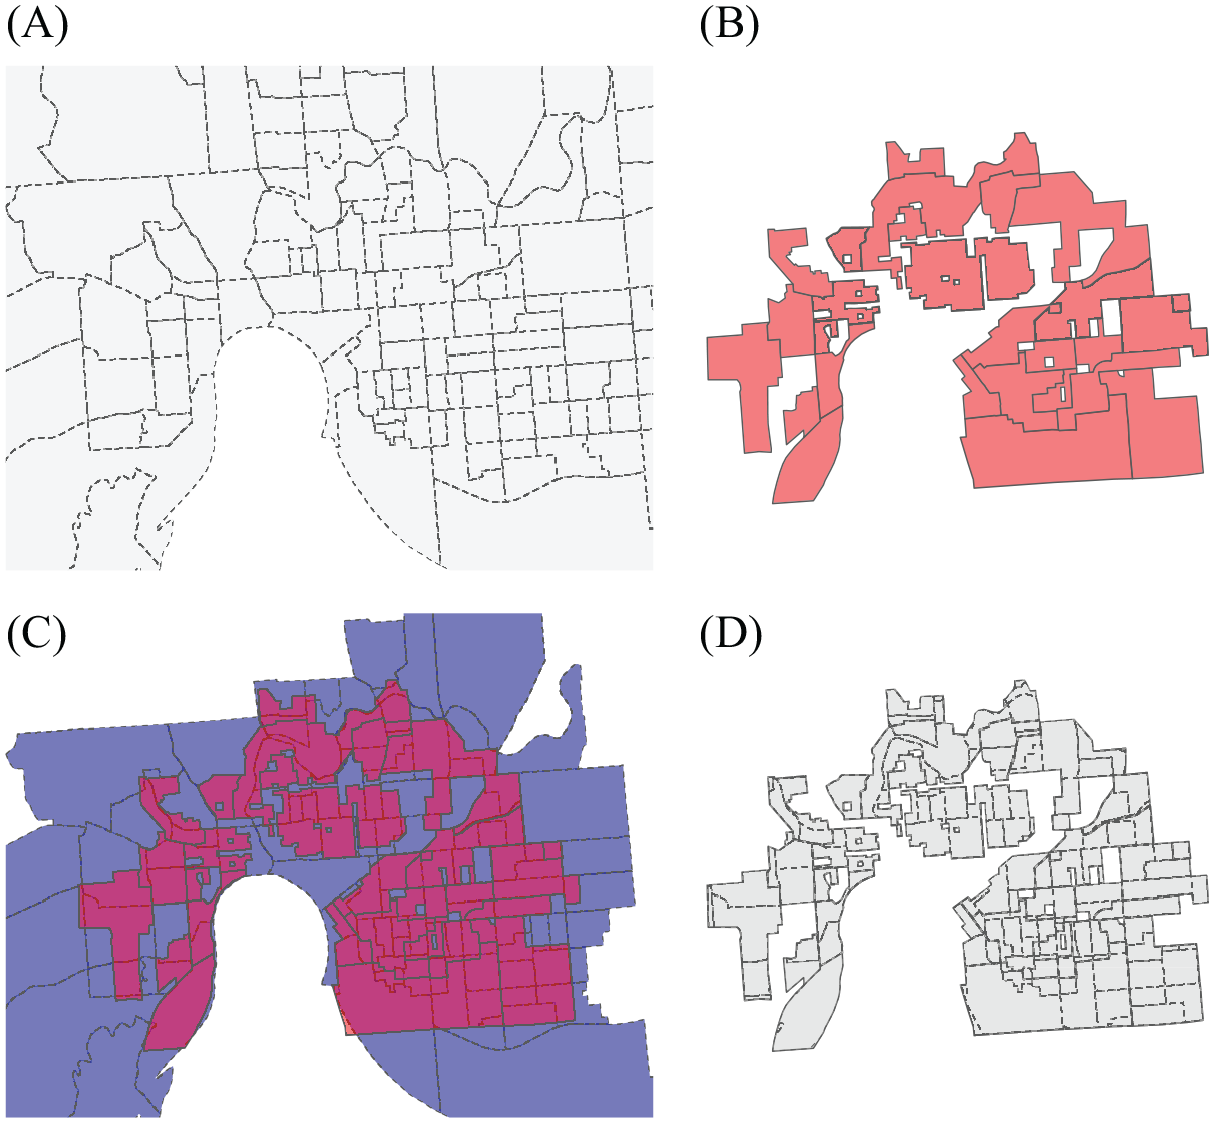
Overlapping census block groups (CBGs) and HOLC neighborhoods for Evansville, Indiana as an example of how we assign broadband access measures to HOLC neighborhood grades. Because CBGs (A) and HOLC neighborhood boundaries (B) do not perfectly align (C), we perform an intersecting spatial join (D) and use overlapping areas as weights to compute HOLC neighborhood FCC-derived broadband access averages. When using ACS-derived measures, we perform a similar procedure using census tracts.
Assigning ACS Broadband Measures
To assign ACS measures of broadband access, which represent counts of persons in households with access to a computer and broadband in the home, we again perform spatial joins between census and HOLC shapefiles. While the process is broadly similar, there are a few differences from the procedure we used to assign FCC measures. First, ACS measures are aggregated one step higher at the census tract level which means that we use census tract shapefiles. Second, we compute the proportion of each tract overlapped by a HOLC neighborhood (the opposite from before when we computed the proportion of HOLC neighborhood overlapped by the census area). We use this fraction as weight to assign numbers of persons to each HOLC neighborhood. In addition to overall household counts, we perform this procedure for each racial/ethnic and income group for which ACS summary files provide data.
Inferential Models and Estimation
We estimate broadband access by HOLC neighborhood grade across our sample by fitting a series of Bayesian multilevel regression models that allow us to account for the nesting of HOLC neighborhoods in cities, states, and regions of the country (Gelman et al., 2014). We fit two sets of models for the FCC and ACS measures, respectively.
The first set of models using FCC data assume that the average proportion,

in which the shape parameters

where
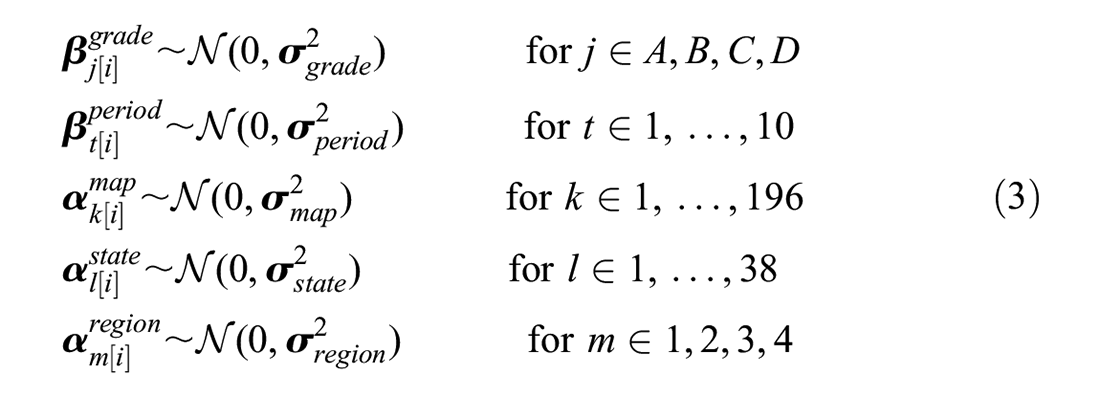
with each
For the second set of models using ACS measures, we model the number of persons with in-home broadband access using a binomial distribution,

where

The parameters in this model are given the same priors as the Beta model. Because the ACS data jointly cover the period from 2014 to 2018, there is not a parameter for time in these models.
We fit 21 models using the cmdstanr R package interface to the Stan language (Gabry & Češnovar, 2021; R Core Team, 2021; Stan Development Team, 2021). Six models estimate ISP-reported service by technology: asymmetric DSL, asymmetric DSL 2/2+, very high bit rate DSL (VDSL), cable modem DOCSIS 3.0, cable modem DOCSIS 3.1, and optical/fiber to the home. The remaining 15 models estimate the proportions of persons in households with in-home access to broadband overall, by eight categories of race/ethnicity defined by the ACS: American Indian/Alaska Native (AI/AN), Asian, Black, Hispanic, multiple races, Native Hawaiian/Pacific Islander (NH/PI), other race, and non-Hispanic White; and six intervals of yearly household income: <$10 k, [$10 k, $20 k), [$20 k, $35 k), [$35 k, $50 k), [$50 k, $75 k), and $75 k +. To speed computation, we aggregate all measures to HOLC grade within each map—for FCC measures, this means averaging coverage; for ACS measures, summing counts. In the next section we report results for
Results
FCC Measures of Broadband Access
Results from the first set of models using ISP-derived measures of broadband access by technology type are presented in Figure 3. Each facet shows changes in the predicted percentage of the population with access to a specific broadband technology from December 2014 to June 2019. Predicted percentages were computed for each HOLC neighborhood grade in each period from the joint posterior distribution of regression parameters, holding the random parameters for each city, state, and region at their respective means. The dark central lines represent the posterior median percentage for each HOLC neighborhood grade and the shaded areas the 95% credible intervals (2.5% and 97.5% percentiles).
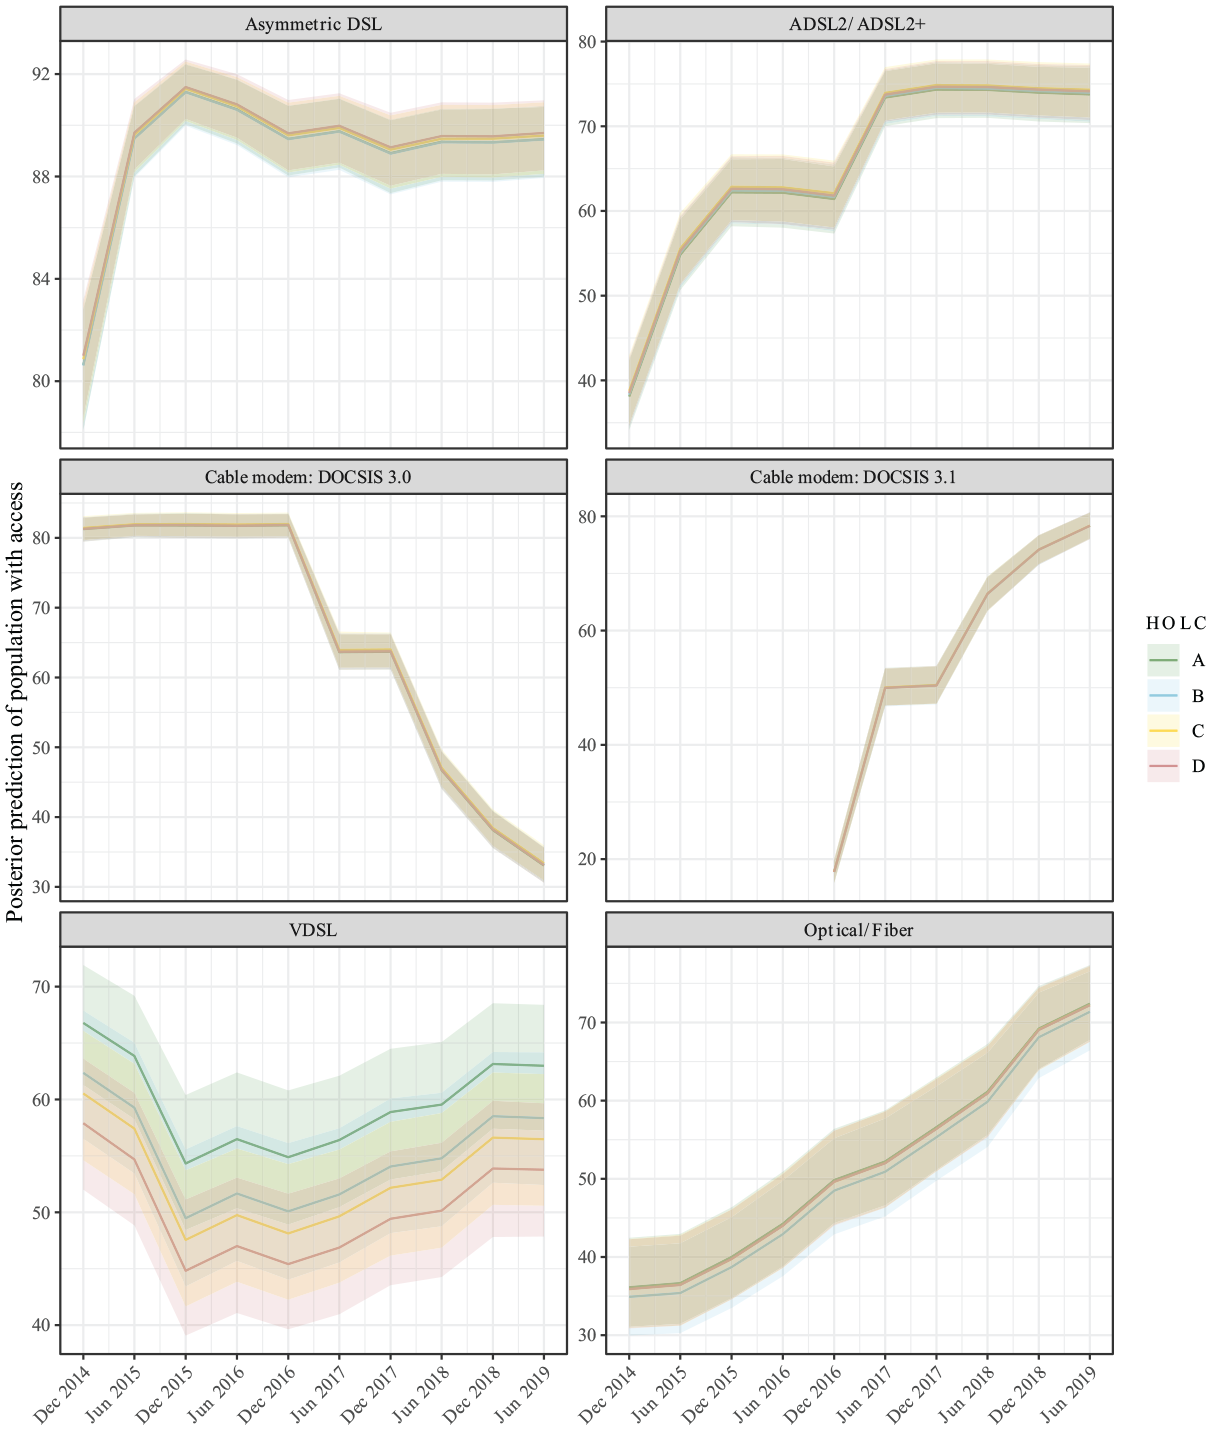
Estimated changes in HOLC neighborhood broadband access by technology from December 2014 to June 2019 as defined by ISP service availability. Center lines represent the median posterior values with 95% credible intervals shown in the shaded area.
Two patterns emerge across the facets of Figure 3. First, ISP-reported service offers of most broadband technology types increased during the 4.5 years of the sample. Increases range from less than 10 percentage points (p.p.) for asymmetric DSL to 35 p.p. for ADSL2/ADSL2+ and optical/fiber to the home. The middle facets show the replacement of older DOCSIS 3.0 cable modem technology with DOCSIS 3.1 technology, which was not widely available until 2016 but quickly rose to be offered to nearly 80% of the sample population. Even so, over 30% of areas in the sample continued to have access to DOCSIS 3.0 as of June 2019. VDSL access dropped from December 2014 to December 2015, but mostly recovered by the end of the period.
The second pattern that emerges is that there is very little difference in ISP-reported service by technology type across HOLC neighborhood grades during this window. For five technologies, the posterior distributions for each HOLC neighborhood grade almost entirely overlaps the others. Though having the greatest difference across neighborhoods, VDSL, which comparatively fewer ISPs offered during the time period, still shows significant overlap between adjacent neighborhood grades. Overall, results using FCC Form 477 data suggest that potential broadband access as measured by ISP-reported service shows little difference by HOLC neighborhood classification across a range of technology types.
ACS Measures of Broadband Access
Contrary to ISP-reported service offers, however, we find that reports of in-home broadband access from the ACS differ across HOLC neighborhood grades. Among the individuals in our analyses, 12.9% lived in “A” graded neighborhoods, 28.2% in “B,” 37.7% in “C,” and 21.1% in “D.”Figure 4 shows the posterior distributions of the overall percentage of persons with in-home computer and broadband access by HOLC neighborhood grade. The median value of in-home access rises from 87.47% [95% CI: 86.71, 88.18] of those living in the “D” grade neighborhoods, to 88.69% [87.99, 89.34], 91.04% [90.47, 91.57], and 93.20% [92.75, 93.61] in “C,”“B,” and “A” graded neighborhoods, respectively. On average, moving to the next higher HOLC neighborhood grade represents a 1.2 to 2.3 p.p. increase in the probability of in-home broadband access. Moving from a “D” to an “A” graded neighborhood shows a 5.7 p.p. increase.
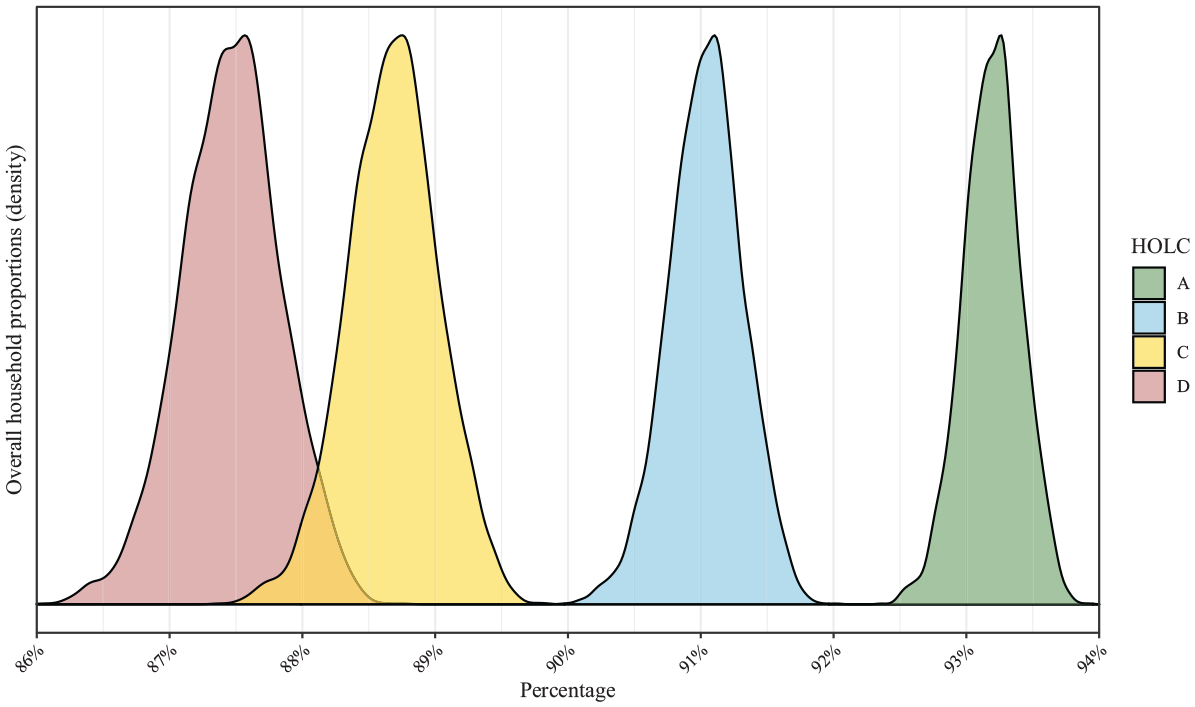
Estimated percentages of persons with access to a computer and broadband in their household by HOLC classification, 2015 to 2019.
Next, we examine differences in in-home access among subpopulations. We again start with a discussion of how persons in our analytic sample are distributed across HOLC neighborhood grades. The top facet of Figure 5 shows the percentage of persons within each racial/ethnic group who live in each HOLC neighborhood grade. For context, the number in parentheses under each label shows the percentage of the full analytic sample represented by persons in the group. Non-Hispanic White persons are the largest group in our sample, comprising 50.15%. Black and Hispanic persons represent the next largest groups, 17.41% and 16.73% of the sample, respectively. Asian persons (6.07%) and those whom the census categorizes as “other” race (5.40%) or multiple races (3.74%) comprise most of the rest of the analytic sample. We include in our analyses persons who identify as AI/AN (0.41%) and NH/PI (0.10%), but note that persons in these groups combined represent less than 1% of our sample.
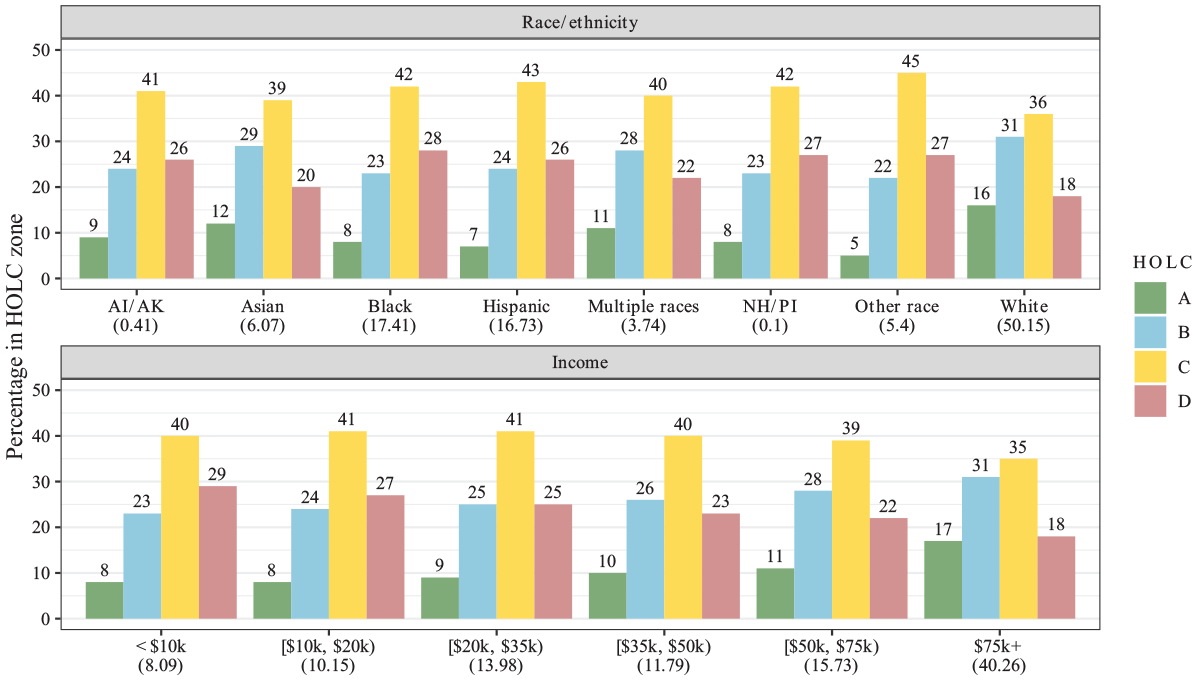
Distribution of persons from ACS data across HOLC neighborhoods by group. Each bar represents the within-group percentage of persons who live within a HOLC neighborhood grade classification; the numbers in parentheses are the relative percentage of each group out of the total sample. AI/AK: American Indian / Alaska Native; NH/PI: Native Hawaiian / Pacific Islander.
Across all racial/ethnic groups in our sample, most persons (36–45%) live within neighborhoods that HOLC graded as “C,” while the fewest (5%–16%) live in “A” neighborhoods. These broad similarities notwithstanding, we find variation across racial/ethnic groups in their respective distributions across HOLC neighborhoods. While approximately 47% of non-Hispanic White persons live in “A” or “B” HOLC neighborhoods, only 27–31% of persons who identify as Black, Hispanic, NH/PI, or as another race live in these top graded neighborhoods. On the other side of the HOLC scale, 18% of non-Hispanic White persons live in “D” neighborhoods compared to 20%–28% of all other racial/ethnic groups.
The second facet of Figure 5 shows broadly similar living patterns by household income levels. Across all income levels, most persons live in “C” neighborhoods (35–41%) while the fewest live in “A” neighborhoods (8%–17%). As household income level increases, however, persons are more likely to live in “A” or “B” neighborhoods (from 31% to 48%) and less likely to live in those designated with a “D” grade (from 29% down to 18%). Persons in households making $75,000 or more a year (40.26%) comprise the largest income group in our sample whereas those making less than $10,000 a year are the smallest (8.09%). The remaining four income groups each comprise between 10% and 16% of our sample. Though limitations of the ACS summary data files prevent our ability to compute the cross-tabulations of race/ethnicity and income, we can say that our sample is mostly comprised of non-Hispanic White persons with significant numbers of Black and Hispanic persons and that among all those in our sample, approximately 10% live in households with yearly incomes below $10,000, 50% between $10,000 and $75,000 a year, and 40% above $75,000.
Results from our second set of models that use ACS data to estimate in-home computer and broadband access across HOLC neighborhood grades by race/ethnicity are shown in Figure 6. Each line offers the full posterior distribution for the subgroup, with the center dot representing the median posterior value and the thick and thin horizontal lines showing the 50% and 95% posterior credible intervals, respectively. Green, blue, yellow, and red lines represent separate percentages of access for each HOLC neighborhood grade. While over 80% of all people have a broadband connection in their home, we find variation in access both across race/ethnicity and HOLC neighborhood grades. 6 For all but the smallest groups (AI/AN and NH/PI), access increases as HOLC neighborhood grade improves. These increases are similar to those seen in the overall models, with differences in median values typically ranging from 1 to 2 p.p. at each step or about 4 to 5 p.p. moving from “D” grade neighborhoods to “A” grade neighborhoods. As exceptions to the pattern, AI/AN show about the same degree of access in both “A” and “B” neighborhoods (94%), with decreasing access moving into “C” and “D” neighborhoods. NH/PI also break the pattern in that those who live in “B” neighborhoods have lower access (98%) than those who live in “C” neighborhoods (99%). The sample sizes for these latter groups, however, are sufficiently small that their estimates should be interpreted with caution, a point which we will return to later in the discussion of our results.
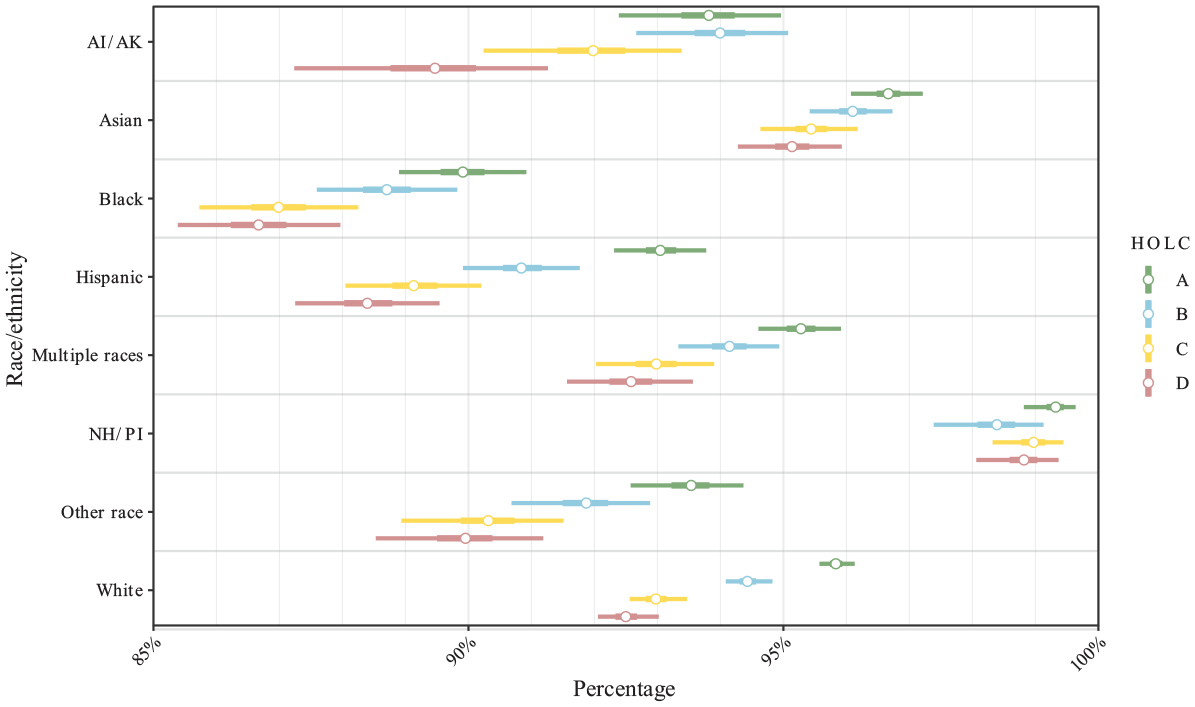
Estimated percentages of persons with access to a computer and broadband in their household by race/ethnicity and HOLC classification, 2015 to 2019. Center points represent the median posterior value; thick and thin lines show the 50% and 95% credible interval posterior values, respectively. AI/AK: American Indian / Alaskan Native; NH/PI: Native Hawaiian / Pacific Islander.
In addition to differences within racial/ethnic subgroups, we find further heterogeneity in access between subpopulations. Asian persons have both the highest broadband access overall, with median values that range from approximately 95% to 97%, as well as the least difference between persons living in neighborhoods with different HOLC grades. At somewhat lower values, non-Hispanic White persons (92%–96%) and those who identify with multiple races (93%–95%) have roughly similar access. Those identified as “other” race (90%–94%), Hispanic persons (88%–93%), and Black persons (87%–90%) have the lowest estimated likelihood of access across neighborhoods. Across all racial/ethnic groups, NH/PI persons have the greatest access, hovering around 99%. These high rates may be due in part to the fact that, in addition to their small numbers in the data set, persons in our sample identifying as NH/PI are found mostly in large, West Coast cities which tend to have better broadband access than other Midwestern and Southern communities in the sample.
Finally, we find evidence of differential broadband access when comparing racial/ethnic groups within the same HOLC neighborhood. Focusing on the largest three racial/ethnic groups in our sample—non-Hispanic White, Black, and Hispanic—Figure 6 shows that of persons living in “A” graded neighborhoods, approximately 96% of non-Hispanic White persons living in “A” graded neighborhoods have in-home computer and broadband access, whereas only 93% of Hispanic persons and 90% of Black persons do. At the other end of HOLC grading scale, 93% of non-Hispanic White persons living in “D” neighborhoods have access while only 88% of Hispanic and 87% of Black persons do. Taking into account the full posterior distributions, while approximately 90% of Hispanic persons living in “A” neighborhoods are estimated to have equal or better in-home broadband access than non-Hispanic White persons living in “D” neighborhoods, we estimate that nearly all Black persons living in “A” neighborhoods are less likely to have in-home broadband access than non-Hispanic White persons living in the “D” neighborhoods. Our results in Figure 6 show similar patterns in comparisons across other groups.
Figure 7 presents estimates for in-home broadband access disaggregated by income level. We find that these differences are more consistent in pattern within income band—access generally increases in tandem with HOLC grade—and more extreme between bands. Within each income band, we estimate greater access for persons in neighborhoods with a more favorable HOLC grade, though average differences between grades decrease as incomes increase. Households making less than $20,000 a year (representing two income bands) have access ranging from just over 50% in “D” neighborhood grades to 64–67% in “A” neighborhoods while within the top income band—those making over $75,000 per year—the range between “A” and “D” grades is less than 4 p.p. and overall access is much higher at 92 to 95%. Compared to differences between racial/ethnic subpopulations, we find greater separation between income levels. Except for the overlapping distributions between the bottom two income groups, those living in “D” neighborhoods are more likely to have broadband access than those in the income band just below who live in “A” neighborhoods. Above the $20,000 mark, moving from an “A” neighborhood in one income band to a “D” neighborhood in the next income band is associated with a 3 to 5 p.p. increase in the likelihood of in-home broadband access.
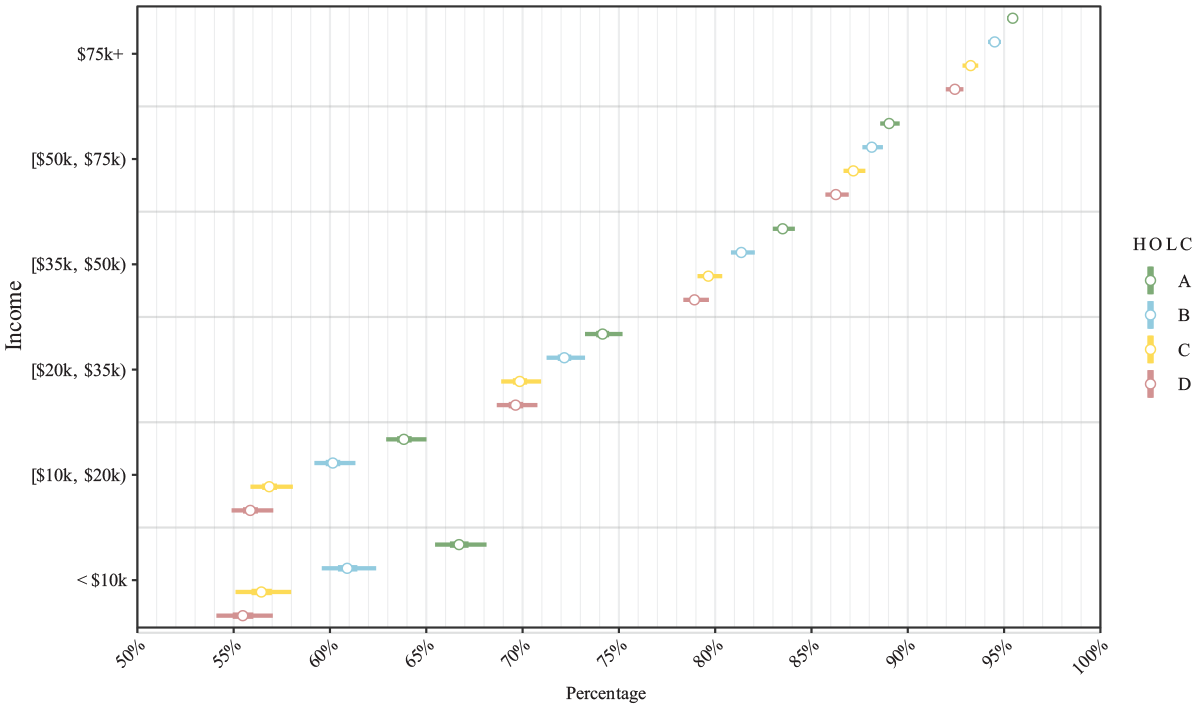
Estimated percentages of persons with access to broadband in their household by income and HOLC classification, 2015 to 2019. Center points represent the median posterior value; thick and thin lines show the 50% and 95% credible interval posterior values, respectively. AI/AK: American Indian / Alaskan Native; NH/PI: Native Hawaiian/Pacific Islander.
Discussion
Using FCC and ACS data, our results offer accounts of differing broadband access in urban and suburban communities formerly divided on HOLC maps into neighborhoods of varying lending risk. Fitting models using FCC data we find almost no difference in ISP-reported service availability across HOLC neighborhood grades and a number of common broadband technologies over time. Conversely, our estimates using ACS data show disparities in in-home broadband access across HOLC neighborhood grades. Furthermore, we find heterogeneity in access between racial/ethnic groups and various household income levels, both within and across HOLC neighborhood grades. We conclude that despite equitable potential access to broadband among former HOLC-defined neighborhoods in terms of ISP service, real access to broadband differs at the intersection of neighborhood with community characteristics like race/ethnicity and income. While some racial/ethnic groups and those with higher household incomes have greater broadband access overall, we find that otherwise demographically similar persons with the same ISP options may nevertheless have different likelihoods of in-home broadband access due to neighborhood characteristics included in federal New Deal-era mortgage risk calculation policies.
One limitation of our study is that we cannot provide estimates for intersections of race/ethnicity and income within HOLC neighborhood grade. Though our analytic framework would support it, we are limited by the structure of ACS data in which there is a trade-off between geographic specificity and the level of detail available about individuals in the data. Because we must use spatial joins to place modern census estimates within historical HOLC neighborhood boundaries, we use the smallest available geographic areas to reduce potential error. At the census tract level, however, estimates of in-home broadband access are provided only along univariate (e.g., race/ethnicity) dimensions. We are also limited by the broad and aggregated racial/ethnic categories provided by ACS. Though such aggregations may be tied to concerns of confidentiality, categories provided by the ACS are sufficiently imprecise as to cover likely heterogeneity across and within the racial/ethnic groups that are included.
A second limitation of our methodology lies in how we assign households to HOLC neighborhoods. We assume an equal distribution of persons in the neighborhood. When a HOLC-defined neighborhood intersects with, for example, 50% of a census tract, we assume 50% of persons in the tract live within HOLC neighborhood boundaries. We make this assumption for overall counts, each racial/ethnic group, and all income level. As an extension, we also assume that in-home broadband access is similarly equally distributed within census tracts, meaning that if half of persons within a census tract have broadband in their home, we assume that half the portion assigned to a HOLC neighborhood has access. This is an assumption that we cannot test with the data we have. However, if persons with broadband access are missorted, we expect that our sorting procedure has assumed higher rates of access in lower grade HOLC neighborhoods and lower rates in higher grade HOLC neighborhoods, producing more conservative (smaller) estimates of differences in in-home broadband access between HOLC neighborhoods.
Finally, data in our study cover the period immediately before, but not including the COVID-19 pandemic. The initial phase of the global pandemic represented an abrupt break in how students participated in school, temporarily shifting learning fully online for many and leaving some districts to provide ad-hoc solutions to problems of poor internet connectivity among students in their districts (Levin, 2020). Based on the histories of oppression we relate in this paper and prior research on already-existing disparities in broadband access based on race and income (Anderson & Perrin, 2018; Ong, 2020), we expect that the COVID-19 pandemic only exacerbated the place-based inequities we find in the years immediately preceding it. As broadband access data for the COVID-19 era and beyond become available, future research can use our same approach to examine whether our supposition is correct.
Prior research has shown that access to broadband (and telecommunications infrastructure more generally) differ by location (Copps, 2009; Grubesic, 2006; West & Karsten, 2016), by race/ethnicity, and income level (Irving et al., 1999). We add to this literature by providing evidence that more strongly connects differences in access to earlier public policies that officially ended long before the advent of broadband technologies. More specifically, our paper fits within a larger body of literature that demonstrates the residual negative effects that segregation have had on a wide range of social and health outcomes (Aaronson et al., 2020; Beck et al., 2020; Dylan & Cleveland, 2021; Mitchell & Franco, 2016; A. L. Nardone et al., 2020; Zhang & Debarchana, 2016).
As education scholars, we are particularly concerned with how differences in broadband access may affect students’ geographies of opportunity (de Souza Briggs, 2005; Green et al., 2017; Tate, 2008). Discussions of the digital divide are often presented within an urban versus rural dichotomy (Copps, 2009; LaRose et al., 2007; Pereira, 2016; West & Karsten, 2016). While this disparity rightly deserves the attention of policymakers, our results demonstrate the need to consider digital divides within proximate urban and suburban neighborhoods. In his review of the literature on gentrification and academic achievement, Pearman (2019) notes that while there is evidence that “gentrifying families are better equipped to place pressure on neighborhood institutions to improve their services” (p. 145), the benefits of these improvements are not always felt equally among all students in the area. In line with our QuantCrit approach, which asks us to explore heterogeneity within simple averages that might otherwise obscure inequities, we triangulate ISP-reported broadband access from the FCC with more direct household-reported access from the ACS. In doing so, we discover differences in access between racial/ethnic groups and different income levels within the same HOLC neighborhood grades. Our findings suggest that greater ISP provision of broadband technologies within historically redlined neighborhoods is an example of a gentrification-based service improvement that does not reach all equally. This places our results in line with other evidence that market-based approaches used by ISPs are unlikely to provide equitable broadband access even within geographically proximate areas (Alliance, 2017). Administrators and policymakers, therefore, must not conflate broadband infrastructure with broadband access: students living a block away from their school or university may be as disconnected from broadband as their more distant rural peers, thus experiencing an equally under-resourced geography of opportunity.
We are also interested in the connection between broadband access and prior public policy because it suggests who might bear responsibility for ameliorating current inequities. Rothstein (2017) argues that because the federal government had a direct hand in housing segregation, residential segregation effectively moved from a de facto to de jure condition. As a result, the federal government bears responsibility for providing remedies for the negative outcomes associated with residential segregation. In terms of making broadband access more equitable for students of all ages, one remedy might be a more robust, place-based, version of the FCC’s Affordable Connectivity Program, which replaced the temporary COVID-19 Emergency Broadband Benefit provides monthly need-based subsidies for broadband service. 7 Whatever the particular policy, however, our study provides evidence that disparities in broadband access are not merely the result of private consumer preferences, but can be linked to the persistent effects of a history of unconstitutional and racially-biased public policies.
We close our discussion by arguing that social scientists also bear a share of the responsibility for correcting social harms wrought by segregationist housing policies. Both Babcock and Hoyt were scholars whose work gave an academic imprimatur to the racist and classist housing policies codified in the modernization of real estate practice in the first half of the 20th century. We (the authors) argue that modern scholars focused on educational equity and justice must acknowledge this historical and intellectual connection. Ameliorating inequitable geographies of opportunity among students requires that we (social scientists) first understand our historical role in helping shape those very inequities, which are not the result of natural processes but rather are imbued with the racism of prior researchers (Castillo & Gillborn, 2022; de Souza Briggs, 2005; Gillborn et al., 2018). The next step requires examining how current dominant paradigms that organize our field may be causing new harms and aggravating instead of mitigating race-, class-, and gender-based oppressions. To be clear, many critical scholars have and continue to engage in this self-reflective work, particularly around access to and the use of technology in education and knowledge production (e.g., Benjamin, 2019; Emejulu & McGregor, 2019; Noble, 2018; Selwyn, 2010; Selwyn et al., 2020). More, however, remains to be done in the wider field to fully support a justice-based educational research agenda.
Conclusion
When schools quickly shifted to remote learning in 2020, districts and higher education institutions across the country saw a clearer picture of the number of students—even those living in urban and suburban neighborhoods—lacking sufficient access to broadband. In this paper we provide evidence that links these infrastructural disparities with New Deal-era housing policies that purposefully segregated communities throughout the country. Despite seeming parity in ISP-reported provision of broadband, we find much heterogeneity in in-home broadband access, overall, by race/ethnicity and income level, and within and across different federally-defined neighborhood grades. While access to the internet through a quality broadband connection is increasingly important for accessing many public services (Dharma et al., 2010), its importance for education specifically cannot be understated. Future research with less aggregated data should further explore the intersections of place, race, and income—geographies of opportunity—as they relate to broadband access in order to craft more targeted policies to support educational success. In the meantime, such policies should expand to focus not only on rural/urban digital divides but also those within urban and suburban neighborhoods unfairly marked by prior federal policies.
Footnotes
Acknowledgements
We thank Dominique Baker, Richard Blissett, Ozan Jaquette, Justin Ortagus, Olivia Morales, Karina Salazar, and participants at the 2021 AEFP conference for helpful comments on early drafts of this paper. All errors, mistakes in interpretation, and conclusions remain our own. Replication files for this paper may be found at ![]() .
.
Declaration of Conflicting Interests
The author(s) declared no potential conflicts of interest with respect to the research, authorship, and/or publication of this article.
Funding
The author(s) received no financial support for the research, authorship, and/or publication of this article.