
Abstract
Standards-based reform has grown in the field of education. Efforts to do so in mathematics and reading through the Common Core State Standards, while initially adopted widely, ultimately proved controversial. In contrast, the Next Generation Science Standards (NGSS) have been less polarizing. Using an event history analysis, we examined the state political, economic, and social factors that predicted adoption of the NGSS as well as how factors differentially related to full-scale adoption or adoption of standards based on the NGSS. Results show, while few factors predicted adoption broadly, the presence of a larger proportion of Republicans in the legislature predicted a higher likelihood of adopting standards based on the NGSS than fully adopting them.
Introduction
Over the past several decades, standards-based reform has been a central component of federal and state education policymaking (Hamilton et al., 2008; McLaughlin & Shepard, 1995; Polikoff, 2021). Motivated in part by concerns around international competitiveness articulated in A Nation at Risk (1983), standards-based reform found support from governors, presidents, and professional organizations (Hamilton et al., 2008; McLaughlin & Shepard, 1995). Implementation of standards grew through the 1990s as states adopted their own standards (Hurst et al., 2003) and again garnered national attention in the late 2000s and early 2010s as states began to adopt common sets of standards including the Common Core State Standards in mathematics and reading and the Next Generation Science Standards in science.
The adoption of educational standards, however, has not been without controversy. Among these has been whether standards should be the same across states (i.e., a national set of standards) or whether standards should be state specific (Polikoff, 2014; Porter, 1994). While prior research documented variation across states in standards in the 1990s and 2000s and pointed to the academic success of countries with national standards (Porter et al., 2009; Schmidt et al., 2001, 2005), core tenets of local control and minimal federal involvement that are historically central to the American education system made a move toward a common set of standards politically contentious (Fusarelli & Fusarelli, 2014; Tyack, 1974). Perhaps nowhere was this tension clearer than in the example of the Common Core standards which were adopted by many states in 2010 to only then experience significant political controversy and de-adoption by some states in the years that followed (Jochim & Lavery, 2015; LaVenia et al., 2015; Supovitz & Reinkordt, 2017).
Interestingly, however, the political backlash targeted at the Common Core standards has been largely absent in discussions of another set of common state standards, specifically the Next Generation Science Standards. Adopted in the years in which political attention to Common Core was peaking, the NGSS were developed by state representatives in a process facilitated by Achieve which built on a report from the National Research Council and involved other organizations including the National Science Teachers Association and the American Association for the Advancement of Science. The NGSS standards are meant to enhance science learning for all K-12 students in the United States (Next Generation Science Standards [NGSS], n.d.a.). The NGSS set the expectations for what K-12 students should understand at each grade level and are organized around a three-dimensional approach which includes crosscutting concepts, practices, and disciplinary core ideas. Unlike the Common Core standards, their adoption has been less politically contentious.
To date, most states have either adopted NGSS or have adopted their own science standards based on NGSS. Specifically, 20 states and the District of Columbia have fully adopted NGSS while 24 other states have adopted standards based on the Next Generation Science Standards. Only six states have done neither (National Science Teaching Association, n.d.). Notably, no state in our record has both adopted and later unadopted NGSS standards, which suggests a clear pattern in states’ commitment to their chosen science standards. While prior research has examined the adoption of the Common Core State Standards and subsequent political discourse around them (LaVenia et al., 2015; Supovitz & Reinkordt, 2017), little work has systematically examined the factors contributing to the policy adoption of the Next Generation Science Standards.
Given the successful adoption and continued implementation of the NGSS during a period of intense criticism of the Common Core State Standards, understanding the factors related to policy adoption of NGSS is of particular interest. Furthermore, since a handful of states have not explicitly adopted or based standards on them, questions remain about why such holdout states have not adopted the NGSS standards. The purpose of this study then is to examine the factors that predicted state adoption of the NGSS. Specifically, we ask the following research question: What state-level characteristics—such as political, economic, STEM workforce, and proximity to neighboring states who adopt—predict the adoption of the Next Generation Science Standards?
We approach this question through a policy innovation and diffusion framework using an event history analysis approach. Our results provide some of the first empirical evidence on the adoption of the Next Generation Science Standards and may provide insights into the factors differing NGSS from other more contentious common standards.
Theoretical Framework
This study draws on policy innovation and diffusion theory (Berry & Berry, 1990) to identify the factors that predicted adoption of the Next Generation Science Standards. Originating in the political and policy science fields, policy innovation and diffusion theory seeks to explain the factors that lead to policy adoption, focusing on both characteristics of the adopting entities (internal determinants) and the policy influences of geographically proximal entities (diffusion). This theory has been applied extensively over the past decades in multiple disciplines such as education policy, public policy, public health policy, and transportation policy. For example, Doyle (2006) examined adoption of merit aid programs in higher education, and Hoffmann and Cerbone (2002) examined predictors of drug abuse.
Innovation and diffusion theory contends that both internal and external determinants matter when explaining policy adoption (Cohen-Vogel & McLendon, 2009; Doyle, 2006; McLendon et al., 2006). As suggested by its name, internal factors may include but are not limited to the political, economic, or social characteristics within a given governmental entity, often a state. Some examples of these internal factors include the political party composition of a state legislature, the number of unemployed people in a state, and demographic information. In contrast, diffusion refers to the influence of other regions when examining why a region adopted a policy. This theory states that regions learn from one another but that they also compete with one another. For example, a state may want to create its own lottery program so it does not lose out on the money its residents are spending on lottery tickets in neighboring states (Berry & Berry, 1990).
There has been no research on how NGSS adoption may have been affected by policy innovation and diffusion; however, other studies with similar research questions and methods have relied on this theoretical framework. LaVenia et al. (2015) relied on this framework when conducting an event history analysis on the Common Core State Standards (CCSS) initiative and found that CCSS adoption was influenced by prior adoptions of standards-based reform policies and membership in national policy networks. Cohen-Vogel et al. (2022) used policy innovation and diffusion as their theoretical framework when conducting an event history analysis on the adoption of public pre-kindergarten among American states and found that party dominance in the legislature, legislative professionalism, unemployment rates, and regional proximity to previously adopting states were associated with pre-K adoption. We similarly leverage policy innovation and diffusion to frame our study and analysis.
Literature Review
The Next Generation Science Standards (NGSS)
As previously stated, The Next Generation Science Standards (NGSS) are science subject benchmarks adopted by many states as standards (NGSS Lead States, 2013). The NGSS were developed by the National Research Council (NRC), National Science Teachers Associations (NSTA), the American Association for the Advancement of Science (AAAS) and Achieve through a collaborative process that involved state-level representatives.
The NGSS have their origin in the 2011 release of the Framework for K-12 Science Education, a national report released by the National Research Council. The Framework was developed based on input from a committee of 18 scientific professionals, including field scientists, cognitive scientists, science education scholars, and science education policymakers. They worked alongside four design teams; a physical science team, a life science team, an earth/space science team, and an engineering team, which brought domain specific expertise to the standards. Following public review in 2010, the final Framework document was released in July of 2011 after addressing feedback from the public.
As the foundation for what students should know in science, the Framework served as the guide for developing a set of science standards based on the Framework. A coalition of states, organized by Achieve, gathered expert input from stakeholders and advisory committees and led the development of the NGSS standards. Like the Framework, the NGSS standards went through multiple rounds of public comment and review by various working groups. The updated standards were released in April 2013 with the stated goals of re-framing and re-forming science standards at the national, state, and local levels (Bybee, 2014).
The purpose of the NGSS was not only to reframe the science material being taught across the United States but also to rethink how science is taught (Tuttle et al., 2016). The NGSS stressed an active approach to learning science where students are not just learning and memorizing important information about science topics but are actively inquiring into their own scientific discoveries and examining how different domains of science connect with one another (Pruitt, 2014). NGSS standards and the three-dimensional approach are grounded in prior research that finds students learn science best when engaging in active learning that allows them to engage with the material and respond with their ideas and previous assumptions (Abell & Lederman, 2007; Duschl et al., 2007; Falk & Dierking, 2010) versus sitting in a classroom listening while their teacher relays knowledge.
Context and Adoption of NGSS Standards
The NGSS were developed at a time when science, technology, engineering, and mathematics, and the idea of combining these disciplines into one large umbrella term (STEM) was taking off. In 2000, there were 4.3 million STEM workers in the United States, by 2012 that number had risen to 5.3 million (Camarota & Zeigler, 2014). Other research finds a large increase in STEM occupations (and diversity of STEM workers) throughout the 1990s that was temporarily halted in the early 2000s due to the dot com bust but then quickly regained strength and power in the middle years of the first decade of the new millenium (Hulten, 2018). With a world becoming increasingly STEM-based, the United States became increasingly aware of the importance of a quality science education if they were going to continue to compete on a global scale (Atkinson & Mayo, 2010; Barrett et al., 2021; DiChristina, 2014; Muñoz et al., 2020; Rutherford & Ahlgren, 1991).
Despite the rising importance of STEM education at this time, the adoption of the NGSS was not without potential for controversy. As with prior initiatives in science education, elements of the standards were potentially in conflict with beliefs of some. For example, many had issues with the standards because of the claims they made around evolution and climate change. The NGSS emphasizes the central role evolution plays in biology and life sciences (Plutzer et al., 2020) as well as the connection between human activities and climate change (Walsh & Tsurusaki, 2014).
Despite this potential for controversy, all but six states (Texas, Florida, North Carolina, Virginia, Pennsylvania, and Ohio) either adopted the NGSS directly or adopted standards largely based on the NGSS as of 2019. Pennsylvania has since based their standards on NGSS. NGSS was adopted in a staggered manner with previous literature defining early adopters as the states who adopted NGSS before 2015 and late adopters as states who adopted NGSS after 2015 (Smith, 2020). While political controversy swirled around the Common Core State Standards and some states moved to de-adopt CCSS, the NGSS standards persisted in adoption and continued implementation across states. The purpose of this paper then was to identify determinants predicting where and why NGSS was adopted. As discussed further in the methodology section, our analysis involved an emergent design in which we built on our original research question (focusing on adoption broadly—full adoption or adoption of standards based on NGSS) to emergent research questions that arose in our analysis process (differentiating full adoption from adoption of standards based on NGSS and exploring the continued persistence of implementation of standards beyond initial adoption). We turn next to a brief discussion of the background on the variables included in our analysis.
Internal Determinants
Internal Determinants: Political Conditions
Prior research has found that political conditions within a state often influence policy adoption (Cohen Vogel et al., 2022). Examples of these conditions include the political party of the governor, the political makeup of the legislature within the state, election timing, and legislative professionalism (Cohen Vogel et al., 2020). Legislative professionalism is a term coined by Squire (Squire, 2007) and used widely in the political science and policy literature (Bowen & Greene, 2014) that captures characteristics indicative of legislators being able to approach their service as a profession and having more resources to perform their work. It includes indicators such as longer legislative sessions that meet year-round each year, better paid legislators and legislative staff, and more abundant resources for their legislators and legislative staff to rely on (Squire, 1988a, 1988b, 2006, 2007; Squire & Hamm, 2005). These factors influence whether a legislator can rely solely on their legislative work or needs to supplement their income with another job. These professional attributes also impact the capacity of the legislature to produce, review, and implement policy efficiently, often making them more adept at navigating complex policy adoption processes. Thus, states with higher legislative professionalism may experience faster or more frequent adoption of policies due to the increased resources and time legislators can dedicate to policymaking. We use the term consistent with its definition and widespread use in the literature while making clear that it is not a measure of whether individual legislators act in a professional manner.
Internal Determinants: Economic Conditions
Another set of internal determinants that have been found to impact policy adoption are the economic conditions of the state (Cohen Vogel et al., 2020). Prior literature finds that wealthier states are more likely to adopt new programs than states with lower economic climates especially if these programs are expected to cost the state money (Birkland, 2015; Kousser, 2002; Plotnick & Winters, 1985).
Internal Determinants: STEM Industry in the State
Occupation availability and predominant industries of the state is another internal determinant that has been found to impact policy adoption. States with high levels of STEM industry may be more likely to adopt NGSS due to them wanting the most updated science standards for their future science workers.
Internal Determinants: Common Core Adoption
Existing literature also suggests the potential for prior, related policies to “soften” the policy environment for adoption of future policies. States that previously adopted Common Core and maintained the standards against political backlash, therefore, may be more likely to adopt or persist in the use of the NGSS.
Diffusion Theory
Diffusion Theory: Policies of Regional Neighbors
Finally, prior research on how geography affects policy implementation among states is complex. Some research finds that interstate diffusion is significant and that a state or region is often highly influenced by what the states/regions around are doing (M. D. Allen et al., 2004; Berry & Berry, 1990; Cohen-Vogel & Ingle, 2007; Volden et al., 2008). However, others have found interstate diffusion not to be particularly significant (Doyle, 2006; Hearn et al., 2008). In the diffusion literature, there are several hypothesized mechanisms which include policy learning as well as a competitive component. Policy learning theory states that states and regions rely on others around them to effectively learn how to successfully implement policies aimed at reducing or improving aspects of society. The basis of this theory is that states learn and rely on others around them. The competitive mechanism of policy diffusion states that states/regions will implement policies to compete against their neighbors. In other words, they view the states around them as competition and want to be deemed as better.
Summary
The adoption and persistence of the NGSS represent an interesting and important topic of study. Unique from the CCSS, they have expanded and persisted in times of political pushback against common national standards. We turn next to a discussion of the data and methodology used to explore the predictors of NGSS adoption and implementation.
Data
This study drew on multiple, secondary datasets to create a longitudinal state-level dataset including political, economic, and social indicators of states over time. Data sources included The Book of the States, U.S. Census Bureau’s Annual Survey of State Government Finances, United States Census Bureau’s Historical Income Tables, and the United States Bureau of Labor Statistics. The final analytic dataset included data for 49 states from the years 2010 to 2019. Nebraska was omitted due to it having non-partisan legislative elections and thus no data on political party composition of the legislature. Alabama lacked legislative professionalism scores in years 2011 and 2012 because of missing legislature salary and expenditures data and there was no legislative professionalism score for Wisconsin in 2010 because of missing session length data. The final analytic dataset thus included 487 state-year observations. The initial year of our dataset, 2010, corresponded to the release of the first public draft of the Framework for K-12 Science Education by the National Research Council (NRC) and provided 3 years of baseline data before initial adoption of NGSS (NGSS, n.d.a.). In this section, we describe each of the variables in our analysis and its respective data source.
Dependent Variable
The primary dependent variable was a binary indicator of state adoption of NGSS. We used data from the National Science Teachers Association (NSTA) that detailed whether a state had or had not adopted NGSS and cross-referenced their data against other sources such as news articles and empirical papers to confirm accuracy. We relied on Smith’s (2020) early and late NGSS adopter framework and searches of media and legislative reports to determine the year each state adopted NGSS. The NSTA specified whether a state adopted NGSS directly or whether the state had based its updated science standards around NGSS. For the purpose of our primary analysis, we coded both full adoptions and the adoption of standards based on NGSS as adopting NGSS; however, in further analyses, we disaggregated the two into separate indicators for full adoption of NGSS and adoption of standards based on NGSS. In each case, our variables consisted of binary indicators with values of 1 in years in which a state had adopted (or based standards on) NGSS and a 0 in times before such adoption.
Independent Variables
Our interest was in predicting NGSS adoption (both initial adoption and sustained implementation) based on indicators of the following: political conditions, economic conditions, STEM industry in the state, prior adoption of nation-wide standards, and geographic diffusion. Table 1 shows values of our key independent variables for each state in the year they adopted NGSS.
Key Predictor Statistics by Year NGSS First Adopted (Full Adoption or Adoption of Standards Based on NGSS) in State.
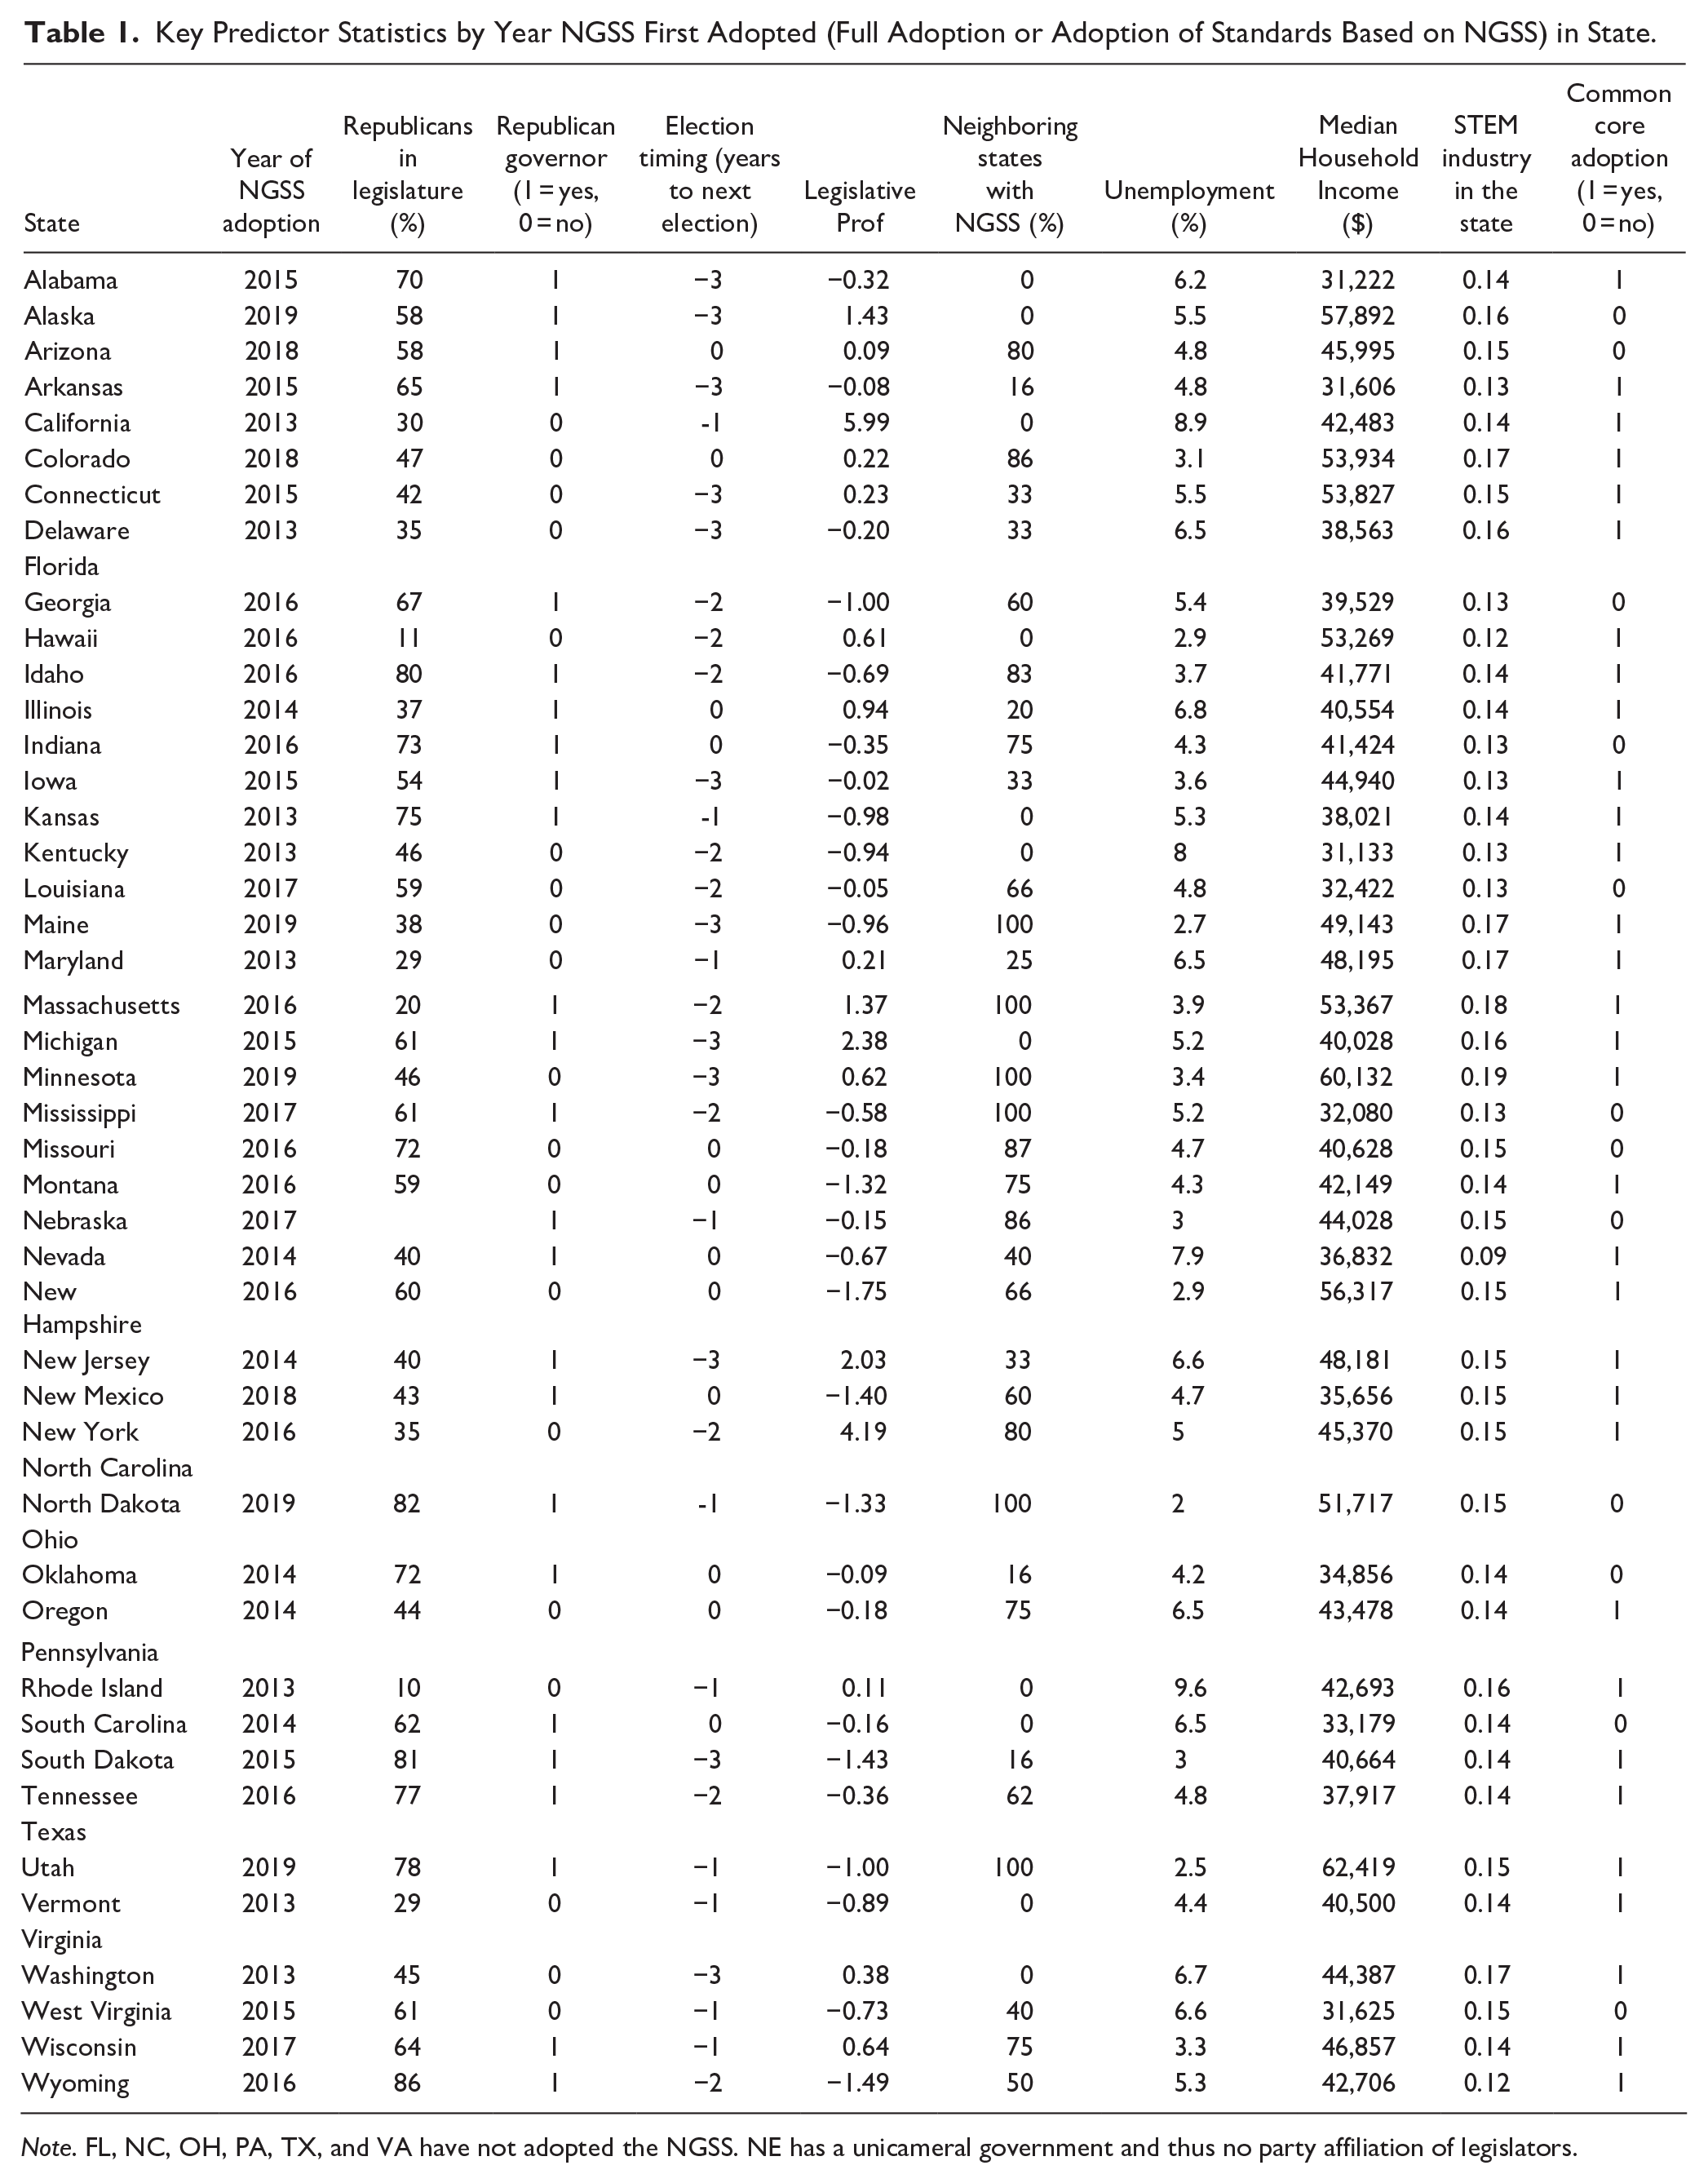
Note. FL, NC, OH, PA, TX, and VA have not adopted the NGSS. NE has a unicameral government and thus no party affiliation of legislators.
Political Conditions
We used four measures to capture the political conditions within each state. The majority of the data was collected from the Book of the States. First, using data from the Book of the States (Book of the States table 3.3), we operationalized legislative political composition as the percentage of Republicans within each state legislature in each year (calculated by dividing the number of Senate and House Republican members by the total membership in the legislature). Nebraska does not have a partisan legislature, so this variable was missing for Nebraska.
The second measure of political conditions within a state was the political party of the governor. We used a binary indicator of whether a state had a Republican governor in each year. This variable was drawn from an existing dataset collected by Cohen-Vogel et al. (2020), and updated for more recent years (2018 and 2019) via searches of individual state governor records. From 2015 to 2018, Alaska had a Libertarian governor; however, based on his political views, we coded him as a Republican governor.
The third measure used to capture political conditions within a state was election timing, this variable indicated the number of years until the next gubernatorial election. This variable ranged from −3 to 0 in our dataset where −3 indicated 3 years until the following gubernatorial election, −2 indicated 2 years until the following gubernatorial election, −1 indicated 1 year until the following gubernatorial election, and 0 indicated the gubernatorial election occurred in the given year.
The final measure used to capture political conditions within a state was legislative professionalism. We used the same index created by Bowen and Greene (2014) and included state expenditures per legislator, session length (including special sessions), and legislature salary data. A state with a higher number on the index has a legislature with more characteristics that allow legislators to approach their service as a profession and have more resources to perform their work. Using the same methods as Bowen and Greene (2014) and Cohen-Vogel et al. (2022) we expanded the dataset to include the years 2018 and 2019. Session length and legislator salary were sourced from the Book of the States and salary was converted to 2010 dollars. Data on expenditures was obtained from the U.S. Census Bureau’s Annual Survey of State Government Finances.
Economic Conditions
We used two different measures of the economic conditions within each state. The first was median household income. Data from the United States Census Bureau’s “Historical Income Tables: Households” provided median household income for each state for the years 2010 to 2019. All numbers were converted to constant 2010 dollars using the consumer price index inflation calculator provided by the United States Bureau of Labor Statistics.
The second measure used to capture economic conditions within a state was unemployment rates. The researchers used data provided by the United States Bureau of Labor Statistics, using August unemployment rates for each year across the 10 years.
STEM Industry in the State
We measured STEM industry in each state using data provided by the United States Bureau of Labor Statistics. Specifically, we grouped STEM professions together using occupation codes and divided this by the total workforce in the state to provide a proportion of STEM workers. The data for this analysis were coded based on the U.S. Bureau of Labor Statistics (BLS) definition of STEM occupations. This definition is widely recognized and used in publications and research on STEM workforce trends. Specifically, the BLS defines STEM occupations as including computer and mathematical, architecture and engineering, and life and physical science occupations, along with managerial and postsecondary teaching roles related to these areas, as well as sales occupations requiring scientific or technical knowledge at the postsecondary level (U.S. Bureau of Labor Statistics, n.d.).
The decision to use the BLS definition was driven by its comprehensive nature and frequent application in research and policy discussions about the STEM workforce (Fayer et al., 2017; Jones, 2014). This definition captures a broad spectrum of roles essential to the STEM industry while maintaining consistency across state and national-level comparisons. Additionally, using the BLS definition allowed us to align our analysis with existing studies and ensure our findings were comparable to other research on STEM workforce distribution, trends, and policy. By applying this definition, we were able to assess the presence of STEM workers in each state with greater precision and consistency, which enhances the validity of our analysis.
Common Core Adoption
Recognizing that adoption of NGSS may be predicted by adoption of other nation-wide standards, we included a measure of Common Core State Standards adoption as a binary variable for each year in the dataset. This variable had a value of 1 in years in which a state had adopted the Common Core and 0 otherwise. If a state adopted Common Core and then withdrew from the standards (which a number of states did) then the variable changed from a 1 to a 0 for the year that the state withdrew and the following years. For example, New York adopted the Common Core State Standards in 2010, so from 2010 to 2016 in the dataset the Common Core variable was coded as 1. Then, in 2017, New York withdrew from the standards, so, for years 2017 to 2019, the variable was coded as a 0 for New York. Common Core adoption years were drawn from publicly available Common Core adoption maps.
Geographic Diffusion
We used one measure to assess how geographic diffusion was related to NGSS adoption. Specifically, we used percent of neighboring states who had adopted or based standards on NGSS. For every year in our analysis, we calculated the percentage of states who shared a border with the state in question that had adopted or based their standards on NGSS.
Data Limitations and External Influences on Adoption Timelines
While we sought to capture a comprehensive set of variables to explain NGSS adoption, we were constrained by limitations in data accessibility and quality. In particular, issues like the timing and impact of local advocacy movements, which can often accelerate the adoption of standards, were difficult to quantify consistently. Additionally, some states have specific review and adoption cycles for educational standards, with a statutory review period set every 2 to 10 years. However, such review cycles generally do not prevent earlier consideration and adoption of standards. Specifically, states can review and adopt standards ahead of these scheduled review cycles when external political pressure or advocacy movements push for expedited adoption of new standards.
A prime example of this is the widespread adoption of the Common Core State Standards, which saw 45 states and the District of Columbia adopt the standards in the year Common Core was released (2010), ahead of many states legally mandated review periods. These external forces—such as political lobbying, public pressure, and advocacy—often have the power to alter or expedite the pace of adoption, resulting in earlier review of standards. This phenomenon underscores the complexity of understanding how standards are adopted, as political and social influences can reshape the usual trajectory of legislative processes. While we attempted to include as many relevant variables as possible, these limitations highlight the challenges of capturing the full scope of factors that contributed to NGSS adoption.
Methods
Data were analyzed using several analytic approaches, including event history analysis, competing risks regression, and multinomial logistic regression. Each was used to address specific parts of our research questions.
Event History Analysis—Overall Adoption
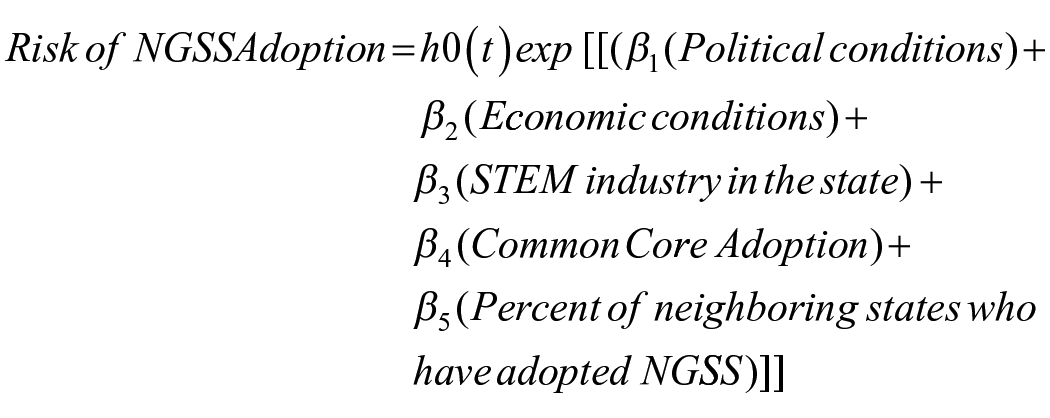
First, our primary research question examining predictors of either fully adopting or basing standards on the NGSS was examined through an event history analysis (EHA). Event history analysis, also referred to as survival analysis, failure time models, and hazard rates models is a quantitative method that is commonly used to examine predictors of the occurrence of particular events, including policy adoption. We used EHA to examine the relationship between internal determinants including the political conditions; economic conditions; STEM industry in the state; policies of regional neighbors (independent variables) and the adoption of NGSS (dependent variable). We used the Cox proportional hazards model, predicting the hazard rate of adoption of NGSS (full adoption or adopting standards based on NGSS) occurring in a particular year from our set of independent variables. The EHA estimates hazard ratios, which can be interpreted relative to 1, indicating increases or decreases in the expected hazard rates of states adopting NGSS in a given year.
Competing Risks Regression—Full Adoption Versus Adopting Standards Based on NGSS
As noted earlier, our initial analyses using the EHA were followed by discussions about the potential importance of disentangling the policy actions of states that fully adopted NGSS and those that adopted standards based on NGSS. Through this emergent design, we identified our second research question that sought to examine predictors of full adoption and basing standards separately. To address this question, we used competing risks regression or competing risks EHA. Similar to a standard EHA, a competing risks EHA models the risk of adopting a particular policy in the presence of an alternative, competing outcome. In our case, we estimated both models that predicted the full adoption of NGSS with a competing risk of adopting standards based on the NGSS as well as models that predicted the risk of adopting standards based on the NGSS with a competing risk of fully adopting NGSS. In contrast to the standard EHA, the competing risks model removed states from the risk set of fully adopting when the state adopted standards based on the NGSS (and vice versa for the other model). Similar to EHA, the resulting estimates are interpreted relative to 1, demonstrating how particular independent variables predict increases or decreases in the risk of adopting one or the other outcome in the presence of the competing risk.
Multinomial Logistic Regression—Continued Implementation of NGSS
Finally, our second emergent research question focused on continued implementation of the NGSS standards (whether fully adopted or based on). The EHA and competing risks approaches remove states from the risk sets once they have adopted the policy of interest, such that once an event occurs, the state is no longer at risk of future changes. This is consistent with survival analysis’ use in public health to predict terminating outcomes like death of patients. However, in the case of policy adoption of state standards, states do have the possibility of de-adopting (as was seen with many states for Common Core) or changing policies (fully adopting NGSS after previously basing standards on NGSS). Thus, we were interested in predicting the continued implementation of NGSS standards through a model that retains states in the dataset after policy adoption. To do so, we used multinomial logistic regression, a form of logistic regression used to predict nominal outcomes (in this case, fully adopting NGSS and adopting standards based on NGSS). Multinomial logistic regression produces estimates in the form of odds ratios that, while slightly different in terms of outcome unit, are similarly interpreted relative to a value of 1 for increases or decreases in the logged odds of a state having one or the other form of NGSS in a given year. We turn now to a presentation of the results from each of these models.
Results
Trends in NGSS Adoption
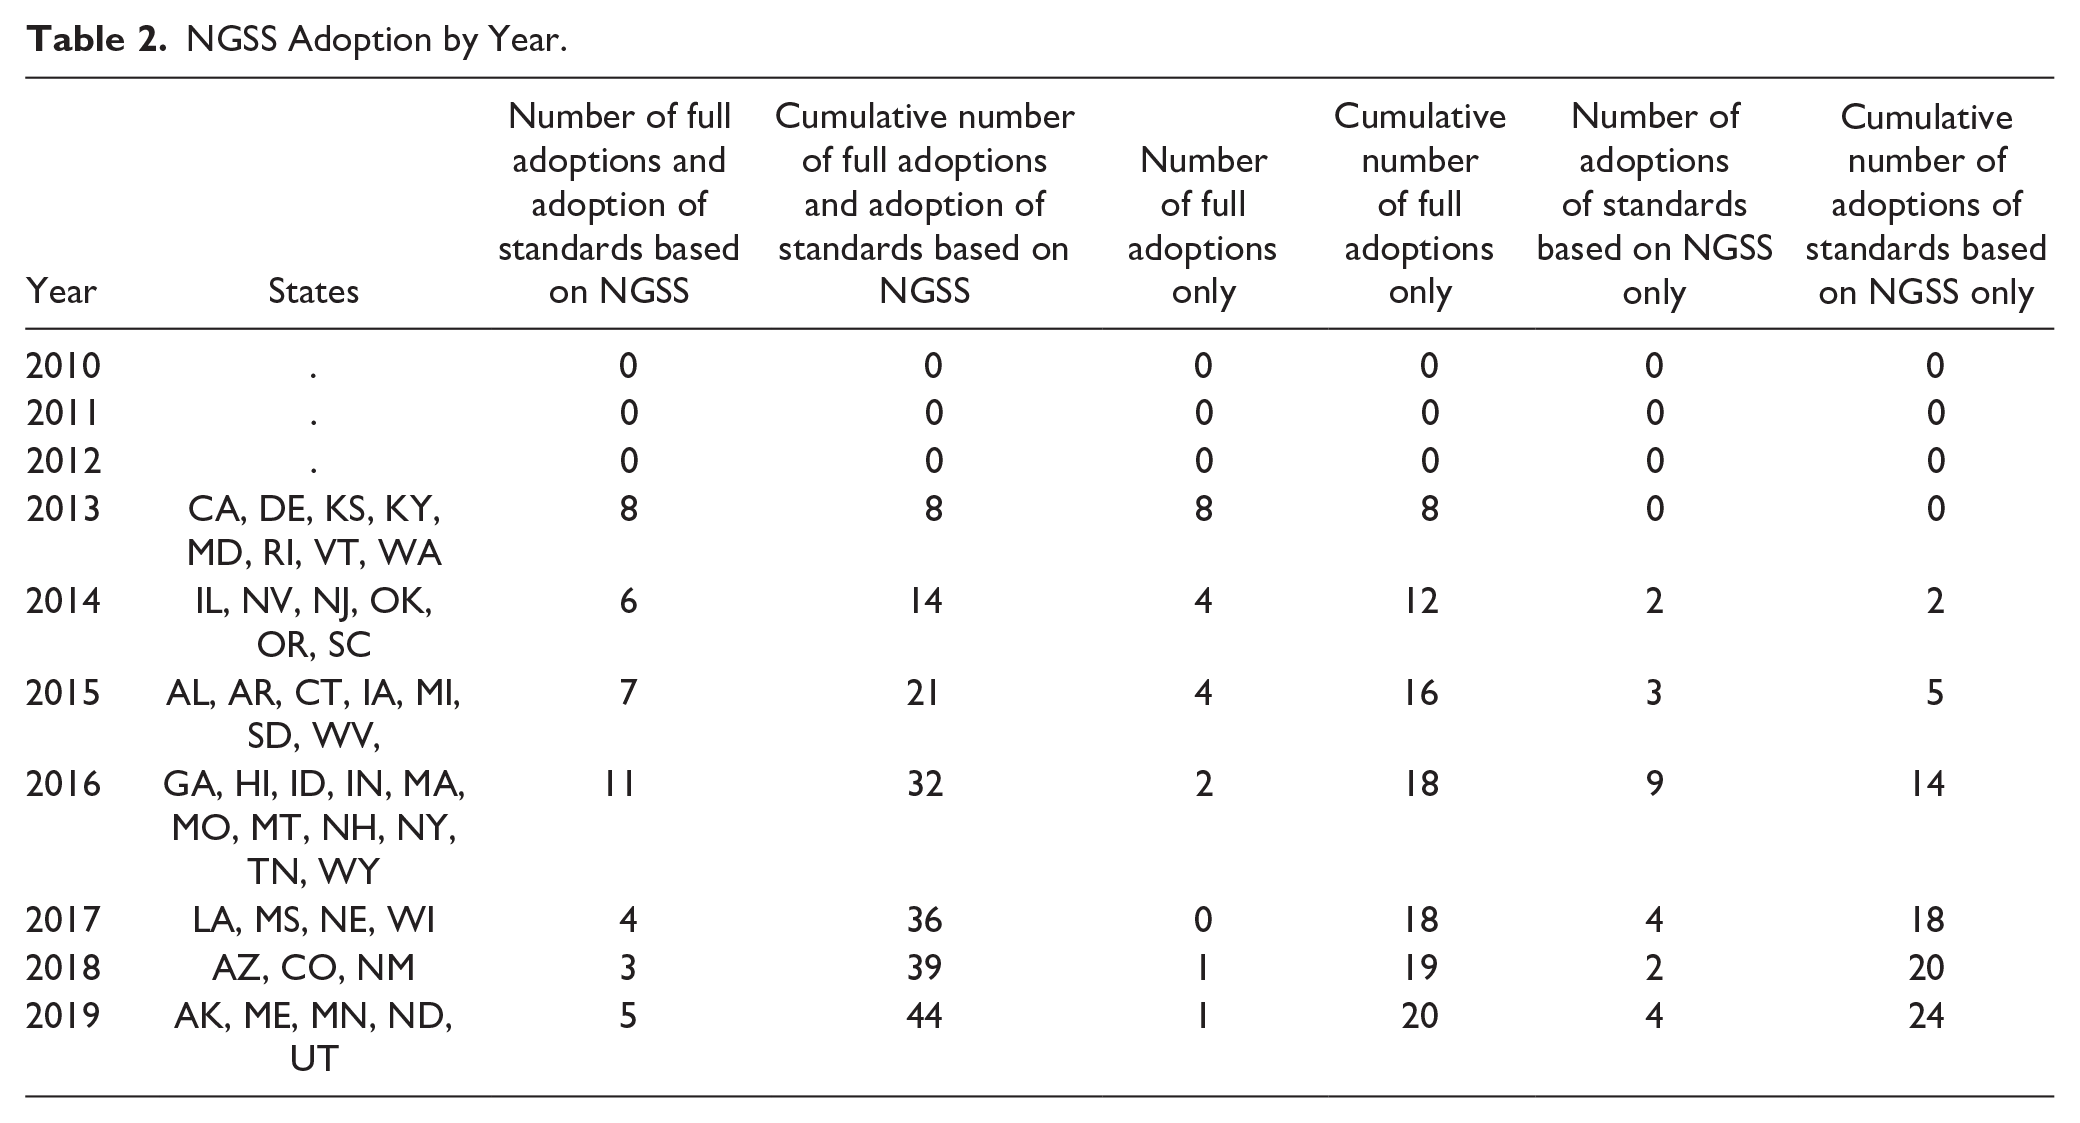
Between the years 2013 to 2019, 20 states fully adopted the NGSS, 24 based their standards on NGSS, and 6 did not adopt nor base their standards on NGSS. Table 2 shows that the distribution of states adopting and basing standards around NGSS across this time period was not uniform. As shown, states moving to fully adopt the NGSS peaked first, with 8 states adopting in 2013, the first year they were released, and another eight adopting by 2015. In contrast, states adopting standards based on NGSS peaked later, with nine states doing so in 2016 and another 10 doing so between 2017 and 2019. This is consistent with prior literature that finds that policy adoption frequently proceeds at different rates across time (Berry & Berry, 2018).
NGSS Adoption by Year.
Event History Analysis Results
The results of the EHA for adoption (full or basing standards on) of the NGSS standards across the full sample of years are presented in Table 3. Column 1 shows results from bivariate regressions (each independent variable predicting adoption without controls) while column 2 presents the full model. In contrast with expectations, there were no statistically significant (p < .05) relationships between the independent variables and states’ adoption (full or basing standards on) of NGSS in the fully specified model.
Event History Analysis Results.
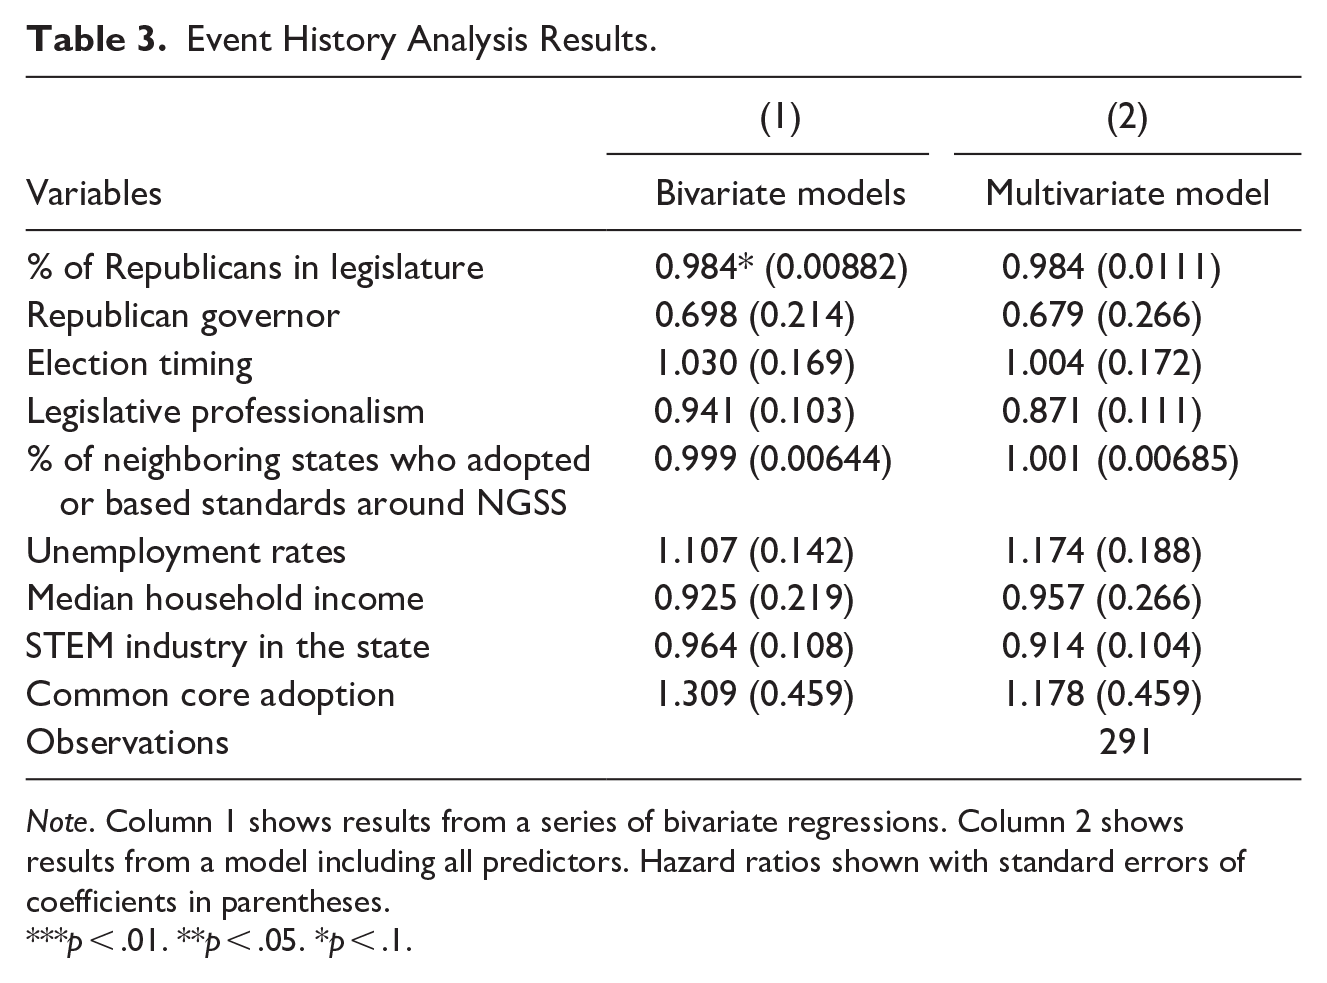
Note. Column 1 shows results from a series of bivariate regressions. Column 2 shows results from a model including all predictors. Hazard ratios shown with standard errors of coefficients in parentheses.
p < .01. **p < .05. *p < .1.
Reflecting on the results of the EHA, we hypothesized that the null findings had to do with our operationalization of the adoption of NGSS, specifically a single binary variable including both full adoption and adoption of standards based on NGSS. After discussing our initial results and the potential importance of the difference in adopting the NGSS versus adopting standards based on NGSS, we decided to further probe the relationships by examining the following emergent research question: do the following predictors (political climate, economic climate, STEM workforce, common core adoption, and proximity to neighboring states who adopt) differ when examining states who adopted the NGSS versus states who based their standards on the NGSS?
Competing Risks Regression Results
To further understand how relationships differ when examining states who fully adopted the NGSS versus states who based their standards on the NGSS, we ran a competing risk regression, which, as discussed previously, is similar to standard EHA but allows two competing causes of failure (fully adopting the NGSS and adopting standards based on NGSS). The results of the competing risk regression for fully adopting the NGSS are presented in Table 4 and the results of the competing risk regression for adopting standards based on the NGSS are presented in Table 5. As before, the first column shows results from bivariate regressions while the second column shows a fully specified model.
Results From Competing Risks Regression—Predicting Full Adoption.
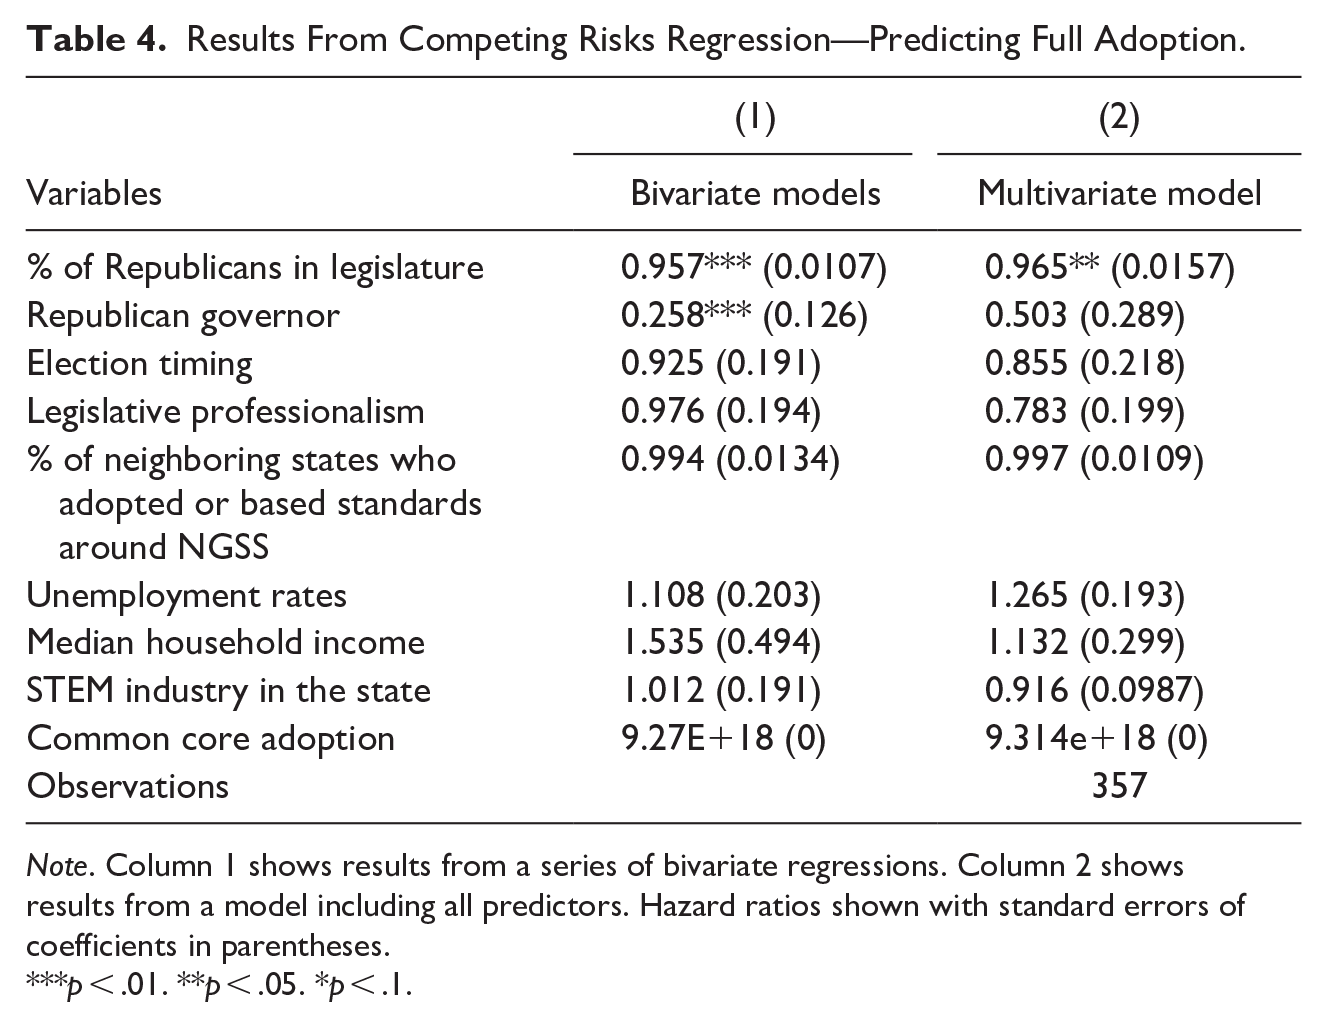
Note. Column 1 shows results from a series of bivariate regressions. Column 2 shows results from a model including all predictors. Hazard ratios shown with standard errors of coefficients in parentheses.
p < .01. **p < .05. *p < .1.
Results From Competing Risks Regression—Predicting Based on NGSS.
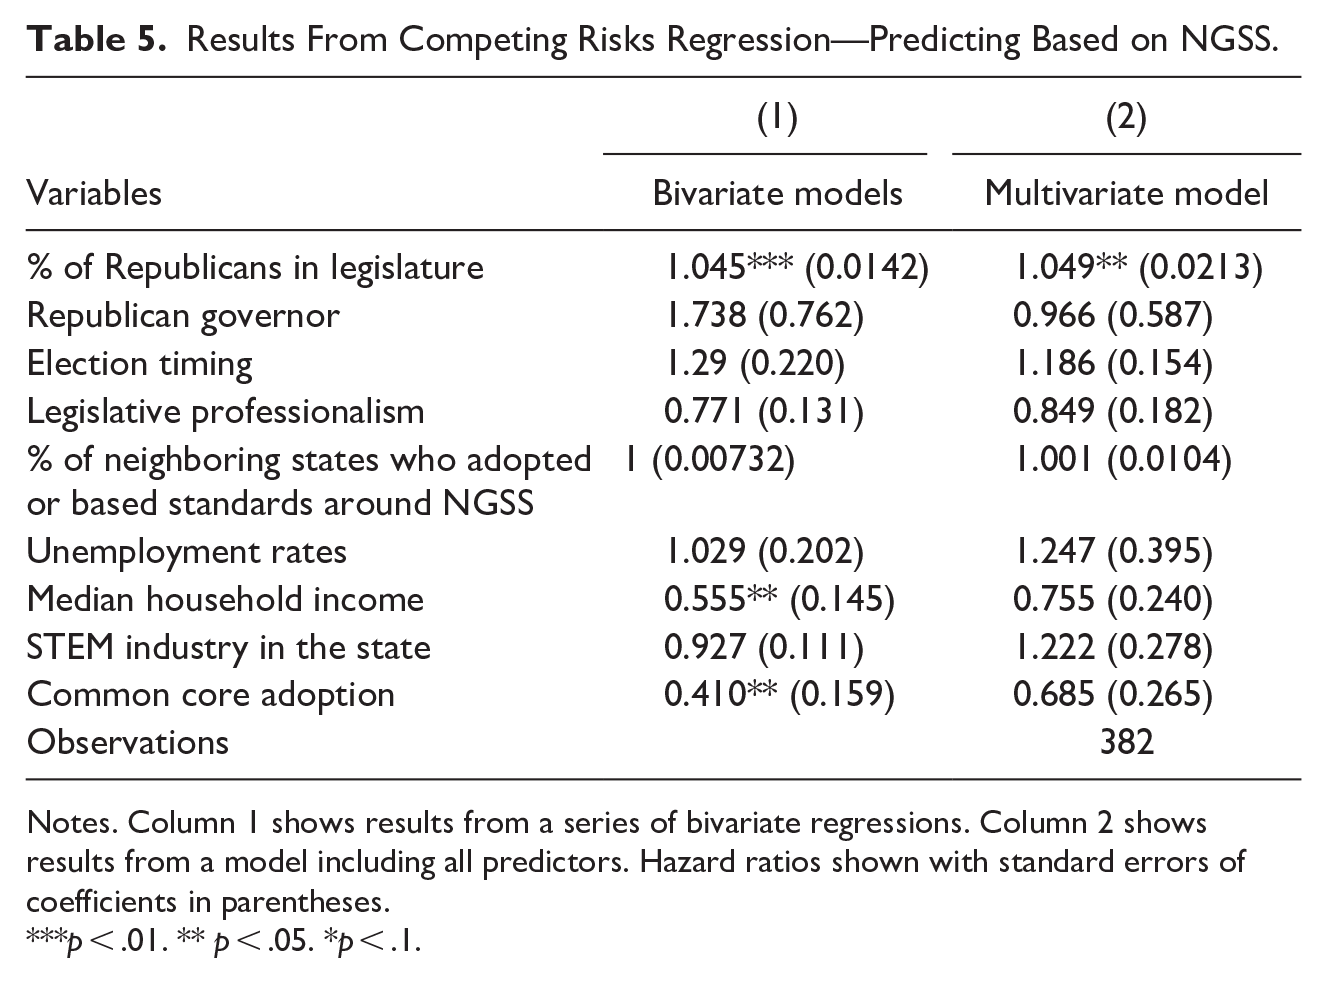
Notes. Column 1 shows results from a series of bivariate regressions. Column 2 shows results from a model including all predictors. Hazard ratios shown with standard errors of coefficients in parentheses.
p < .01. ** p < .05. *p < .1.
When analyzing results for states who fully adopted the NGSS, we found that the percent of Republicans in the legislature negatively predicted whether a state would fully adopt the NGSS. Specifically, we found that in the fully specified model for every one percentage point increase in the percentage of Republicans in a state’s legislature, the risk of fully adopting the NGSS decreases by 3.5% (p < .05) with all other variables being non-significant (see Table 4). The presence of a Republican governor was also highly predictive of a lower likelihood of fully adopting the NGSS in the bivariate model; however, this relationship was insignificant once controlling for other variables.
The opposite was found for adopting standards based on NGSS (Table 5). The percent of Republicans in the legislature positively predicted whether a state would adopt standards based on NGSS. Specifically, in the fully specified model, we found that for every one percentage point increase in the percentage of Republicans in a state’s legislature, the risk of adopting standards based on NGSS increased by 4.9% (p < .05) with all other variables being non-significant (see Table 5). A similar relationship between the political composition was seen in the bivariate model. Additionally, median household income and adoption of the Common Core State Standards predicted a lower likelihood of adopting standards based on the NGSS in the bivariate models, though not in the fully specified model.
Multinomial Logistic Regression Results
To further understand how political climate, economic climate, STEM workforce, Common Core adoption, and proximity to neighboring states who adopt or base standards predicted the continued implementation of fully adopting the NGSS or adopting standards based on NGSS, we conducted a multinomial logistic regression. When examining how the independent variables related to the continuation of states fully adopting the NGSS, we found that the percentage of Republicans in the legislature, legislative professionalism, STEM industry in the state all negatively predicted continued implementation of the NGSS while Common Core adoption positively predicted continued implementation of the NGSS (see Table 6).
Results From Multinomial Logistic Regression—Continued Implementation.

Note. Relative risk ratios shown. Standard errors in parentheses.
p < .01. **p < .05. *p < .1.
The percentage of Republicans in the legislature was negatively related to the odds of continued implementation of the NGSS. Specifically, every one percentage point increase in the percentage of Republicans in a state’s legislature was associated with a 6.3% decrease in the odds of implementing NGSS in a given year (p < .01). Greater legislative professionalism was also negatively related to the odds of continued implementation of the NGSS as was the STEM industry within the state. Specifically, every one percentage point increase in the percentage of STEM workers in the state was associated with a 28.6% lower odds of implementing NGSS in a given year (p < .01). Finally, we found that states who still had Common Core were 3 times as likely than states who did not to be implementing NGSS in a given year.
When examining how the independent variables related to the implementation of standards based on NGSS, we found that the median household income negatively predicted the odds of implementation of standards based on NGSS in a given year. For median household income, a one-unit increase (an increase in $10,000) decreased the odds of implementation of standards based on NGSS by 61.5% (p < .01). We found that states who still had Common Core had a 49% lower odds of having standards based on NGSS (marginally significant at p < .10), being more likely to be implementing the full NGSS.
Discussion
This study contributes to our understanding of policy innovation and diffusion in education by systematically examining the factors related to adoption of the Next Generation Science Standards. While prior work has examined policy adoption of standards in mathematics and reading, specifically the Common Core State Standards (LaVenia et al., 2015; McDonnell & Weatherford, 2013), this study examined how internal and external factors related to standards adoption in science. Science standards are a particularly unique case given the widespread attention among policymakers to advancing STEM outcomes while paying relatively less attention to science standards amidst highly politicized policy discussions around the Common Core State Standards during the past decade.
Our study found that, while regional diffusion and internal state characteristics were not systematically related to overall adoption of NGSS (full adoption or adopting standards based on NGSS), important nuances existed across political party control in whether states fully adopted the standards or based their standards on NGSS and the likelihood of implementation of such standards in a given year. In particular, results from the event history analysis predicting NGSS adoption revealed that none of the included independent variables predicted whether a state would adopt NGSS; however, the percent of Republicans in the legislature negatively predicted a state fully adopting NGSS and positively predicted states adopting standards based on NGSS.
We hypothesize that this tendency for Republican controlled states to favor adopting standards based on NGSS over full adoption may represent a more politically viable approach to wider policy adoption, particularly against a backdrop of increasing politicization around the Common Core State Standards. In particular, adoption of standards based on NGSS, rather than full adoption, could yield two benefits. First, doing so may have allowed states to selectively avoid contentious components of the standards while still adopting much of the framework. For example, the NGSS includes standards related to evolution and climate change—issues Republican politicians and Republican voters have historically found undesirable (Abeles et al., 2019; Feldman et al., 2012; Funk, 2014; McCright & Dunlap, 2011; Miller et al., 2006). Thus, basing standards on the NGSS while modifying or removing topics like these could prove more politically viable in conservative led states.
In addition to the ability to modify content, adopting standards based on NGSS rather than full adoption could give state policymakers the ability to distance themselves from political pressures associated with adopting common national standards, even if the standards adopted effectively mirrored the NGSS. Prior work has shown that when many states de-adopted the Common Core State Standards, they kept significant portions of the standards while rebranding away from the contentious Common Core label (Coe & Daughtery, 2017; Sawchuk, 2017). It is possible that basing standards on the NGSS similarly provided policymakers the ability to avoid politicization associated with adoption of common national standards.
The extent to which states adopting standards based on NGSS deviated from the NGSS standards or adopted functionally similar standards under a different name is unclear. Unfortunately, there is a lack of detailed analysis on the similarity and differences between standards based on NGSS and the full NGSS standards. While the lack of a systematic and direct comparison between the states who based their standards on NGSS and the actual NGSS standards complicates further interpretation of the competing risks regression findings, we point to the need for future research to provide a more systematic comparison of adopted standards to the NGSS standards as has been done for standards in reading and mathematics as they relate to the Common Core State Standards (Carmichael et al., 2010; Coe & Daughtery, 2017; Friedberg et al., 2018).
The results of our multinomial logistic regression models predicting the implementation of NGSS in a given year provide additional support for differential factors related to full adoption versus adoption of standards based on NGSS. Summarizing the results from the multinomial logistic regression showed that the percentage of Republicans in the legislature, legislative professionalism, STEM industry in the state all negatively predicted implementation of NGSS in a given year while Common Core adoption positively predicted implementation of NGSS. The percentage of Republicans in the legislature aligns with the findings above that greater percentages of Republicans in the legislature increased states’ likelihood to adopt standards based on NGSS rather than fully adopting them. The finding around Common Core is consistent with existing literature that shows that prior adoptions of standards-based reform policies predict adoption of new standards-based reform policies (LaVenia et al., 2015). It similarly suggests that, while public attention to the politics of NGSS were less pronounced than for Common Core, there may have been similar factors at play in the adoption of both. Common Core experienced widespread full adoption and then subsequent de-adoption; however, many de-adopting states continued to have standards that were functionally similar to Common Core (Coe & Daughtery, 2017; Sawchuk, 2017) with some noting that standards were largely unchanged despite the removal of the Common Core name (Garland, 2016). The NGSS standards, in contrast, proceeded through initial adoption with states both fully adopting and adopting standards based on NGSS, perhaps arriving at a similar place as Common Core without as much political controversy.
The findings around legislative professionalism and STEM industry in the state are harder to explain as they go against prior literature that finds that legislative professionalism is an important variable when examining policy adoptions (Allen & Clark, 1981; Rosenthal, 1996; Schmeida et al., 2007; Squire, 1993; Squire & Hamm, 2005; Cohen-Vogel et al., 2022; Walker, 1969). We also found that median household income and Common Core adoption negatively predicted the implementation in a given year of standards based on the NGSS. The finding on Common Core is consistent with the other model, suggesting states that were implementing Common Core were more likely to be implementing NGSS rather than standards based on NGSS. Our finding around median household income is contradictory to prior literature that finds that wealthier states and states with stronger economic climates have an increased likelihood of adopting new policies, especially if those policies are expensive and require large public investment (Birkland, 2015; Kousser, 2002; Plotnick & Winters, 1985). The explanation for this finding is therefore difficult. A potential hypothesis may be that because adoption of standards is not as expensive as other policy adoption such as adopting a universal pre-k system, economic conditions are less influential in shaping policy adoption. It also may be explainable by increasingly polarizing politics emphasizing political conditions more than economic.
Limitations
While our study provides the first systematic examination of NGSS policy adoption and finds interesting nuances in the adoption patterns and factors relating to adoption, the study is nevertheless limited in several ways. First, like other similar studies, a number of unobserved variables that may affect adoption exist and are unaccounted for in the analysis due to data limitations. For example, variables such as state board of education political makeup, religiosity levels in the state, and others may also play an important role but were not included in the analysis due to restrictions in data quality. As such, our findings are correlational in nature and do not provide causal estimates of relationships between variables and NGSS adoption.
There may also have been other legislative factors that constrained states’ timing of standards policy adoption. For example, some states have defined timelines for review of standards. Though state legislators could override such timelines, as evidenced by the large-scale adoption of Common Core State Standards in a single year. For example, though not in place at the time of our analysis, Colorado law now stipulates that the State Board of Education (SBOE) should only review state education standards every 6 years (Colorado Department of Education, n.d.). This suggests the importance of examining political composition of the Governor and state legislature as these bodies would be involved for any off-schedule revision to the standards. There are likely other factors such as the one stated above that influence policy adoption in other states. We encourage other researchers to expand on our list of variables.
Additionally, our study uses a binary measure for political affiliation of the Governor and a continuous measure of the percentage of legislators affiliated with a particular political party, focused on the two primary political groups (e.g., Democrat vs. Republican). While this approach has been commonly used in previous research (e.g., Cohen-Vogel et al., 2022), we recognize that it may oversimplify the political spectrum as there can be varying degrees of conservatism or liberalism within party affiliations and localized nuances to such affiliations. This could potentially obscure important nuances within the political landscape and may have an impact on the findings.
Implications for Future Work
Our study speaks to the need for additional research in examining how science standards differ between states who have adopted the NGSS and states who have based their standards around the NGSS. Future research should aim to run comparative policy analyses on state science standards. Other research should look at other stages of the policy life cycle, not just policy adoption. Previous research has found that considerably less attention is given to other stages of the policy life cycle, such as agenda setting and implementation (McLendon et al., 2014) and that is problematic, especially considering that different inside and outside regional factors have more or less influence during different states of the policy cycle. For example, Cohen-Vogel and Ingle (2007) found that regional neighbors play a less influential role during the policy adoption stage compared to the agenda setting and proposal formulation stages. Future studies then should expand on our work to consider innovation and diffusion factors at other stages of the policy life cycle. Another important route for future research is independent state by state case studies around NGSS adoption.
Conclusion
This study systematically examined factors related to adoption of the Next Generation Science Standards. In doing so, it extends the evidence base on standards adoption beyond mathematics and reading. The findings reveal that, while less contentious than Common Core, the NGSS were nevertheless adopted through various mechanisms that were related to political composition of state legislatures. In doing so, it suggests that pushes for full adoption of standards may be politically less viable than parallel adoptions that allow states to adopt standards based on NGSS. As policymakers continue to debate the role of standards in education reform, these findings provide perspective on the policy adoption process and stand to inform future adoption of education standards.
Footnotes
Declaration of Conflicting Interests
The author(s) declared no potential conflicts of interest with respect to the research, authorship, and/or publication of this article.
Funding
The author(s) received no financial support for the research, authorship, and/or publication of this article.