
Abstract
A growing body of research shows that students benefit when they demographically match their teachers. However, little is known about how matching affects social-emotional development. We use student-fixed effects to exploit changes over time in the proportion of teachers within a school grade who demographically match a student to estimate the effect on social-emotional measures, test scores, and behavioral outcomes. We find improvements in students’ grit and interpersonal self-management when matched to teachers of their race and gender. Black female students drive these effects. We also find that matching reduces absences and suspensions, especially for Black students. Our findings add to the emerging teacher diversity literature by showing its benefits for Black and female students during a critical stage of development.
Keywords
Introduction
Teachers are essential for improving student outcomes. The PK-12 student population has grown increasingly diverse over the last two decades (de Brey et al., 2019). Nevertheless, 80% of U.S. teachers are white, and 77% are female (Taie & Goldring, 2020).
One proposed strategy to reduce outcome gaps between student groups of different races and genders is to increase the racial and gender diversity of the teaching workforce to reflect the diversity of the student population, based on the theory that these matches provide role model or cultural congruence effects for students (Blazar, 2024; Hwang et al., 2024). Policies aimed at increasing teacher workforce diversity have gained traction in recent years, supported by a growing body of work finding that racially similar teachers can benefit students.
Teacher-student racial matching is associated with gains in student achievement (Dee, 2004; Egalite, Kisida, and Winters, 2015; Goldhaber & Hansen, 2010; Harbatkin, 2021), reductions in absences and suspensions (Bates & Glick, 2013; Blazar, 2021; Blazar & Lagos, 2021; Holt & Gershenson, 2019; Hwang et al., 2024; Gottfried et al., 2022; Lindsay & Hart, 2017; Shirrell et al., 2021), and improvements in high school dropout and college enrollment rates (Dee & Penner, 2021; Gershenson et al., 2022). In contrast, several papers have also found null effects of racial matching on student achievement (Ehrenberg et al., 1995; Howsen & Trawick, 2007; DuBois & Schanzenbach, 2017). Most of these small or null findings have focused on test scores, while there is more substantial evidence on other outcomes such as absences, suspensions, drop-out, and college enrollment.
Over the last decade, there has been an increased focus on the importance of school-based outcomes other than test scores, especially social-emotional (or non-cognitive) skills that facilitate individuals managing their own emotions, relating to others, and making responsible decisions (Almlund et al., 2011). These social-emotional skills predict long-run academic performance and earnings (Almlund et al., 2011; Chetty et al., 2011; Deming, 2017; Heckman & Mosso, 2014). As momentum is building to collect social-emotional measures in addition to academic outcomes, researchers have started to find significant differences in social-emotional outcomes between students of different races and genders (de Brey et al., 2019; Reardon et al., 2019; West et al., 2020).
Therefore, part of the momentum for research exploring the impact of teacher-student racial matching, particularly for Black students, is the number of studies in diverse contexts that have consistently found effects on outcomes like GPA that measure both cognitive and social-emotional skills, and outcomes that often act as a proxy for direct measures of social-emotional development, like absences, suspensions, high school dropout- and graduation rates, and college enrollment. These findings collectively suggest that racial matching improves behavioral outcomes through improvements in social-emotional skills, while not necessarily translating to significant test score effects (West et al., 2020; Blazar, 2021).
In contrast to the literature on racial matching, gender matching research in K-12 has focused mainly on students’ test score outcomes, and the overall evidence has tended to be more ambiguous. While studies have found minor positive effects (Winters et al., 2013), others have found null and negative results of gender matching (Dee, 2007; Goldhaber & Hansen, 2010; Antecol et al., 2015). To our knowledge, only one study in the gender matching literature has focused on measures directly or indirectly related to social-emotional development (Egalite & Kisida, 2018). This study focuses on students’ reports of personal effort, happiness in class, feeling cared for and motivated by their teacher, student-teacher communication quality, and college aspirations, rather than the students’ development. Deepening our understanding of how racial and gender matching affect social-emotional and behavioral measures remains an important unexplored area of literature.
We address this gap in the literature by investigating the effects of race and gender matching on student social-emotional, academic, and behavioral outcomes in six diverse Boston Charter Management Organizations. We use a unique dataset of student social-emotional surveys in 5th to 8th grade and link these surveys to rich administrative data for students and teachers. We estimate the effects of increasing the proportion of a student’s race and gender-matching teachers on student self-reports of growth mindset (GM), grit, interpersonal self-management (ISM), social awareness (SA), and student academic and behavioral outcomes.
Our results contribute to the literature on teacher-student demographic matching in three ways. First, we find a significant reduction in absences and suspensions for students who match their teachers’ race or gender. Second, we demonstrate that matching improves self-reported social-emotional measures, and we are among the first to directly explore demographic matching on self-reported interpersonal skills. Third, in our charter context, which emphasizes teachers holding high expectations for all students and attempting to recruit diverse instructional teams that more closely resemble the students’ demographic, matching still provides additional benefits to students (Angrist et al., 2013; Angrist et al., 2016). These results highlight the value of continuing to diversify the teacher workforce.
Background Literature
This paper integrates perspectives from the literature regarding teacher-student racial matching, teacher-student gender matching, and general teacher training and expectations. The literature presents two hypotheses about the importance of demographic matching between teachers and students: the effects of role models and cultural congruence.
First, the role model effect is a framework that explains how students benefit from having a demographically congruent teacher. If teachers of the same demographics as their students are better candidates as role models, learning from demographically congruent teachers might improve student motivation. Historically marginalized students may significantly benefit from teachers who share their characteristics as role models (Blazar, 2024; Hwang et al., 2024). Seeing instructional leaders who look like the student provides examples of people the student would like to emulate.
Second, cultural congruence is a framework that explains why a teacher of the same demographic background facilitates student learning more effectively. Given the cultural congruence between the teacher and student, teachers who share their students’ demographics may better support these students than teachers who do not (Blazar, 2024; Hwang et al., 2024; Rasheed et al., 2020).
Third, another hypothesis is that teachers with specific backgrounds may be better at teaching all students regardless of their backgrounds (Blazar, 2024). These teachers are considered to have a pedagogy that benefits all students, potentially borne from their lived experiences. For example, Blazar (2024) examines the hypothesis that black teachers might teach all students better because of their own experiences.
Additionally, the cumulative quality of the teachers and the school environment to which students are exposed may further augment these three potential mechanisms (Abdulkadiroğlu et al., 2011; Fryer, 2014). This paper’s primary hypotheses are that the role model and cultural congruence hypotheses are most relevant to this study, relative to hypothesizing that teachers with a specific background are stronger overall.
Racial Matching Literature
The evidence on the effect of teacher-student racial matching on student academic and behavioral outcomes continues to grow (Ehrenberg et al., 1995; Dee, 2004; Howsen & Trawick, 2007; Goldhaber & Hansen, 2010; Egalite, et al., 2015; Holt & Gershenson, 2019; DuBois & Schanzenbach, 2017; Lindsay & Hart, 2017; Gershenson et al., 2022; Harbatkin, 2021; Hwang et al., 2024). Blazar (2024) finds that black teachers improve all students’ test scores and absences. However, particularly for test score outcomes, the estimates have ranged from being quite large, where Dee (2004) found effects of over 0.2 standard deviations, to slight (i.e., 0.01 to 0.04 standard deviations), to null when using quasi-experimental methods on large state/national longitudinal datasets (Ehrenberg et al., 1995; Howsen & Trawick, 2007; DuBois & Schanzenbach, 2017).
However, the effects have been consistently positive when considering outcomes associated with social-emotional development. For example, Rasheed et al. (2020) find that black children assigned to Latino and white teachers are given worse teacher-reported academic and behavior scores than Latino children. Hwang et al. (2024) find that student-teacher race/ethnicity matching is associated with a lower rate of exclusionary discipline for Black students. Blazar (2024) finds that black teachers improve the self-efficacy and classroom engagement of their black but not non-black students. Additionally, Holt and Gershenson (2019) found modest reductions in elementary absences for being taught by a teacher of a similar race. These results have been replicated in high school (Gottfried et al., 2022) and elementary school (Blazar & Lagos, 2021). Holt and Gershenson (2019) also find a nearly 19% decrease in the number of elementary school suspensions, while Lindsay and Hart (2017) and Shirrell et al. (2021) find more minor but significant reductions. These effects could accumulate over time and be significant for long-term outcomes like chronic high school absenteeism, dropout, and college enrollment (Dee & Penner, 2021; Gershenson et al., 2022; Blazar, 2021).
These findings on teacher-student racial matchings’ relationships to different outcome measures are comparable to social-emotional measures’ associations with different outcome measures, with a relatively modest association with test scores and stronger relationships with outcomes like GPA (West et al., 2020). This comparison suggests that a critical mechanism through which racial matching operates is improving social-emotional learning. Overall, these results suggest that role model and cultural congruence effects may be the primary mechanisms through which racial matching operates because of the direct benefit for racially matched students. An exception is Blazar (2024), who suggests there may be value in teacher diversity for all students, regardless of their background, for outcomes such as absences and test scores.
Gender Matching Literature
Gender matching results have been more mixed in the K-12 context. Dee (2007) found positive effects for males in mathematics but adverse effects for females. However, neither group benefited from matching for ELA test scores. In contrast, using large state longitudinal datasets, Winters et al. (2013) found effects of between 0.01 and 0.02 standard deviations for middle school females and males in both ELA and Math. Still, Goldhaber and Hansen (2010) found null effects for gender. However, experimental evidence in elementary schools has found adverse effects on female math scores (Antecol et al., 2015). Egalite and Kisida (2018) found a large and significant impact of matching on students’ perception of their teachers for Black male and female students. These students reported that their teachers pushed them to work hard but ensured that they understood the class material and provided helpful feedback. These positive perceptions could translate into students’ perceptions that they can persist and improve or express care toward other classmates, but these remain unexplored areas of literature. While these findings highlight support for the role model or cultural congruence hypotheses, whether gender matching can improve behaviors or academics across contexts and grade ranges remains ambiguous.
Teacher Training and Expectations Literature
Given the potential promise of demographic matching and the inherent difficulty of changing the teacher supply chain, individuals have advocated for teacher training to provide teachers with skills that mimic the pedagogical mechanisms of demographic matching that influence students’ intrapersonal and interpersonal skills. For example, Egalite and Kisida (2018) advocate for educating teachers, regardless of their demographic backgrounds, on tools to engage in culturally responsive teaching to help students feel more engaged with the curriculum. Another dimension that teacher training could enhance is teachers’ skills for setting high expectations for all students. Many high-performing charter schools have been able to embed high expectations for students into their culture through longer school days and years, and through developing high expectations for student work and behavior (Abdulkadiroglu et al., 2011; Angrist et al., 2013; Angrist et al., 2016; Fryer, 2014). These expectations could help correct misperceptions and beliefs about the effort and skills needed to reach these goals (Egalite & Kisida, 2018; Gershenson et al., 2022). Furthermore, empirical evidence shows that some of these schools changed student post-secondary expectations and increased the number of students enrolling in post-secondary education (Angrist et al., 2016; Coen et al., 2019; Davis & Heller, 2019).
Examining if there is an additional benefit to teacher-student demographic matching in the context of this study expands the current literature by providing an example of how the high expectations modeled in our sample’s charter schools mediate the effects of demographic matching. If teachers exhibit cultural congruence or serve as role models for students who match their demographics, we still expect to observe the positive effects of matching in the charter context. For example, prior work on non-elementary absences identified two potential mechanisms contributing to increased attendance: higher expectations and students’ connectedness to school (Gottfried et al., 2022). Observed effects in our high-expectations context might provide evidence of the importance of connectedness above and beyond high expectations. In addition, the strength of the effect might vary across outcomes. For example, if matching operates through the effects of role models, we would expect that the teacher might have a greater influence on grit than GM, because leading the class showcases the teacher’s success and persistence, which are aspects of grit. We can explore these types of expectations since all of the charter management organizations in our sample are “high expectation” charters and, during the study period, employed practices to embody those principles (e.g., longer school days, an emphasis on behavior, and high academic expectations).
Data and Measures
Administrative and Survey Data
We combine state administrative and rich survey data for 5th- to 8th-grade students attending Boston’s public charter middle schools during the 2015 to 2019 school years. All the schools in our sample employ “high expectations” (e.g., longer school days, an emphasis on behavior, and high academic expectations for all students). Within these schools, we sampled all students from whom we received parental consent to participate and who attended school on the data collection day. The parental consent rate was relatively high for middle school students, at 96%. Students completed surveys using paper and pencil or digitally, depending on what individual schools decided was feasible (e.g., whether the schools had 1:1 hardware so all students could take the survey simultaneously). The surveys assessing students’ social-emotional development were conducted in their regular classrooms and were proctored by the teachers. The surveys took less than 20 min to complete.
We then merged these data with student-level administrative data—enrollment, attendance, suspensions, math and English language arts (ELA) test scores on the Massachusetts Comprehensive Assessment System (MCAS), and typical demographic information—provided by the Massachusetts Department of Elementary and Secondary Education (MADESE). MCAS scaled scores were standardized by grade, subject, and year by all students in the district to have a mean of zero and a variance of one. Administrative data is available for all students, but the student response rates on the survey averaged 83% overall.
The baseline characteristics of the student sample are in Table 1. We compared the students who responded to the survey and the students who did not take the survey. Notably, students in the sample are most commonly Black (47%) and receive free or reduced-price lunch (68%). On average, non-responding students performed worse academically and were likelier to be absent or suspended. We use the administrative data sample to compare our results directly with prior studies for our behavioral and test score outcomes. However, to assess how survey sample selection affects our estimates, we rerun our models for the administrative data using the survey-only sample and then compare them to the results in the paper in Supplemental Appendix Tables A4 and A5.
Descriptive Statistics of Analytic and Administrative Sample.
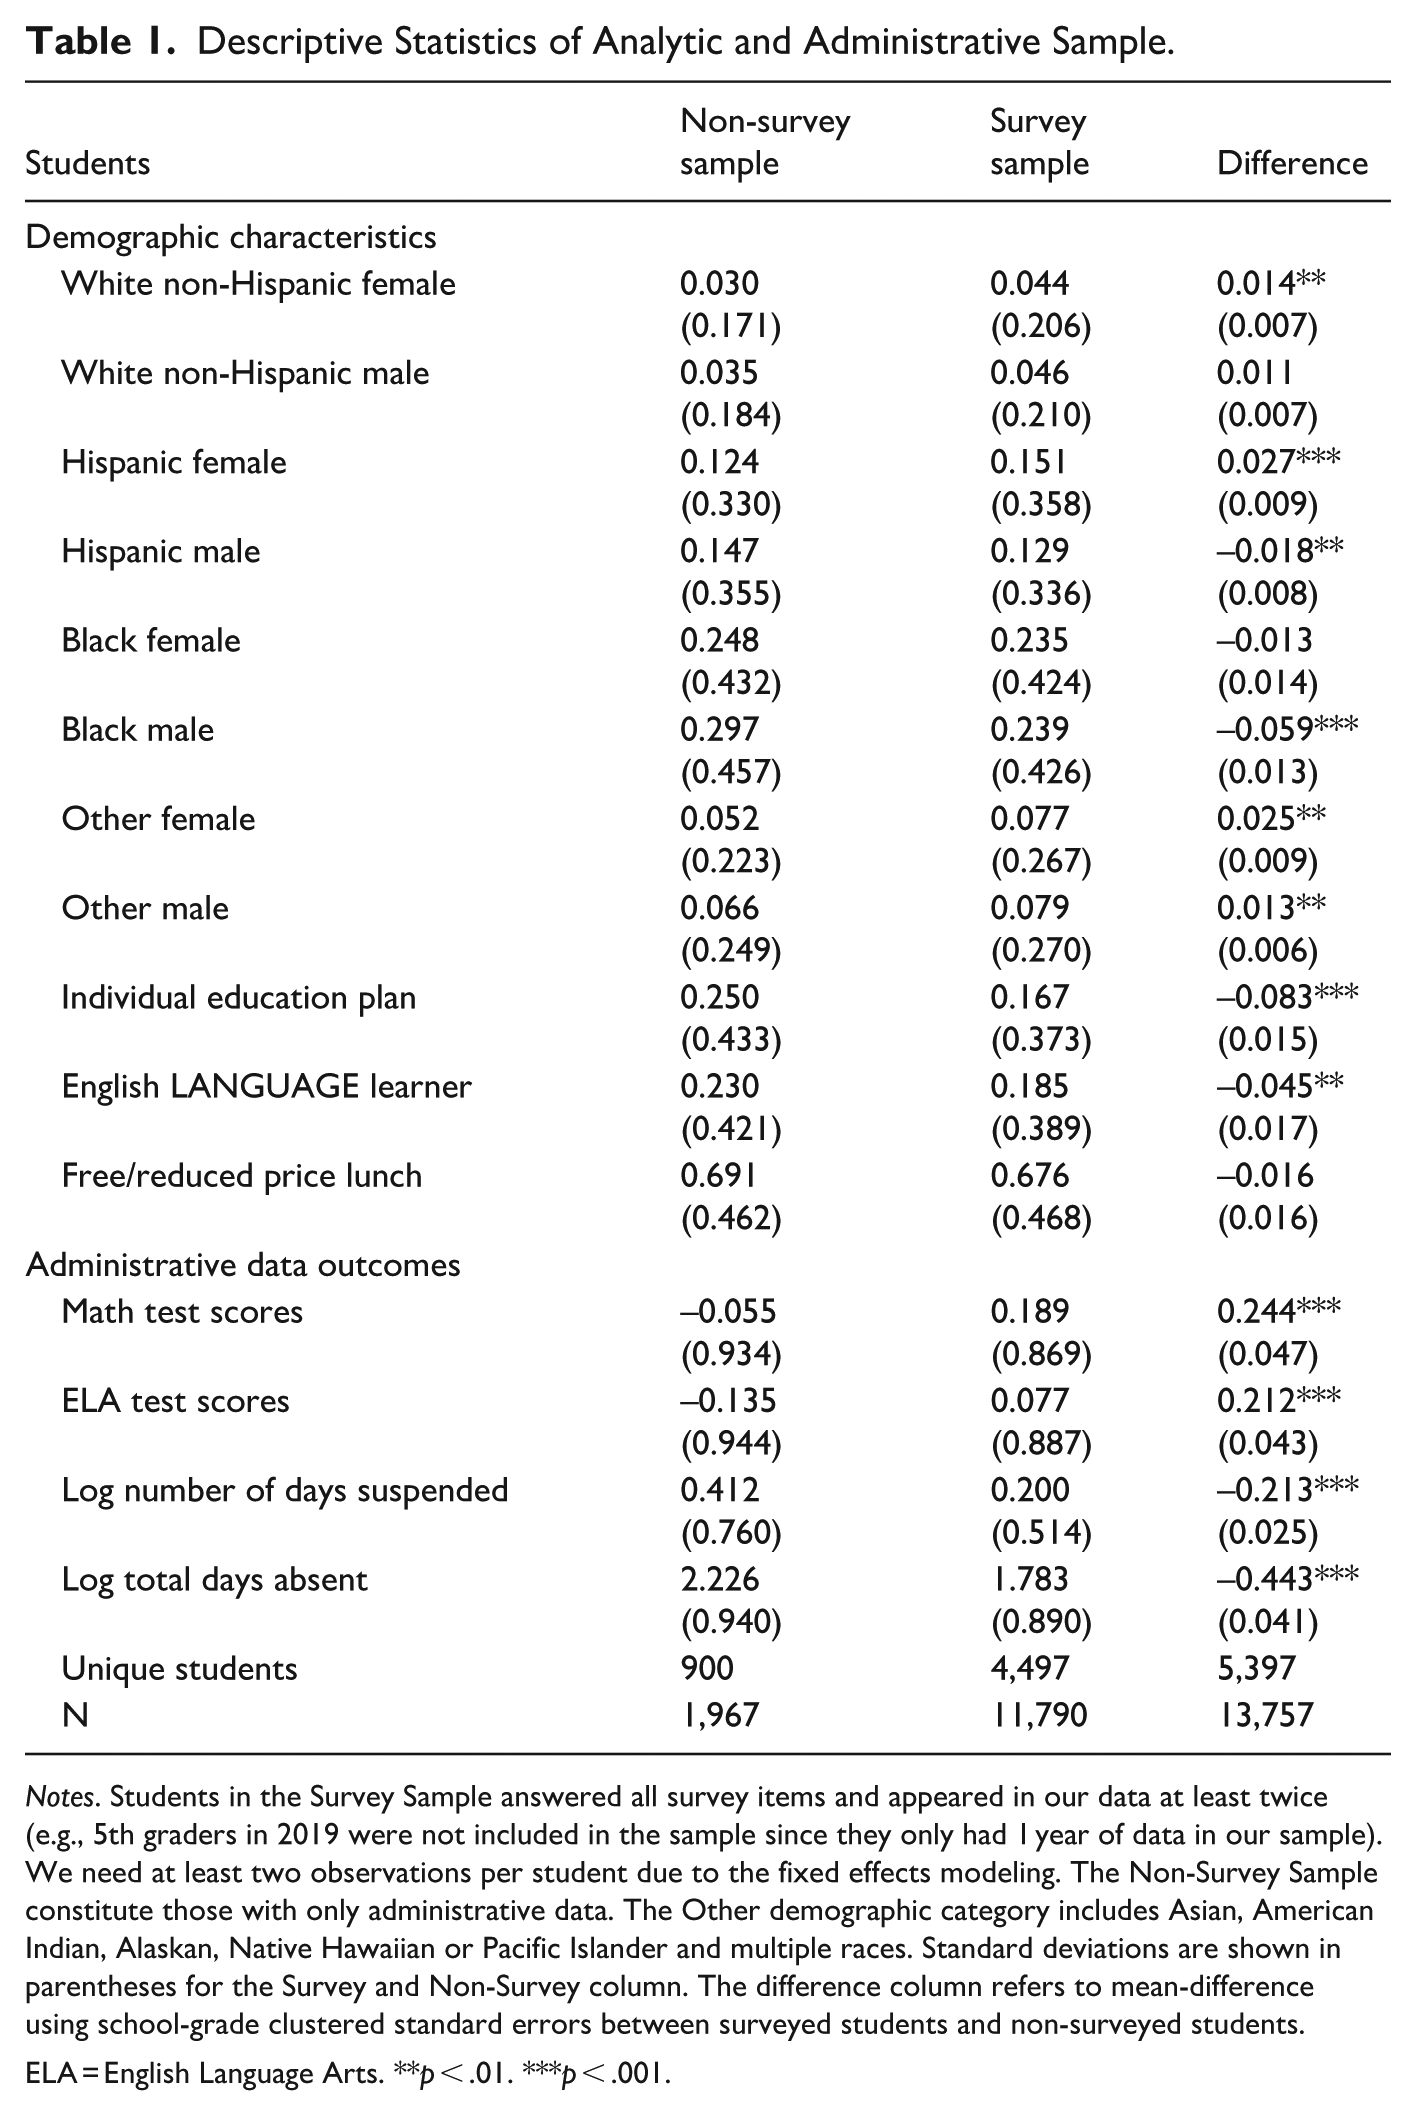
Notes. Students in the Survey Sample answered all survey items and appeared in our data at least twice (e.g., 5th graders in 2019 were not included in the sample since they only had 1 year of data in our sample). We need at least two observations per student due to the fixed effects modeling. The Non-Survey Sample constitute those with only administrative data. The Other demographic category includes Asian, American Indian, Alaskan, Native Hawaiian or Pacific Islander and multiple races. Standard deviations are shown in parentheses for the Survey and Non-Survey column. The difference column refers to mean-difference using school-grade clustered standard errors between surveyed students and non-surveyed students. ELA = English Language Arts. **p < .01. ***p < .001.
We also received administrative data for the teachers of students attending the district’s public charter middle schools during the 2015 to 2019 school years. We include all teachers in the participating schools (864). The characteristics of the teacher sample are in Table 2: White females (53%), White males (19%), Black females (13%), and Black males (4%). We then link the students to the teachers who taught them. Next, we calculate the proportion of teachers who match the student’s demographics. To connect our analysis to prior work, we focus on teachers who likely spent the most time with students: English language arts, mathematics, science, and social studies teachers. Thus, the mean number of teachers is four. For students with more than four teachers, these numbers often included special education instructors, co-teachers, etc. However, many students took math, English, science, social studies, art, foreign language, or physical education classes. When calculating the match rate for this broader array of teachers, the median student took about eight classes in middle school.
Descriptive Teacher Statistics of Analytic Sample.
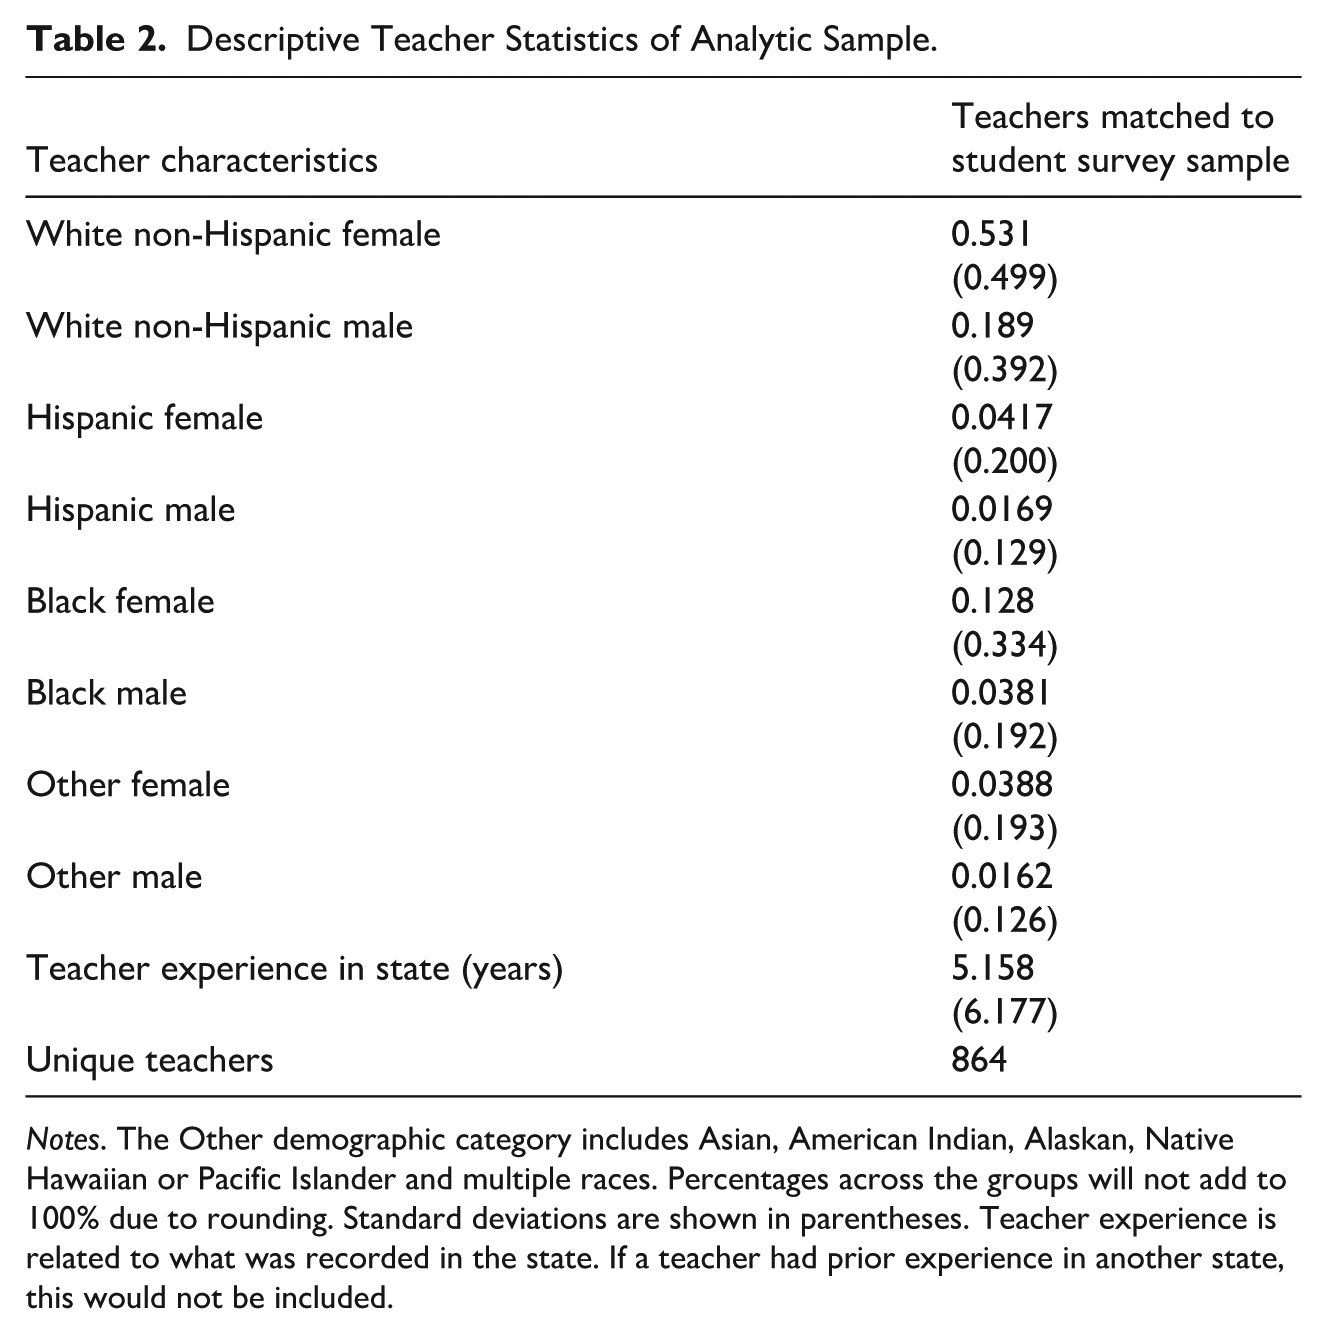
Notes. The Other demographic category includes Asian, American Indian, Alaskan, Native Hawaiian or Pacific Islander and multiple races. Percentages across the groups will not add to 100% due to rounding. Standard deviations are shown in parentheses. Teacher experience is related to what was recorded in the state. If a teacher had prior experience in another state, this would not be included.
Table 3 shows the proportion of teachers who match a student’s race or gender. Although white students are the minority in our sample, they are more likely to have a racial match than students of other racial groups. For example, 61% of white female students have a racial and gender match with a teacher compared to 12% of Black female students. Because we use panel data, we also explore how the demographics of students, teachers, and the match rates change by year in Supplemental Appendix Tables A9, A10, and A11. Broadly, the composition of teachers and students is relatively stable over time, with slightly fewer white female and male teachers and increasing numbers of black female and male teachers in some years, but the changes are relatively small.
Sample Mean and Standard Deviation of Key Independent Variables, by Student Race and Gender.
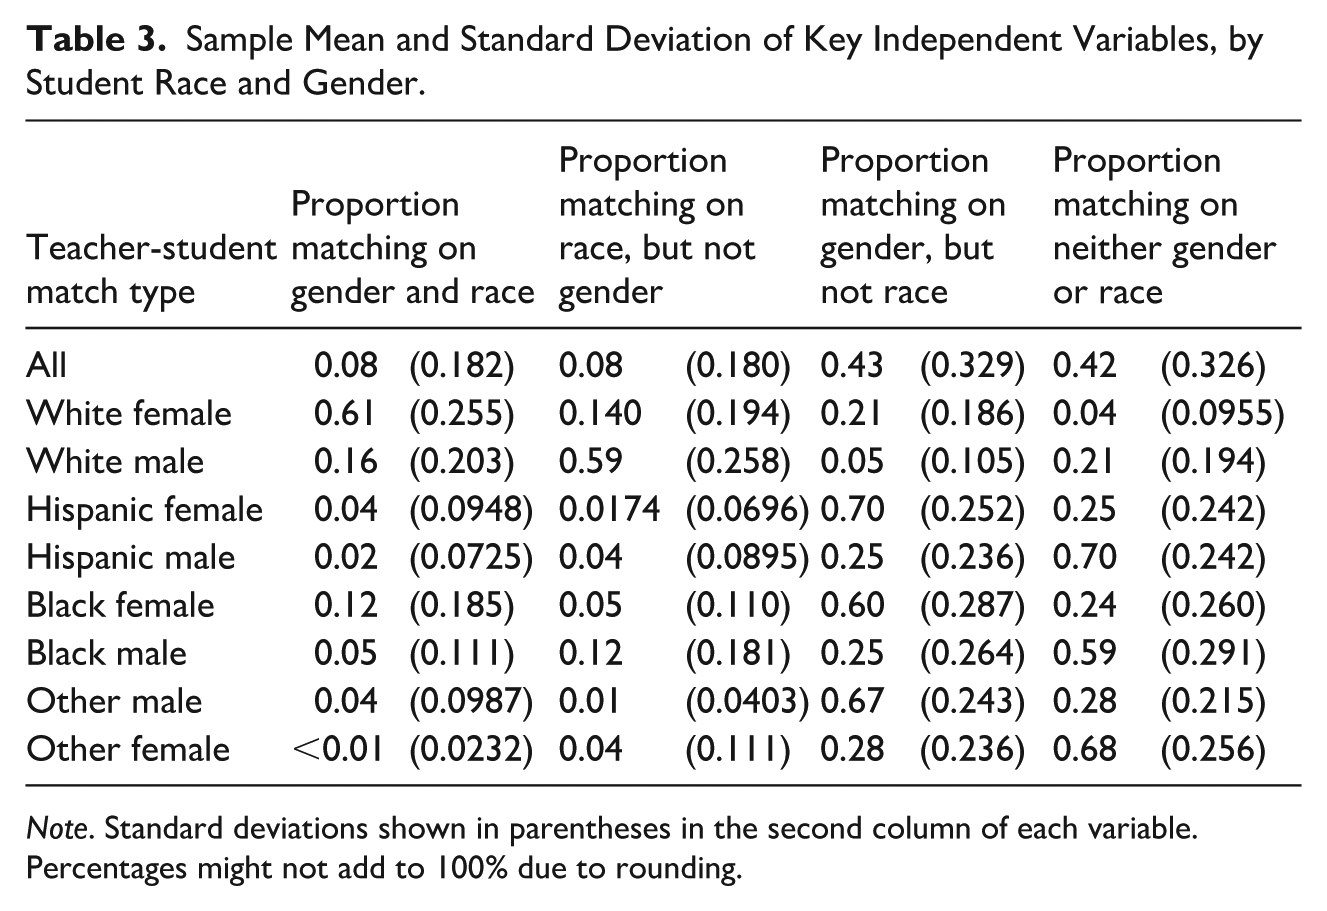
Note. Standard deviations shown in parentheses in the second column of each variable. Percentages might not add to 100% due to rounding.
Social-Emotional Survey Measures
We derive our social-emotional data from online and paper surveys to measure social-emotional skills in multiple areas. These surveys were administered to students within their classrooms near the end of the academic year. The survey consisted of four constructs scales: (1) grit, a combination of passion and persistence over an extended period; growth mindset, the belief that one’s intelligence is malleable and can grow with effort; interpersonal self-management, the ability to regulate one’s emotions, thoughts, and behaviors with others; and (4) social awareness, the ability to take the perspective of and empathize with others from diverse backgrounds and cultures, to understand social and ethical norms for behavior, and to recognize family, school, and community resources and supports.
Grit
To measure students’ grit, we used the Short Grit Scale (Farrington, 2013; Duckworth & Quinn, 2009). Students respond to four items (e.g., “I finish whatever I begin”) on a five-point scale ranging from “not like me at all” to “very much like me.” The overall grit score is calculated using the average score for these four items, which has an alpha of 0.76.
Growth Mindset (GM)
To measure students’ growth mindset, we used the Implicit Theories of Intelligence Scale (Farrington, 2013; Blackwell, 2007). Students respond to four items (e.g., “challenging myself won’t make me any smarter) on a five-point scale ranging from “not at all true” to “completely true.” The overall growth mindset score is calculated using the average score for these four items, which has an alpha of 0.70.
Interpersonal Self-Management (ISM)
To measure students’ interpersonal self-management, students completed a subset of the Impulsivity Scale for Children (Tsukayama et al., 2013), comprising nine items that measure students’ impulsivity related to behavior, attention, and emotions. We only use the four items related to interpersonal self-management. Items asked students to indicate how often, on a five-point scale ranging from “almost never” to “almost always,” in the past 30 days, they exhibited a specific set of behaviors. Four items assessed interpersonal self-control (e.g., “I interrupted other students while they were talking”). The overall interpersonal self-management score is calculated using the average score for these four items, which has an alpha of 0.79.
Social Awareness (SA)
We adapted from the AIR and CASEL (2013) student self-reports of social and emotional competencies to measure students’ social awareness. Students respond to eight items based upon their experiences during the last school year (e.g., “I listened carefully to other people’s points of view”) on a five-point scale ranging from “almost never” to “almost all the time.” The first two constructs represent our intrapersonal measures, while the second two represent our interpersonal ones. A validation study using our survey measures, except grit, found the measures to have high structural validity and reliability (Meyer et al., 2018). We calculated their overall social awareness score by averaging these eight items, with an alpha of 0.86.
Empirical Strategy
We use a student-fixed effects strategy to understand the relationship between teacher-student demographic matching and social-emotional, academic, and behavioral outcomes. Lindsay and Hart (2017) note that using a simple regression approach to estimate matching effects could result in biased estimates due to unobserved factors, such as Black students disproportionately matching to Black teachers. Like their work and others in the race and gender matching literature, we leverage the fact that the proportion of demographically matching (or non-matching) teachers a student experiences varies across years (Egalite & Kisida, 2018; Hwang et al., 2024). For example, in year t, a student might have two of four (50%) teachers share their race, while in year t + 1, that student might have one of four (25%) teachers share their race. We use student-fixed effects to compare the students’ self-reports, observed test scores, and behavior over time, predicted by these changing teacher-student demographic matching rates. Using these models controls students’ time-invariant qualities like persistent traits or ability. The model specification is the following:

Yigst represents student i’s outcome, in grade g in school s in period t. The predictors of interest
The coefficients in our model represent a 100% change in the proportion of matching, which is not practical in our context. The within-student standard deviation is 0.10 for matching race and gender and race, but not gender in our sample. As such, we divide each of the estimates by 10 to understand a 10-percentage point change in the fraction of demographic matching, which is also about a standard deviation increase in the coefficient.
Results
Social-Emotional Outcomes
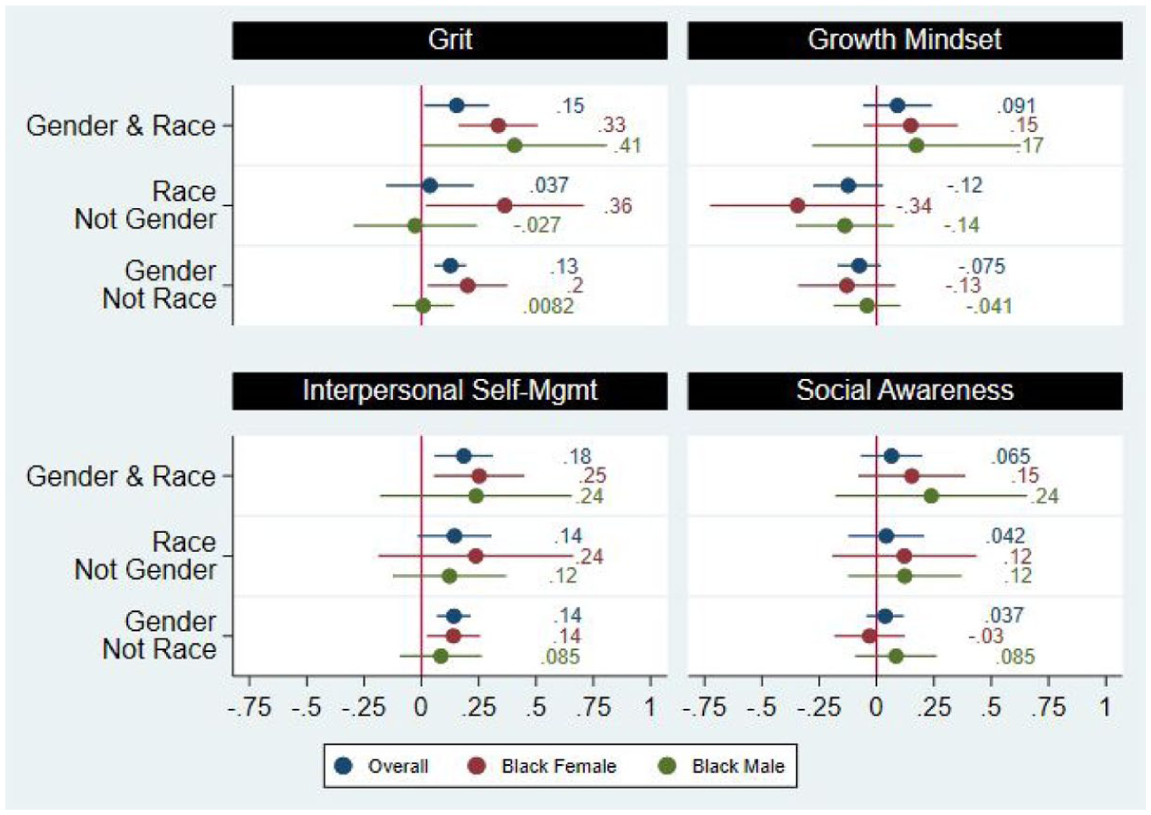
We first examine how the proportion of teacher-student race and gender matching is associated with the social-emotional learning outcomes: grit, growth mindset (GM), interpersonal self-management (ISM), and social awareness (SA). Figure 1 reports the outcome and the coefficients of interest, proportion matching on gender and race, matching on race but not gender, matching on gender but not race, and each estimate’s 95% confidence intervals. In Figure 1, for each dot position and color, the coefficients on the y-axis are from the same regression (i.e., each position and color dot pair are different coefficients from the same regression). The top blue dots report the overall effect, the middle red dot reports results for Black female students, and the bottom green dots report results for Black male students. Supplemental Appendix Table A1 provides the coefficients and standard errors for each outcome. Supplemental Appendix Table A2 provides the coefficients by student race and gender. In all cases, the model comparison group is when students do not match the race or gender of their teacher.
Social-emotional outcomes.
For every social-emotional outcome, when students match both their teachers’ gender and race, the effect is positive, though it cannot always be differentiated from zero. When more teachers match a student’s gender and race, students rate themselves higher on grit and interpersonal self-management. A 10-percentage point increase in the proportion of students matching their teachers’ gender and race increases grit and ISM by 0.015 and .018 standard deviation units, respectively. In our sample, across all students and grades, students tend to decline about 0.03 standard deviations each year in grit, for example. Thus, the magnitude of these effects is meaningful, equaling more than 50% of a year’s change during middle school. The effect on ISM is also practically large. These effects are significant at the 0.05 and 0.01 levels, respectively.
These overall effects mask differential benefits for specific groups of students. As shown in Figure 1, the positive effects on grit and ISM are driven by large and statistically significant effects for Black female students, as shown by the middle red dots. The effects for Black male students are also large in magnitude but only significant at the 0.05 level for grit or ISM, as shown by the bottom green dots.
In addition, when students experience more gender matching, the coefficients are positive for all the socio-emotional measures besides GM. In Figure 1, the blue dots (representing overall effects) show that when a higher proportion of a student’s teachers match their gender but not their race, students rate themselves higher on grit and ISM. These effects also appear to be mainly driven by Black female students. Black female students rate their grit and ISM higher when they match with more teachers who share their gender, but not their race. While the coefficients are positive for almost all our measures, GM has negative and insignificant coefficients for students matching their teachers on race, but not gender, and gender, but not race. However, the confidence intervals on these estimates are quite large and include some significant positive effects. Also, GM had the lowest levels of internal consistency of all our measures, so the fact that the estimates are less precise than the others is consistent with measurement error issues. Overall, we find significant improvements in grit and ISM, with some of the most significant benefits for Black females.
Academic and Behavioral Outcomes
We examine how the proportion of teacher-student demographic matching is associated with academic and behavioral outcomes: ELA test scores, Math test scores, log number of days absent, and log number of days suspended. These results use the full administrative data sample to compare the estimates to the prior literature. In Figure 2, for each dot position and color, the coefficients on the y-axis are from the same regression (i.e., each position and color dot pair are different coefficients from the same regression). The top blue dots report the overall effect, the middle red dot reports results for Black female students, and the bottom green dots report results for Black male students. The top panel of Figure 2 reports the outcome coefficients for math and ELA standardized test scores. Supplemental Appendix Table A3 provides the coefficients and standard errors for each outcome. Supplemental Appendix Table A4 provides the coefficients by student race and gender. These results are small and insignificant at 0.05 when students match their teachers’ race and gender. This is consistent with prior empirical work (Dee, 2004; Goldhaber & Hansen, 2010; Egalite et al., 2015), but because our sample is much smaller, the confidence intervals include zero. Thus, we may have insufficient power to detect the relatively small effects identified in prior work (Dee, 2004; Goldhaber & Hansen, 2010; Egalite et al., 2015; Blazar, 2021; Blazar & Lagos, 2021).
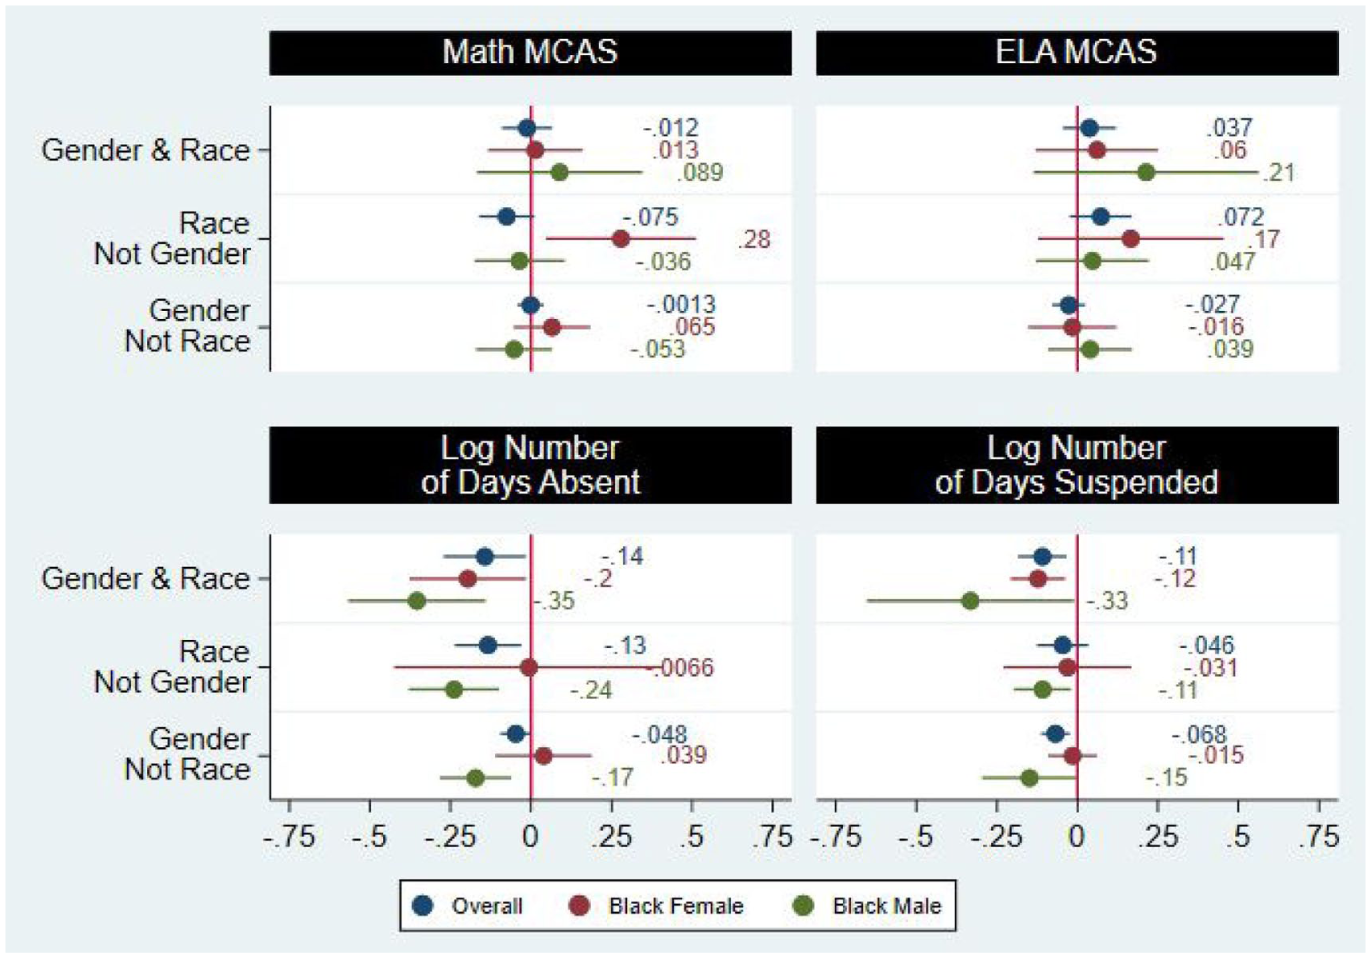
Academic and behavioral outcomes.
An exception to these overall patterns is the large and statistically significant effect for Black females taught by Black male teachers, seen in Figure 2 and Supplemental Appendix Table A3. In this case, for these students, a 10-percentage-point increase in the proportion of Black male teachers increases Math test scores by 0.03 standard deviation units. This effect aligns with Goldhaber and Hansen (2010) and is larger than Egalite et al. (2015).
Based on prior work (West et al., 2020), if teacher-student demographic matching operates more through social-emotional learning, we would expect more significant effects for behavioral outcomes like absences and suspensions, which tend to be more strongly related to social-emotional measures. The bottom two panels of Figure 2 show that, particularly for students who match their teachers’ race and gender, there are large and significant effects from matching for the number of absences and suspensions. These effects are driven by a large and significant impact for Black males and females. For Black female students, a 10-percentage-point increase in Black female teachers reduces their absences for the year by approximately 2.0%. These effects are larger than those found by Holt and Gershenson (2019) and Gottfried et al. (2022). We also find significant and large effects for Black males and females that match their teachers’ race and gender, similar to other studies (Lindsay & Hart, 2017; Shirrell et al., 2021).
Additional Results
White and Latinx Students Results
As discussed earlier, while there is a high match rate for white students, the number of white students is relatively small in these schools. Similarly, while there is a high proportion of Latinx students, there are few Latinx teachers, which yields a low match rate. Thus, we exclude them for parsimony in our figures due to the large confidence intervals. However, we report these coefficients and standard errors in Supplemental Appendix Table A2 for social-emotional outcomes, even though none are statistically significant. Any results should be interpreted cautiously because of the confidence intervals. These results show that Latinx students improve their self-reported grit and ISM when taught by a Latinx teacher of the same gender. Few papers report results for Latinx teachers and students, given insufficient sample sizes and match rates for Latinx students and teachers.
We report academic and behavioral outcomes results for Latinx and White male and female students in Supplemental Appendix Table A3. These results show that Latinx female students reduce their absences when taught by a Latinx female teacher. When taught by a Latinx male teacher, Latinx male students improve their math and ELA scores, but the results are not statistically significant. When taught by white male or female teachers, white male students have reduced math and ELA test scores.
Additional Academic and Behavioral Results
We limit the academic and behavioral outcomes sample to those in the survey sample in Supplemental Appendix Tables A4 and A5. The academic and behavioral effects are larger in the full administrative data sample. These results suggest that the students who tend to perform worse on test scores and have more behavioral incidents, as shown in Table 1, tend to benefit more from teacher-student demographic matching. Since absences and suspensions are strongly associated with social-emotional measures, we believe this provides evidence that our social-emotional results are underestimated relative to a larger sample in which all students completed the surveys.
As noted, the mean number of students’ classes when all teachers are included is eight, relative to a mean of four teachers when we include only core subjects. We include an analysis with a broader range of subjects since social-emotional development is not definitively confined to these core academic subjects, given the anecdotes of thoughtful physical education teachers or inspirational music teachers. In Supplemental Appendix Figures A1 and A2, we explore the academic and behavioral outcomes when we allow potential matching for all teachers regardless of how much time is spent with the student (e.g., art teachers, physical education). While qualitatively similar, including more teachers tends to increase the magnitude of effect sizes for Black females and reduce them for Black males. However, we find no statistically different effects when we use broader or narrower inclusion criteria for what courses are included.
Assessing Selection into Matching
As a robustness check for the student fixed effect models, we test whether matching on the entry grade, 5th grade, predicts future matching. This could indicate positive selection where students or schools observe a positive effect of matching and then attempt to match these students in subsequent years. Similarly, students excluded from our model, because there is only 1 year of data, could bias our results because students for whom matching is not beneficial might be more likely to leave. We show these results in Supplemental Appendix Table A12 for Black female students and observe little evidence of potential bias beyond black female students matching with black male teachers in 6th grade. Thus, these coefficients should be interpreted with some caution.
Alternative Modeling Specifications
We model the linear and quadratic versions of the main predictors and present the quadratic results in the Supplemental Appendix Tables A6, A7, and A8. We find little evidence of a consistent non-linear relationship and report the linear effects in the main paper. While there is evidence that ELA test scores for some groups could be non-linear, these seem less systematic and, as such, present the linear results.
Lastly, because we present multiple outcomes, we also test our confirmatory results for the sensitivity of false discoveries using the Benjamini-Hochberg procedure with a false discovery rate (FDR) set to 0.10 and provide this correction in Supplemental Appendix Table 13 (Benjamini & Hochberg, 1995). All results remain significant even after applying the multiple hypothesis correction to account for the number of student outcomes compared.
Discussion and Conclusion
Using a unique longitudinal dataset, we estimate a student-fixed effects model that identifies the effects of increasing the proportion of teacher-student demographic matching on social-emotional survey and administrative data outcomes in high-expectation charter middle schools. We find large effects on inter- and intrapersonal measures when students are exposed to a one-standard-deviation increase in the proportion of matching, or about 10 percentage points in our sample. Furthermore, there is evidence that increasing the matching of students’ race and gender reduces the number of absences by approximately 1.4% and suspensions by 1.1%.
Our work builds upon the conceptualizations of role model and cultural congruence effects, documented relationships between social-emotional measures and behavioral outcomes, and findings in the racial matching literature that teacher-student racial matching improves behavioral outcomes. Black female students drive the social-emotional effects, while Black male and female students drive the absences and suspensions effects. Our effects suggest that a one standard deviation increase in the proportion of Black teachers matching Black students’ gender would reduce the number of absences by between 2% and 3.5% and suspensions by 1.2% to 3.3%. These are larger in magnitude than Holt and Gershenson (2019) and Gottfried et al. (2022), which focus on elementary and high school students, respectively. These larger effects could be attributable to the fact that middle school is a period of intense self-discovery, including students’ perceptions of racial and gender identity.
Furthermore, while teacher-student demographic matching could operate by teachers setting higher expectations for these students, high expectations are ubiquitous in our schools. This study’s context suggests that teachers’ ability to connect with students leads to these effects beyond the school’s culture. We find similar size effects for Black female students matched to Black male teachers on math standardized tests as in prior work, though prior work focuses on race matching alone and not race and gender (Goldhaber & Hansen, 2010; Egalite et al., 2015). Our more precise and larger effects on absences, which are more in the control of students and their families than suspensions, suggest that a first-order effect of teacher-student gender and racial matching could be students’ connectedness and engagement with the school.
In addition, our work expands upon findings in both the teacher-student gender and racial-matching literature by moving beyond academic and behavioral outcomes to social-emotional outcomes. We find strong and consistent positive effects on grit. We also expand upon more common intrapersonal measures to assess if teacher-student matching improves how students interact with each other. Our ISM measure relates to classroom behavior, whereas social awareness is a broader measure of empathy. Because we more precisely estimate positive effects on ISM, it suggests that teacher-student matching could affect how students rate their respect for fellow students in the classroom by interrupting them less, for example. These significant and positive results on the student self-reports of grit and ISM, in combination with the behavioral results, suggest that racial matching improves both self-reports of social-emotional measures and administrative behavioral outcomes.
These results are important for three reasons. First, we find a significant reduction in absences and suspensions for Black students who match their teachers’ race and gender. Prior research shows that increased absenteeism causes lower achievement (Gershenson et al., 2017; Goodman, 2014; Gottfried, 2011; Gottfried & Kirksey, 2017). An immediate effect of diversifying the teacher workforce could be creating greater student connectedness to school. Second, and relatedly, our work broadens the understanding of how teacher-student demographic matching affects specific student competencies. In our sample schools, demographic matching improves personal motivation and how students interact. These types of skills are becoming more important in our economy (Deming, 2017), and if these effects persist, as has been found in Gershenson et al. (2022) and Blazar (2021), they could provide significant long-term benefits. Middle school is a particularly tumultuous period for students. It is when self-management and social awareness tend to decline for all students (West et al., 2020), so identifying interventions that assist during this time could be helpful. Third, we build on prior evidence (Gershenson et al., 2022) that there are benefits to matching beyond skills that can be trained, like teachers setting high expectations for students. While our results align with other papers exploring behavioral outcomes, the context of our results is in schools with prior evidence of increasing college enrollment through high expectations of students (Angrist et al., 2013). In addition, our models include estimates for both the proportion of similar demographic teachers for the core subjects and all full-time teachers, including non-core subjects. These two results reaffirm the value of continuing to diversify the teacher workforce and that these benefits might not only need to be from traditional ELA and math teachers, which have been explored more thoroughly in the past.
These results suggest interesting future testable assumptions. For example, researchers could test whether community group members or tutors also play an essential mentorship role. Emerging evidence suggests that exposure to a more diverse professional staff could benefit student outcomes (Blazar, 2024; Blazar & Lagos, 2021). While we do not argue that these individuals should be a substitute for the continued effort to diversify the teaching workforce, the labor market has been slow to change, and these individuals could potentially provide short-run policy solutions to improve student outcomes.
A few limitations apply to this work. First, compared to prior evidence, we have a relatively smaller sample size and focus on a specific set of charter schools that are historically effective at increasing academic achievement and college enrollment (Angrist et al., 2013). These differences potentially limit the generalizability of our findings, and it could be helpful for others to replicate our work in other locations and types of schools. Second, it could be that the positive social-emotional effects we observe are not the effect of race/gender matching but indicate separate differences in teacher quality. However, estimating social-emotional value-added for a particular teacher could incorrectly attribute social-emotional growth to that teacher (Backes et al., 2024). Furthermore, social-emotional value-added is still in its infancy, and preliminary work has found the estimates to be less stable than test scores (Loeb et al., 2019) and often are not correlated with test score value-added (Backes et al., 2024; Jackson, 2018). Third, while the demographic matching literature has grown over the last couple of decades, it often relies on quasi-experimental methods using large secondary datasets, with the notable exception of Dee (2004), Antecol et al. (2015), and Blazar (2021), who use experimental data. Future research could complement our quasi-experimental findings using experimental data in multiple locations and with varied school types.
Supplemental Material
sj-docx-1-epx-10.1177_08959048251382132 – Supplemental material for The Effects of Teacher-Student Demographic Matching on Social-Emotional Learning
Supplemental material, sj-docx-1-epx-10.1177_08959048251382132 for The Effects of Teacher-Student Demographic Matching on Social-Emotional Learning by Christopher Cleveland and Ethan Scherer in Educational Policy
Footnotes
Acknowledgements
The authors equally contributed to the paper. The authors are thankful for feedback and advice from Martin West, excellent research assistance from Rebecca Ivester, feedback from Johanna Tvedt, and conference participants at AEFP and APPAM. We thank the Walton Family Foundation for financial support, the Massachusetts Department of Elementary and Secondary Education, and each of the charter management organizations for providing the administrative data for this work. Any errors of fact or interpretation are our own.
Funding
The authors disclosed receipt of the following financial support for the research, authorship, and/or publication of this article: The Walton Family Foundation. The research reported here was supported, in whole or in part, by the Institute of Education Sciences, U.S. Department of Education, through grant R305B150010 to Harvard University. The opinions expressed are those of the authors and do not represent the views of the Walton Family Foundation or Institute or the U.S. Department of Education.
Declaration of Conflicting Interests
The authors declared no potential conflicts of interest with respect to the research, authorship, and/or publication of this article.
Supplemental Material
Supplemental material for this article is available online.
Author Biographies
References
Supplementary Material
Please find the following supplemental material available below.
For Open Access articles published under a Creative Commons License, all supplemental material carries the same license as the article it is associated with.
For non-Open Access articles published, all supplemental material carries a non-exclusive license, and permission requests for re-use of supplemental material or any part of supplemental material shall be sent directly to the copyright owner as specified in the copyright notice associated with the article.