
Abstract
A substantial number of U.S. students experience homelessness, yet our understanding of how homelessness shapes student outcomes is limited. We use 7 years of longitudinal data on Indiana students in kindergarten through eighth grade, including more than 40,000 students who experienced homelessness, to examine the associations between homelessness and academic and behavioral outcomes. Our data indicate that Black and low-income students are more likely to experience homelessness and for longer periods. Student fixed-effects models indicate that cumulative years of homelessness are associated with lower math and ELA achievement, as well as increased disciplinary incidents and absences. These associations are particularly pronounced for male, White, and middle school students, suggesting that in the context of homelessness, being male, White, and in older grades may function as risk factors for more adverse outcomes. Together, our findings underscore heterogeneous links between homelessness and adverse outcomes across student subgroups.
Introduction
Many U.S. students experience homelessness. In the 2021 to 2022 school year, 1 in 50 students was identified as homeless (National Center for Homeless Education [NCHE], 2023). However, this figure likely underestimates the true prevalence due to challenges in tracking highly mobile youth (Cutuli et al., 2024). Homelessness disrupts multiple aspects of students’ lives and is associated with poor physical health, academic struggles, and behavioral challenges (Buckner, 2008; Coker et al., 2009; Masten et al., 1993). Identifying and supporting these students is therefore a critical priority.
A major federal policy addressing student homelessness is the McKinney-Vento Homeless Assistance Act, which requires schools to identify and support students experiencing housing instability (McKinney-Vento Act, 2015). The Department of Education defines homelessness more broadly under this Act than the Department of Housing and Urban Development, extending eligibility to students living “doubled-up” with other families or individuals (Cutuli et al., 2020). This broader definition acknowledges diverse forms of unstable housing and seeks to ensure more comprehensive support.
Despite the substantial prevalence of student homelessness, our understanding of this vulnerable population remains limited. Estimating the associations between homelessness and student outcomes is challenging because students who experience homelessness differ systematically from those who do not, making it difficult to identify suitable comparison groups. Although some studies account for these differences (Cowen, 2017; Dhaliwal, 2025; Richards & Pavlakis, 2022), they primarily examine average associations, offering limited insight into which students are especially vulnerable to the consequences of homelessness.
To address this gap, we use longitudinal administrative data from Indiana, spanning kindergarten through eighth grade, to investigate the relationships between homelessness and student outcomes. Using student fixed effects, we examine the associations between experiencing homelessness and academic achievement in math and English Language Arts (ELA). Given that homelessness likely influences more than just academic performance, we also examine non-academic domains, such as school discipline and attendance. 1 Our analyses focus on both concurrent and cumulative associations between homelessness and student outcomes. We further investigate whether these associations vary across student subgroups, including gender, race/ethnicity, and school level. We address the following research questions:
Which student characteristics, such as race/ethnicity, Free or Reduced Lunch (FRL) eligibility, English Language Learner (ELL) status, and Individualized Education Programs (IEP) status, are associated with elevated risks of homelessness?
What are the concurrent and cumulative associations between homelessness and student outcomes (i.e., math and ELA achievement, school disciplinary incidents, and attendance)?
Do the associations between homelessness and student outcomes vary by student gender, race/ethnicity, or school level?
McKinney-Vento Act and Student Homelessness
The McKinney-Vento Homeless Assistance Act of 1987, most recently reauthorized under the Every Student Succeeds Act (ESSA) in 2015, ensures that students experiencing homelessness have equal access to free and appropriate public education (McKinney-Vento Act, 2015). The Act defines students experiencing homelessness as those who “lack a fixed, regular, and adequate nighttime residence,” including those living doubled-up with other households, in hotels, motels, trailers, shelters, or in places not intended for regular sleeping (McKinney-Vento Act, 2015). Once identified, school districts must provide immediate and ongoing support. Funding for the program grew from $65 million in 2015 to $114 million in 2022 (ED Data Express, n.d). The U.S. Department of Education allocated nearly $600 million in 2023 through the American Rescue Plan’s Homeless Children and Youth program to support students affected by homelessness and housing insecurity during the COVID-19 pandemic (U.S. Department of Education, 2023).
Student homelessness is a significant issue in the United States. During the 2021–2022 school year, over 1.2 million students experienced homelessness (NCHE, 2023). Although rates vary across states, every state serves students facing homelessness at all grade levels. Between 2004–2005 and 2021–2022, student homelessness increased by 79% (NCHE, 2023). These counts likely underestimate the magnitude of homelessness due to challenges in identifying students experiencing homelessness. A study using data from an urban district shows that alternative identification strategies yield estimates 34% to 454% higher than formal counts (Cutuli et al., 2024). Additionally, the COVID-19 pandemic disrupted data collection and reporting (ED Data Express, n.d) 2 and fundamentally altered school and community practices related to identifying students experiencing homelessness (Pavlakis et al., 2021).
Rates of homelessness vary significantly across student subgroups (Miller, 2011). Black and Hispanic students have disproportionately higher rates of homelessness (Aviles de Bradley, 2015a, 2015b; Burns et al., 2021; Herbers et al., 2012; Howland et al., 2017). Students eligible for IEP and ELL services are overrepresented among those identified as homeless (Burns et al., 2021; Cutuli et al., 2013; Herbers et al., 2012). Students from low-income families are also more likely to be homeless (Buckner, 2008; Cowen, 2017; Miller, 2011), and those who experience homelessness often attend high-poverty schools (Burns et al., 2021; Dhaliwal et al., 2021).
Homelessness has been linked to a range of issues, including mental health (Bassuk et al., 2015; Gutwinski et al., 2021), drug overdose (Fine et al., 2022), and the opioid epidemic (Evangelist & Shaefer, 2020). Housing shortages drive much of this homelessness (Colburn & Aldern, 2022; Desmond, 2022; Horowitz et al., 2023), as rising rents and the limited supply of affordable units are especially strong predictors of homelessness (Desmond, 2022; Doran et al., 2022).
Homelessness and Student Outcomes
Experiencing homelessness is associated with a broad array of unfavorable student experiences and outcomes. The Continuum of Risk framework helps explain the relationship between homelessness and student outcomes by emphasizing how risks accumulate and shape students’ development across contexts (Masten et al., 1993). Within this framework, homelessness entails three types of risk factors (Buckner, 2008): (1) risks associated with homelessness itself (e.g., the stress of lacking a stable home), (2) risks associated with poverty (e.g., limited family resources), and (3) risks that all children may face (e.g., biological factors). Compared with students from stably housed, more affluent families, students experiencing homelessness are often exposed to all three types of risk simultaneously—frequently in ways that are racialized and gendered—placing them higher on the continuum of cumulative risk. Because risk exposure accumulates over time, repeated or prolonged experiences of homelessness may lead to more pronounced adverse outcomes.
The Continuum of Risk framework suggests that the effects of experiencing homelessness on student outcomes may vary across subgroups, as different groups face distinct baseline levels and types of risk (Buckner, 2008; Masten et al., 1993). Because structural disadvantage is unevenly distributed across racial/ethnic groups, the consequences of homelessness may not be uniform. For example, Black students may face heightened risks of school discipline during periods of homelessness due to racialized behavioral expectations and differential treatment (Barrett et al., 2021; Liu et al., 2023). Conversely, the relative adverse effects of homelessness may appear larger for White students if homelessness represents a more pronounced disruption from prior stability or advantage.
Aligned with the Continuum of Risk framework, evidence shows that students experiencing homelessness face multiple risks and disadvantages. Experiencing homelessness is associated with chronic medical conditions (Buckner, 2008; Masten et al., 1993), higher absenteeism (De Gregorio et al., 2022; Richards & Pavlakis, 2022), and elevated disruptive behavior (Masten et al., 1993). Student homelessness is also associated with academic challenges, such as poor early literacy skills (Herbers et al., 2012) and lower math and reading achievement (Cutuli et al., 2013; Obradović et al., 2009; Rafferty et al., 2004). Students experiencing homelessness face multiple risk factors, but the extent to which homelessness itself directly contributes to adverse outcomes remains unclear. Although studies apply propensity score methods (PSM), including inverse probability weights and coarsened exact matching techniques, to reduce selection bias (De Gregorio et al., 2022; Richards & Pavlakis, 2022), PSM cannot fully account for unobserved confounding, including time-invariant differences between students (Caliendo & Kopeinig, 2008; Reiffel, 2020).
To control for both observable and unobservable time-invariant differences, some researchers use student fixed effects (Cowen, 2017; Richards & Pavlakis, 2022). Cowen (2017) finds that homelessness is linked with lower math and reading achievement in student fixed effects models, yet these differences disappear after controlling for student mobility. Richards and Pavlakis (2022) find that student homelessness is associated with lower attendance even with student fixed effects. Extending this work, Dhaliwal (2025) shows that student homelessness is associated with lower attendance and math and ELA achievement in fixed effects models and further finds that school and neighborhood resources can serve as protective factors for students experiencing homelessness.
Contribution of This Study
Our study makes three main contributions to the literature on student homelessness, using student fixed effects. First, we examine both concurrent and cumulative associations between homelessness and student outcomes, given that homelessness can be a significant student experience with lasting effects (Cobb-Clark & Zhu, 2017). Second, we explore whether these associations vary across student characteristics—such as gender and race/ethnicity—and by school level, comparing elementary and middle school students, because the impact of disruptive residential experiences may differ across developmental stages (Chetty, Hendren, & Katz, 2016). Finally, leveraging data from Indiana, we analyze both academic and non-academic outcomes simultaneously, providing a more comprehensive analysis of how homelessness relates to student outcomes.
Method
Data
We use longitudinal administrative data from the Indiana Department of Education (IDOE) covering kindergarten through eighth-grade students from 2010–2011 to 2016–2017. Indiana provides a valuable context for studying student homelessness as a Rust Belt state that has experienced long-term economic restructuring following the decline of manufacturing, making it relevant to many postindustrial regions in the United States. Following the federal McKinney-Vento Act, Indiana schools identify students experiencing homelessness through local liaisons and report this information in state administrative data (Indiana Department of Education [IDOE], 2021). To support consistent identification, the IDOE provides guidance and resources through its McKinney-Vento program to help local liaisons document students experiencing homelessness. Although implementation may vary across districts, Indiana’s procedures align with federal guidelines, enhancing the external relevance of our findings.
The prevalence of students identified as experiencing homelessness in Indiana (1.6%) was below the national average (2.4%) in 2021 to 2022 (NCHE, 2023), yet housing instability remains a significant concern. In 2022 to 2023, approximately 18,700 Indiana students were identified as experiencing homelessness—a roughly 15% increase since 2018 to 2019 (Brightlane Learning, 2024). 3 Consistent with national McKinney-Vento patterns, most identified students were doubled-up, making housing instability less visible. These students are disproportionately Black and from low-income families, highlighting how housing instability reflects persistent racial/ethnic and socioeconomic inequities.
The IDOE data include student characteristics (e.g., gender, race/ethnicity, FRL eligibility, ELL status, and IEP status), math and ELA achievement scores from the Indiana Statewide Testing for Educational Progress-Plus (ISTEP+), as well as school discipline and attendance records. ISTEP+ is an annual, state-mandated assessment aligned with state standards, covering foundational math and ELA skills, including arithmetic, reading comprehension, and writing. The dataset also provides unique student, classroom, and school identifiers, allowing us to construct variables such as school mobility, school-level poverty, racial/ethnic composition, and teacher characteristics.
The IDOE data also include students’ homeless status and residential context each year. Our data do not include the exact timing of homelessness, so some students may have experienced homelessness after taking the ISTEP+. However, because ISTEP+ is administered in the spring to assess end-of-year learning, it is reasonable to assume that most students experienced homelessness prior to the assessment. For discipline and absences, we use cumulative measures recorded at the end of the school year. Although we cannot identify precise timing, these outcomes largely reflect experiences during the same academic year.
Collecting student homelessness information is required for federal and state reporting across all public schools, including traditional, charter, and schools for the blind and deaf. Students are classified as homeless under the McKinney-Vento Act if they meet the criteria at any point during the school year, including the prior summer. Identification of students experiencing homelessness in Indiana occurs at the school and district level under the McKinney-Vento Homeless Assistance Act. Each local educational agency designates a McKinney-Vento liaison who is responsible for coordinating identification of homelessness status (IDOE, 2022).
Identifying students experiencing homelessness is challenging, and prevalence is likely underestimated. Undercounting occurs in part because the McKinney-Vento Act relies on family and youth disclosure, which can be affected by stigma and reluctance to self-identify (Miller, 2011). These limitations make it difficult to capture the full scope of housing instability, particularly among marginalized populations (Dhaliwal & De Gregorio, 2022; Miller, 2011). Examining the duration of homelessness is therefore critical, as prolonged or repeated episodes can have cumulative effects on academic risk over time (Herbers et al., 2012). Understanding duration also helps inform the strategic allocation of limited McKinney-Vento resources to students experiencing prolonged or repeated instability. In Indiana, identification follows procedures similar to other states, relying on family self-report, housing questionnaires, and liaison professional judgment (IDOE, 2022). These processes may contribute to under-identification due to variation in implementation and reliance on disclosure (Dhaliwal et al., 2021; Miller, 2011).
We measure student homelessness in multiple ways to identify students who experience homelessness more frequently or for longer durations and to examine how both concurrent and cumulative homelessness relate to student outcomes. Appendix Table A1 presents our key measures of student homelessness. Among students experiencing homelessness, 80% are doubled up, 12% are sheltered, 1% are unsheltered, and 7% stay in hotels or motels. These administrative data likely undercount the number of students experiencing homelessness (Cutuli et al., 2024). Nevertheless, linking homelessness to academic and non-academic outcomes provides valuable insight into students’ experiences.
Our analytic dataset includes 996,200 unique students, including 43,003 who experienced homelessness at least once during the study period. Missing data are minimal: about 4% of students lack valid achievement scores due to test opt-outs, and less than 1% are missing demographic information (e.g., gender, race/ethnicity). Given the small proportion of missing data, we applied listwise deletion separately for each outcome, resulting in no more than 4% of cases removed across models. Approximately 4.3% of students experienced homelessness at least once, with 1.6% experiencing it in two or more years. Among students who experienced multiple years of homelessness, 61% were identified as homeless in 2 years, 23% in 3 years, 10% in 4 years, and 6% in 5 or more years.
Table 1 presents descriptive statistics for (1) all students, (2) students who never experienced homelessness, and (3) students who experienced homelessness at least once. Column 1 shows that about half of the students are female and half are male. The majority of students are White (0.704), 4 while a sizable proportion are racial/ethnic minorities: Black (0.122), Hispanic (0.109), Asian (0.021), and other racial/ethnic (0.069) backgrounds. Although White students are overrepresented in our sample compared with the national average, where White students comprised approximately 44% of public school enrollment in fall 2022 (NCES, 2024), about one-third of our sample are students of color. This diversity allows us to examine subgroup differences in experiencing homelessness and the heterogeneous associations between homelessness and student outcomes across racial/ethnic groups.
Descriptive Statistics.
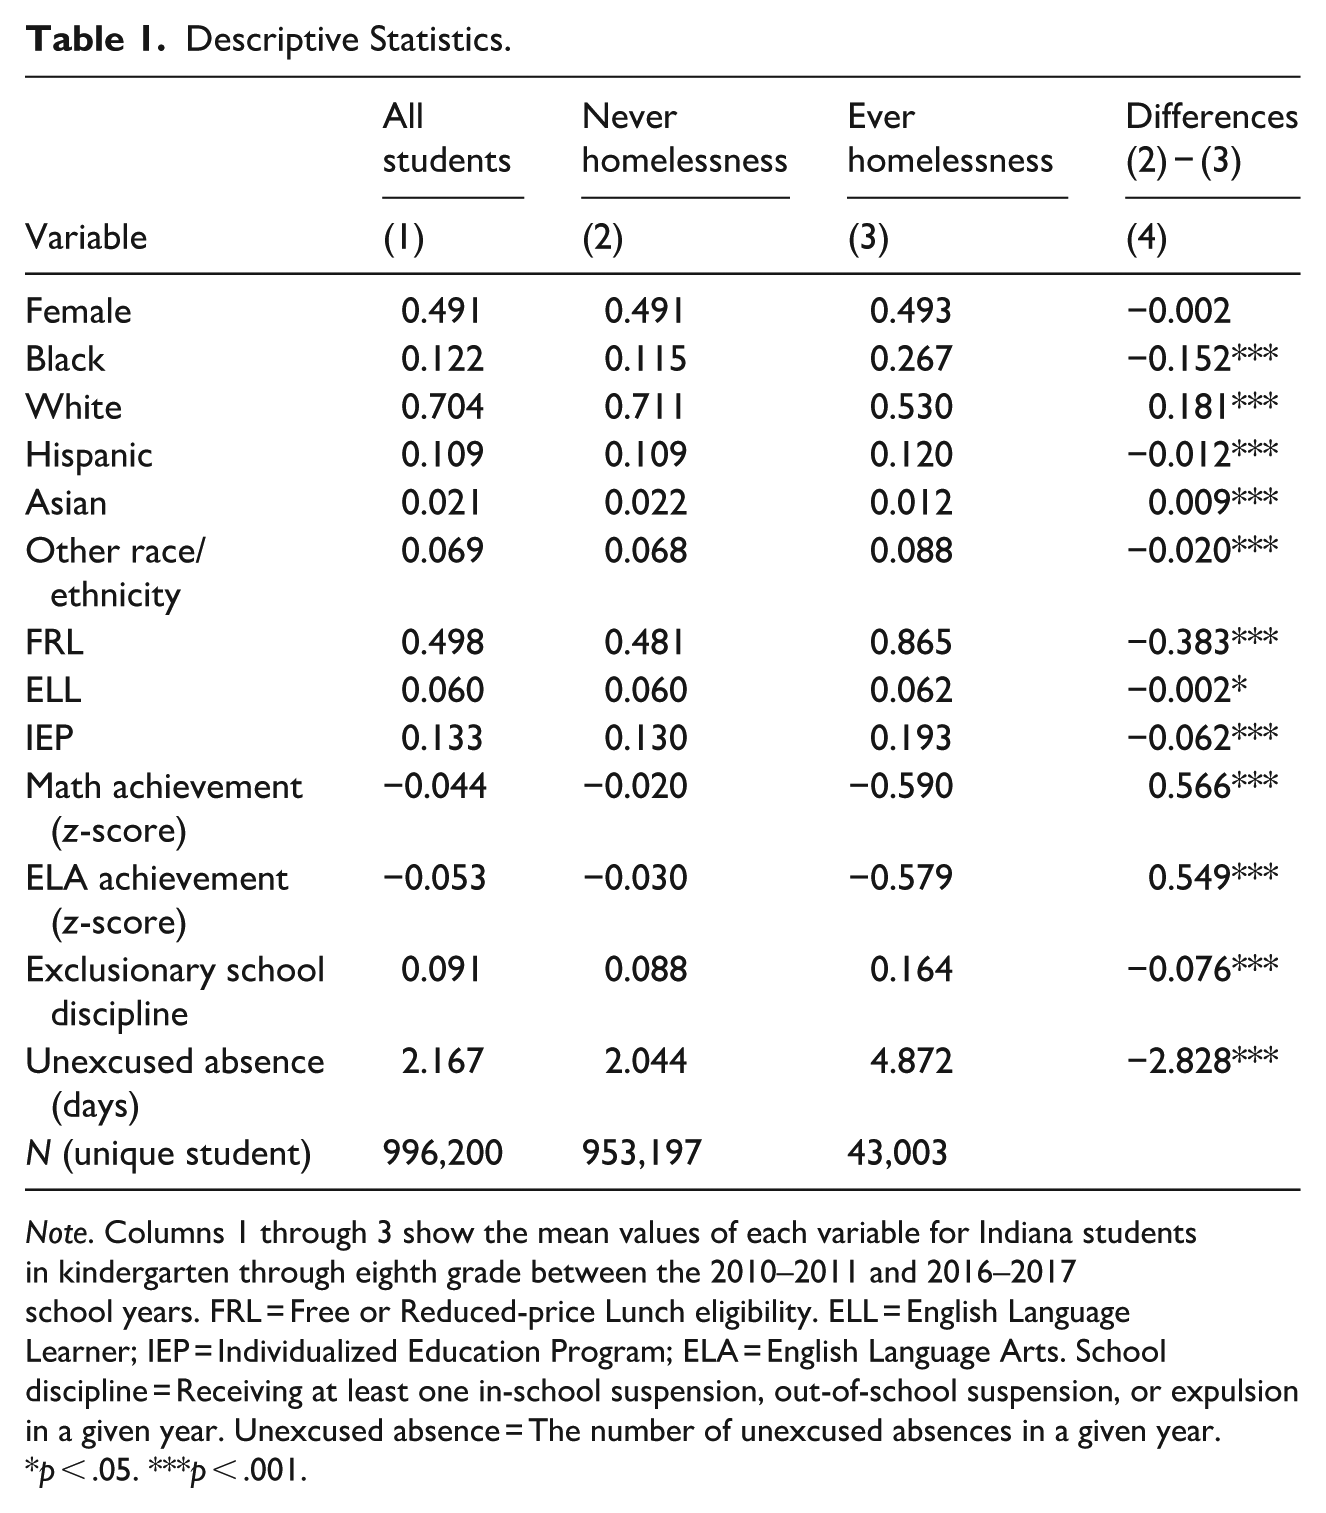
Note. Columns 1 through 3 show the mean values of each variable for Indiana students in kindergarten through eighth grade between the 2010–2011 and 2016–2017 school years. FRL = Free or Reduced-price Lunch eligibility. ELL = English Language Learner; IEP = Individualized Education Program; ELA = English Language Arts. School discipline = Receiving at least one in-school suspension, out-of-school suspension, or expulsion in a given year. Unexcused absence = The number of unexcused absences in a given year.
p < .05. ***p < .001.
About half of students are eligible for FRL. Some students are identified as ELLs (0.060), and some have IEPs (0.133). Column (4) in Table 1 presents the results of a t-test comparing student characteristics between those who have and who have not experienced homelessness. The findings indicate that students from marginalized populations are overrepresented among those experiencing homelessness. For example, Black students and students eligible for FRL are more likely to experience homelessness. 5
In our main student fixed effects models, we measure student homelessness in two ways. First, we create a dichotomous variable indicating whether a student is identified as experiencing homelessness in a given year. This allows us to compare student outcomes during years of homelessness with those in years without homelessness (concurrent association). Second, we create a categorical variable to quantify the total duration of a student’s experience with homelessness (cumulative association), allowing us to investigate the relationship between cumulative experiences of single and multiple years of homelessness and student outcomes. 6
For academic outcomes, we use test scores from the Indiana Statewide Testing for Educational Progress-Plus (ISTEP+). All state-certified schools in Indiana assess students in grades 3 through 8 in math and ELA each spring using ISTEP+, which aligns with state standards. Our achievement models include students who took the test. We standardized math and ELA test scores at the subject-grade-year level to facilitate comparisons across subjects, grades, and years.
For non-academic outcomes, we examine exclusionary discipline and attendance. We measure exclusionary discipline as a dichotomous indicator of whether a student received at least one in-school suspension, out-of-school suspension, or expulsion in a given year. These actions may result from serious infractions (e.g., alcohol, drugs, weapons, fighting) or less severe misconduct (e.g., property damage and disobedience). Disparities in school discipline are well documented, and exclusionary discipline is associated with a range of adverse outcomes, including lower academic achievement and greater involvement with the criminal justice system (e.g., Hwang, 2018; Mowen & Brent, 2016). Importantly, exclusionary discipline does not solely reflect student behavior, as teacher bias and perceptions can shape disciplinary decisions (Barrett et al., 2021; Liu et al., 2023). Using student fixed effects, we compare each student’s disciplinary outcomes during periods of homelessness with those during periods of housing stability. This approach accounts for time-invariant individual differences and clarifies how homelessness relates to disciplinary actions, capturing student behavior, student–teacher interactions, and teacher perceptions.
The attendance outcome is a continuous variable indicating the number of unexcused absences. 7 School attendance can capture key student outcomes, such as engagement, sense of belonging, and academic commitment. Additionally, as control variables, we include indicators for FRL eligibility, ELL status and IEP status as control variables. Each is coded as one if a student is identified as FRL, ELL, or IEP, and zero otherwise.
Analyses
To advance our understanding of student homelessness, we first examine the relationship between student characteristics and homelessness. We use Ordinary Least Squares (OLS) regression to examine which student characteristics are associated with experiencing homelessness. We run bivariate and multivariate analyses to explore the relationship between student characteristics and homelessness with and without controls. Our goal is to descriptively examine how student characteristics are associated with homelessness. 8 Our model specifications are as follows:

In equation 1, Homelessnessi denotes either (a) a dichotomous variable indicating if a student experienced homelessness at least once during our study period or (b) a continuous variable denoting the total number of years of homelessness. Using these two measures of homelessness as dependent variables provides valuable information, as it allows us to distinguish between student characteristics associated with any instance of homelessness (“ever” homelessness) versus those linked to prolonged periods of homelessness.
Next, we examine the relationship between homelessness and student academic and non-academic outcomes. We use student fixed effects to control for all time-invariant characteristics, both observable and unobservable, reducing potential bias. However, this approach does not account for unmeasured time-varying factors, so our estimates may still be biased. This limitation is especially relevant because homelessness often coincides with other adverse family circumstances, such as parental job loss or financial hardship (Evangelist & Shaefer, 2020).
We begin by running models without student fixed effects to compare the outcomes between students with homelessness experience and those without. Specifically, we use two key independent variables to examine the relationship between homelessness and student outcomes: (a) a dichotomous variable indicating whether a student is reported as experiencing homelessness at least once, and (b) a continuous variable indicating the total number of years a student was identified as experiencing homelessness during the study period.
By employing student fixed effects, we control for both observable and unobservable time-invariant differences between students, effectively comparing outcomes during periods of homelessness with those during stable housing for the same individuals. Given that homelessness may have both immediate and long-term effects, we analyze both concurrent and cumulative associations. For concurrent associations, the key independent variable indicates whether a student is reported as homeless in a specific year. For cumulative associations, the key variable represents the total number of years a student has experienced homelessness, regardless of their current homelessness status. Our fixed effects specification is as follows:

In equation 2, Yisgt denotes a student outcome, including math achievement, ELA achievement, school discipline, or days absent, for student i in school s, grade g, and year t. Math and ELA outcomes are continuous variables indicating student math and ELA test scores on ISTEP+. School discipline is a dichotomous variable indicating whether a student received at least one suspension or expulsion in a given year. The absence outcome is a continuous variable indicating the number of unexcused days absent in a given year.
Results
Student Characteristics and Homelessness
Columns 1 and 2 in Table 2 present models with a dichotomous dependent variable indicating whether a student has ever experienced homelessness during the study period. Our bivariate analyses show that certain student subgroups are more likely to experience homelessness (Column 1). For example, Black students are 6.3 percentage points (p < .001) more likely to experience homelessness compared with White students, and students eligible for FRL are 6.6 percentage points (p < .001) more likely to experience homelessness than non-eligible students. Additionally, students with an IEP, lower academic achievement, disciplinary incidents, or more absences are also more likely to experience homelessness at least once. The overall patterns remain consistent, though the estimated associations are smaller in the multivariate models. Some exceptions arise in Column 2: net of other covariates, Hispanic students and ELL students exhibit lower likelihoods of experiencing homelessness than White and non-ELL students, respectively.
Student Characteristics and Homelessness.
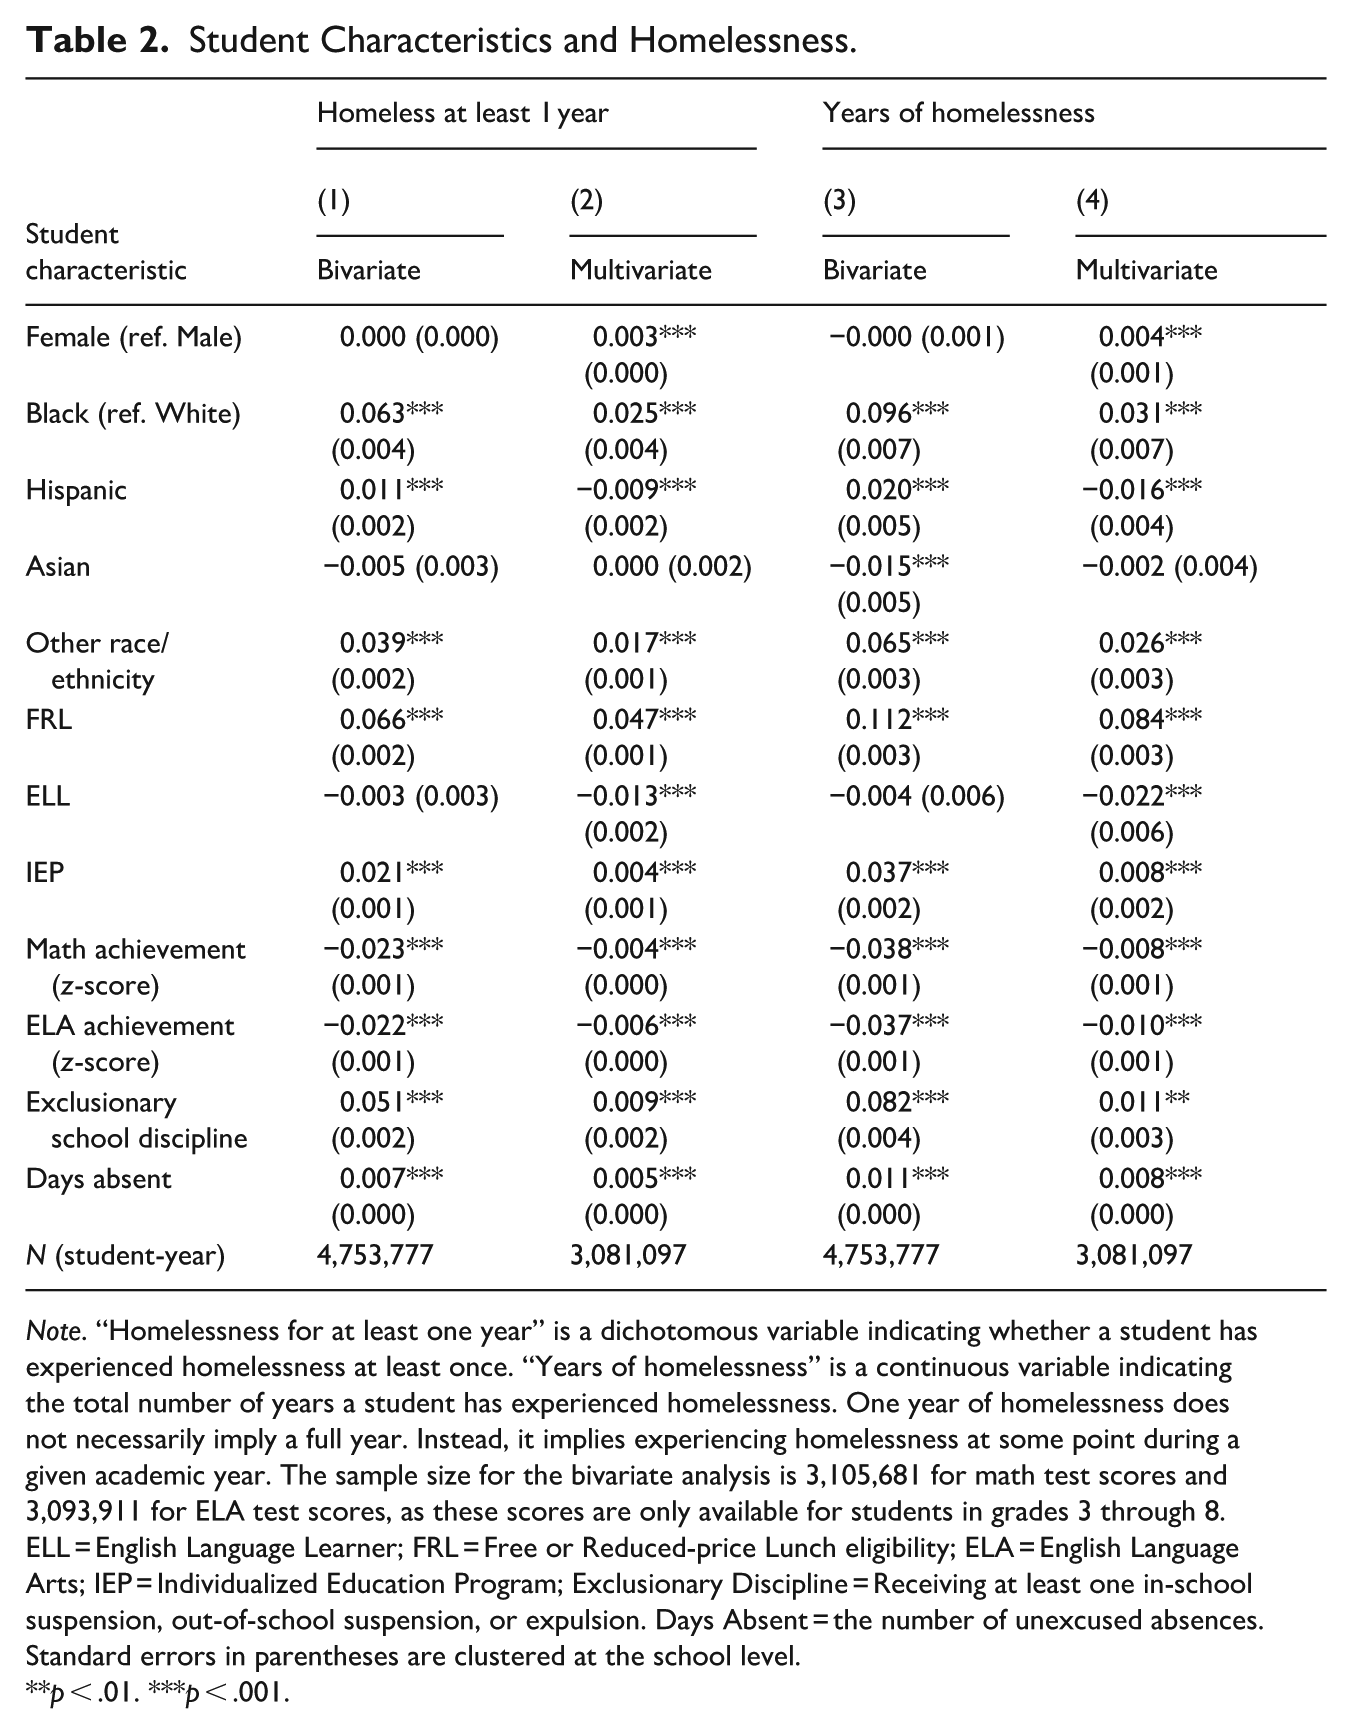
Note. “Homelessness for at least one year” is a dichotomous variable indicating whether a student has experienced homelessness at least once. “Years of homelessness” is a continuous variable indicating the total number of years a student has experienced homelessness. One year of homelessness does not necessarily imply a full year. Instead, it implies experiencing homelessness at some point during a given academic year. The sample size for the bivariate analysis is 3,105,681 for math test scores and 3,093,911 for ELA test scores, as these scores are only available for students in grades 3 through 8. ELL = English Language Learner; FRL = Free or Reduced-price Lunch eligibility; ELA = English Language Arts; IEP = Individualized Education Program; Exclusionary Discipline = Receiving at least one in-school suspension, out-of-school suspension, or expulsion. Days Absent = the number of unexcused absences. Standard errors in parentheses are clustered at the school level.
p < .01. ***p < .001.
Columns 3 and 4 in Table 2 present models with a continuous dependent variable indicating the number of years a student experiences homelessness. Some student subgroups experience homelessness for longer periods. For example, relative to White students, Black students experience 0.096 additional years of homelessness (p < .001), and relative to non-FRL-eligible students, students eligible for FRL experience 0.112 additional years (p < .001).
Relative to non-IEP students, students with an IEP experience more years of homelessness, and relative to students with no disciplinary records, those with prior disciplinary incidents also experience more years of homelessness. Additionally, lower academic achievement and more days absent are associated with more years of homelessness. Most results remain consistent in the multivariate analysis, though the coefficients are smaller. Similar to Column 2, Column 4 shows that Hispanic and ELL students are associated with fewer years of homelessness after controlling for other student characteristics. Overall, these findings highlight a persistent pattern: students from historically underserved populations experience homelessness more frequently and for longer durations than their peers.
Homelessness and Student Outcomes
Table 3 presents our primary findings on the relationship between homelessness and student achievement. Column 1 shows the association between ever experiencing homelessness and math achievement, and Column 2 shows the association between years of homelessness and math achievement. In Column 1, the results indicate that student homelessness is associated with a 0.238 SD (p < .001) lower math achievement after controlling for school, year, and grade fixed effects, as well as student, school, and teacher-level control variables. In Column 2, we find that each additional year of homelessness is associated with a 0.092 SD (p < .001) lower math achievement after controlling for the same variables.
Summary of Results From Regression of Homelessness on Academic Achievement With and Without Student Fixed Effects.
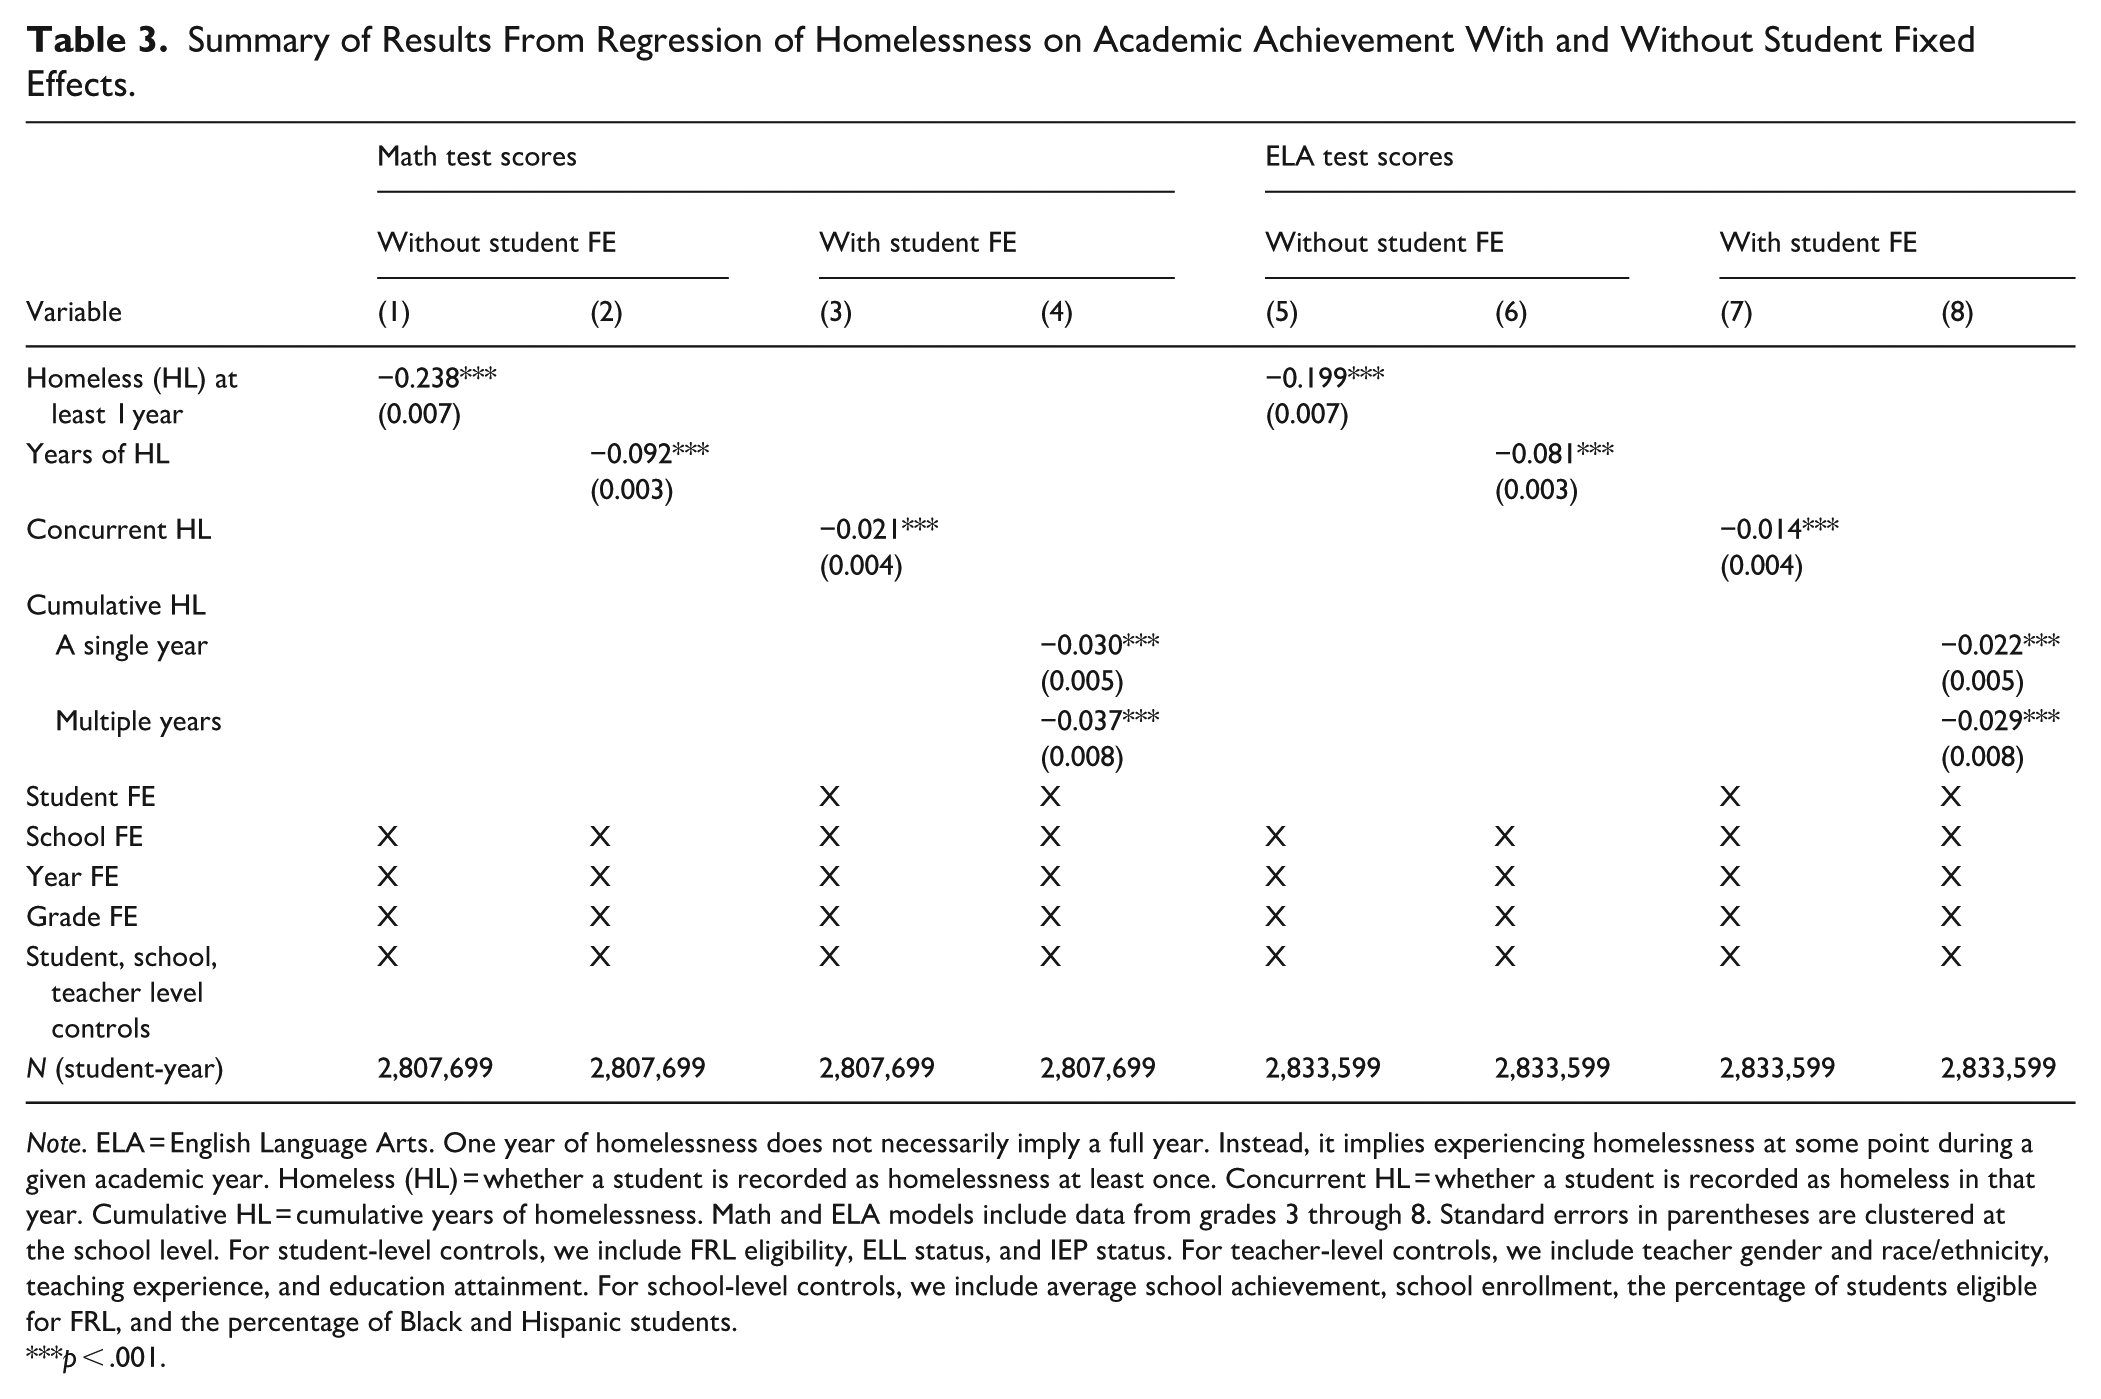
Note. ELA = English Language Arts. One year of homelessness does not necessarily imply a full year. Instead, it implies experiencing homelessness at some point during a given academic year. Homeless (HL) = whether a student is recorded as homelessness at least once. Concurrent HL = whether a student is recorded as homeless in that year. Cumulative HL = cumulative years of homelessness. Math and ELA models include data from grades 3 through 8. Standard errors in parentheses are clustered at the school level. For student-level controls, we include FRL eligibility, ELL status, and IEP status. For teacher-level controls, we include teacher gender and race/ethnicity, teaching experience, and education attainment. For school-level controls, we include average school achievement, school enrollment, the percentage of students eligible for FRL, and the percentage of Black and Hispanic students.
p < .001.
We next include student fixed effects to use each student as their own control. Column 3 examines the concurrent association between homelessness and math achievement, while Column 4 focuses on the cumulative association between the two. With student fixed effects, the magnitude of effect sizes becomes notably smaller but remains significantly negative. Homelessness is associated with a 0.021 SD (p < .001) lower math achievement in a year when students experience homelessness (Column 3). Additionally, being identified as experiencing homelessness in a single year is associated with a 0.030 SD (p < .001) lower math achievement, whereas identification in multiple years is associated with a 0.037 SD (p < .001) lower math achievement (Column 4). We note that “a single year” indicates only that the student was identified as homeless during that specific year and does not capture the full duration of homelessness.
Experiencing homelessness is also linked to lower ELA achievement. Column 5 in Table 3 shows that homelessness is associated with a 0.199 SD (p < .001) lower ELA achievement when controlling for school, year, and grade fixed effects, as well as student, school, and teacher-level control variables. Column 6 shows that each additional year of homelessness is associated with a 0.081 SD (p < .001) lower ELA achievement, controlling for the same variables.
Similar to the patterns observed in math achievement models, the coefficients on homelessness decrease when student fixed effects are included. Homelessness is associated with a 0.014 SD decrease in ELA achievement during the year it occurs (p < .001; Column 7). Being identified as homeless in a single year is associated with a 0.022 SD decrease (p < .001), while identification across multiple years is associated with a 0.029 SD decrease (p < .001). Although small, these associations are significant for both math and ELA. For reference, a 0.037 SD decrease in math corresponds to roughly 6.6% to 11.6% of a year of learning, while a 0.029 SD decrease in ELA corresponds to about 7.3% to 12.6%. 9
Table 4 shows our main findings on the relationship between homelessness and behavioral outcomes, such as school discipline and attendance. Column 1 indicates that experiencing homelessness is associated with a 4.2 percentage point (p < .001) increase in exclusionary school disciplinary incidents when controlling for school, year, and grade fixed effects, as well as student, school, and teacher-level controls. Column 2 shows that each additional year of homelessness is associated with a 1.7 percentage point (p < .001) higher probability of receiving exclusionary school discipline.
Summary of Results From Regression of Homelessness on School Discipline and Absences With and Without Student Fixed Effects.
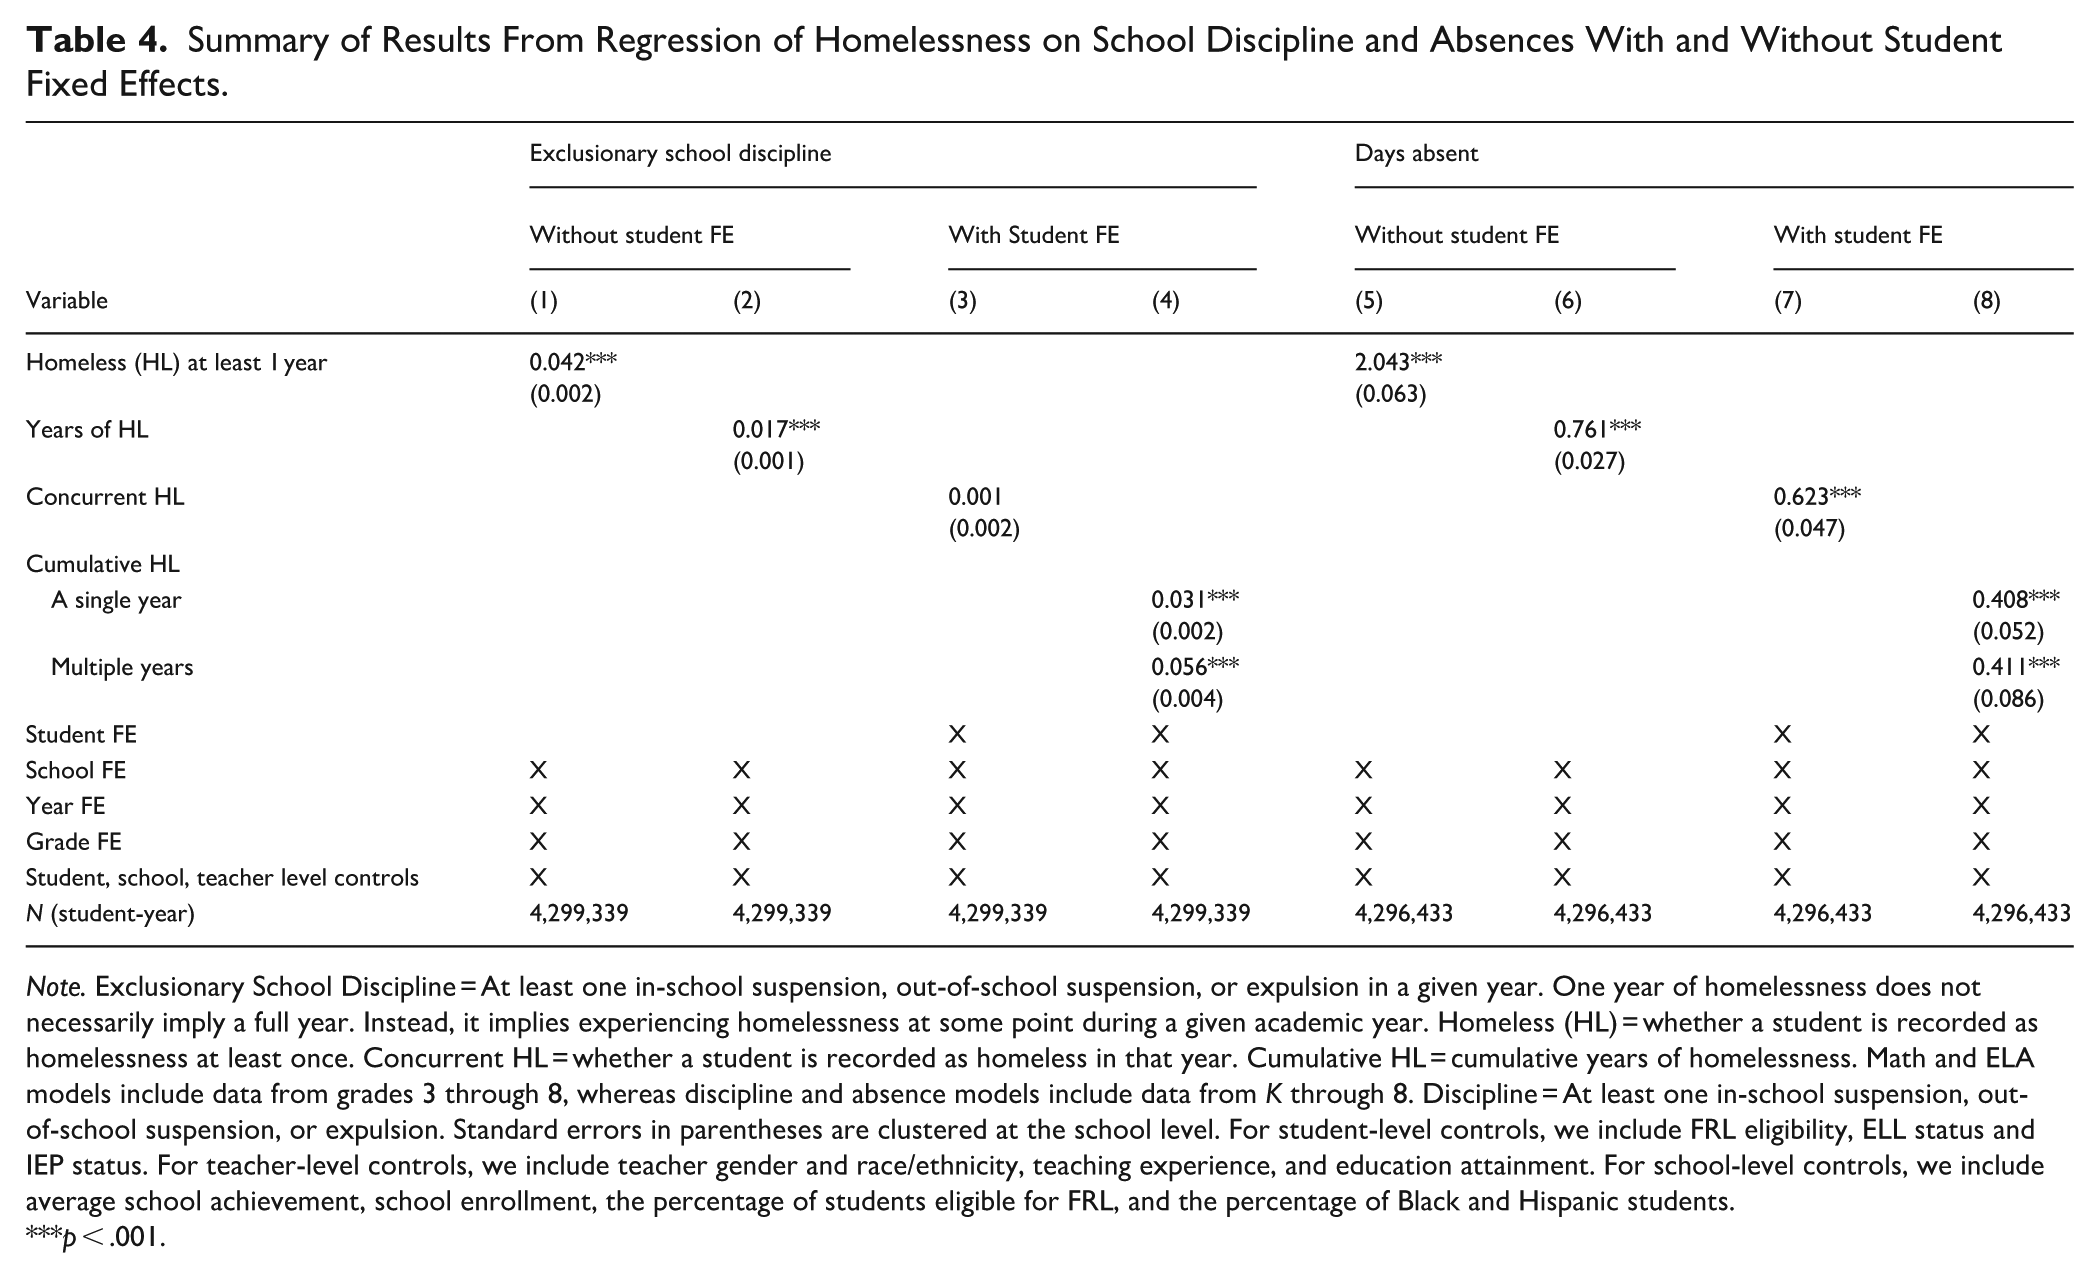
Note. Exclusionary School Discipline = At least one in-school suspension, out-of-school suspension, or expulsion in a given year. One year of homelessness does not necessarily imply a full year. Instead, it implies experiencing homelessness at some point during a given academic year. Homeless (HL) = whether a student is recorded as homelessness at least once. Concurrent HL = whether a student is recorded as homeless in that year. Cumulative HL = cumulative years of homelessness. Math and ELA models include data from grades 3 through 8, whereas discipline and absence models include data from K through 8. Discipline = At least one in-school suspension, out-of-school suspension, or expulsion. Standard errors in parentheses are clustered at the school level. For student-level controls, we include FRL eligibility, ELL status and IEP status. For teacher-level controls, we include teacher gender and race/ethnicity, teaching experience, and education attainment. For school-level controls, we include average school achievement, school enrollment, the percentage of students eligible for FRL, and the percentage of Black and Hispanic students.
p < .001.
With student fixed effects, concurrent homelessness is no longer significantly associated with school discipline (Column 3). Examining cumulative homelessness, a single year is linked to a 3.1 percentage point increase in disciplinary actions (p < .001), and multiple years to a 5.6 percentage point increase (p < .001; Column 4). For context, 5.6 points represent 61.5% of the sample’s average disciplinary rate of 9.1% (5.6 ÷ 9.1 × 100), indicating that cumulative homelessness, particularly over multiple years, is substantially associated with school discipline.
Finally, we examine the relationship between student homelessness and attendance. Column 5 in Table 4 shows that homelessness is associated with a 2.0-day increase in unexcused absences (p < .001), controlling for school, year, grade, and student, school, and teacher-level variables. Column 6 indicates that each additional year of homelessness corresponds to a 0.76-day increase (p < .001). With student fixed effects, the association remains significant: Column 7 shows that concurrent homelessness is linked to a 0.62-day increase (p < .001), representing 28.6% of the sample’s annual average of 2.17 unexcused days. Column 8 shows that being ever-identified as homeless in a single or multiple years is associated with a 0.41-day increase (p < .001).
Heterogeneous Links Between Homelessness and Student Outcomes Across Subgroups
Table 5 shows the results on the heterogeneous links between homelessness and student achievement across subgroups. Column 1 shows that, compared with male students, the negative associations between homelessness and math achievement are weaker for female students—by 0.072 SD for a single year (p < .001) and a 0.140 SD for multiple years (p < .001). Column 2 of Table 5 shows that the negative associations between homelessness and math achievement are stronger for White students than for students of color. Compared with White students, the associations are less negative for Black students by 0.034 SD for a single year (p < .05) and 0.038 SD for multiple years (p < .01). Similarly, for Hispanic students, the associations are weaker by 0.064 SD for a single year (p < .001) and 0.128 SD for multiple years (p < .001). The differences are particularly pronounced for Asian students, with 0.392 SD for a single year (p < .001) and 0.762 SD for multiple years (p < .001), relative to White students. Column 3 indicates that the negative associations between homelessness and math achievement are greater for middle school students than for elementary school students, with −0.014 SD for a single year (p < .05) and −0.019 SD for multiple years (p < .05). Columns 4 through 6 highlight similar patterns for ELA achievement. As with math, the negative associations with homelessness are more pronounced for male students, White students, and middle school students.
Heterogeneous Associations Between Cumulative Homelessness Experience and Academic Achievement Across Subgroups.
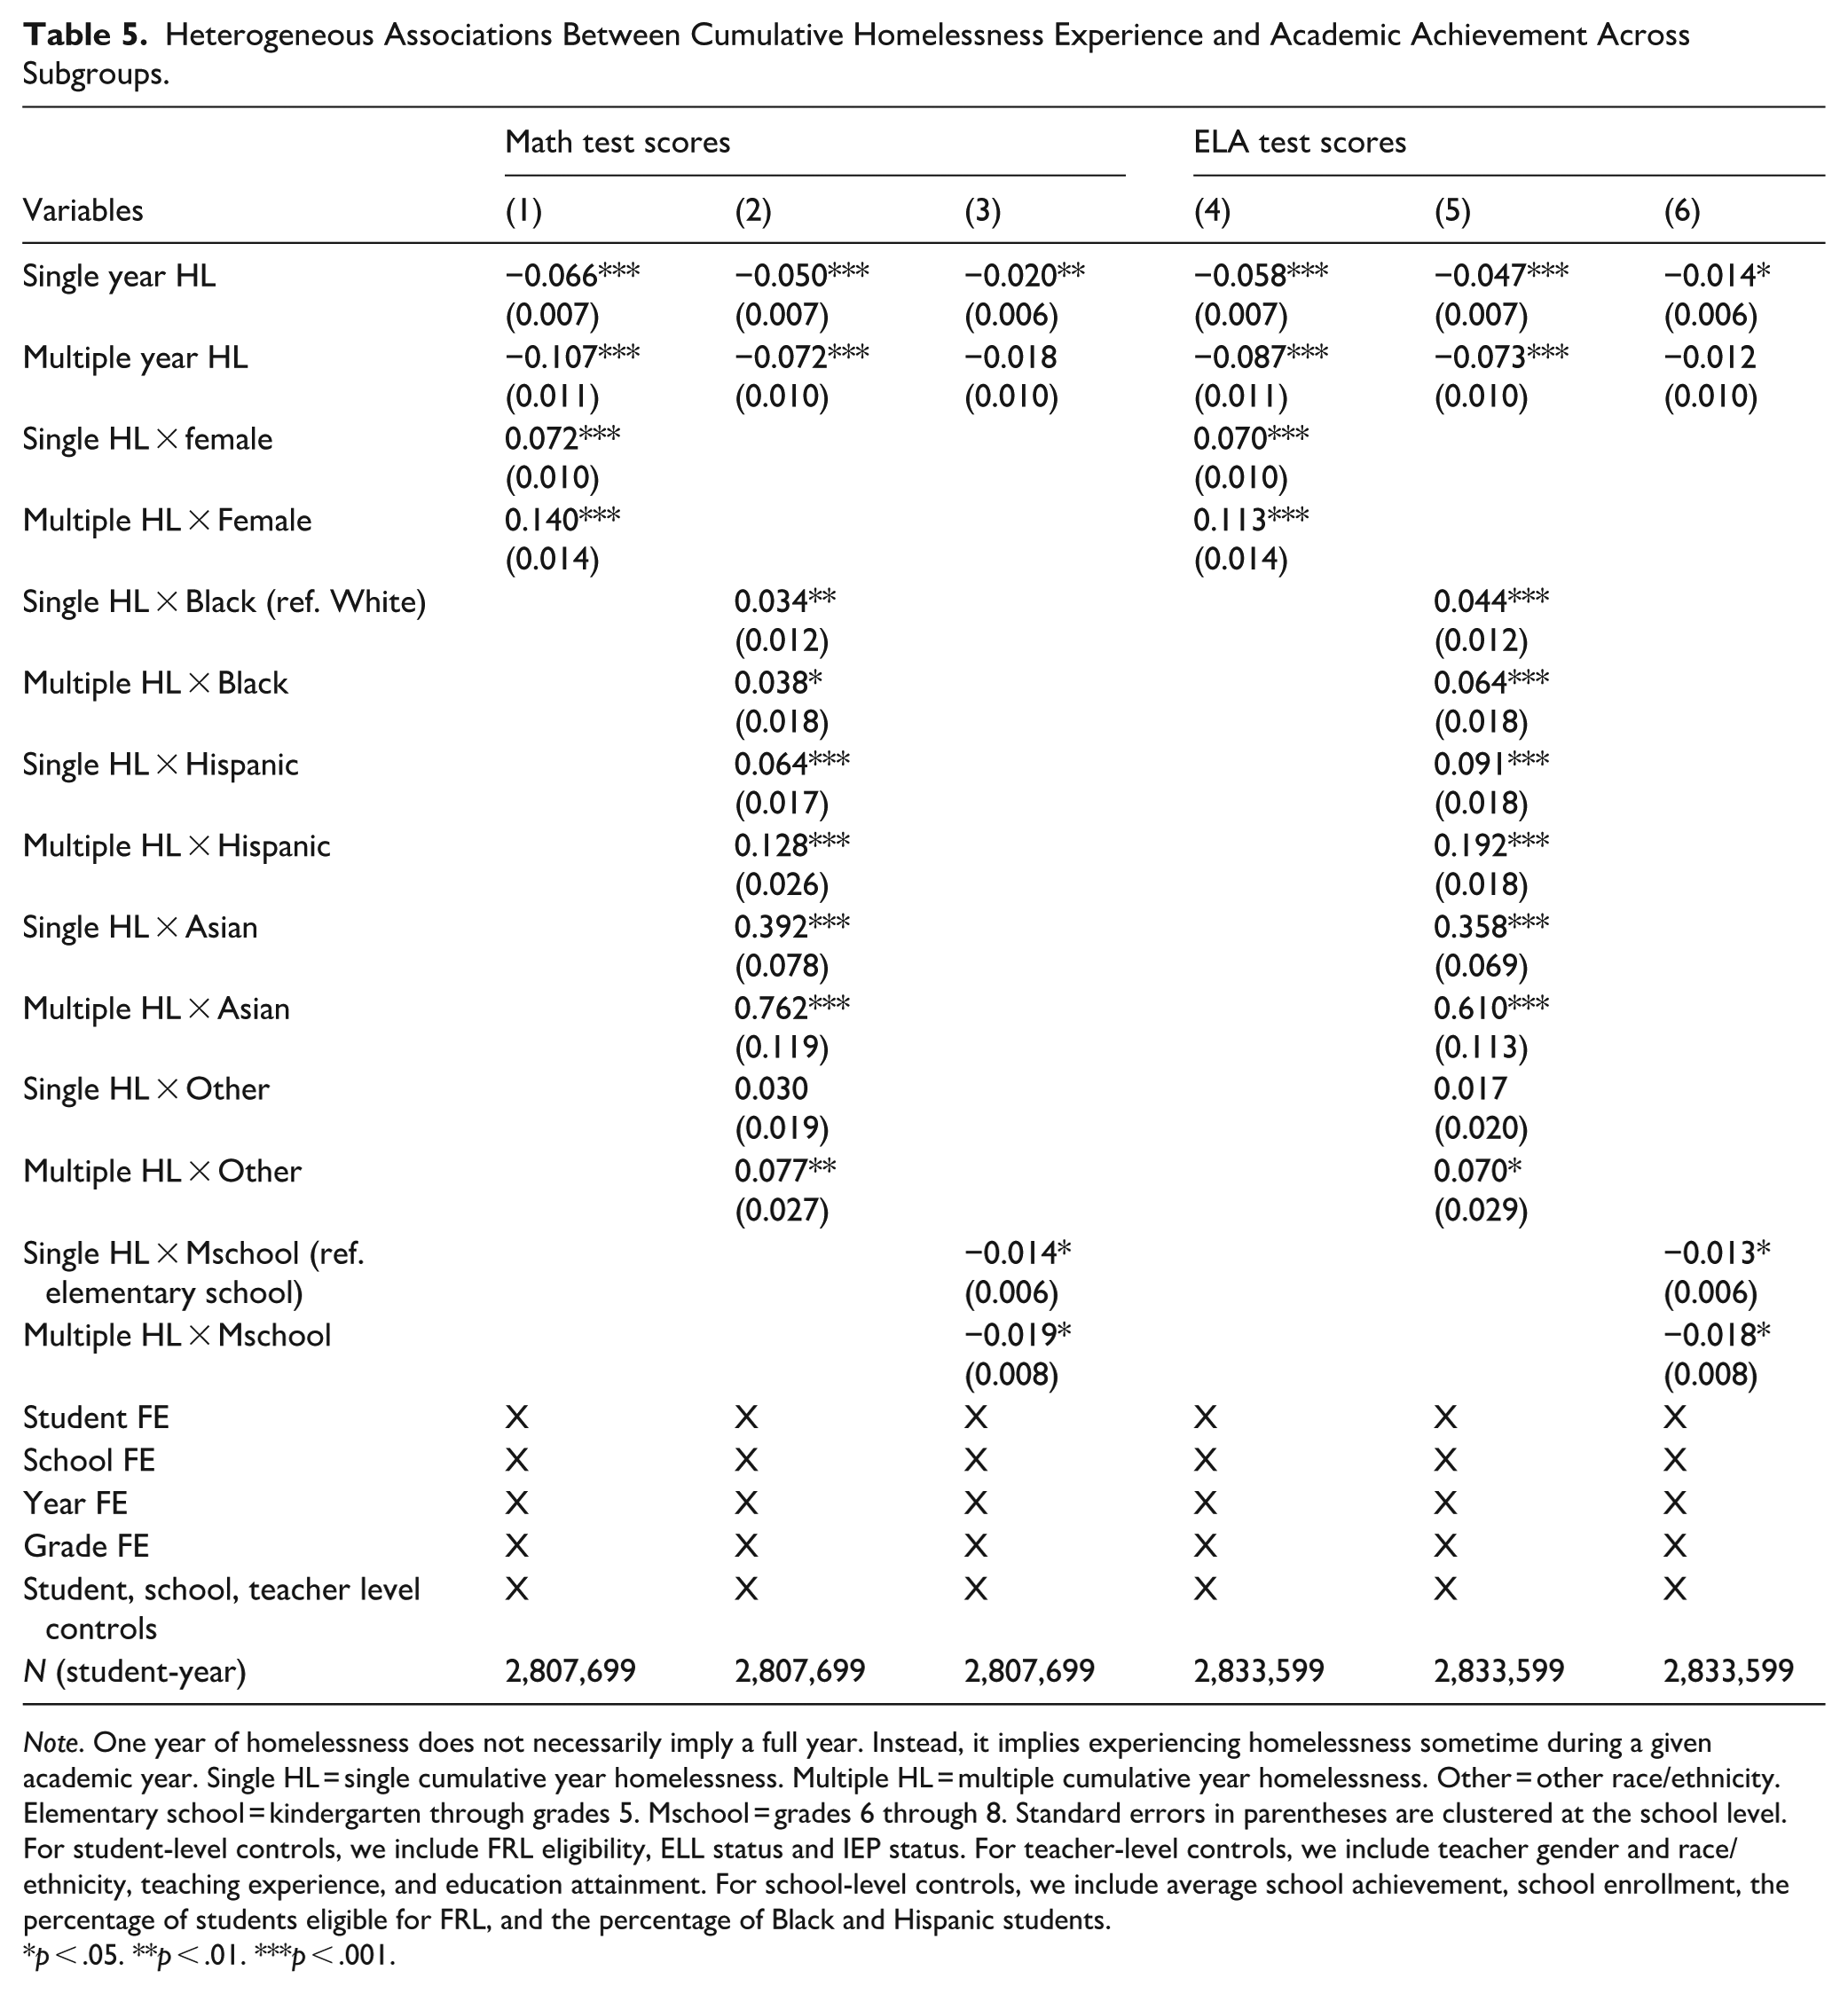
Note. One year of homelessness does not necessarily imply a full year. Instead, it implies experiencing homelessness sometime during a given academic year. Single HL = single cumulative year homelessness. Multiple HL = multiple cumulative year homelessness. Other = other race/ethnicity. Elementary school = kindergarten through grades 5. Mschool = grades 6 through 8. Standard errors in parentheses are clustered at the school level. For student-level controls, we include FRL eligibility, ELL status and IEP status. For teacher-level controls, we include teacher gender and race/ethnicity, teaching experience, and education attainment. For school-level controls, we include average school achievement, school enrollment, the percentage of students eligible for FRL, and the percentage of Black and Hispanic students.
p < .05. **p < .01. ***p < .001.
Table 6 shows primary results on the heterogeneous links between homelessness and non-academic outcomes across student subgroups. Column 1 shows that, compared with female students, homelessness is more strongly associated with school discipline for male students, with 2.9 percentage points for a single cumulative year (p < .001) and 4.5 percentage points for multiple cumulative years (p < .001). By contrast, the associations between homelessness and school discipline do not vary by race/ethnicity, except for students identifying as other race/ethnicity (Column 2). For middle school students, the associations are stronger, with 3.9 percentage points for a single cumulative year (p < .001) and 4.7 percentage points for multiple years (p < .001), relative to elementary school students (Column 3).
The Heterogeneous Association Between Cumulative Homelessness Experience and Behavioral Outcomes Across Subgroups.
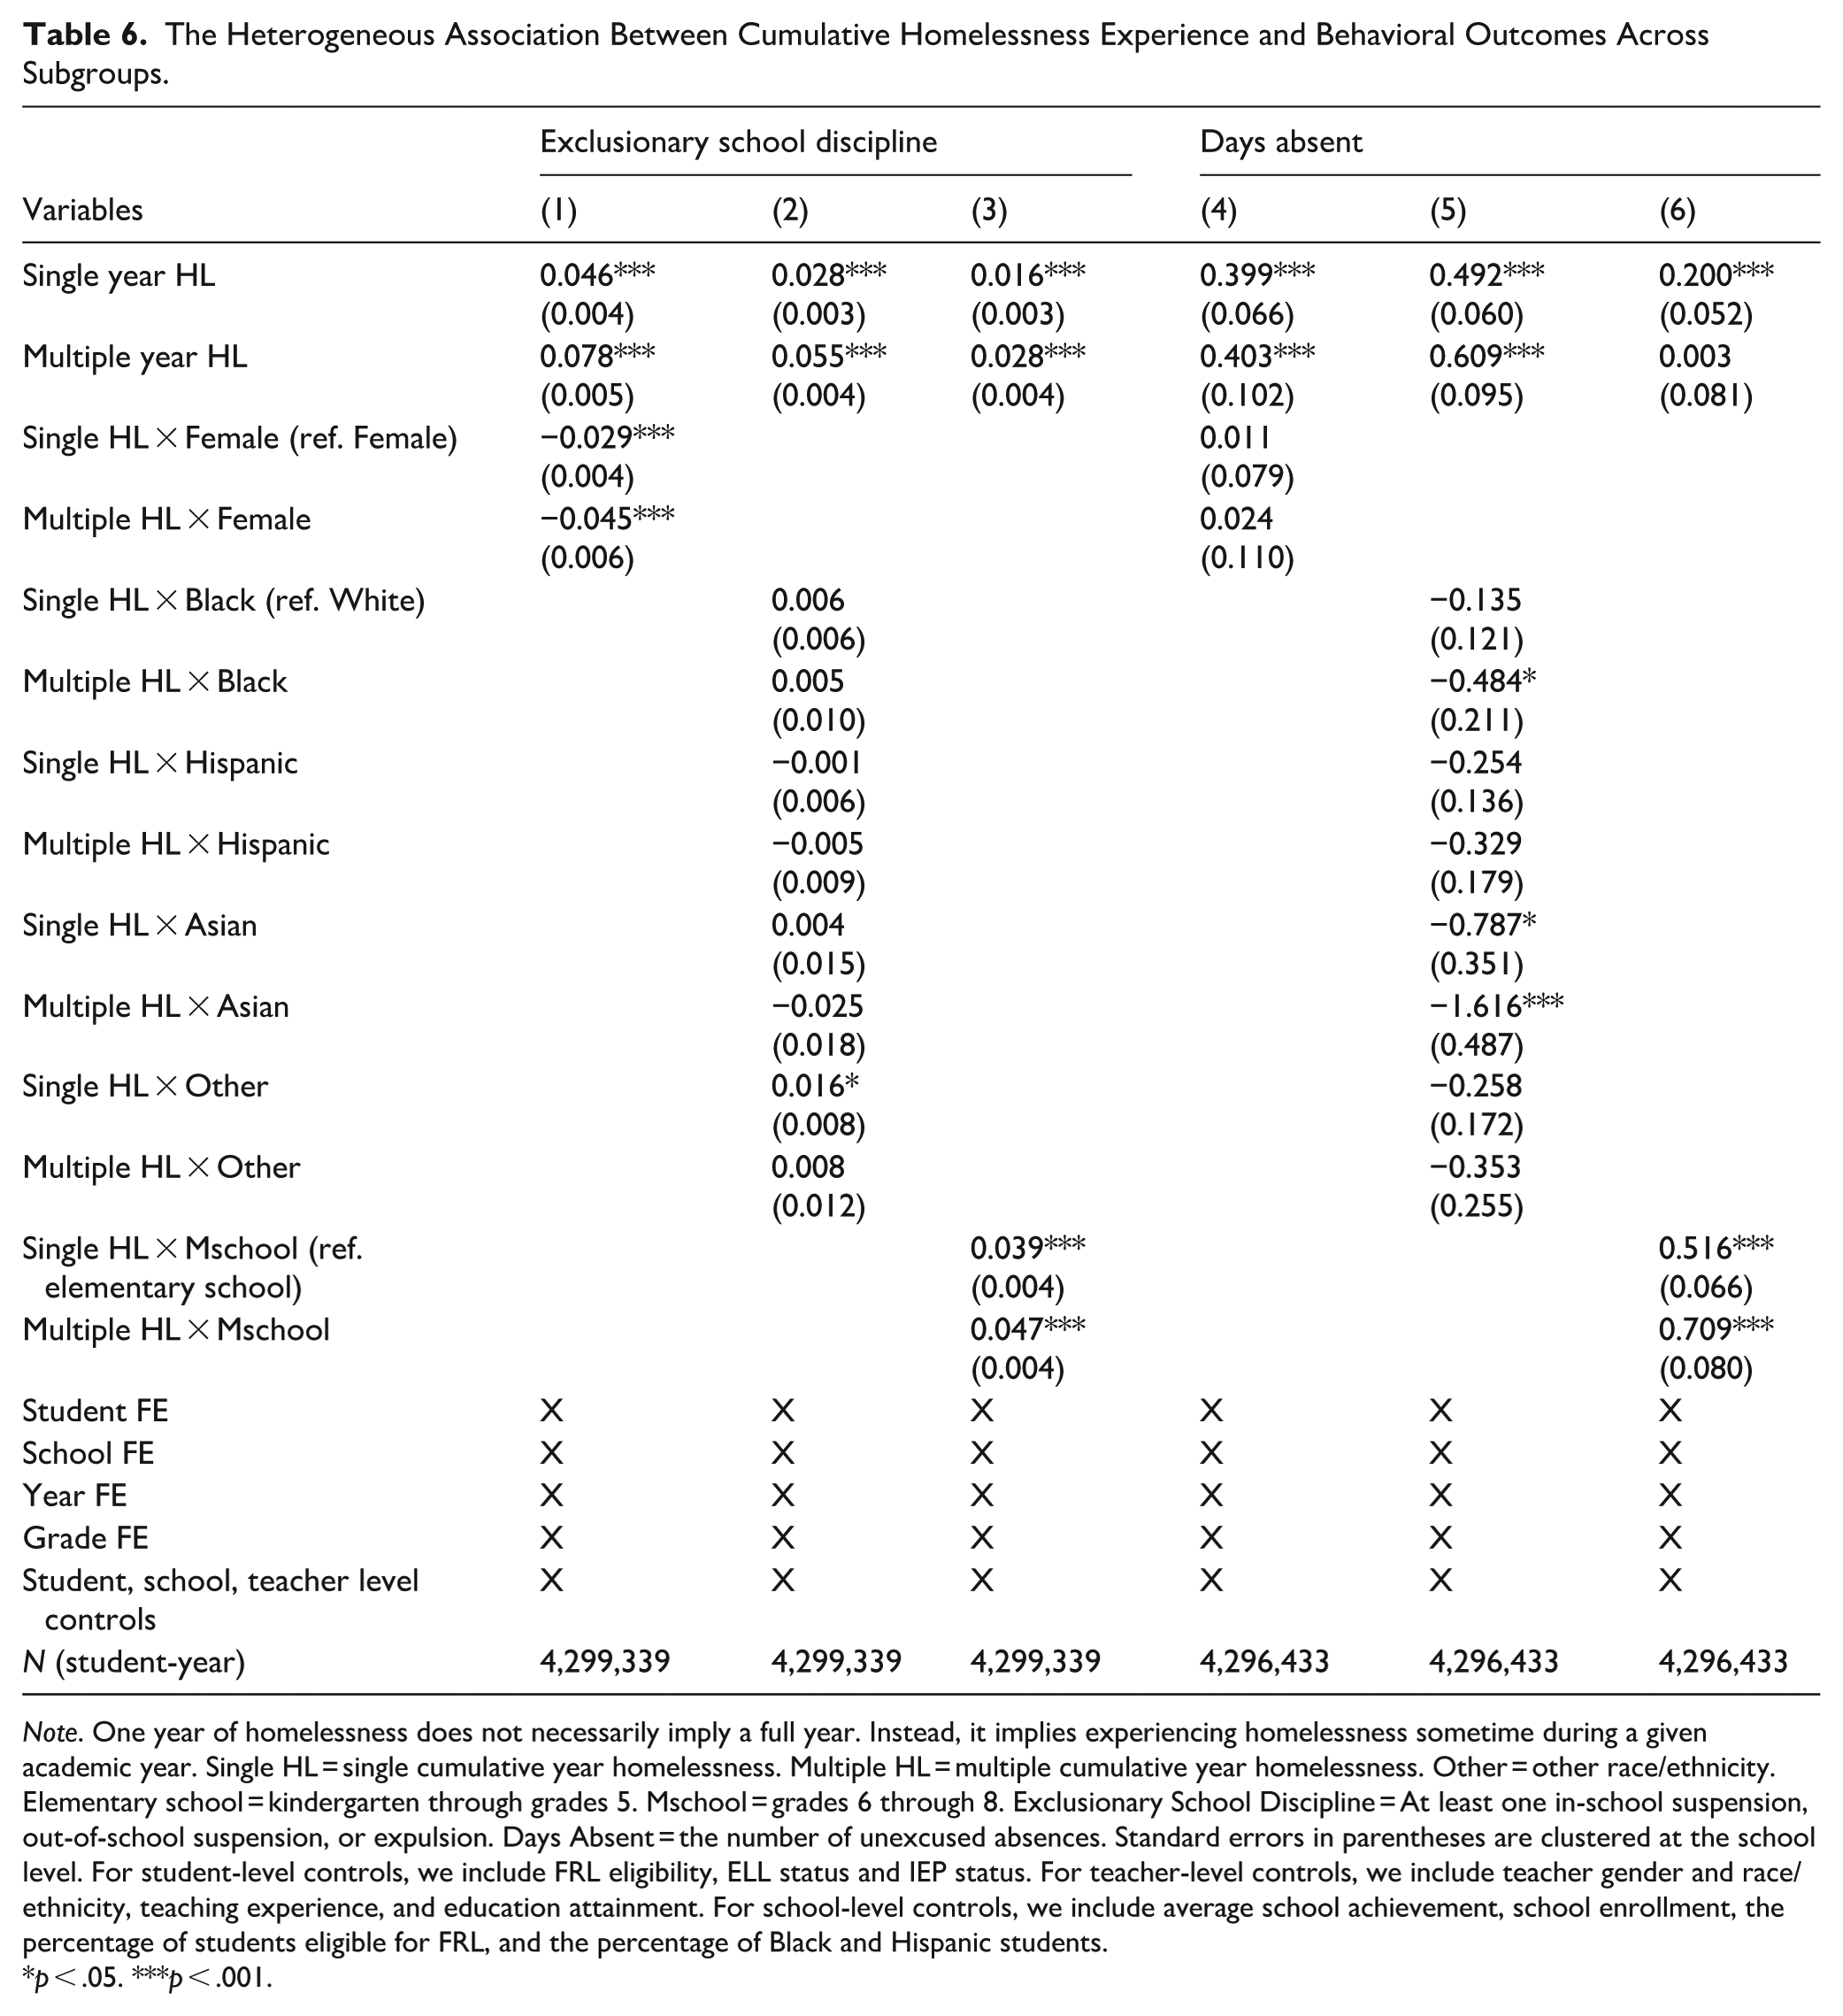
Note. One year of homelessness does not necessarily imply a full year. Instead, it implies experiencing homelessness sometime during a given academic year. Single HL = single cumulative year homelessness. Multiple HL = multiple cumulative year homelessness. Other = other race/ethnicity. Elementary school = kindergarten through grades 5. Mschool = grades 6 through 8. Exclusionary School Discipline = At least one in-school suspension, out-of-school suspension, or expulsion. Days Absent = the number of unexcused absences. Standard errors in parentheses are clustered at the school level. For student-level controls, we include FRL eligibility, ELL status and IEP status. For teacher-level controls, we include teacher gender and race/ethnicity, teaching experience, and education attainment. For school-level controls, we include average school achievement, school enrollment, the percentage of students eligible for FRL, and the percentage of Black and Hispanic students.
p < .05. ***p < .001.
We now examine the heterogeneous association between homelessness and attendance outcomes across student subgroups (Columns 4–6). The results indicate that the links between homelessness and unexcused absences do not significantly differ by student gender (Column 4). However, the associations between homelessness and days absent are greater for White students, compared with Students of Color (Column 5). The associations between multiple cumulative years of homelessness and days absent are weaker for Black students by 0.48 days (p < .05) and for Asian students by 1.62 days (p < .001), compared with White students. Column 6 shows that the associations are more pronounced for middle school students than for elementary school students, with increases of 0.52 days (p < .001) for a single cumulative year of homelessness and 0.71 days (p < .001) for multiple cumulative years. Figure A1 in Appendix visually represents these heterogeneous links between homelessness and student outcomes across subgroups. 10
Conclusion and Discussion
We use 7 years of longitudinal administrative data from Indiana to examine subgroup differences in experiencing homelessness and heterogeneity in the associations between homelessness and student outcomes. We find that students from historically underserved communities are more likely to experience homelessness, echoing prior research (Aviles de Bradley, 2015a, 2015b; Burns et al., 2021; Herbers et al., 2012; Howland et al., 2017). Specifically, our data show that Black students and students from low-income families experience homelessness more frequently and for longer durations.
We further show that homelessness is associated with adverse academic and non-academic outcomes. Our student fixed effects models show that students exhibit lower math and ELA achievement during years of homelessness compared with non-homeless years. Additionally, cumulative homelessness has at least an equal or greater, link to lower achievement, with declines of 0.04 SD in math and 0.03 SD in ELA. Consistent with prior work (Dhaliwal, 2025), our results indicate small but statistically significant declines in academic achievement, underscoring adverse outcomes even when controlling for all time-invariant student differences.
Our results also show that homelessness is linked to adverse non-academic outcomes, including exclusionary discipline and absences. We find no link between concurrent homelessness and school discipline, yet cumulative homelessness is associated with a higher likelihood of disciplinary incidents, accounting for 61.5% of overall disciplinary rates and underscoring adverse long-term disciplinary outcomes. By contrast, the association between homelessness and attendance outcomes is stronger for concurrent than for cumulative homelessness, suggesting that absences are higher during the years of homelessness, aligning with prior findings (De Gregorio et al., 2022).
We show that homelessness is more strongly associated with academic and disciplinary outcomes for male students than for female students, highlighting gender-based heterogeneity. This pattern aligns with prior research showing that family and neighborhood disadvantage disproportionately affects boys, who exhibit higher rates of disciplinary incidents, lower achievement, and lower high school completion than similarly disadvantaged girls (Autor et al., 2019), and who are more affected at the lower tails of attendance and test score distributions (Autor et al., 2023). Our findings also relate to research documenting gender differences in the effects of neighborhood and socioeconomic disadvantage on long-term outcomes, including educational attainment and earnings (Chetty, Hendren, Lin, et al., 2016; Chetty & Hendren, 2018). Although these studies do not examine homelessness directly, they suggest that male students may be particularly sensitive to family disruption and socioeconomic disadvantage.
We find stronger associations between homelessness and adverse academic and attendance outcomes for White students, consistent with evidence that its links to postsecondary and early labor market outcomes are stronger for White students than for students of color (Mushonga et al., 2024). These patterns suggest that White racial identity may function as a risk factor rather than a protective factor. One possible explanation is that pathways into homelessness differ by race/ethnicity: Compared with White families, families of color are more likely to experience persistent structural disadvantages, including racial discrimination and systemic inequities (Gordon et al., 2000; Landrine & Corral, 2009; Wang & Atwal, 2015). 11 As a result, homelessness may represent a less common but more disruptive family adversity for White students, which is reflected in stronger associations with adverse outcomes. Although our identification strategy does not fully eliminate potential confounding and our data do not allow us to examine gender- and race-specific mechanisms, these findings highlight the importance of school policies that provide both academic and behavioral supports while accounting for differential experiences across gender and racial and ethnic groups.
In addition to gender and race/ethnicity, our results indicate that the links between homelessness and student outcomes vary by school level. Specifically, experiencing homelessness is more strongly associated with adverse outcomes for students in middle school compared with students in elementary school, highlighting the importance of the timing and developmental context of homelessness. These heterogeneous associations by gender, race/ethnicity, and school level align with the Continuum of Risk framework, which emphasizes that risks interact with other social and structural factors, producing different consequences across contexts (Masten et al., 1993).
Our study has several limitations. First, although certain student subgroups appear more vulnerable to homelessness, we do not examine the mechanisms underlying these differences, such as those related to gender or race/ethnicity. Second, although we leverage state administrative data to examine both academic and non-academic outcomes, under-identification likely limits our ability to capture the full scope of student homelessness (Cutuli et al., 2024). Third, we focus on cumulative associations to examine potential longer-term consequences of homelessness. However, because our data cover students in kindergarten through eighth grade, the study does not capture outcomes beyond middle school, such as high school or adult outcomes. Finally, while we use student fixed effects to estimate concurrent and cumulative associations between homelessness and outcomes, this identification strategy reduces—but does not eliminate—potential bias. Future research addressing these gaps will provide a clearer understanding of how experiencing homelessness shapes student outcomes.
Despite these limitations, our findings have several implications for policymakers, educators, and researchers. For policymakers, supports for students experiencing homelessness should extend beyond periods of concurrent homelessness, academic and behavioral setbacks persist even after students regain housing stability. Investments in sustained school- and neighborhood-level resources can be particularly important for students from underserved communities, who are more likely to experience homelessness and for longer durations. Targeted supports—including academic tutoring and social, emotional, and health interventions—can enhance student engagement (Learning Policy Institute, 2023). Early-warning systems and mobility tracking can help identify students experiencing episodic homelessness, while persistent, flexible interventions—such as tutoring, mentoring, and counseling—are critical for students experiencing chronic homelessness (Dhaliwal & De Gregorio, 2022). For educators and school leaders, heterogeneity by race/ethnicity and gender highlights the need for context-responsive supports. Although White students are often considered relatively more advantaged, our findings show sharper academic declines when they experience homelessness, whereas Black students exhibit more adverse disciplinary outcomes, underscoring the importance of tailored academic and behavioral supports.
Building on these patterns of cumulative risk and student heterogeneity, future research could take several directions. First, studies should leverage data from diverse contexts to examine heterogeneous relationships between homelessness and student outcomes across gender, race/ethnicity, and school levels, as well as to explore how students from different backgrounds can be supported effectively. Additionally, qualitative and mixed-methods data could provide deeper insight into the mechanisms linking homelessness to student outcomes across subgroups. This work could inform more equitable and responsive strategies for addressing housing instability in schools.
Footnotes
Appendix
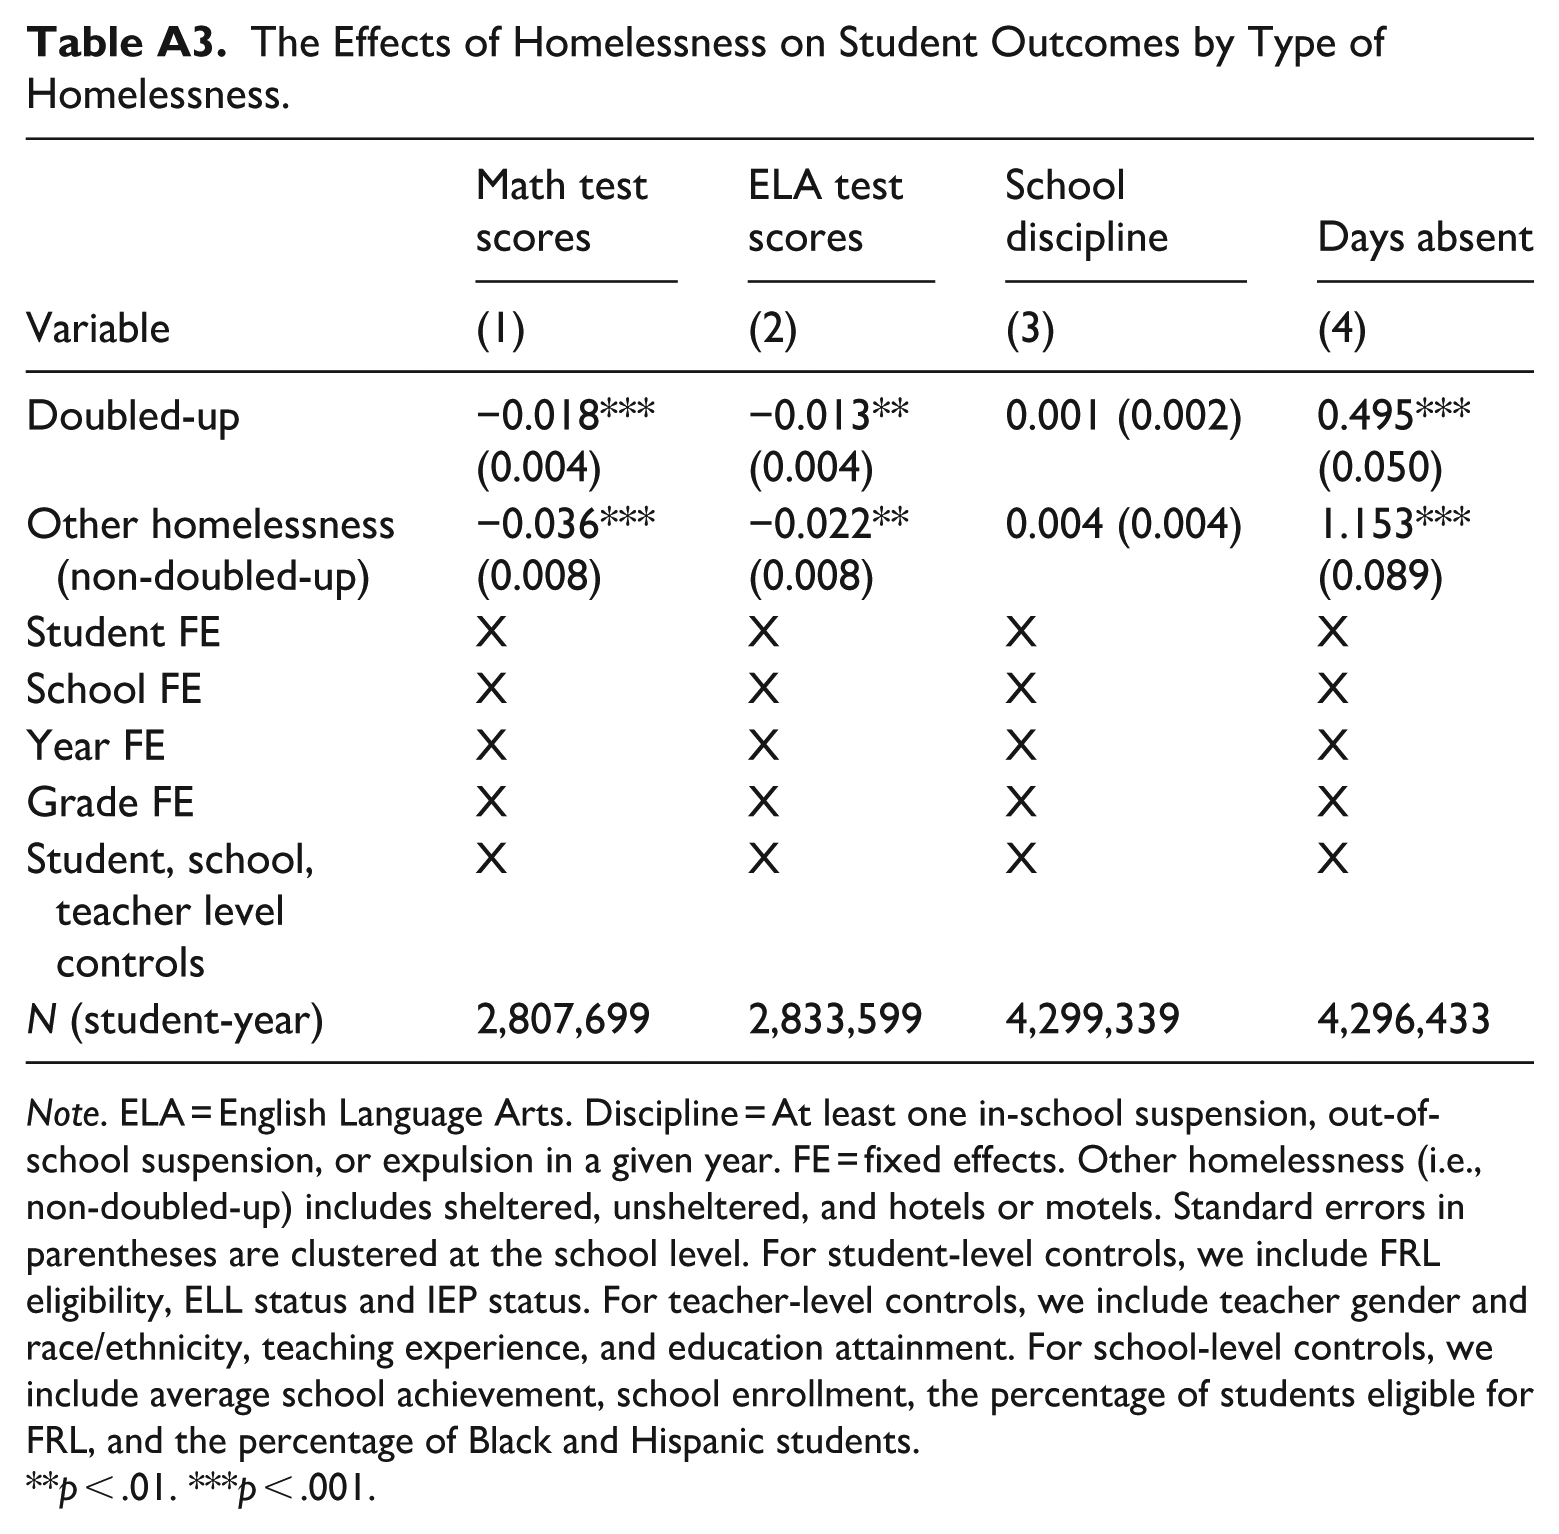
The Effects of Homelessness on Student Outcomes by Type of Homelessness.
| Variable | Math test scores | ELA test scores | School discipline | Days absent |
|---|---|---|---|---|
| (1) | (2) | (3) | (4) | |
| Doubled-up | −0.018***
(0.004) |
−0.013**
(0.004) |
0.001 (0.002) | 0.495***
(0.050) |
| Other homelessness (non-doubled-up) | −0.036***
(0.008) |
−0.022**
(0.008) |
0.004 (0.004) | 1.153***
(0.089) |
| Student FE | X | X | X | X |
| School FE | X | X | X | X |
| Year FE | X | X | X | X |
| Grade FE | X | X | X | X |
| Student, school, teacher level controls | X | X | X | X |
| N (student-year) | 2,807,699 | 2,833,599 | 4,299,339 | 4,296,433 |
Note. ELA = English Language Arts. Discipline = At least one in-school suspension, out-of-school suspension, or expulsion in a given year. FE = fixed effects. Other homelessness (i.e., non-doubled-up) includes sheltered, unsheltered, and hotels or motels. Standard errors in parentheses are clustered at the school level. For student-level controls, we include FRL eligibility, ELL status and IEP status. For teacher-level controls, we include teacher gender and race/ethnicity, teaching experience, and education attainment. For school-level controls, we include average school achievement, school enrollment, the percentage of students eligible for FRL, and the percentage of Black and Hispanic students.
**p < .01. ***p < .001.
Acknowledgements
We appreciate the insightful feedback on an earlier draft provided by Chris Redding and the editorial support of Shikha Singh. We also thank Mark Berends and Roberto Peñaloza for their support. This paper was supported by the University of Notre Dame’s Center for Research on Educational Opportunity (CREO) and the Institute of Educational Initiatives, in partnership with the Indiana Department of Education. We are grateful to the Indiana Department of Education for providing access to state administrative records and supporting independent analyses. All opinions expressed in this paper are solely those of the authors and do not necessarily reflect the views of the affiliated institutions. Any errors are the responsibility of the authors.
Funding
The authors received no financial support for the research, authorship, and/or publication of this article.
Declaration of Conflicting Interests
The authors declared no potential conflicts of interest with respect to the research, authorship, and/or publication of this article.