
Abstract

Transport of Urea and Creatinine
Diffusion and convection are involved in solute transport from peritoneal capillaries to dialysate. Diffusion is the most important transport mechanism for low molecular weights solutes. Diffusion through the small pore system occurs bidirectionally, depending on the concentration gradient. The rate of diffusion is determined by the product of the mass transfer area coefficient (MTAC, the maximum theoretical clearance by diffusion at time zero) and the concentration gradient. As the latter decreases during a dwell due to saturation of the dialysate, the diffusion rate of urea and creatinine also decreases during a dwell. In a situation where equilibrium is present between plasma and dialysate concentration, the mass transfer will only be determined by the net water transport between blood and dialysate, that is, the drained dialysate volume. Therefore UF rate also contributes to solute removal. This process of solute transport is called convection or solvent drag. The transport of solutes by convection through transcapillary UF does not occur on an equimolar base: in a situation where no diffusion (transport through the small pores) occurs, the dialysate concentration of a solute transported by crystalloid osmosis is lower than the plasma concentration. It is caused by crystalloid osmosis-induced aquaporin-mediated water transport without the transport of solutes. This hindrance to convective solute transport can be expressed as the sieving coefficient (S) (15-18), which is the ratio between the dialysate concentration of a solute and its plasma concentration when no transport by diffusion occurs. It can range between 0 (the solute is too large for transport by convection) to 1.0 (the membrane offers no hindrance to convection solute transport). The sieving coefficient should not be confused with the reflection coefficient σ, which is used as a measure of the effectivity of a solute to create a crystalloid osmotic pressure gradient across a membrane. It can also range between 1.0 (no passage, ideal semipermeable membrane) to 0 (no osmotic effect). For a homoporous membrane S = 1 – σ. The heteroporosity of the peritoneal membrane is the explanation of why the above equation does not apply in PD. Typical values for S of low molecular weight solutes average 0.7 (15-18), but σ values of 0.05 or less are normally reported (19-23).
The permeability of the peritoneum to the transport of low molecular weight solutes has traditionally been investigated during 4-hour dwells, such as in the peritoneal equilibration test (PET) (24). Parameters that can be calculated from such a standardized test are the MTAC of a solute, its dialysate-to-plasma (D/P) ratio, and the clearance of that solute. Because transcapillary transport is the major process in PD, and because the peritoneum offers no size- selective restriction barrier to the transport of low molecular weight solutes (25), the MTAC or D/P ratio is determined mainly by the vascular peritoneal surface area. Under basal circumstances only about 25% – 50% of the peritoneal capillaries are perfused (26,27). This number can be increased by, for example, the administration of nitroprusside (26,28). The importance of this is emphasized by the observation that peritoneal blood volume is a more important determinant of diffusion rate than is peritoneal blood flow (29). For practical reasons, changes in the D/P ratio of a solute or in its MTAC can be considered to represent changes in the vascular peritoneal surface area. These changes can be either functional (more perfused capillaries) or anatomic (more capillaries present).
Based on D/P creatinine, patients have been classified into four transport categories: low, low-average, high-average, and high. However, because peritoneal mass transfer and peritoneal clearance of a small solute during dwells of 4 hours or more are dependent mainly on drained volume, patients with a high D/P ratio of creatinine may in fact have a low mass transfer and clearance of this solute (30). Therefore, the classification into transport categories based on D/P ratios may be confusing. Because the D/P ratio of low molecular weight solutes is dependent mainly on the surface area of the peritoneal membrane (see above), renaming of the four “transport” categories should be considered. They could be named either high, high-average, low-average, and low D/P ratio creatinine or, alternatively, very large, large, medium, and small surface area.
Physiology of Fluid Transport
Fluid transport during PD is determined by hydrostatic and osmotic pressure, and also by lymphatic drainage. Transcapillary UF rate is dependent on the hydraulic permeability of the peritoneum, its effective surface area, and the hydrostatic, colloid osmotic, and crystalloid osmotic pressure gradients. The hydrostatic pressure in the peritoneal capillaries is assumed to be 17 mmHg (31). Intraperitoneal pressure during continuous ambulatory peritoneal dialysis (CAPD) in the supine position averages 8 mmHg (32), but exceeds 20 mmHg while walking (33). It is also dependent on instilled dialysate volume (34). This implies that the hydrostatic pressure gradient is mainly dependent on intraperitoneal pressure. Colloid osmotic pressure in the peritoneal capillaries probably averages 26 mmHg (31). In CAPD patients who have a mean serum albumin concentration of 34 g/L (35), a value of 21 mmHg can be calculated (36). The contribution of dialysate to the colloid osmotic pressure gradient can be neglected because of its low protein content.
The crystalloid osmotic pressure gradient during PD with conventional solutions is determined mainly by glucose. Its effectiveness as an osmotic agent depends on the resistance the membrane exerts to glucose transport. This is expressed as the osmotic reflection coefficient. It can range from 1 (no passage, ideal semipermeable membrane) to 0 (passage not hindered). According to van ‘t Hoff's law, 1 mOsm/kg H2O exerts an osmotic pressure of 19.3 mmHg when the reflection coefficient is 1.0. The osmotic pressure created by a low molecular weight solute equals the product of the osmolality gradient and the reflection coefficient of that solute, multiplied by 19.3. A value as low as 0.03 for glucose has been calculated in CAPD patients (22). It is likely that the reflection coefficient of glucose in the small pores will be very low, but will approach 1.0 across the ultrasmall pores. This might explain why glucose is an effective osmotic agent despite its small size. The maximal pressure gradients during the beginning of a dialysis exchange are summarized in Table 1. The concentration gradient of glucose is maximal during the start of a dialysis exchange and decreases during the dwell because glucose is absorbed from the dialysate. This glucose absorption averages 61% of the instilled quantity during a 4-hour dwell (37) and 75% after 6 hours (38). The absolute but not the relative absorption is influenced by the glucose concentration used (39). As a consequence, the transcapillary UF rate has its maximum value at the start of dialysis and decreases during the dwell.
Pressure Gradients Across the Peritoneal Membrane During Peritoneal Dialysis
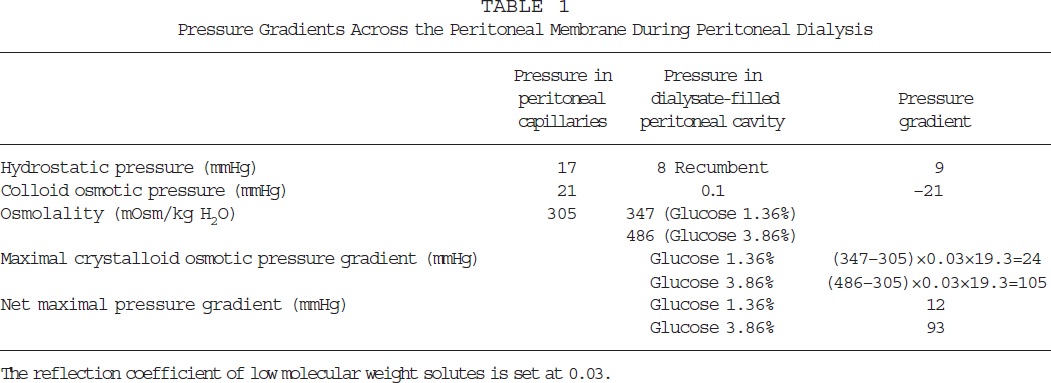
The reflection coefficient of low molecular weight solutes is set at 0.03.
Dextrins are glucose polymers that can also be applied as osmotic agent during PD. Icodextrin, a disperse mixture of dextrins with an average molecular weight of 16 800 D, is currently used in clinical practice (40). Due to its high molecular weight, icodextrin is likely to induce colloid osmosis (41). This implies that macromolecules are able to induce transcapillary UF even in an isotonic or a hypotonic solution. The process of colloid osmosis is based on the principle that fluid flow across a membrane that is permeable to small solutes occurs in the direction of relative excess of impermeable large solutes, rather than along a concentration gradient. Consequently, dialysis solutions containing macromolecules to remove fluid from the body will induce water transport through the small-pore system. The amount of fluid transported through the ultrasmall water channels is negligible because the resistance in the aquaporins is much higher than in the small pores due to the difference between the two in radius. Water channels require very high osmotic pressure gradients. This is explaned in a mathematical way in Appendix A. It can be calculated from the osmolality gradients given in Table 1 that the crystalloid osmotic pressure gradient across the water channels is (347 – 305) x 19.3 = 811 mmHg for a 1.36%/1.5% glucose solution, and (486 – 305) x 19.3 = 3493 mmHg for a 3.86%/4.25% glucose solution. The pressure gradients across the peritoneal membrane that can be expected using a monodispersed 7.5% icodextrin-based dialysis solution are shown in Table 2. It follows from this Table that the maximum pressure gradient across the peritoneal membrane is 42 mmHg, which is higher than the 12 mmHg exerted by 1.36%/1.5% glucose, but markedly lower than the 93 mmHg exerted by 3.86%/ 4.25% glucose. However, because of its lower absorption, the gradient will remain present for a much longer time. Commercially available icodextrin solutions are not monodispersed, but polydispersed (42). The colloid osmotic pressure gradient for a number average MW of 6200D is also shown in Table 2.
Pressure Gradients Across the Peritoneal Membrane During Peritoneal Dialysis Using 7.5% Icodextrin
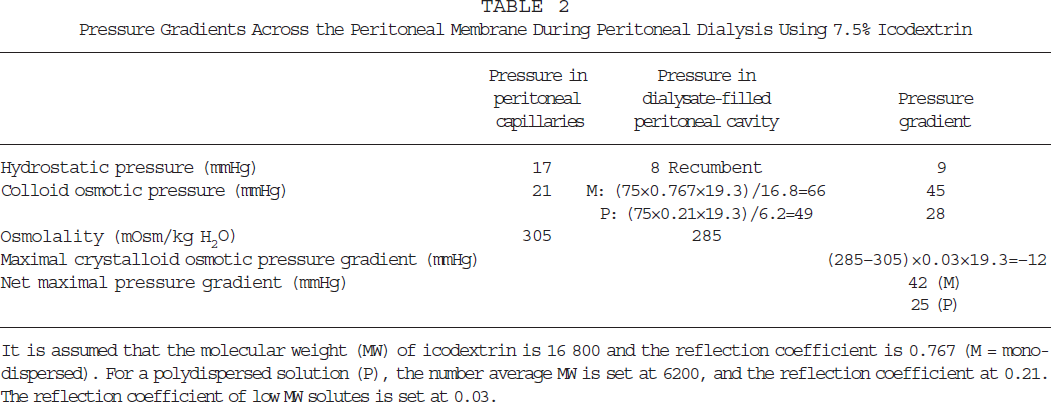
It is assumed that the molecular weight (MW) of icodextrin is 16 800 and the reflection coefficient is 0.767 (M = mono-dispersed). For a polydispersed solution (P), the number average MW is set at 6200, and the reflection coefficient at 0.21. The reflection coefficient of low MW solutes is set at 0.03.
The maximal transcapillary UF values during the first few minutes of an exchange have been reported to average 2.7 mL/min (43) and 4.3 mL/min (4) for dialysate containing 70 mmol/L (1.36%/1.5%) glucose. For 200 mmol/L glucose (3.86%/4.25%), these values average 15 mL/min (25,38,44,45). Mean values for transcapillary UF during 4-hour dwells average 1.0 – 1.2 mL/min for 1.36%/1.5% glucose (25,37,43), and 3.4 mL/min for 3.86%/4.25% glucose (25). The transcapillary UF rate for 7.5% icodextrin is more or less constant during a 4-hour dwell and averages 1.4 – 2.2 mL/min (36,46). Knowledge of pressure gradients and maximum transcapillary UF rates makes it possible to calculate the peritoneal UF coefficient (PUFC), which is the product of the peritoneal surface area and its hydraulic permeability (LpS). This is further explained in Appendix A.
The lymphatic absorption rate from the peritoneal cavity can be measured either as the disappearance rate of intraperitoneally (IP) administered macromolecules (47-49), or as its appearance rate in the circulation (50,51). For the latter, the use of a radioactive-labeled marker, such as iodinated albumin, is required. The disappearance rate overestimates direct absorption into the lymphatics because the tracer is also transported across the mesothelial layer to peritoneal interstitial tissue (52). The appearance rate underestimates lymphatic uptake because only 40% – 50% of the total albumin mass is intravascular (53). The plasma appearance rate shows remarkably little variability (51) and is not influenced by an increased intraperitoneal pressure (54). In contrast, the disappearance rate increases, the greater the instilled dialysate volume (55) and the higher the intraperitoneal pressure (32,54). An effect of position on disappearance rate can be neglected because it is only marginal (56). Interventions aimed at reducing the lymphatic absorption rate, such as with IP phosphatidylcholine (57,58) or with IP hyaluronan (51), especially affect disappearance rate.
When radiolabeled albumin is used as a tracer, both disappearance rate and appearance rate can be measured simultaneously. The difference between the two has been assumed to represent transmesothelial clearance (51). Whatever the mechanism, convective transport of solutes out of the peritoneal cavity is different from that into it, as sieving does not occur because solutes are either transported transmesothelially or taken up directly into the lymphatic system. The contribution of convection to diffusive transport from the peritoneal cavity is relatively small for low molecular weight solutes, but becomes increasingly more important the higher the molecular weight of a solute. The convection/diffusion ratio is about 0.1 for glucose, 1.0 for inulin (59), but 10 for IP administered autologous hemoglobin (60), making the disappearance rate of IP administered macromolecules relatively independent of molecular size (61).
Glucose and Sodium Transport
Diffusion is the dominant transport process for glucose, especially when a hypertonic solution is used. However, the process of glucose transport from dialysate to blood is not very well understood. Recent studies suggested that facilitated glucose transport mediated by glucose transporters might also be involved in this process, although it is not clear to what extent these mesothelial glucose transporters contribute to its transport (62,63). Convection by UF significantly decreases the dialysate glucose concentration by dilution (64). Also, the contribution of peritoneal fluid absorption in the removal of glucose is not negligible because of the very high dialysate glucose concentrations, although its relative contribution is less than that of diffusion.
The dialysate concentration of sodium decreases during the initial phase of a dialysis dwell using hypertonic solutions, followed by a gradual rise (18,38,45,47,65,66). The minimum value is usually reached after 1 – 2 hours. It is likely that this so-called sieving of Na+ is caused by transcellular water transport through ultrasmall pores. However, other mechanisms such as temporal binding of Na+ in the interstitial tissue cannot be excluded with certainty. Water transport rates are high during the initial phase of a hypertonic exchange. Therefore the decrease in dialysate Na+ is a dilutional phenomenon (67). This implies that, during short dwells using hypertonic dialysate, much more water than Na+ is removed from the extracellular volume. This can lead to hypernatremia (16). The gradual rise during the subsequent hours is probably caused by diffusion of Na+ from the circulation.
The MTAC of Na+ is difficult to calculate due to the small differences in dialysate and plasma concentrations. Using 3.86% glucose dialysate, an average value of 4 mL/min has been reported during a period of isovolemia (38,64). This may be an underestimation, due to the small diffusion gradient, because average values of 7 – 8 mL/min have been found using dialysate with a Na+ concentration of 102 – 105 mmol/L (22,68). All these values are markedly lower than those reported for uncharged low molecular weight solutes, such as urea and creatinine. The Na+ concentration in most currently used dialysis fluids is close to or slightly lower than the plasma Na+ concentration, that is, Na+ transport is accomplished almost in the so-called isocratic condition. Therefore, the diffusive transport component plays a minor role in peritoneal Na+ transport, except in patients where a high peritoneal Na+ gradient is present and that have a large vascular surface area. In general however, convection, including UF-induced Na+ transport and transport by peritoneal absorption, dominates Na+ transport (66). Similar mechanisms apply for the transport of calcium (69,70).
Glucose and Na+ Transport in Relation to Peritoneal Permeability Characteristics
Recently, several reports have indicated that the CAPD patient's peritoneal permeability characteristics have a significant impact on clinical outcome, including patient and technique survival (30,71-75). High D/P ratios of low molecular weight solutes were associated with a lower patient survival (30,75). With a detailed evaluation of the peritoneal transport characteristics among the different patient groups, it appeared that high D/P ratios were associated with higher glucose absorption (increased diffusive transport and increased convective transport associated with fluid absorption) and therefore lower fluid and Na+ removal (30).
The Na+ transport pattern differed significantly among different D/P creatinine groups. Patients with high D/P ratios had significantly lower convective Na+ mass transport associated with UF, and significantly higher convective Na+ mass transport associated with fluid absorption, when compared to patients with low D/P ratios (66). Additionally, patients with high D/P ratios had a high sieving coefficient for Na+ and a high D/P Na+ value, suggesting that reduced UF may also be related to a lower number of, or impaired function of water pores in these patients (66). It also appeared that D/P Na+ values, especially during the later part of the dwell (4 – 6 hours) (66), or even a dialysate Na+ concentration at 240 minutes (76) of the dwell using 3.86%/4.25% glucose dialysis solution, could be used to classify patients’ peritoneal permeability characteristics. Further studies are needed to evaluate clinical application.
Peritoneal Transport with Different Fill Volumes
Increasing the dialysate fill volume has recently been recommended for increasing PD efficiency (77). In the range between 2 and 3 L, the instilled volume hardly influences MTACs of low molecular weight solutes (55,78) although lower values have been reported with a 1-L fill volume (78). However, a large volume increases the total mass transfer of solutes by diffusion because saturation of the dialysate will occur at a slower rate due to the larger volume of distribution (55). This also explains why the peritoneal concentration gradient of glucose remains higher with a large instilled volume, despite a greater total glucose mass removal (34,55,79).
A large dialysate fill volume has marked effects on peritoneal fluid kinetics (55,79-81). It increases the transcapillary UF rate (79,80) due to the longer persistence of the glucose gradient. However, the removal rate of fluid from the peritoneal cavity is also higher, due partly to increased lymphatic absorption (55,82) and partly to transmesothelial water transport (79,80). The effect on net UF is therefore dependent on the magnitude of these opposing pathways of peritoneal fluid transport. The application of 1.36%/1.5% glucose dialysate for a comparison between 2- and 3-L volumes in CAPD patients showed lower net UF during the 3-L exchange (55). Increasing the fill volume in rats using 3.86%/4.25% glucose dialysate, however, caused higher net UF rates (79). The clinical impact of increased peritoneal fluid absorption caused by a high fill volume will be most pronounced in CAPD patients with a large surface area because they will also have a high glucose absorption. The effects of increasing the instilled volume will be smaller during automated PD.
A large instilled dialysate volume causes an increase in transcapillary Na+ transport, both by convection (more transcapillary UF and therefore more dilution of Na+ in the dialysate) and by diffusion (a larger volume of distribution and more dilution of Na+ in the dialysate). However, the absorption of Na+ by lymphatic and transmesothelial fluid uptake will also be increased. In a study in rats using 3.86%/4.25% glucose dialysate, the increment in transcapillary transport was larger than that in absorption, leading to a greater peritoneal Na+ removal (79).
Peritoneal Transport during Peritonitis
Peritonitis is associated with several alterations in peritoneal transport, such as increased D/P ratios and MTACs of low molecular weight solutes, increased peritoneal clearances of serum proteins, and decreased net UF (83-89). This leads to a decrease in Na+ removal and an increase in glucose absorption (89). The effect on the total mass transfer of urea and creatinine will be dependent on the balance between increased MTAC and decreased fluid removal. One study reported a fall in UF immediately before the clinical manifestations of peritonitis (90); but during longitudinal follow-up, starting 2 days before peritonitis, no differences in solute clearances were found (91). The decrease in net UF is caused mainly by a rapid disappearance of the osmotic gradient. A contribution of an increased fluid absorption from the peritoneal cavity is equivocal. This has been suggested in a study using autologous hemoglobin as a volume marker (87,92) and also, but to a minor degree, in a study using kinetic modeling of fluid transport (93). However, in a more recent study using dextran 70, no effect of the inflammatory reaction on peritoneal fluid absorption could be established (89). Alterations in peritoneal transport during peritonitis return to normal values within 1 – 2 weeks after recovery from the infection (86,94).
The increase in the transport of all solutes traversing the peritoneal membrane during peritonitis points to an augmentation of the vascular peritoneal surface area induced by the inflammatory process, most probably caused by vasodilation (87,93). This is supported by the high dialysate concentrations of vasoactive inflammatory mediators, such as vasodilating prostaglandins (89,95-97). The hypothesis of a large vascular surface area is also supported by the higher transcapillary UF rate present during the first minute of a dwell during peritonitis (89). This is similar to the increase induced by the IP administration of nitroprusside (89,98).
Failure of the Peritoneal Membrane
“Membrane failure” in PD is not well defined. Usually, impaired transport of water and solutes is implied, but failure of local host defense mechanisms and the development of peritoneal sclerosis are also signs of failure of the peritoneal membrane. The focus of this paper is on failure of peritoneal transport. Impaired transport of water and solutes has been reported as the reason for dropout in 16% of patients from three dialysis populations in which the mean follow-up was 14 months (99), 15 months (100), and 24 months (101). Ultrafiltration failure was reported in half of these patients and inadequate clearances in the other half. However, peritoneal clearances of low molecular weight solutes during a situation of near equilibrium between dialysate and plasma concentrations, such as in CAPD, are mainly determined by the drained volume (102). Consequently, patients with the highest D/P ratios of creatinine may have the lowest peritoneal mass transfer of urea due to small drained volumes (30), as was discussed in more detail in the section on transport of urea and creatinine. The effect of a high D/P creatinine on peritoneal removal of creatinine is variable. Both higher (75) and lower (30) peritoneal clearances have been reported. These contrasting results may be due to differences in the solutions and dwell times that were employed in the two studies: 3.86% glucose for 6 hours (30), and 2.5% glucose for 4 hours (75). Because of the strong relationships between the drained volume and solute transfer, it is likely that ultrafiltration failure (UFF) as a reason for dropout has been underestimated in the above-mentioned epidemiological studies. Also, higher figures for dropout because of UFF are found when the period of follow-up is longer. In the analysis of Kawaguchi et al., UFF was the reason for withdrawal from CAPD in 24% of the total CAPD population, but it was the reason given for 51% of patients who had been treated with CAPD for more than 6 years (103).
It follows from the above data that impaired UF is the most frequent transport abnormality in CAPD. Its prevalence is dependent on duration of treatment. Using a clinical definition, Heimbürger et al. estimated it to be present in 3% of patients after 1 year, but in 31% after 6 years (47). Clinical definitions are subject to bias because overhydration can also occur due to excessive fluid intake or reduced urine production. Using a standardized 4-hour exchange with 3.86%/4.25% glucose, and defining UFF as net UF less than 400 mL/4 hours, a prevalence of 23% was found in a cross-sectional study in patients with a median duration of CAPD of 19 months (range 0.3 – 178 months) (104). A prevalence of 35% was detected in unselected patients treated for more than 4 years in an ongoing multicenter study in The Netherlands using the same definition (unpublished observation). It can be concluded that UFF is an especially important problem in long-term PD patients. It can decrease the clearances of low molecular weight solutes and can lead to overhydration.
Investigations of Ultrafiltration Failure
The presence of UFF is preferably investigated using a standardized 4-hour dwell with a 3.86%/4.25% glucose-based dialysis solution (105). This is justified because net UF with the most hypertonic solution is less subject to confounders, such as incomplete drainage or effects of other pressure gradients, than that obtained with less hypertonic fluids; and because a better estimation of the sieving of Na+ is possible. The use of 3.86%/4.25% glucose does not influence D/P ratios (106) or MTACs (25) compared to a 1.36%/1.5% glucose dialysis solution. Analysis of data from literature on 3.86%/4.25% glucose dialysate suggests that net UF of less than 400 mL/4 hours with this solution can be considered clinically important UFF, although the various studies applied different methodologies (25,47,106,107). For 2.27%/2.5% glucose, net UF less than 100 mL/4 hours (107), and for 1.36%/ 1.5% solutions a value of less than –400 to 500 mL/ 4 hours (37,106), can be considered impaired UF, but the latter are especially subject to interference from other factors.
Permeability to low molecular weight solutes such as urea and creatinine can be expressed as the D/P ratio after 4 hours (24), but also — when the drained volume is taken into account — as the MTAC. Various equations that can be used in clinical practice are discussed in Appendix B. Good correlations have been reported between D/P ratios and MTACs (38,109), but low D/P ratios overestimate the MTAC, while they underestimate it in the high range (37,109). As discussed in the section on the transport of urea and creatinine, D/P ratios and MTACs of low molecular weight solutes can be considered to represent mainly the vascular peritoneal surface area (25).
The transport of glucose can be expressed as the D t /D0 ratio (24) and as its absorption, expressed as a percentage of the instilled quantity (37). Its magnitude is influenced by diffusion and to a lesser extent by fluid removal from the peritoneal cavity. Also for glucose, D t /D0 ratios overestimate glucose absorption in the low ranges and overestimate it in the high ranges (37). The D/P for Na+ should preferably be investigated during a 3.86%/4.25% glucose exchange because this solution provides the best estimation of its sieving. It has not been established whether measurement at 60 minutes (usually the lowest D/P value) (110) or at 240 minutes (best discrimination between the various “transport”/surface-area groups) is most informative (66). Addition of a macromolecular marker to dialysis solution allows one to study fluid kinetics more precisely, but this is too complicated for clinical practice.
Assessment of Aquaporin-Mediated Water Transport
Various indirect methods can be applied in clinical practice to estimate the magnitude of aquaporin-mediated water transport. The sieving of Na+ is the simplest one. It is likely that the dissociation between the transport of Na+ and that of water is caused by aquaporin-mediated water transport. Consequently, the magnitude of the dip in D/P Na+ provides information on channel-mediated water transport. However, in situations of a large vascular surface area, the diffusion of Na+ from the circulation to the dialysate will also increase, thereby blunting the decrease of D/P Na+. Therefore, some correction for diffusion should be considered, especially when the plasma Na+ concentration is markedly higher than the concentration in the dialysis fluid. This can be done using the D/P Na+ during an exchange with 1.36%/1.5% glucose and assuming that convective transport of Na+ is so small that it can be neglected (104). The validity of this diffusion correction in various conditions has to be established in further studies. Furthermore, the method, although simple, is not easily applicable because two tests have to be done. This can be avoided by performing one test with 3.86% glucose dialysate and using the MTAC of urate or creatinine to correct for diffusive transport of Na+ (111).
Another simple way to assess aquaporin-mediated transport is to calculate the difference in net UF obtained after a 4-hour dwell with 1.36%/1.5% glucose and with 3.86%/4.25% glucose dialysate. It follows from the pressures given in Table 1 that 1.36%/1.5% glucose induces only a small crystalloid osmotic pressure gradient, and therefore only limited transport through water channels. Net UF obtained with this dialysate is therefore also very much dependent on the other hydrostatic and colloid osmotic pressure gradients. On the other hand, 3.86%/4.25% glucose induces a very high crystalloid osmotic pressure gradient and the net UF obtained with it is therefore much more dependent on the number and function of water channels. Consequently Δ UF 3.86%/4.25% – 1.36%/1.5% will decrease in situations with impaired aquaporin-mediated water transport. Recently, a correlation was found between aquaporin-mediated water transport assessed by this method and by Na+ sieving, corrected for diffusion (112). Comparison of 3.86%/4.25% glucose with 7.5% icodextrin in individual patients provides another method for the assessment of transcellular water transport (36). This will be discussed in Appendix A.
It can be concluded from the available data that D/P Na+ or ΔNa+ are probably the simplest way for rough assessment of aquaporin-mediated water transport, but that a correction for diffusion should probably be applied when the difference between the plasma and the initial dialysate concentration of Na+ exceeds, for example, 5 mmol/L.
Causes of Ultrafiltration Failure
Verger et al. (113) have proposed two categories of UFF: type 1, associated with intact, and even high, MTACs or D/P ratios of low molecular weight solutes; and type 2, associated with impaired solute transport. It has now become evident that type 2 is rare and found mainly in patients with multiple adhesions. It is possibly present in only a minority of patients with peritoneal sclerosis (114). Low UF is overrepresented in patients with high D/P ratios (30).
In principle, four main causes of UFF can be distinguished: (1) the presence of a large vascular surface area, (2) a decreased osmotic conductance to glucose, (3) the presence of a high disappearance rate of IP administered macromolecules (“lymphatic absorption”), and (4) an extremely small peritoneal surface area (e.g., due to multiple adhesions). Also, combinations of causes are possible, such as (1) and (2) [Refs. (104) and (115)] and (1) and (3) [Ref. (104)]. The effects of the various causes on the time course of the intraperitoneal volume and Na+ sieving will be presented in Appendix C using computer simulations based on the three-pore model.
All studies have shown that the presence of a large vascular surface area is by far the most frequent cause of UFF, especially in long-term patients (47,90,104,107,116). It is likely to be present in more than half of the patients with this condition (47,104). Although a large number of perfused peritoneal capillaries would allow high water transport rates, because a large number of small pores and water channels are available, this effect is counteracted by fast absorption of the osmotic agent, leading to a rapid disappearance of the osmotic gradient.
A decreased osmotic conductance of the peritoneal membrane to glucose (LpS x σ) is another cause of low UF. It can be the result of either a decrease in the PUFC (LpS) or a reduction of σ-glucose, which is determined mainly by the number and function of aquaporins. It is unknown whether a decrease in hydraulic permeability (Lp) of the interstitial peritoneal tissue is an abnormality that can occur during PD. Its existence is not supported by data on solute transport, because the size selectivity of the peritoneum for low molecular weight solutes is not affected by the duration of PD (117). Only for macromolecules was an increased size selectivity found with the duration of PD (117,118). It is also unclear whether a reduced expression of aquaporin-1 exists as a cause of impaired UF. One patient has been described with UFF due to an abolition of transcellular water transfer, but with a normal expression of aquaporin-1 in a peritoneal biopsy (119). This would suggest that structural alterations in aquaporin-1 leading to impairment of its function would be the most important cause of decreased hydraulic permeability. It is evident that more data on this subject are required.
The prevalence of impaired aquaporin-mediated water transport in patients with UFF is unknown. It was reported present in 6 patients with severe UFF with no obvious cause in the PET (110). These patients had almost no sieving of Na+ and a reduced difference in net UF obtained with 3.86%/4.25% glucose and 1.36%/1.5% glucose. In another study in which a diffusion correction was applied for the Na+ gradient, impaired aquaporin-mediated water transport contributed to other causes of UFF in 3 of 8 patients with this condition (104). In an ongoing study, D/P Na+60min without correction for diffusion was 0.903 in 9 patients with net UF less than 400 mL/4 hours with 3.86%/4.25% glucose, which was significantly greater than the value of 0.873 in 15 patients with normal UF. However, the difference disappeared after a diffusion correction was made, using either the MTAC urate or the MTAC creatinine (111).
The duration of PD is likely to affect aquaporin-mediated water transport. Comparing the UF coefficients obtained with 3.86%/4.25% glucose and 7.5% icodextrin, it appeared that a linear relationship was present between the ultrasmall pore UF coefficient and the time on CAPD (36). Also, in patients who developed peritoneal sclerosis, evidence was found for decreasing transcellular water transport, as judged from the difference in net UF between 3.86%/4.25% glucose and 1.36%/1.5% glucose dialysate (114,120). It can be concluded that impaired aquaporin-mediated water transport can contribute to UFF, especially in long-term PD, but more data are necessary to estimate its prevalence.
Impaired net UF due to high water transport rates associated with the disappearance of IP administered macromolecules was found in 2 of the 9 patients with UFF described by Heimbürger et al. (47). Combining previously published results (104) with those of an ongoing multicenter study in The Netherlands, a dextran disappearance rate exceeding 2 mL/minute was found in 7 of 19 patients with UFF (net UF < 400 mL/ 4 hours on 3.86%/4.25% glucose), often in combination with the presence of a large peritoneal surface area. Patients with UFF due to a high disappearance rate of macromolecules had a proportionally increased appearance rate of the macromolecule in plasma (121). Up to now, no evidence has been found that suggests the prevalence of impaired peritoneal fluid removal, caused by high disappearance rates of macromolecules, would increase with the duration of PD. The presence of a small surface area as a cause of a low UF rate is very rare and present only in patients with multiple adhesions and in some patients with peritoneal sclerosis (114,122). No quantitative data are available on the prevalence of UF loss due to an extremely small surface area.
Pathophysiological Mechanisms of Peritoneal Membrane Alterations Leading to UFF in Long-Term PD
Peritonitis causes a reversible loss of UF due to rapid dissipation of the osmotic gradient across the membrane, as discussed in the section on peritoneal transport during peritonitis. The question to what extent peritoneal inflammation is involved in the pathogenesis of established UFF and peritoneal sclerosis is much more difficult to answer. Acute peritonitis causes mesothelial cell damage (123). However, dialysate concentrations of the mesothelial cell mass marker CA125 were not lower than expected after recovery from infection (124,125). Also, no relationship between individual trends in transport and peritonitis incidence was found in a prospective study during a 2-year follow-up (126). This is in accordance with findings in children, where no significant difference in peritonitis incidence was found between those with and those without membrane failure (127). Peritonitis incidence was also not a significant risk factor for the development of peritoneal sclerosis (128,129).
These negative findings do not exclude a contribution of peritonitis to the pathogenesis of membrane failure. The development of UFF associated with high D/P ratios was especially marked in patients with multiple infection episodes in two prospective studies (130,131). This was related to either the severity of the inflammatory reaction (131), the accumulated days of peritoneal inflammation (130), or the microorganism (127). Episodes caused by Pseudomonas and Staphylococcus aureus have been especially implicated (127,131). The majority of patients with peritoneal sclerosis had persistent or relapsing peritonitis in the last few months of PD treatment (129). Candida, Pseudomonas, and S. aureus were cultured most often in these episodes. This supports the hypothesis that these micro-organisms in particular can cause severe peritonitis when an already damaged peritoneum is present, thereby enhancing the progression to overt peritoneal sclerosis.
It emerges from the above data that severe and multiple peritonitis episodes may contribute to the development of membrane failure. However, it is unlikely to be the only or even the most important cause. This is illustrated by the development of membrane failure in long-term patients with no or very few episodes of peritonitis [Ref. (132) and B. Faller, personal communication]. The relationship between the duration of PD and the occurrence of membrane failure suggests that continuous exposure to nonphysiologic dialysis fluids is an important factor. During the past few years an increasing amount of circumstantial evidence has come out of studies in animals and patients, that especially glucose is involved in the development of various alterations in the peritoneal membrane. Glucose was more toxic to mesothelial cells in a chronic animal model than were low pH, lactate, and hyperosmolality (133). In addition, glucose passes the mesothelium easily, exposing all peritoneal tissues to extremely high glucose concentrations. These concentrations are much higher than those normally found in the plasma of patients with diabetes mellitus. This may explain the diabetiform alterations in the peritoneal microvasculature, such as reduplications of the capillary basement membrane (134) and the marked increase in the number of microvessels (135) with deposition of collagen IV (135,136). In a recent study, fibrotic and vascular alterations could be induced in a chronic rat model with daily infusion of 3.86%/4.25% glucose during 20 weeks (137). Infusion of a Ringer's lactate solution caused no peritoneal abnormalities.
Accumulation of advanced glycosylation end-products (AGE) has also been described (138), especially in the vascular walls (139).
The combination of neoangiogenesis with the deposition of extracellular matrix resembles the abnormalities found in diabetic microangiopathy. Vascular endothelial growth factor (VEGF) is the most important growth factor involved in the neoangiogenesis of diabetic retinopathy (140). Similarly, transforming growth factor β (TGFβ) is a key mediator in the extracellular matrix expansion present in diabetic nephropathy (141). It was recently found that dialysate levels of VEGF and TGFβ in CAPD patients exceeded expected concentrations when only transport from the circulation would have occurred (142). Interestingly, VEGF levels were correlated with MTAC creatinine and inversely correlated with the transcapillary UF rate. High dialysate VEGF concentrations resemble the situation in diabetic retinopathy where VEGF in ocular fluid was increased in patients with proliferative diabetic retinopathy (143,144).
Patients with peritoneal sclerosis had a greater cumulative glucose exposure, in a retrospective analysis, than their controls matched for the duration of CAPD (129). All this evidence suggesting an important pathogenetic role for glucose, does not exclude an additive contribution of acidity or of glucose degradation products formed during heat sterilization of dialysis fluids.
In this paper on pathophysiology of peritoneal membrane failure, the peritoneal transport mechanisms of solute and fluid transport have been discussed, followed by the pathophysiological mechanisms and causes of impaired ultrafiltration. Evidence has been presented pointing to diabetiform peritoneal neoangiogenesis as the main, but not the only cause of UFF.
Footnotes
Appendix A
The peritoneal ultrafiltration (UF) coefficient (PUFC) is the product of the hydraulic permeability of the peritoneum (Lp) and the surface area (S). It can be calculated from the maximal transcapillary UF rate (TCUFRmax), as present during the first minute of a dwell, and the overall peritoneal pressure gradient according to the Starling equation
Because LpS is the same in Eqs (A2) and (A3), a value of 0.05 can be calculated for σ of the crystalloids that exert the crystalloid osmotic pressure gradient. In the three-pore model (Appendix C), a value of 0.05 is assumed.
Substituting σ = 0.03 in Eq (A1) yields for 3.86%/ 4.25% glucose
The osmotic conductance (LpS x σ) is
When σ = 0.05 is substituted in Eq (A1) the following is obtained with 3.86%/4.25% glucose:
The osmotic conductance (LpS x σ) is
These examples show very clearly that small differences in σ lead to markedly different values for LpS, but that their effect on the osmotic conductance of the peritoneum is limited. It should be appreciated that the LpS determined with 3.86%/4.25% glucose dialysate is based on fluid transport through the para-cellular pore system and through aquaporins.
The PUFC through the paracellular pore system can be calculated in a similar way using data obtained with 7.5% icodextrin. This is done using the pressures and assumptions for σ given in Table 2:
monodispersed:
When the negative crystalloid osmotic pressure gradient is omitted, because this equilibrates rapidly, LpS will be 0.04 mL/min/mmHg. It should be appreciated that calculation of the osmotic conductance to icodextrin will result in values that are about 10 times higher than those found for glucose-based solutions.
Using LpS through the small pores obtained with icodextrin, the back-filtration rate of dialysis fluid into the capillaries by the colloid osmotic pressure gradient can be estimated:
back-filtration rate monodispersed:
In a previous study using a dialysis solution without an osmotic agent, the overall osmotic back-filtration rate was 0.9 mL/min during a 4-hour dwell (145). It was highest during the start of the dwell (2.6 mL/ min) because the solution was hypotonic to uremic plasma, and averaged 0.4 mL/min during the last 2 hours. A value of about 1 mL/min can be calculated on data from a study using IP 0.9 NaCl (146).
The most probable explanation for the apparent differences for LpS values calculated above using either glucose or icodextrin, while LpS is a membrane property that is constant by definition, is the heteroporosity of the peritoneum. The presence of water channels is especially important in this respect because they represent only a small proportion of the surface area, but contribute largely to water flow induced by crystalloid osmosis. This is illustrated by the following examples that are based on a contribution of the aquaporin pathway to total LpS of 2%. This figure has been used in computer simulations based on the three-pore model. Despite the small contribution by aquaporins to total peritoneal LpS, a very large proportion of the osmotic force is exerted across this pathway. This is because the osmotic force is composed of the fractional LpS values (across paracellular pores and aquaporins), each multiplied by the solute reflection coefficient across each pore system.
For glucose the following calculation can be made, assuming a reflection coefficient of 1.0 across aquaporins and 0.03 across the paracellular pores. The partial osmotic forces are as follows:
aquaporins: 0.02 × LpS × 1.0
paracellular pores: 0.98 × LpS × 0.03 = 0.0294 × LpS.
The fractional osmotic force across aquaporins now becomes:
Thus 40% of the water flow will initially occur through aquaporins.
A similar calculation can be made for icodextrin, assuming a reflection coefficient of 1.0 across the aquaporins and 0.767 across the paracellular pores. The partial osmotic forces are as follows:
aquaporins: 0.02 × LpS × 1.0
paracellular pores: 0.28 × LpS × 0.767 = 0.7517 × LpS.
The fractional osmotic force across aquaporins now becomes
Well-functioning aquaporins are assumed in the above calculations. However, malfunction of these water channels may contribute to UFF in long-term PD patients. The contribution of aquaporin-mediated water transport to total transcapillary UF can be estimated in individual patients by comparing their initial UF rates during a study with 3.86%/4.25% glucose and one during 7.5% icodextrin. From these values and the transperitoneal pressure gradient, PUFC can be calculated for glucose and for icodextrin. PUFCglucose is determined by water transport through the paracellular and the transcellular pores, while PUFCico represents mainly paracellular water transport. Subtraction of PUFCico from PUFCglucose therefore gives the PUFC through the water channels. Using this approach in stable CAPD patients it appeared that aquaporin-mediated water transport contributed to over-all water transport by 50%, on the average (36). This value is similar to that obtained using computer simulations of the three-pore model, but the range among individual patients appeared very wide. The lowest values for transcellular water transport were found in long-term CAPD patients (36).
Appendix B
The MTAC of a solute is the maximum theoretical clearance by diffusion at time zero of a dwell, that is, before any transport of that solute has occurred. In clinical practice, the MTAC can be calculated easily when either the Henderson and Nolph equation (147) or the simplified Garred equation (148) is used. The Henderson and Nolph equation can be written as:
In these equations VD is the drained volume, t is the dwell time (240 minutes), V0 is the instilled dialysate volume, P is the plasma concentration, D0 is the dialysate concentration before inflow (important for creatinine because of glucose interference), and D
t
is the dialysate concentration at the end of the dwell, normally determined in the dialysate after drainage. The plasma concentrations of urea and creatinine should be expressed per plasma water (64), using a correction factor of 1.05 for example. Several more complicated equations can be applied, but these require the use of an IP administered macromolecular tracer. In the Waniewski formula a factor F is used to correct for convective transport (149,150); it can range from 0.5 to 0.33, the latter being especially justified for situations with high transcapillary UF rates:
Equation (A4) is especially appropriate during a period of relative isovolemia (152), such as when 1.36%/ 1.5% glucose dialysate is used. Equation (A5) is preferably used when 3.86%/4.25% glucose is employed. The differences between Eqs (A5) and (A6) are not clinically important for the calculation of MTAC (25,149,150).
Appendix C
In this Appendix, computer simulations of intraperitoneal volume and dialysate Na+ concentration will be presented for the different causes of UFF. These simulations are based on the three-pore model. In this model, an abundance of aquaporins (12-14), water-conductive “ultrasmall” pores (radius approximately 3 – 5 Å) in the plasmalemma, rejecting solute transport, play an important role in peritoneal osmotic water transport and solute sieving. For high glucose concentrations in the dialysis fluid, the three-pore model predicts approximately one half of transperitoneal UF will occur through aquaporins, whereas the other half is modeled to occur through small pores (3). The membrane factors that determine UFF in CAPD patients are the permeability surface area product (PS or MTAC) of the osmotic agent, the membrane UF coefficient (LpS), and the reflection coefficient (σ) of the osmotic agent in the membrane (105). For a small solute, the latter is critically dependent on the fraction (α) of the hydraulic conductance accounted for by the aquaporins, here denoted αc. Actually, in the absence of aquaporins, the reflection coefficient to glucose (σg) would be 0.03 instead of 0.05, which is the value predicted for the three-pore membrane (αc = 0.02). The initial rate of UF occurring during a single dwell is highly dependent on the product of the LpS and σg, and also on the transperitoneal glucose concentration gradient; while PS for glucose, which determines the rate of glucose removal from the peritoneal cavity, influences the cumulative amount of UF volume obtained during the first few hours of a dwell. A high PS (MTAC) for glucose, or a low mass of intraperitoneal glucose (due to, e.g., a low intraperitoneal volume) will thus reduce the UF volume as well as the time to the peak of the UF curve (tpeak) (5).
According to pore theory, four major causes of UFF can be distinguished based on their etiologies: (1) UFF due to an enlarged “effective” vascular surface area, (2) UFF due to a reduced osmotic conductance to glucose (LpS σg), (3) UFF due to increases in fluid (and macromolecule) absorption from the peritoneal cavity, and (4) UFF due to an extremely small vascular surface area due to multiple adhesions.
In the following section, computer modeling outputs will be presented consistent with these different kinds of UFF based on the three-pore model. The technique for this computer simulation has been presented earlier (3-5,42). The specific parameters used to simulate control conditions for 3.86%/4.25% glucose are shown in Table 3. Note that the parameters used in this table are not always identical to those described in Appendix A.
Acknowledgments
The studies performed by the authors and discussed in this paper were supported by the Dutch Kidney Foundation (Nierstichting Nederland), by the Swedish Medical Research Council (grant 08285), by grants from the Inga-Britt and Arne Lundberg Foundation, and by Baxter Healthcare. Kirstin Wikborg and Marion A. Zeeman are gratefully acknowledged for the skilful preparation of the manuscript.