
Abstract
Objective
To evaluate and compare the effects of glucose-based solutions to those of icodextrin with respect to peritoneal transport characteristics and formation of advanced glycosylation end-products (AGEs) in the peritoneal membrane in the diabetic rat model of peritoneal dialysis (PD).
Study Design
Thirty-three male Sprague–Dawley rats weighing between 275 – 300 g were divided into 5 groups: group C (n = 6), control rats with catheter but not dialyzed; group D (n = 5), diabetic rats with catheter but not dialyzed; group G (n = 7), diabetic rats dialyzed with standard 2.5% glucose solution for daytime exchanges and 4.25% glucose solution for the overnight exchange; group H (n = 8), diabetic rats dialyzed with standard 2.5% glucose solution for daytime exchanges and 7.5% icodextrin solution for overnight exchanges; group I (n = 7), diabetic rats dialyzed with 7.5% icodextrin solution for all exchanges. Dialysis exchanges were performed three times daily with an instillation volume of 25 mL per exchange for a period of 12 weeks. Tissue sections were stained using a monoclonal anti-AGE antibody. One-hour peritoneal equilibration tests (PET) were performed every 4 weeks for comparison of transport characteristics.
Results
The level of immunostaining was lowest in group C and highest in group G. Significant differences were seen between group C and groups G, H, and I (p < 0.001, p = 0.001, and p < 0.05 respectively). Significant differences were also found between group G and groups D and I (p < 0.05 and p < 0.05 respectively). Over time, glucose concentration at the end of an exchange versus concentration at instillation (D/D0 glucose) decreased and dialysate-to-plasma ratio (D/P) of urea increased. Significant differences were found between groups C and H for D/D0 glucose (0.40 ± 0.01 vs 0.35 ± 0.01, p < 0.05); and between groups C and H for D/P urea (0.87 ± 0.03 vs 0.97 ± 0.02, p < 0.05).
Conclusions
These results suggest that AGE formation is lower with the use of peritoneal dialysis solution containing icodextrin than with glucose-based solutions. We conclude that the use of icodextrin may be helpful in slowing the deterioration of the peritoneal membrane, prolonging its use for dialysis.
Icodextrin is a starch-derived glucose polymer with an average molecular weight of 16,200 Da and chain lengths varying between 4 and 250 glucose units. A 7.5% icodextrin-based dialysis solution has an osmolality of 284 mOsm/kg and a pH of 5.3 (6). Potentially, the iso-osmolar icodextrin solution should be less damaging to the peritoneum and to local host defense as compared with hyperosmolar glucose solutions. Icodextrin has a “colloid-induced” osmotic convective transport as compared with the “crystalloid osmosis” of glucose-based solutions. Icodextrin solution provides sustained ultrafiltration over long dwell times of 8 – 12 hours in CAPD (7) and up to 16 hours in automated peritoneal dialysis (8). Due to these properties, icodextrin can be considered a suitable alternative to glucose-based solutions in the treatment of patients with ultrafiltration failure (9).
Glycosylation refers to a non enzymatic process in which reducing sugars covalently bond to molecules that contain free amino groups, such as peptides and proteins. In vivo the prominent sugar involved is glucose, and the rate of glycosylation depends primarily on glucose concentration. The carbonyl group of an open-chain glucose molecule reacts with an amino group to form an unstable, reversible Schiff base intermediate. The Schiff base may then undergo an Amadori rearrangement to form a stable ketoamine (Amadori product). This reaction reaches equilibrium in approximately 28 days (10). Over a period of months, the Amadori product subsequently undergoes further chemical reactions involving oxidation, dehydration, cyclization, rearrangement, and condensation with other reactive amino groups to form advanced glycosylation end-products (AGEs), which irreversibly bind to protein (11).
Advanced glycosylation end-products are a heterogeneous group of compounds characterized by (a) the ability to polymerize proteins; (b) a fluorescent spectrum; and (c) a yellow-brown color (hence the term “browning reaction”). Once the initial glycosylation reaction has occurred, polymerization and cross-linking continue even in the absence of glucose (12).
The main sites of AGE cross-linking are the long-lived structural proteins such as those found in the tissue matrix and basement membranes. Tissue concentration of AGEs increases naturally with aging and has been shown to be accelerated in patients with diabetes mellitus as a consequence of hyperglycemia. Elevated serum concentrations of deoxyglucosones— which are reactive intermediates in AGE formation— have been detected in diabetic patients (13,14) and in patients on dialysis (15).
Advanced glycosylation end-products have been implicated in the pathogenesis of some of the secondary complications of diabetes (16), especially vascular disease. Effects of AGEs may also be mediated through interaction with receptors on endothelial, smooth muscle, mesangial, and inflammatory cells, among others (17). Increased serum AGEs have been shown to contribute to the accelerated vascular dysfunction associated with uremia and diabetes (18,19).
The formation of AGEs in diabetes has been proposed to result in cross-linking of collagen and distortion of subcellular structures, resulting in irreversible tissue damage to peripheral nerves, the macrovasculature, and the microvasculature (20,21). Prolonged exposure to the glucose-based dialysis fluids currently in use results in production and deposition of AGEs in the subendothelial area of the peritoneum and microvascular changes similar to those seen in diabetic patients. The final result is the loss of peritoneal function.
Several in vivo and in vitro studies have demonstrated that glucose-based solutions result in higher AGE formation as compared with icodextrin-based solutions. In vivo studies on the formation of AGEs are limited to retina, nerve, aorta, and glomerulus (10,22). Long-term peritoneal dialysis comparing icodextrin with glucose in regard to the formation of AGEs in an animal model have not been done. The present study was performed to compare, in vivo, in the rat model of peritoneal dialysis, the effects of glucose-based solutions to those of icodextrin-based solutions with respect to AGE formation in the peritoneal membrane and to the effect upon peritoneal transport characteristics.
Materials and Methods
Animals
The study was performed on 42 male Sprague-Dawley rats weighing between 275 g and 300 g. The rats were randomly divided into 5 groups:
group C (n = 6), control with catheter but no dialysis;
group D (n = 6), diabetic rats with catheter but no dialysis;
group G (n = 10), diabetic rats dialyzed with standard 2.5% glucose solution (Dianeal: Baxter Healthcare Corporation, Deerfield, IL, U.S.A.) for daytime exchanges (0800 hr, 1400 hr) and 4.25% glucose solution for the overnight exchange (2200 hr);
group H (n = 10), diabetic rats dialyzed with standard 2.5% glucose solution for daytime exchanges and 7.5% icodextrin solution (Extraneal: Baxter Healthcare SA, Castlebar, Ireland) for the overnight exchange;
group I (n = 10), diabetic rats dialyzed with 7.5% icodextrin solution for all exchanges.
Before completion of the study, 1 animal in group D, 3 animals in groups G and I, and 2 animals in group H died owing to nonfunctional catheters, leaving 33 animals for analysis.
Induction of Diabetes
Diabetes was induced using streptozotocin (Sigma, St. Louis, MO, U.S.A.) 65 mg/kg dissolved in citrate buffer (0.1 mol/L, pH 4.5). The streptozotocin was injected into the tail vein under methoxyflurane anesthesia (Metofane: Pitman-Moore Inc., Madison, NJ, U.S.A.) in all groups except group C (control). Diabetic rats with serum glucose greater than 500 mg/dL were given regular insulin (0.5 - 2 units) subcutaneously twice daily to maintain a serum glucose level between 250 - 500 mg/dL.
Catheter Implantation
The animal was placed in a large jar and anesthetized with methoxyflurane. Anesthesia was then maintained by nose cone. The abdomen and the back of the neck were shaved and disinfected with Amukin (Amuchina SpA, Genoa, Italy). The area was then covered with Tegaderm (3M Corporation, St. Paul, MN, U.S.A.).
An incision was made in the skin along the mid-line 1 cm below the xiphoid process and extending vertically approximately 2 cm. The peritoneal cavity was penetrated by blunt dissection 0.5 cm below the xiphoid. The tip of the catheter was advanced into the cavity and secured with a single stitch through the cuff material and the superficial muscle layer. The procedure was performed carefully to avoid bleeding and trauma to the peritoneum. The opening into the peritoneal cavity was just large enough to allow the catheter to be pushed through such that the catheter fit snugly. With the use of a 3 mm trocar, the other end of the catheter was tunneled subcutaneously to a point between the animal's scapulae. The trocar was then pushed through the skin, and the catheter pulled through the tunnel. The second cuff was located approximately 0.5 – 1.0 cm from the exit site. The catheter was trimmed, leaving 1.5 – 2.0 cm exposed. The catheter was then capped.
The animal was then allowed to wake, was placed in its cage, and was allowed free access to food and water. Rats were given a single dose of bupremorphine subcutaneously for analgesia with additional doses as needed. This therapy was continued for a period of 72 hours after surgery if necessary.
When a catheter malfunctioned owing to omental wrapping, that catheter was left in place, and a second catheter was implanted contra-laterally using the same technique.
Dialysis Exchange
Dialysis was started on the first postoperative day, with the instillation volume gradually being increased from 15 mL to 25 mL. Prophylactic antibiotics (vancomycin 125 mg/L and gentamicin 32 mg/L) were given intraperitoneally in the solution until the fifth postoperative day. The prophylactic antibiotics were changed every 5 days thereafter in this sequence: gentamicin 8 mg/L; vancomycin 25 mg/L; ciprofloxacin 25 mg/L; ceftazidime 125 mg/L; sulfamethoxazole–trimethoprim 200 mg/L and 40 mg/L respectively. Dialysis exchanges were performed three times daily at 0800 hr, 1400 hr, and 2200 hr, seven days per week for three months.
Peritonitis
Samples for culture were collected once weekly, before instillation of the morning dialysis solution. Diagnosis of peritonitis was based solely on the culture results (more than 10 colonies in a blood agar plate) because no accepted definition of peritonitis has been established for rats. The infection was treated according to the sensitivity-test result.
Peritoneal Membrane Function and Blood Tests
Peritoneal membrane function was assessed on day 8 and at 1 month, 2 months, and 3 months by a 1-hour peritoneal equilibration test (PET) using 1.5% glucose solution. A 1.5% glucose solution was used for the overnight exchange preceding the PET.
At time 0, 25 mL of dialysis solution was instilled. At 1 hour, the animal was anesthetized, and a sample of dialysate was taken for measurement of urea nitrogen, creatinine, glucose. Immediately thereafter a blood sample (2 mL) was taken by direct cardiac puncture for measurement of urea nitrogen, creatinine, glucose, lipid profile, and hematocrit. In cases of peritonitis, the test was deferred until cultures were negative.
Peritoneal membrane transport rate was assessed by dialysate-to-plasma ratio (D/P) of urea nitrogen and D/D0 glucose, where D is the glucose concentration in dialysate after the 1-hour dwell, and D0 is the glucose concentration in the dialysis solution before infusion into the peritoneal cavity. High levels of D/P urea and low levels of D/D0 glucose indicate high transport.
Weight
All animals were weighed at the time of induction of diabetes and before the morning dialysis exchange on day 8 and at 1, 2, and 3 months.
Histologic Analysis
All animals were humanely killed during the 12th week, and specimens for histologic examination were obtained. Peritoneal tissues were obtained from these locations: a loop of gut with mesentery, abdominal wall, diaphragm, and surface of liver. The peritoneal membrane was evaluated by gross inspection and light microscopy. Gomori trichrome stain was used to detect collagen deposition (fibrosis) in the peritoneal membrane. This procedure differentially stains connective tissue elements as follows: collagen, green; muscle tissue, red; and nuclei, blue to black.
Immunohistochemical Analysis
At the end of the study, the animals were anesthetized and trans-cardially perfused with phosphate-buffered saline (PBS) followed by 4% paraformaldehyde. Isolated tissues were put into 30% sucrose solution. The tissues were then rapidly frozen with isopentane (2-methylbutane) in liquid nitrogen. Frozen tissue sections were cut sequentially at a 10 μm thickness and thaw-mounted onto slides.
Immunostaining of AGEs in peritoneal tissue sections was conducted using the streptoavidin– biotinylated peroxidase complex method. The sections were washed three times with PBS. Endogenous peroxidase activity was blocked by incubating the sections with 0.3% H2O2 at room temperature for 30 minutes. The sections were washed with PBS and incubated with normal goat serum in PBS at room temperature for 2 hours. After the normal goat serum was removed, the sections were incubated in a humid chamber at room temperature overnight with anti-AGE mouse monoclonal antibody (Dojindo Laboratories, Tokyo, Japan) diluted 100x in PBS. The sections were washed with PBS and incubated with secondary antibody, biotinylated anti-mouse immunoglobulin G [(IgG) Vector Laboratories, Burlingame, CA, U.S.A.], at room temperature for 1 hour. After being washed three times with PBS, the sections were incubated with streptoavidin peroxidase complex (Vector Laboratories) at room temperature for 30 minutes. After being washed three times with PBS, the reaction was completed by the addition of diaminobenzidine for 15 minutes. After being washed with PBS, the slides were counterstained with hematoxylin. Control staining without primary antibody was performed on 2 sections in each group to ascertain that no antibody was present in the tissues.
The slides were read by 5 separate examiners in a blinded fashion and staining intensity was graded semi-quantitatively from 0 to 3, where 0 represented no staining, 1 represented weak staining, 2 represented moderate staining, and 3 represented strong staining.
Statistical Analysis
Data are presented as mean ± standard error of mean (SEM). Statistical analysis of values at various time points among the groups were assessed by oneway analysis of variance (ANOVA), with Tukey correction for multiple comparisons, using the software SigmaStat 2.0 for Windows (SPSS Inc., Chicago, IL, U.S.A.). Differences were considered significant at p < 0.05.
Results
Immunohistochemical Detection of Ages in Peritoneal Membrane
Immunohistochemical staining showed that AGE accumulation was minimal or absent in group C [Figure 1(a)].
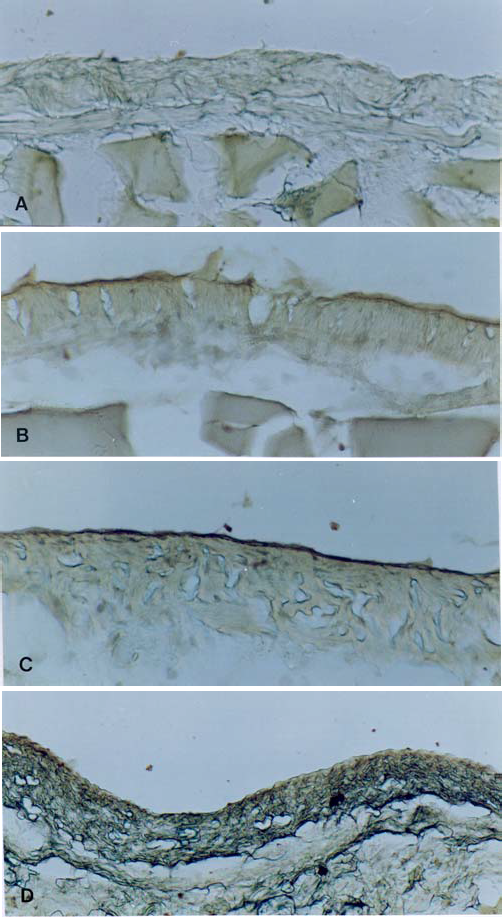
Immunohistochemical staining for advanced glycosylation end-products (AGEs) in the peritoneal membrane. Staining was minimal or absent in group C (A), weak in group I (B), moderate in group H (C), and strong in group G (D).
In group D, the intensity of staining of the mesothelial layers ranged from very weak to moderate. On the other hand, staining of the vascular wall was weak to moderately positive in all cases. In interstitial and connective tissues, AGEs were not found.
In group G, the mesothelial layers showed a consistent staining pattern ranging from moderate to strong. Staining of the vascular wall was moderately to strongly positive in all cases. No AGEs were found in interstitial or connective tissues [Figure 1(d)].
In group H, the mesothelial layers were stained in varying degrees of intensity ranging from weak to moderate. Staining of the vascular wall was moderately to strongly positive in all cases. In interstitial and connective tissues, AGEs were not found [Figure 1(c)].
In group I, the mesothelial layers showed inconsistent staining patterns ranging from weak to moderate. Staining of the vascular wall was also weakly to moderately positive in all cases. No AGEs were found in interstitial and connective tissues [Figure 1(b)].
Figure 2 shows the scores for AGE staining in the various groups. The immunostaining grade was lowest in group C and highest in group G. Significant differences were seen in comparisons of group C (0.08 ± 0.08) with group G (2.27 ± 0.28, p < 0.001), with group H (1.72 ± 0.19, p < 0.001), and with group I (1.26 ± 0.21, p = 0.008); group G (2.27 ± 0.28) with group D (1.12 ± 0.29, p = 0.016) and with group I (1.26 ± 0.21, p < 0.05); and group C with group D (p < 0.05). A strong correlation was noted between serum glucose concentration and AGE stain score (r = 0.894, Figure 3).
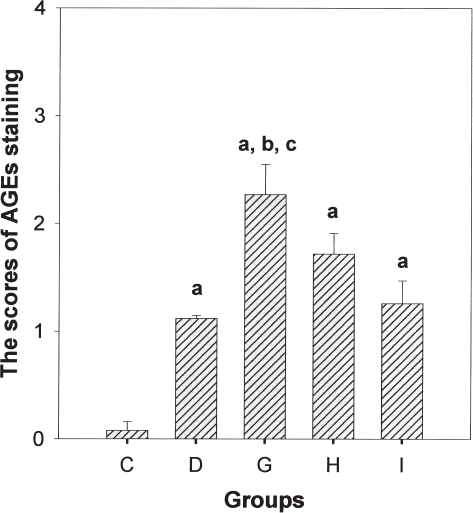
Semiquantitative scoring of advanced glycation end-product immunohistology. a p < 0.05 (group C vs group D), p < 0.001 (group C vs group G), p < 0.001 (group C vs group H), p = 0.008 (group C vs. group I). b p = 0.016 (group D vs group G). c p < 0.05 (group G vs group I).
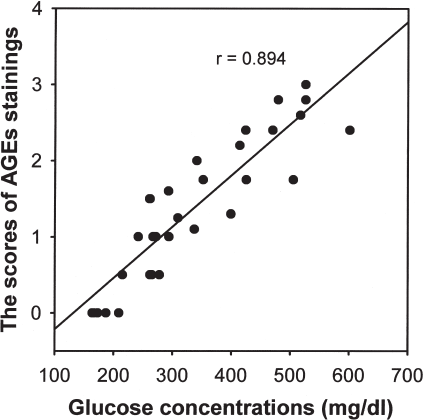
Relationship between advanced glycation end-product stain scores and serum glucose concentrations.
Peritoneal Equilibration Test
Table 1 shows changes in D/D0 glucose over time. A tendency to decreased D/D0 glucose over time was noted. Group H had higher permeability as compared with other groups. Significant differences in D/D0 were seen between group C (0.40 ± 0.01) and group H (0.35 ± 0.01, p < 0.05). Group H had higher permeability than groups G and I, but the difference was statistically nonsignificant.
Changes in D/D0 Glucose
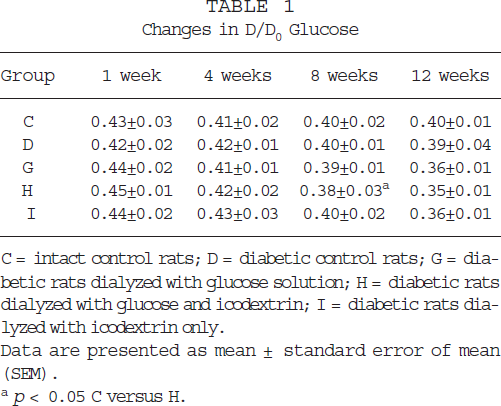
C = intact control rats; D = diabetic control rats; G = diabetic rats dialyzed with glucose solution; H = diabetic rats dialyzed with glucose and icodextrin; I = diabetic rats dialyzed with icodextrin only.
Data are presented as mean ± standard error of mean (SEM).
p < 0.05 C versus H.
Table 2 shows changes in D/P urea over time. A tendency to increased D/P urea was noted. Group H had higher permeability as compared with other groups. Significant differences were seen between group C (0.87 ± 0.03) and group H (0.97 ± 0.02, p < 0.05). Group H had higher permeability than groups G and I, but the difference was statistically nonsignificant.
Changes in D/P Urea
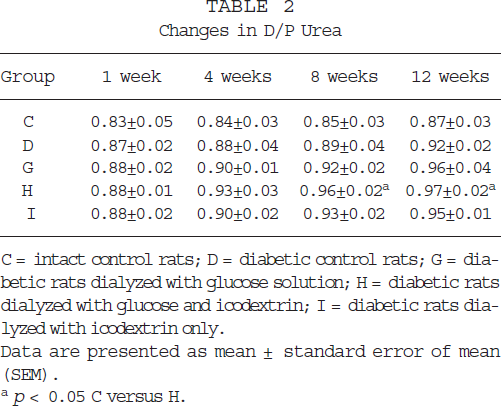
C = intact control rats; D = diabetic control rats; G = diabetic rats dialyzed with glucose solution; H = diabetic rats dialyzed with glucose and icodextrin; I = diabetic rats dialyzed with icodextrin only.
Data are presented as mean ± standard error of mean (SEM).
p < 0.05 C versus H.
Peritonitis Episodes
The incidence of peritonitis was greatest in group G, at 0.25 episodes/rat–month. Group H experienced 0.14 episodes/rat–month, and group I, 0.11 episodes/rat–month.
Body Weight
Table 3 shows changes in weight over time. The baseline weight of the rats was approximately 304 g. Weight tended to increase in all the groups over time. Significant differences were seen between group C and groups G, H, and I (4 weeks: p = 0.001, p < 0.001, and p = 0.003 respectively; 8 weeks: p < 0.001, p < 0.001, and p < 0.001 respectively; 12 weeks: p < 0.001, p = 0.001, and p < 0.05, respectively). Diabetic rats (groups D, G, H, and I) gained less weight than did non diabetic rats (p < 0.05). Control rats (groups C and D) gained more weight than rats on dialysis (groups G, H, and I; p < 0.05). Rats in group I gained more weight than rats in groups G and H, but the difference was statistically nonsignificant.
Changes in Body Weight (g)
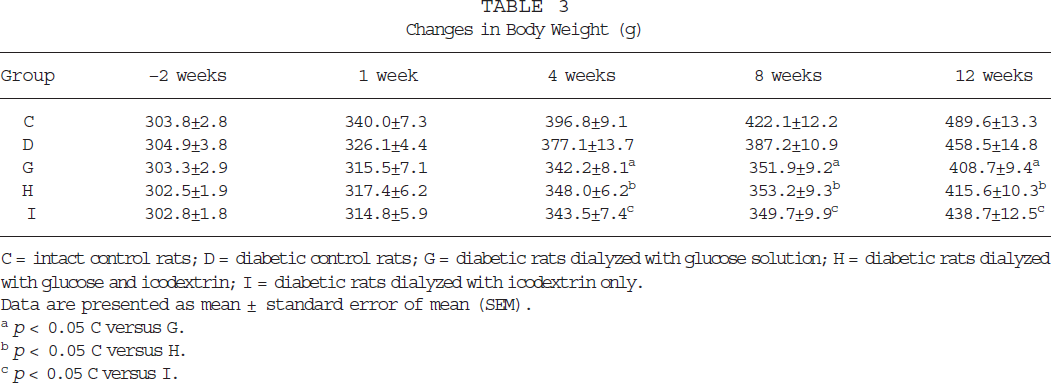
C = intact control rats; D = diabetic control rats; G = diabetic rats dialyzed with glucose solution; H = diabetic rats dialyzed with glucose and icodextrin; I = diabetic rats dialyzed with icodextrin only.
Data are presented as mean ± standard error of mean (SEM).
p < 0.05 C versus G.
p < 0.05 C versus H.
p < 0.05 C versus I.
Blood Tests
Table 4 shows changes in serum glucose levels over time. Serum glucose levels were maintained between 250 mg/dL and 500 mg/dL. At 1 week, non diabetic rats (group C) had lower serum glucose levels than diabetic rats (groups D, G, H, and I; p < 0.001, p < 0.001, p < 0.001, and p < 0.001, respectively). Significant differences in serum glucose were seen between group C and groups G, H, and I (p < 0.001, p < 0.001, and p < 0.05) at 4 weeks. At 8 weeks, significant differences were seen between group C and groups G, H, and I (p < 0.001, p < 0.001, and p < 0.05), as well as between group D and group G (p < 0.05). At 8 weeks, the serum glucose level in group I was lower than that in groups G and H, but the difference was statistically nonsignificant. Significant differences were seen between group G and group C at 12 weeks (p < 0.05).
Changes in Serum Glucose Levels (mg/dL) after Injection of Streptozotocin
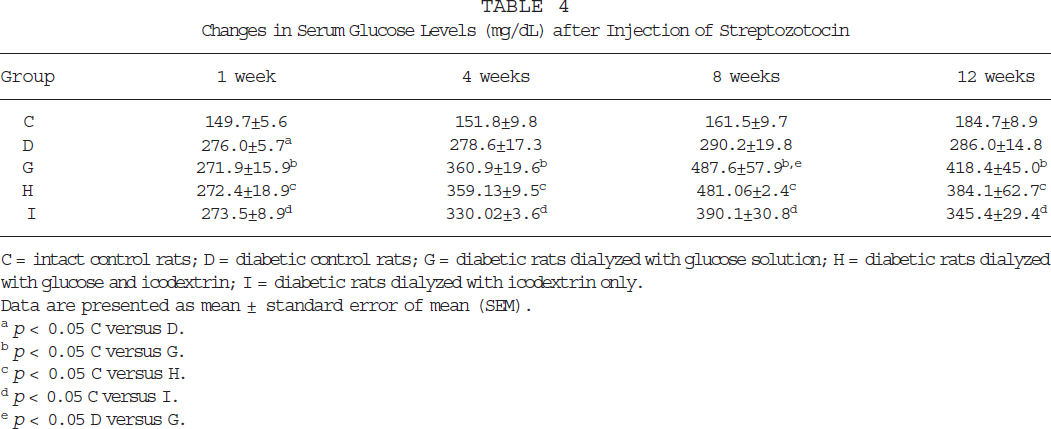
C = intact control rats; D = diabetic control rats; G = diabetic rats dialyzed with glucose solution; H = diabetic rats dialyzed with glucose and icodextrin; I = diabetic rats dialyzed with icodextrin only.
Data are presented as mean ± standard error of mean (SEM).
p < 0.05 C versus D.
p < 0.05 C versus G.
p < 0.05 C versus H.
p < 0.05 C versus I.
p < 0.05 D versus G.
With regard to change in total cholesterol over time, group G showed higher levels of serum cholesterol as compared with the other groups. Significant differences were seen between groups C and G (p < 0.05).
With regard to change in serum triglycerides over time, group G had higher levels of serum triglycerides as compared with the other groups. Significant differences were seen between group G and groups D and C (p < 0.05 and p < 0.05, respectively).
Gross Findings on Study Termination
In groups C and D, the catheters were completely covered by fibrous tissue with severe adhesions, but the abdominal wall and mesentery were clear. In group G, two catheters were completely covered by fibrous tissue with severe adhesions. The other catheters were covered by fibrous tissue with some adhesions. In two rats, second catheters were moderately covered by fibrous tissue as compared with the first catheters in these rats. The abdominal wall in two rats and the mesentery in one rat revealed slightly whitish, patchy lesions.
Two catheters in group H were completely covered by fibrous tissue with severe adhesions; all other catheters were covered by fibrous tissue with some adhesions. Two second catheters were moderately covered by fibrous tissue as compared with the first catheters. The abdominal walls of these two rats revealed slightly whitish, patchy lesions, but the mesentery was relatively clear.
In group I, one catheter was partially covered by fibrous tissue with severe adhesions; the other catheters were covered by fibrous tissue with some adhesions. The sole second catheter in this group was moderately covered by fibrous tissue as compared with the first catheter. In one rat, the abdominal wall revealed slightly whitish, patchy lesions, but the mesentery was relatively clear.
Histological Findings
Collagen deposition in the peritoneal membrane was not seen in groups C and D, except that 1 animal in group D had mild fibrous tissue in the hepatic visceral peritoneum. All sections in group G had mild-to-moderate fibrous tissue in the hepatic visceral peritoneum; mild fibrosis was noticed in the mesentery of 2 rats from this group. In group H, 5 of 8 sections had mild-to-moderate fibrous tissue in the hepatic visceral peritoneum. In group I, 3 of 7 sections had mild fibrous tissue in the hepatic visceral peritoneum.
Discussion
The results of this study show that (a) AGE accumulation in the peritoneal tissue accorded with the concentration of glucose in the peritoneal dialysis fluid; (b) permeability to small solutes increased in rats dialyzed with solution containing glucose; (c) serum glucose levels increased substantially in rats dialyzed with solution containing glucose as compared with rats dialyzed with icodextrin.
Several in vitro and ex vivo studies have demonstrated that glycosylation and AGE formation occurs with use of conventional glucose-containing solutions (22,23). It has been established that the rate of glycosylation is related to the concentration of glucose in dialysis fluid and that it also depends on other components of the fluid. An understanding of the chemistry and factors involved in AGE formation in glucose-based solution has also been established (24). In this study, AGE accumulation was seen in all diabetic rats to degrees that varied in relation to the type of dialysis solution used. The AGE formation in the icodextrin group (group I) was expected to be equivalent to the AGE formation in group D, but the trend showed an increase in AGE accumulation in group I as compared with group D. Even in the control group, one rat showed a small AGE accumulation in one section.
Information on glycosylation and AGE formation under physiological conditions in the presence of glucose polymers and their final breakdown product, maltose, is scarce. Recently reported in vitro studies have shown a time- and concentration-dependent increase in human serum albumin glycosylation (50 mmol/L phosphate buffer, pH 7.4) with maltose, icodextrin, and glucose (25). The glycosylation rate was comparable for equimolar maltose and icodextrin, and twofold to threefold lower than with equimolar glucose. The glycosylation rate with the standard strength of icodextrin used in peritoneal dialysate (7.5%, 13.2 mmol/L) was more than tenfold lower than the rate with the lowest glucose concentration used (1.36%, 75 mmol/L). These findings accord with the present study.
Loss of ultrafiltration is typically associated with increased permeability to small solutes such as creatinine (26). This observation could be explained if AGE formation occurred in the peritoneal membrane, resulting in increased permeability to solutes. Increased permeability might occur owing to vascular effects or to basement membrane thickening, analogous to the situation in diabetes (27). It is also possible that modification of collagen in the submesothelial interstitium by AGEs might diminish diffusion resistance to small solutes and account for a more pronounced increase in permeability to small solutes than to macromolecules (28).
In the present study, rats dialyzed with glucose-based solution had significantly higher permeability to small solutes such as glucose and urea as compared with the control groups. A tendency to increased permeability as compared to the icodextrin group was also seen. Cross-linking of basement membrane components by AGEs such as laminin and heparin sulfate proteoglycan or type IV collagen disturbs the integration of the basement membrane (29,30), increasing vascular permeability. On other hand, the vascular endothelium has AGE receptors. Deposition of AGEs on the receptors is reported to induce an increase in permeability of the vascular wall (31). In the present study, AGE staining was evident in the vascular walls in all rats except those in group C. Accordingly, the accumulation of AGEs in the vascular walls of these rats might possibly play a role in the increased peritoneal permeability shown.
Monitoring changes in body weight over time is a useful way of assessing the general condition of experimental rats. Our rats gained weight throughout the study. These results suggest that the most of rats were in good condition. Chronic dialysis with glucose solution is associated with various metabolic disadvantages, especially obesity (32). In the present study, diabetic rats gained less weight as compared with non diabetic rats. Rats on dialysis gained less weight than rats not on dialysis. These results suggest that diabetes and dialysis concomitantly induced a stress that resulted in a lesser weight gain.
Prolonged exposure to non physiologic dialysis solutions results in certain inevitable morphologic changes, mainly peritoneal fibrosis (33). Morphologic analysis of the peritoneal membrane was introduced as a useful way of assessing peritoneal fibrosis (34). Our results showed that the group using hyperosmolar glucose solution had more episodes of peritonitis. The fibrous tissue covering the catheters of rats dialyzed with glucose solution was thicker and showed more adhesion to the abdominal wall as compared with other groups. In addition, whitish, fibrotic, patchy lesions were comparatively more frequent in rats dialyzed with glucose-based solution. These clinical observations showed that dialysis with higher concentrations of glucose resulted in more peritonitis episodes and was more irritating to the peritoneal membrane, producing peritoneal fibrosis and catheter blockage.
Maltose and related fractions neither affect glucose metabolism nor lead to hyperinsulinemia (6). Furthermore, the lack of hyperglycemia and hyperinsulinemia associated with icodextrin as compared with glucose may offer some long-term metabolic advantages and possibly simplify management of diabetic patients (6). A favorable impact on lipid profile is possible. Cholesterol levels were lower in the icodextrin group as compared to the glucose-based groups in the present study, but the differences did not reach statistical significance. However, the serum glucose levels also increased in the icodextrin group in this study, though not to the extent shown in glucose-based group.
In a previous study, Wens et al (35) demonstrated that overestimation of glucose in the blood of patients treated with icodextrin is probably related to the presence of oligosaccharides (mainly maltose), derivatives of glucose polymers present in Extraneal, and absorbed via the peritoneal route. A similar finding in the present study accords with this hypothesis, and suggests that the increase in serum glucose levels in the icodextrin group can be attributed to breakdown products such as maltose.
Conclusions
The present study demonstrates that AGE accumulation in the peritoneal tissues was lower in rats dialyzed with icodextrin as compared with those dialyzed with glucose-based solutions. Formation of AGEs might have a role in the increased permeability to small solutes seen in PD.
Pharmacological intervention may inhibit or reduce AGE formation. Such intervention may be assessed by using immunocytochemical quantification with validated monoclonal antibodies to AGE products against tissue exposed for a sufficient period of time to icodextrin dialysate in experimental animals. Eventually, study of the pharmacological, mechanistic, and morphological effects of peritoneal membrane exposure to various compounds may provide insights into new therapeutic strategies to prevent the deterioration of peritoneal function during PD.
Footnotes
Acknowledgments
The authors wish to express their gratitude to J.T. Cunningham of the Department of Physiology and Dalton Cardiovascular Research Center, University of Missouri, for technical assistance with internal fixation and cryosection of animal tissues. The authors also gratefully acknowledge Carol S. Okamura of the Department of Veterinary Medicine and Surgery, Dalton Cardiovascular Research Center, University of Missouri, for technical assistance with immunohistochemical staining.